New Europeans. Fieldwork : March 2010 April 2010 Publication: April 2011
|
|
|
- Ginger Booker
- 6 years ago
- Views:
Transcription
 This")
1 Special Eurobarometer European Commission New Europeans Report Fieldwork : March 2010 April 2010 Publication: April 2011 Special Eurobarometer 346 / Wave TNS Opinion & Social This survey was requested by the Directorate General for Employment, Social Affairs and Equal Opportunities and coordinated by the Directorate-General for Communication ( Research and Speechwriting" Unit) This document does not represent the point of view of the European Commission. The interpretations and opinions contained in it are solely those of the authors.
2 Eurobarometer NEW EUROPEANS CONDUCTED BY TNS OPINION & SOCIAL ON REQUEST OF DIRECTORATE GENERAL FOR EMPLOYMENT, SOCIAL AFFAIRS AND EQUAL OPPORTUNITIES SURVEY CO-ORDINATED BY DIRECTORATE GENERAL FOR COMMUNICATION ( RESEARCH AND SPEECHWRITING" UNIT) TNS Opinion & Social Avenue Herrmann Debroux, Bruxelles Belgique
3 SPECIAL EUROBAROMETER 346 NEW EUROPEANS TABLE OF CONTENTS INTRODUCTION... 3 EXECUTIVE SUMMARY 'NEW EUROPEANS' IN THE EU: DIFFERENT TYPES OF CONNECTEDNESS WITH OTHER COUNTRIES Connectedness through family background Place of birth of respondents Place of birth of respondents parents Place of birth of respondents grandparents Citizenship of respondents grandparents Personal links with other countries Close friends living abroad Friends who come from abroad Close relatives living abroad Partner of a different nationality Personal experiences in other countries Work experience Study experience Other reasons for temporarily living abroad Owning real property Socio-cultural links with other countries Food Follow news, cultural life and sports Foreign language skills Holidays and weekends PLANS TO MOVE TO ANOTHER COUNTRY Inclination to emigrate within ten years Countries of preference
4 SPECIAL EUROBAROMETER 346 NEW EUROPEANS 3. ATTACHMENT AND FEELINGS OF BELONGING Attachment to other countries Reasons for attachment to other countries Holidays and weekends Close friends Close relatives Other reasons for attachment to another country Different levels of attachment: city, region, country and EU Attachment to city, town or village Attachment to region Attachment to respondents own country Attachment to the EU Comparison of attachment: own country versus other countries Belonging to a group Feelings of belonging to a group Reasons for belonging to a group Language or accent Culture values and lifestyle IDENTITY National identity European identity Elements of European identity Importance of European identity CONCLUSION
5 SPECIAL EUROBAROMETER 346 NEW EUROPEANS INTRODUCTION The population in the European Union Member States is becoming increasingly diverse as a result of people moving across borders. More and more Europeans have connections not just with the country they live in. Against the background of European cohesion within a wider EU and of international migration patterns, a special interest emerged in 'New Europeans': people who live in the EU and have connections with more countries than just the country where they live (whether this is another Member State, a European country outside the EU, or a non- European country). Connectedness is a broad, rich concept; it can take several forms, objective or subjective. In this report we use the term 'New Europeans' to contrast them with 'Old Europeans': the latter are EU citizens who have no special connection with any country other than their own. Of course, the terms 'New and Old Europeans' as used in this report have nothing to do with 'old' and 'new' Member States (i.e. those that joined the EU since 2004). The cross-border connectedness (where it exists) is multifaceted and therefore we should not reduce it into a yes-or-no issue. The challenge is to find ways to study these varying degrees of connectedness, while taking into account the fact that this may involve diverse and complex connections. The Directorate General of Employment, Social Affairs and Equal Opportunities of the European Commission has commissioned this Eurobarometer survey to gain insight into peoples connectedness to other countries. The challenge in this research was to identify these 'New Europeans': who are they, where can we find them? They tend to be hidden in the existing data sources and include children of migrants, mixed couples, international students, retirement migrants and expats. However, the Eurobarometer is an opinion survey and despite the substantial sample of around 27,500 respondents per wave, it is not a census and therefore not suitable for demographic statistical purposes. In this respect any opinion survey has its limitations. A brief analysis of the nationality and the mother tongue of the respondents may illustrate this limitation. The proportion of respondents in this survey who hold a nationality other than that of the country where they live (dual or single nationality) varies from low (4% to 8% in eight countries) to extremely low (1% to 3% in thirteen countries) or close to zero (in five countries, all new Member States 1 ). The only exception is Luxembourg, where 34% of 1 Countries that have joined the EU since
6 SPECIAL EUROBAROMETER 346 NEW EUROPEANS the respondents hold a non-luxembourg nationality (or another nationality in addition to Luxembourg citizenship). Accordingly, we examined the mother tongue of those surveyed. In all 27 EU Member States, there are respondents with a mother tongue other than the official national language(s) of the country they live in. Again, these proportions vary from extremely low (1% to 3% in six countries) or low (4% to 7% in nine countries) to noticeable (8% to 17% in ten countries) or substantial, though this is only the case in two countries (26% in Luxembourg and 29% in Latvia). In short, the examination of the proportion of respondents who hold a nationality and/or speak a mother tongue other than that of their country of residence reveals that these groups are small, and can therefore yield only a limited picture of the cross-border connectedness of people living in the EU. A further limitation arises from the target population of the Eurobarometer: European citizens aged fifteen years or older. This means that it does not involve younger citizens, nor does it include residents without EU citizenship. Nevertheless, in spite of these limitations, the survey provides reliable indications of the diverse population in Europe and of the strength of their connectedness across the borders of the country in which they live. Building analytical variables: Two key analytical variables were constructed in order to enrich the analysis, and especially to see how far the type of connection with other countries may influence respondents opinions and attitudes on the different issues tackled in the survey. The first variable reflects respondents ancestry or roots in other countries and the second their openness to other countries. Using these indices, three groups of respondents can be distinguished: 'New Europeans by ancestry' They have a migrant background, that is, at least one parent or grandparent originates from a country other than the interviewee s country of residence and not all of their four grandparents held citizenship of this country at birth (15% of the sample). 'New European by openness' These are people who developed strong ties to a country other than their country of residence. This can be so for four different reasons: they have worked or studied in another country for some time, or have a partner from another country, or they may own property abroad (20% of the sample). 4
7 SPECIAL EUROBAROMETER 346 NEW EUROPEANS 'Old Europeans' Old Europeans have roots only in the country where their parents and grandparents were born. Moreover, when their grandparents were born, all four were citizens of the country where the respondent was interviewed. They are Europeans citizens as a consequence of their country being or becoming a Member State of the EU. Moreover, they have no links with other countries, in the sense that they have neither worked nor studied in another country, they have never lived with a partner from another country, and they do not own property abroad (64% of the sample). In this report, we compare the answers from respondents who are 'New Europeans by openness' from those who are not in this category: we will name the latter 'respondents not open to other countries'. Similarly, we compare the answers from respondents who are 'New Europeans by ancestry' from those who are not in this category: we will name the latter 'respondents without foreign descent'. Note that the two groups of 'New Europeans' (by ancestry and by openness) partly overlap. A respondent with ancestral roots in another country may also, for example, have property in that other country, or may have studied there. Nevertheless, in this report, answers from each of the three groups 'New Europeans by ancestry', 'New Europeans by openness' and 'Old Europeans' will be separately analysed as a whole, in order to have a clear view of the possible different influences of active openness (as defined by choices) on the one hand and passive ancestry (as defined by facts) on the other. If we consider only the exclusive groups, we then have four categories of respondents: 'New Europeans by openness alone' (11% of the sample), 'New Europeans by ancestry alone' (8% of the sample), 'Old Europeans' (64% of the sample), and a group of unclassifiable respondents who didn t answer some questions (don t know) or presenting mixed characteristics (for instance, being 'New Europeans' by openness and by ancestry). This last group represents 17% of the total sample. In this report, answers of those who are 'New Europeans by ancestry alone' or 'New Europeans by openness alone', are also analysed. 5
8 SPECIAL EUROBAROMETER 346 NEW EUROPEANS Four different types of connectedness: Cross-country connectedness is, as mentioned above, a broad concept. For deeper analysis of and insight into European connectedness, the following four different types will be identified in this report. Family background Respondents place of birth and that of their parents and grandparents, supplemented with the citizenship of their grandparents at birth. Personal links Respondents personal relationships with other people who live abroad or come from abroad: close friends, brothers, sisters, children, parents and/or a partner they live or have lived with. Personal experience Respondents own experience of living in another country in the past because of work, education or owning property. Socio-cultural links This can take various forms, such as a preference for foreign cuisine, an interest in news, cultural life or sports of another country, spending leisure time abroad or having foreign language skills. 6
9 SPECIAL EUROBAROMETER 346 NEW EUROPEANS This report is divided into four parts. The first part discusses the four types of connectedness mentioned above. The second part examines respondents plans to move to another country and how this relates to issues of ancestry and openness. The third part focuses on respondents attachment to these other countries as compared with the country where they live and on respondents feelings of belonging to a group. Reasons for the attachment and different geographical levels of attachment are discussed, as well as reasons for belonging to a group. The fourth and final part of this report deals with the determinants and elements of national and European identity. ***** The findings of this survey are analysed firstly at EU level and then country-by-country. Socio-demographic variables such as respondents gender, age, education and occupation, are used to provide additional analysis. In addition, we use the variables described above to distinguish between different types of Europeans (New-by-openness, New-by-ancestry and Old) for further analysis. The survey was commissioned by the European Commission s Directorate General (DG) for Employment, Social Affairs and Equal Opportunities and coordinated by the Directorate-General for Communication. It was carried out by TNS Opinion & Social network between 12 March and 1 April The methodology used is that of Eurobarometer surveys as carried out by European Commission s Directorate-General for Communication ( Public Opinion and Speechwriting unit). A technical note on the manner in which interviews were conducted by the Institutes within the TNS Opinion & Social network is attached as an annex to this report. This note indicates the interview methods and the confidence intervals. The Eurobarometer web site can be consulted at the following address: We would like to take the opportunity to thank all the respondents across the European Union who gave their time to take part in this survey. Without their active participation, this study would simply not have been possible. 7
10 SPECIAL EUROBAROMETER 346 NEW EUROPEANS In this report, the countries are represented by their official abbreviations. The abbreviations used in this report correspond to: ABBREVIATIONS EU27 European Union 27 Member States /NA Don t know / No answer BE BG CZ D-E DE D-W EE EL ES FR IE IT CY LT LV LU HU MT NL AT PL PT RO SI SK FI SE UK Belgium Bulgaria Czech Republic Denmark East Germany Germany West Germany Estonia Greece Spain France Ireland Italy Republic of Cyprus Lithuania Latvia Luxembourg Hungary Malta The Netherlands Austria Poland Portugal Romania Slovenia Slovakia Finland Sweden The United Kingdom 8
11 SPECIAL EUROBAROMETER 346 NEW EUROPEANS Executive Summary Different types of connectedness to other countries Foreign ancestry is the most obvious type of connectedness to another country, but is not very common; more than 85% of Europeans were themselves born, or have parents or grandparents who were born in their country of residence. Similarly, eight out of ten Europeans have all four grandparents born as citizens of their country of residence. Personal relationships with people from or in other countries are widespread. Four in ten Europeans have close friends living in another country; more than a quarter have close friends who came from abroad and/or close relatives brothers, sisters, children, parents who live abroad. Personal experiences abroad are less widespread but significant. Almost one in eight Europeans have worked abroad, one in twelve studied abroad, and one in ten stayed abroad for three consecutive months or longer for other reasons. Socio-cultural links with other countries are widespread. More than a third of Europeans regularly eat food typical of another country, follow news, cultural life or sports from another country, are fluent in at least one foreign language, or regularly spend holidays or weekends abroad, that is, in a country other than the country of residence. Expecting to emigrate within ten years More than one in ten Europeans envisage to move to another country within the next ten years, half of them to another EU Member State. New Europeans are more likely to move abroad, particularly 'New Europeans by openness': one in five compared to only one in twenty 'Old Europeans'. Feelings of attachment and belonging Around one in two Europeans feel an attachment to at least one country other than their country of residence. 'New Europeans' are far more likely to feel attached to another country than their country of residence than 'Old Europeans'. This attachment to a specific country other than their country of residence seems to reflect historical-cultural similarities (language) or mere geographical proximity. The top three reasons for attachment to another country are: regularly spending holidays and weekends there, followed by having close relatives there (both in particular for 'New Europeans by ancestry'), and having close friends who live there (especially for 'New Europeans by openness'). Europeans attachment to their own country (of residence) is far stronger than that to their favoured other countries. This is true even for New Europeans. 9
12 SPECIAL EUROBAROMETER 346 NEW EUROPEANS Turning to feelings of belonging to a group, seven in ten Europeans feel they belong to a majority group and almost one in ten feel they belong to a minority group. When it comes to how Europeans feel they are perceived by others, their answers are comparable. 'New Europeans by ancestry' are more likely to feel belonging to a minority group. Identity For Europeans, the most important element of national identity is to be born in their country (though less so for 'New Europeans'). 'New Europeans by openness alone' most often mention the sharing of cultural traditions and feeling national as important aspects of national identity, whereas 'New Europeans by ancestry alone' think so of mastering the national language of their country of residence. The leading elements of European identity are clearly the euro and democratic values. Six in ten Europeans say that being European is important to them, the same as in spring There are no significant differences between 'Old and New Europeans' as regards European identity, the only exception being that 'New Europeans' - by openness and by ancestry - consider democratic values to be more important than 'Old Europeans' do. 10
13 SPECIAL EUROBAROMETER 346 NEW EUROPEANS 1. 'NEW EUROPEANS' IN THE EU: DIFFERENT TYPES OF CONNECTEDNESS WITH OTHER COUNTRIES People can have connectedness to countries other than the country where they live through various links. Connectedness can involve subjective and emotional reasons as well as more objective matters, such as education or work. Therefore, connectedness is measured in different ways in the survey reported here. Respondents family ties abroad are analyzed first, followed by other personal links, their personal experiences in other countries and, finally, by socio-cultural links Connectedness through family background Respondents were asked about the places of birth of themselves, their parents and their grandparents: whether they were born in the country where they live, another EU country, another non-eu country in Europe or another country outside Europe 2. More than nine out of ten Europeans were born in the country of interview, and eight out of ten have all four grandparents born with the citizenship of the country of interview. This means that connection to other countries through family background applies to only small proportions of Europeans. 2 QB4 I am now going to ask you some questions about where you and your family were born. QB4.1 You were born in QB4.2 Your mother was born in QB4.3 Your father was born in QB4.4 Your grandmother on your mother s side was born in QB4.5 Your grandfather on your mother s side was born in QB4.6 Your grandmother on your father s side was born in QB4.7 Your grandfather on your father s side was born in 11

 or outside")
14 SPECIAL EUROBAROMETER 346 NEW EUROPEANS Country-by-country analysis shows that Luxembourg stands out clearly as the country with the highest number of respondents who have parents or grandparents born in another country, mainly in other EU Member States. Austria, Germany, France and the UK follow with the same pattern. The UK, however, has more respondents with grandparents born outside Europe (mostly in Asia). Two Baltic States, Latvia and Estonia, have the highest number of respondents with parents or grandparents born in a European country that is not a EU Member State (most likely Russia) or outside Europe. Socio-demographic analysis reveals a general pattern as regards age, education and urbanisation: the younger the respondents, the more likely they are to have foreign roots. Similarly, those who are highly educated and those who live in large towns are more likely to be of foreign descent. 12
15 SPECIAL EUROBAROMETER 346 NEW EUROPEANS Place of birth of respondents The most obvious type of connection a person can have with another country is a priori by being born in another country. The vast majority of respondents (93%) are born in the country where they live 3. A small minority (7%) of interviewees were born abroad: 4% said that they were born in another EU Member State 4, and just 1% in a non-eu country in Europe, including Turkey. Finally, a small percentage (2%) of respondents were born outside Europe Country-by-country analysis shows that the highest percentages of respondents who were born in a country other than their country of residence are found in Luxembourg (35%, by far the highest percentage), Germany (13%), Spain and the United Kingdom (both 12%), Belgium and Ireland (both 11%). All these countries, except Spain, have been EU Member States since 1973 or before. Countries with (almost) no respondents born elsewhere are Bulgaria and Romania (each 0%), Hungary and Poland (each 1%), Czech Republic and Slovakia (each 2%), Italy and Malta (each 3%). 3 (OUR COUNTRY) or a place that is part of (OUR COUNTRY) today. 4 Another country that is today a member of the EU. 13
16 SPECIAL EUROBAROMETER 346 NEW EUROPEANS QB4 I am now going to ask you some questions about where you and your family were born. You were born in (OUR COUNTRY) or a place that is part of (OUR COUNTRY) today Another country that is today a member of the EU Another country outside Europe EU27 BE BG CZ DE EE IE EL ES FR IT CY LV LT LU HU MT NL AT PL PT RO SI SK FI SE UK 93% 4% 3% 89% 5% 2% 100% 0% 0% 98% 2% 0% 94% 3% 1% 87% 7% 3% 94% 1% 3% 89% 10% 0% 94% 3% 2% 88% 5% 1% 95% 2% 0% 97% 2% 1% 93% 4% 0% 94% 1% 4% 96% 1% 2% 65% 31% 2% 99% 1% 0% 97% 2% 0% 93% 2% 0% 91% 6% 2% 99% 1% 0% 96% 1% 1% 100% 0% 0% 91% 1% 7% 98% 2% 0% 96% 1% 2% 91% 5% 1% 88% 5% 0% Highest percentage per country Highest percentage per item Lowest percentage per country Lowest percentage per item 14
17 SPECIAL EUROBAROMETER 346 NEW EUROPEANS Socio-demographic analysis reveals that some differences exist by age, education, subjective urbanisation and occupation. Respondents in the age category are more likely to have been born abroad (10%) than those in the group (6%) or the (7%) and 55+ (5%) groups. Those educated for longest, till age 20 or beyond, are more likely to have been born abroad (10%) than those who finished school between 16 and 19 (7%) or at age 15 or younger (6%). Inhabitants of large towns are more likely to have been born abroad (11%) than those who live in a small or mid-sized town (6%) or a rural village (5%). As to occupation, slightly higher percentages of respondents who were born abroad are found among manual workers and the unemployed (each 10%). QB4.1 I am now going to ask you some questions about where you and your family were born. You were born in (OUR COUNTRY) or a place that is part of (OUR COUNTRY) today Total "Abroad" EU27 93% 7% Age % 6% % 10% % 7% % 5% Education (End of) 15-94% 6% % 7% % 10% Still studying 94% 6% Subjective urbanisation Rural village 95% 5% Small/mid size town 94% 6% Large town 89% 11% Respondent occupation scale Self- employed 93% 7% Managers 94% 6% Other white collars 94% 6% Manual workers 90% 10% House persons 92% 8% Unemployed 90% 10% Retired 95% 5% Students 94% 6% *Total abroad is the sum of the following items: Another country that is today a member of the EU; Another country in Europe, including Turkey, but not a member of the EU; USA, Canada, Japan, Australia or New Zealand; Another country outside Europe In addition, it is interesting to identify those with a migrant background. For that purpose, respondents were asked to indicate where their parents and grandparents were born. 15
18 SPECIAL EUROBAROMETER 346 NEW EUROPEANS Place of birth of respondents parents Like the proportion of respondents born in another country, the proportion of respondents of foreign origin through their parents is also small. About one in ten respondents have at least one parent who was born in a country other than the respondent s country of residence. 5% of respondents had parents who were born in another EU Member State 5 and 2% in a non-eu country in Europe, including Turkey (these results apply to both fathers and mothers). In addition, 3% of respondents mothers and 4% of their fathers were born in a country outside Europe. 5 Meaning another country that is a Member of the EU today. 16
19 SPECIAL EUROBAROMETER 346 NEW EUROPEANS QB4 I am now going to ask you some questions about where you and your family were born. Your mother was born in Your father was born in (OUR COUNTRY) or a place that is part of (OUR COUNTRY) today Another country that is today a member of the EU Another country outside Europe (OUR COUNTRY) or a place that is part of (OUR COUNTRY) today Another country that is today a member of the EU Another country outside Europe EU27 BE BG CZ DE EE IE EL ES FR IT CY LV LT LU HU MT NL AT PL PT RO SI SK FI SE UK 90% 5% 5% 89% 5% 6% 85% 8% 2% 83% 9% 3% 98% 1% 1% 99% 1% 0% 95% 5% 0% 95% 4% 0% 92% 5% 1% 93% 4% 1% 82% 10% 4% 81% 11% 4% 85% 3% 7% 83% 4% 7% 90% 9% 0% 90% 9% 0% 89% 3% 6% 90% 3% 6% 88% 5% 0% 88% 5% 0% 87% 7% 1% 85% 8% 0% 98% 1% 1% 98% 1% 1% 94% 3% 1% 94% 3% 1% 84% 4% 8% 82% 3% 9% 92% 2% 3% 90% 2% 3% 52% 43% 2% 56% 38% 3% 97% 2% 1% 97% 3% 0% 95% 3% 0% 97% 2% 0% 92% 3% 0% 93% 2% 1% 85% 10% 4% 85% 10% 3% 98% 1% 1% 97% 1% 2% 96% 1% 0% 96% 1% 0% 99% 0% 1% 99% 0% 1% 87% 2% 10% 85% 2% 11% 96% 4% 0% 95% 4% 1% 94% 1% 3% 94% 0% 4% 87% 9% 2% 88% 7% 2% 84% 6% 1% 84% 6% 1% Highest percentage per country Highest percentage per item Lowest percentage per country Lowest percentage per item Country-by-country analysis reveals that again Luxembourg stands out, with almost half of respondents having a mother (48%) and/or father (44%) born in another country. Other countries with relatively high numbers of respondents with at least one parent born abroad are Germany (18% and 19% for mothers and fathers respectively), the United Kingdom (16% each), Latvia (16% and 17%), Austria (15% each), Belgium (15% and 17%) and Estonia (15% and 16%). Countries in which the fewest respondents have a parent born abroad are Romania (1% both for mothers and fathers), Bulgaria (2% and 1% respectively), Italy (2% both), Poland (2% and 3%) and Hungary (both 3%). 17
20 SPECIAL EUROBAROMETER 346 NEW EUROPEANS QB4.2-3 I am now going to ask you some questions about where you and your family were born. Your mother was born in Your father was born in (OUR COUNTRY) or a place that is part of (OUR COUNTRY) today Total "Abroad" (OUR COUNTRY) or a place that is part of (OUR COUNTRY) today Total "Abroad" EU27 90% 10% 89% 11% Age % 11% 87% 13% % 13% 87% 13% % 9% 90% 10% % 8% 92% 7% Education (End of) 15-92% 8% 91% 9% % 9% 90% 9% % 13% 86% 14% Still studying 89% 11% 88% 12% Subjective urbanisation Rural village 93% 7% 93% 7% Small/mid size town 91% 9% 90% 10% Large town 85% 15% 83% 17% *Total abroad is the sum of the following items : Another country that is today a member of the EU; Another country in Europe, including Turkey, but not a member of the EU; USA, Canada, Japan, Australia or New Zealand; Another country outside Europe Socio-demographic analysis reveals that age, education and subjective urbanisation have an influence on the results. The age cohort yields the highest proportions of mothers and fathers (13% both) born abroad compared to the 8% and 7% for the oldest respondents, aged 55 and over. Those who were educated up to or beyond age 20 are more likely to have a mother (13%) or father (14%) born in another country than respondents who had left school at 15 (8% for mothers and 9% for fathers). As for urbanisation, those living in large towns are more likely to have foreign mothers (15%) or fathers (17%) than rural dwellers (7% each for mothers and fathers). 18
21 SPECIAL EUROBAROMETER 346 NEW EUROPEANS Place of birth of respondents grandparents 12% of respondents have their grandfather on their father s side that was born abroad. The same proportion of Europeans have their grandfather on their mother s side that was born abroad. A closer look at the places of birth of both paternal and maternal grandfathers shows that 7% were born in another EU Member State, 2% in a non-eu country in Europe including Turkey and 3% outside Europe. Figures for maternal grandmothers are identical. Paternal grandmothers, however, show a comparable but slightly different pattern; compared to the three other grandparents (paternal grandfather, maternal grandfather and maternal grandmother), fewer were born in another EU Member State (6%) and more were born outside Europe (4%). Country-by-country analysis reveals that the largest proportions of respondents with all four grandparents born abroad are found in Luxembourg (39%), Slovenia (15%), the United Kingdom (12%), Austria (11%), Belgium (11%), Germany (11%) and Latvia (10%). The smallest proportions of interviewees with all four grandparents born abroad are found in Romania, Bulgaria and Malta (all 1%), Italy, Portugal, Hungary and Finland (all 2%). For each of the four types of grandparent, we observe the same pattern: Luxembourg stands out (around half for each grandparents). In Luxembourg, the high frequency of foreign grandparents seems mainly to be the result of immigration from France and Portugal 6. In Austria and two of the Baltic States - Latvia and Estonia - historical reasons may play a role: these countries experienced border changes in the course of three generations. In Austria, the majority of respondents foreign grandparents were born in a current EU Member State, probably Germany. In the two Baltic States, they were born in a non-eu European country, probably Russia. Socio-demographic analysis yielded a similar pattern for all four types of grandparents by age, education and subjective urbanisation. The likelihood that a respondent has a grandparent born abroad is higher if the respondent is younger (14% to 16% of those aged compared to 9% of those aged 55+), more highly educated (15% of those who studied until the age of 20 or beyond compared to 9-10% of those who left school at 15 or before), and lives in a larger town (18% of those who inhabit a large town compared to 9% of those who live in a rural village figures are for all four grandparents). 6 In our survey, 12% of the respondents interviewed in Luxembourg have Luxembourg citizenship, 7% French citizenship (Q1). See also: 19
22 SPECIAL EUROBAROMETER 346 NEW EUROPEANS QB4 I am now going to ask you some questions about where you and your family were born. Your grandmother on your mother s side was born in Your grandfather on your mother s side was born in Y our grandmother on your father s side was born in Y our grandfather on your father s side was born in (OUR COUNTRY) or a place that is part of (OUR COUNTRY) today Another country that is today a member of the EU Another country outside Europe (OUR COUNTRY) or a place that is part of (OUR COUNTRY) today Another country that is today a member of the EU Another country outside Europe (OUR COUNTRY) or a place that is part of (OUR COUNTRY) today Another country that is today a member of the EU Another country outside Europe (OUR COUNTRY) or a place that is part of (OUR COUNTRY) today Another country that is today a member of the EU Another country outside Europe EU27 87% 7% 5% 86% 7% 5% 86% 6% 6% 86% 7% 5% BE 82% 10% 8% 82% 10% 8% 81% 10% 8% 81% 9% 9% BG 97% 1% 1% 97% 2% 1% 97% 2% 1% 97% 2% 1% CZ 90% 8% 0% 91% 7% 0% 89% 7% 0% 89% 7% 1% 88% 8% 3% 89% 7% 3% 88% 7% 3% 89% 6% 3% DE 79% 12% 7% 78% 12% 8% 77% 12% 8% 76% 12% 8% EE 81% 4% 13% 79% 4% 13% 75% 6% 14% 75% 5% 14% IE 90% 9% 1% 90% 9% 1% 90% 8% 2% 90% 9% 1% EL 83% 3% 13% 83% 3% 13% 83% 3% 13% 83% 2% 14% ES 89% 5% 6% 89% 5% 6% 88% 5% 7% 89% 5% 6% FR 80% 11% 7% 79% 12% 6% 78% 12% 6% 78% 12% 6% IT 98% 1% 1% 97% 1% 2% 98% 1% 1% 98% 1% 1% CY 94% 3% 3% 95% 3% 2% 94% 3% 3% 94% 3% 3% LV 74% 6% 15% 75% 5% 14% 71% 4% 16% 68% 5% 16% LT 89% 2% 7% 89% 2% 7% 87% 3% 7% 87% 3% 7% LU 46% 47% 5% 45% 48% 5% 48% 44% 6% 49% 43% 6% HU 94% 4% 1% 94% 4% 1% 94% 4% 1% 93% 5% 1% MT 95% 4% 1% 95% 4% 1% 96% 4% 0% 96% 3% 0% NL 89% 5% 6% 91% 4% 4% 90% 5% 4% 91% 4% 4% AT 77% 14% 5% 75% 15% 5% 76% 13% 5% 74% 14% 6% PL 93% 2% 3% 92% 2% 2% 92% 2% 3% 92% 2% 2% PT 96% 1% 3% 96% 1% 3% 96% 1% 2% 97% 1% 2% RO 98% 1% 1% 98% 1% 1% 98% 1% 1% 98% 0% 1% SI 85% 3% 11% 83% 4% 12% 84% 3% 12% 84% 3% 12% SK 93% 6% 0% 93% 6% 0% 93% 5% 0% 92% 5% 1% FI 91% 1% 8% 90% 1% 8% 92% 1% 6% 91% 1% 7% SE 84% 11% 5% 83% 12% 4% 84% 10% 5% 84% 9% 6% UK 79% 8% 11% 79% 8% 10% 79% 7% 10% 80% 7% 10% Highest percentage per country Lowest percentage per country Highest percentage per item Lowest percentage per item 20

23 SPECIAL EUROBAROMETER 346 NEW EUROPEANS Citizenship of respondents grandparents To have a clearer picture of respondents ancestry, interviewees were asked about the citizenship of their grandparents 7. This was asked to provide more certainty about the origin of respondents families. It is possible that grandparents who were born in the respondent s country of residence may have held different citizenship at birth. A large majority (79%) of those surveyed have four grandparents who were all born citizens of the respondent s country of residence. Twelve percent of respondents say that not all their four grandparents were born with that citizenship. 4% have three such grandparents, 6% have two such grandparents and 2% have just one such grandparent. In total, 29% of Europeans have at least one grandparent who was born a citizen of a country other than the respondent s country of residence. A comparison of grandparents born in respondent s country of residence with the grandparents born as citizen from the respondent s country of residence shows that there are only small differences between those who are foreign by citizenship at birth and those who are foreign by place of birth. 7 QB5 Could you please tell me how many of your 4 grandparents were born as a citizen of (OUR COUNTRY)? 21
24 SPECIAL EUROBAROMETER 346 NEW EUROPEANS I am now going to ask you some questions about where you and your family were born. QB5 Grandparents who were born as citizens from the country of residence of the respondent QB4 Grandparents who were born in the country of residence of the respondent 4 grandparents 79% 80% 3 grandparents 4% 4% 2 grandparents 6% 4% 1 grandparent 2% 1% None 7% 8% NSP 2% 3% Further analysis confirms the strong relationship between the percentage of grandparents being foreign by citizenship at birth and the percentage of grandparents being foreign by place of birth. Most (79%) of the respondents with all four grandparents born in another country also have all four grandparents who were foreign by citizenship at birth and almost all (95%) of the respondents with no grandparents born abroad also have no grandparents who were foreign by citizenship at birth. Country-by-country analysis shows that the largest numbers of respondents with at least one grandparent born with citizenship other than that of the respondent s country of residence are found in Luxembourg (61%), Latvia (40%), Austria (32%), Estonia (31%) and France (28%). In other words, these are the countries with most interviewees who have a migrant background. The lowest numbers were found in Italy (5%), Romania (6%), Hungary (8%), Malta (9%) and Cyprus (10%). 22
.")

25 SPECIAL EUROBAROMETER 346 NEW EUROPEANS Socio-demographic analysis reveals that there are slight differences depending on the age and the level of education of the respondents. The likelihood that all four of a respondent s grandparents are nationals of the respondent s country of residence increases with age (e.g. 74% of those aged compared to 83% of the 55+ group). Less educated respondents are slightly more likely than those with higher education to have four grandparents who are nationals of their country of residence: a large majority (84%) of those who left school by age of 15 compared with 78% of those who ended education between the age of 16 and 19 and 77% of those who studied until 20 or beyond. Furthermore, 60% of 'New Europeans by openness' have four grandparents with the nationality of the respondent s country of residence. A much higher proportion - 84% - of those who are 'not open to other countries' have grandparents who all hold this citizenship. Therefore, openness might in part be the result of ancestry. 23
26 SPECIAL EUROBAROMETER 346 NEW EUROPEANS QB5 Could you please tell me how many of your 4 grandparents were born as a citizen of (OUR COUNTRY)? Less than 4 grandparents 4 grandparents EU27 19% 79% 2% Age % 74% 2% % 77% 1% % 79% 2% % 83% 2% Education (End of) 15-14% 84% 2% % 78% 2% % 77% 1% Still studying 25% 74% 1% Openness to other countries Yes 39% 60% 1% No, none 14% 84% 2% *Less than 4 grandparents is the sum of the following items : None; 1 grandparent; 2 grandparents; 3 grandparents Personal links with other countries The previous section dealt with respondents origin by birth, descent and ancestry as the first and most obvious type of connectedness respondents may have to other countries: connection as a given fact in respondents life. Conversely, this and the following sections will consider other types of cross-border connection, those that are based on respondents own choices. Respondents personal experiences abroad and their sociocultural interest in other countries will be covered in more detail in the following sections. First, this section starts with discussing connection through respondents close relationships. Connections to other countries can be studied by considering respondents close personal relationships with people family and friends who live or come from abroad. To get a picture of these relationships, respondents were asked about their close friends, close relatives and partners 8. 8 QB6 For each of the next statements please tell me if it applies to you or not. QB6.1 You have close relatives (brothers, sisters, children, parents) who live in another country than (OUR COUNTRY). QB6.2 You have close friends who live in another country than (OUR COUNTRY). QB6.3 You have close friends in (OUR COUNTRY) who have moved here from abroad. QB6.4 You live or have lived with a partner of a different citizenship than your own. 24
27 SPECIAL EUROBAROMETER 346 NEW EUROPEANS A substantial proportion of respondents have at least one of four types of foreign personal relationships as defined by this question. Having close friends living in another country is the most common of these (40% of respondents), followed by having close friends who moved from abroad to the country where the respondent lives (29%). In addition, more than one-quarter (27%) of those surveyed have close relatives (brothers, sisters, children, parents) who live in another country. Living with a partner of a different nationality is mentioned by a smaller proportion of respondents (8%) than the other three types of close personal relationship with people who live or come from abroad. Country-by-country analysis shows the following general pattern: Luxembourg a country with a large proportion of respondents of foreign descent stands out for all four types of personal relationship, with respondents having close friends living abroad (72%), or who came from abroad (69%), close relatives living abroad (60%) or a partner with a different nationality (32%). Ireland has also a high percentage of respondents with close relationships abroad, i.e. friends (68%) and/or relatives (59%), and also a large percentage of respondents with friends who came from abroad (42%). Sweden is also noticeable in this respect, with large numbers of respondents having close friends abroad (56%) or having close relationships with foreigners within their own country, i.e. friends who came from abroad (57%) and/or who live(d) with a partner of a different nationality (17%). The Baltic States stand out for the large numbers of respondents with close friends and close relatives who live abroad: Lithuania (59% and 47% respectively), Latvia (61% and 43%) and Estonia (53% and 35%). The Mediterranean islands show the same pattern: Malta (53% and 66% respectively) and Cyprus (57% and 55%). 25
28 SPECIAL EUROBAROMETER 346 NEW EUROPEANS QB6 For each of these next statements, please tell me if it applies to you or not. You have close friends who live in another country than (OUR COUNTRY) You have close friends in (OUR COUNTRY) who have moved here from abroad You have close relatives (brothers, sisters, children, parents) who live in another country than (OUR COUNTRY) You live or have lived with a partner of a different citizenship than your own Yes No Yes No Yes No Yes No EU27 40% 60% 29% 71% 27% 73% 8% 92% BE 42% 58% 33% 67% 26% 74% 13% 87% BG 51% 49% 10% 90% 29% 71% 1% 99% CZ 33% 66% 18% 81% 15% 84% 3% 97% 45% 55% 42% 58% 26% 74% 7% 93% DE 38% 62% 37% 63% 28% 72% 11% 89% EE 53% 46% 18% 82% 37% 62% 12% 87% IE 68% 32% 42% 57% 59% 41% 11% 88% EL 34% 66% 25% 75% 29% 71% 4% 95% ES 37% 63% 41% 59% 27% 73% 13% 87% FR 38% 62% 34% 66% 22% 78% 13% 87% IT 23% 77% 17% 83% 12% 88% 4% 96% CY 57% 43% 39% 61% 55% 45% 10% 90% LV 61% 39% 17% 83% 43% 57% 11% 87% LT 59% 41% 15% 85% 47% 53% 4% 95% LU 72% 28% 69% 31% 60% 40% 32% 66% HU 25% 75% 17% 83% 17% 83% 3% 96% MT 53% 47% 32% 68% 66% 34% 7% 92% NL 51% 49% 37% 63% 27% 73% 9% 91% AT 39% 61% 39% 60% 25% 74% 10% 89% PL 49% 51% 11% 89% 33% 67% 2% 98% PT 49% 50% 29% 70% 45% 55% 5% 95% RO 43% 56% 14% 85% 36% 63% 4% 95% SI 50% 50% 42% 58% 38% 62% 6% 94% SK 52% 48% 22% 77% 32% 68% 3% 97% FI 43% 57% 27% 73% 31% 69% 5% 95% SE 56% 44% 57% 42% 29% 71% 17% 83% UK 45% 55% 33% 67% 37% 63% 8% 91% 26
29 SPECIAL EUROBAROMETER 346 NEW EUROPEANS Socio-demographic analysis reveals the following general pattern. Age, education and subjective urbanisation and occupation appear to affect respondents personal links with other countries: friends who live abroad, friends who came from abroad, close relatives abroad and a partner of a different citizenship. Gender is relevant only with respect to friends: slightly more men than women have friends abroad or who came from abroad. Age is important as respondents aged more frequently have friends who live or came from abroad or a partner of a different citizenship than the younger respondents aged and the older age cohorts of and of 55+. There is little variation in the percentages of respondents having close relatives abroad in different age groups. Education is significant with respect to all four types of personal links: the longer their education, the more likely respondents are to have each of the four personal relationship types. Urbanisation also varies significantly with all four types of personal link, with those who live in cities tending to have personal relationships more often than those who live in small towns and villages. Occupation is relevant, with managers reportedly far more often having friends who live or came from abroad or a partner of a different nationality. There is no apparent relationship between occupation and having close relatives abroad. Analysis of 'New Europeans' shows that 'New Europeans by ancestry' far more frequently have at least one of the personal relationships with others abroad or from abroad than respondents who are not of foreign descent. Similarly, 'New Europeans by openness' significantly more often have close friends and close relatives living in other countries or friends who came from abroad. As discussed in the introduction of this report, the two groups of 'New Europeans' (by ancestry and by openness) partly overlap. A respondent with ancestral roots in another country may, for example, also have property in that other country, or may have studied there. A comparison between the non-overlapping groups (i.e. 'New Europeans by ancestry alone', 'New Europeans by openness alone' and 'Old Europeans') reveals a clear trend. 'New Europeans by openness alone' have the highest percentage of personal relationships, followed by 'New Europeans by ancestry alone'. Having close relatives abroad, unsurprisingly, is reported slightly more often by 'New Europeans by ancestry alone'. 27
30 SPECIAL EUROBAROMETER 346 NEW EUROPEANS Close friends living abroad Four out of every ten Europeans have a close friend abroad: it is the most widespread type of personal link with other countries. Country-by-country analysis shows some differences in this respect. The countries with outstanding numbers of respondents with close friends abroad are again Luxembourg (72%) and Ireland (68%). They are followed by the countries where more than half of the interviewees have close friends abroad: Latvia (61%), Lithuania (59%), Cyprus (57%), Sweden (56%), Estonia and Malta (both 53%), Slovakia (52%), Bulgaria and the Netherlands (51% each). The countries with the smallest number of reported close friendships abroad are Italy (23%) and Hungary (25%) Socio-demographic analysis reveals several differences, not least in terms of education, where the best-educated report foreign friendships far more frequently than those with lower levels of education; 57% of those who stayed in full-time education until the age of 20 have close friends abroad compared to 25% of those who left school at 15. Age is significant as younger age cohorts report foreign friendships far more frequently than older Europeans: 48% of those aged compared to 32% of those aged 55+. Occupation appears significant as managers (57%) are the most likely to have foreign friendships and those who are retired (30%) the least. Subjective urbanisation is of importance, with those who live in a city (47%) more likely to have close friends abroad than those who live in a small town (36%) or in a village (38%). Finally, the gender has a limited impact with slightly more men (41%) than women (38%) having close friends abroad. Analysis of 'New Europeans' shows that 'New Europeans by openness' far more frequently (75%) have close friends living in another country than those 'not open to other countries' (31%). Remarkably, 'New Europeans by ancestry' less often have close friends abroad (65%), but still far more often than those 'without foreign descent' (34%). Analysis of the non-overlapping groups shows that 'New Europeans by openness alone' (67%) are the most likely to have close friends who live abroad, significantly more even than 'New Europeans by ancestry alone' (45%) and far more than 'Old Europeans' (28%). 28
31 SPECIAL EUROBAROMETER 346 NEW EUROPEANS Friends who come from abroad Of all European interviewees, 29% are close friends with a person who lives in the same country as the interviewee, but who moved there from another country. Country-by-country analysis reveals that Luxembourg (69%) and Sweden (57%) have the largest proportion of respondents with friends from abroad, followed at some distance by Denmark, Ireland and Slovenia (all 42%). The countries with the lowest percentage of respondents with foreign friends are Bulgaria (10%), Poland (11%), Romania (14%) and Lithuania (15%). Socio-demographic analysis shows several significant differences. Education appears to be of great relevance as the longer respondents are educated, the more likely it is that they have friends who moved from abroad. Indeed, 41% of those who studied until they were 20 have such foreign friends, against 19% of those who left school at 15. A strong difference is also noted for age for the younger cohorts, and (36% each), which are more likely to have a foreign friend than respondents aged (31%) or those aged 55+ (20%). Turning to occupation, managers (39%) and students (41%) report having friends who moved from abroad far more frequently than those who are retired (18%). QB6.3 For each of these next statements, please tell me if it applies to you or not. You have close friends in (OUR COUNTRY) who have moved here from abroad Yes No EU27 29% 71% Sex Male 31% 69% Female 27% 73% Education (End of) 15-19% 81% % 75% % 59% Still studying 41% 59% Subjective urbanisation Rural village 25% 75% Small/mid size town 27% 73% Large town 38% 62% Ancestry/ Roots abroad Yes 56% 44% No, none 23% 77% Openness to other countries Yes 59% 41% No, none 21% 79% 29
32 SPECIAL EUROBAROMETER 346 NEW EUROPEANS Subjective urbanisation is of significance, respondents living in cities (38%) more often have foreign friends than those living in a small or middle sized town (25%) or rural dwellers (27%). Gender is important as more men (31%) than women (27%) have foreign friends. Analysis of 'New Europeans' reveals that 'New Europeans by openness' far more frequently (59%) have close friends who moved from another country than those 'not open to other countries' (21%). Accordingly, 'New Europeans by ancestry' report having close friends who came from abroad (56%) more often than those 'without foreign descent' (23%). When comparing only the non-overlapping groups, 'New Europeans by openness alone' more often have friends who came from abroad (47%) than 'New Europeans by ancestry alone' (37%). 'Old Europeans' are the least likely to have friends abroad (19%) Close relatives living abroad Respondents were also asked if they have close family relationships, i.e. brothers, sisters, children or parents, living in another country. As noticed above, more than one in four European interviewees have at least one close relative living abroad (see section 1.1). Country-by-country analysis shows that the following countries have the highest numbers of respondents with close relatives living abroad: Malta (66%), Luxembourg (60%), Ireland (59%), Cyprus (55%), Lithuania (47%) and Portugal (45%). In contrast, the countries with the lowest percentage of respondents who have close relatives living abroad are Italy (12%), the Czech Republic (15%) and Hungary (17%), in other words countries where only few respondents or their parents have roots abroad. Socio-demographic analysis reveals that education and subjective urbanisation play a role. Those who studied until 20 or longer (33%) have relatives living abroad more frequently than those who finished their education between 16 and 19 (26%) or who left school at 15 or younger (24%). Similarly, respondents living in a city (32%) are more likely to have close relatives abroad than those living in a small or middle-sized town (25%) or a village (26%). 30
33 SPECIAL EUROBAROMETER 346 NEW EUROPEANS Analysis of 'New Europeans' shows that more than half (53%) of the 'New Europeans by openness' have close relatives living abroad, which is more than the percentage of respondents 'not open to other countries' (21%). Here again, we see that openness might be partly the result of ancestry. The same pattern is found for 'New Europeans by ancestry' of whom more than half (57%) have close relatives living abroad compared to 21% of those 'without foreign descent'. Analysis of the non-overlapping groups reveals that 'New Europeans by openness alone' (36%) and 'New Europeans by ancestry alone' (38%) are both more likely to have close relatives who live abroad than 'Old Europeans' (18%) Partner of a different nationality Mixed marriage or cohabitation can be seen as an important measure of openness to another country. Almost one in ten respondents (8%) live or had lived with a partner of a different nationality. Country-by-country analysis reveals that Luxembourg (32%) stands out with the largest number of respondents who live or have lived with a partner of a different nationality than their own, followed some way behind by Sweden (17%), while the smallest numbers are found in Bulgaria (1%), Poland (2%), Slovakia (3%), Hungary (3%) and the Czech Republic (3%?). QB6.4 For each of these next statements, please tell me if it applies to you or not. You live or have lived with a partner of a different citizenship than your own Yes No EU27 8% 92% Sex Male 9% 91% Female 8% 92% Education (End of) 15-6% 94% % 92% % 86% Still studying 5% 94% Ancestry/ Roots abroad Yes 23% 76% No, none 5% 95% Has worked abroad Yes 28% 72% No 5% 94% Has studied abroad Yes 36% 63% No 6% 94% 31
34 SPECIAL EUROBAROMETER 346 NEW EUROPEANS Socio-demographic analysis shows the influence of age and education on this dimension. Respondents aged (13%) live or have lived with a partner of a different citizenship most frequently, compared with the younger respondents (6%) and also the older respondents, those aged (9%) and those aged 55+ (5%). Interviewees who finished education at the age of 20 or later (14%) more frequently have a partner of a different nationality than those who finished their education between the age of 16 and 19 (8%) or those who left school at the age of 15 (6%). Further analysis reveals that there is a connection between having a foreign partner and other characteristics of openness to other countries: 28% of those who have worked abroad and 36% of those who have studied abroad have a partner of a different nationality. Analysis of 'New Europeans' shows that 'New Europeans by ancestry' more often live or have lived with a partner of a different nationality than their own than those 'without foreign descent' (41% compared to 8%). 'New Europeans by openness' are not analysed in this respect since their group is defined partly by having a partner of a different citizenship. In short, one in four Europeans have close relatives living abroad, more than one in four have close friends who came from another country, and one in twelve have or had a partner of a different citizenship. 32

35 SPECIAL EUROBAROMETER 346 NEW EUROPEANS 1.3. Personal experiences in other countries The connectedness respondents may have with other countries could be due to past experiences of living in those countries, for work and education, because they own property there or for other reasons 9. The vast majority of respondents, between 87% and 96%, have not had such experiences abroad, at least not for a period longer than three consecutive months. However, a minority of respondents have lived in another country for work (13%), education (8%) or some other reason (10%). In addition, 3% own real property abroad. Country-by-country analysis of personal experiences abroad reveals the following pattern. Luxembourg records the largest percentages for all four items: 27% of respondents have spent at least three consecutive months abroad for work, 46% for study and 34% for some other reason; 13% own property in another country. It is followed at some distance by Ireland (27%, 15%, 18% and 4 % respectively) and Sweden (23%, 16%, 20% and 2% respectively). 9 QB6 For each of the next statements please tell me if it applies to you or not. QB6.6 You have worked (including volunteering and traineeships) for at least three consecutive months in another country than (OUR COUNTRY) QB6.7 You have attended school or studied for at least half an academic year in another country than (OUR COUNTRY) QB6.8 You have lived for reasons other than study or work for at least three consecutive months in another country than (OUR COUNTRY) QB6.9 You own real property/ properties in another country than (OUR COUNTRY) (not timesharing) 33
36 SPECIAL EUROBAROMETER 346 NEW EUROPEANS QB6 For each of these next statements, please tell me if it applies to you or not. You have worked (including volunteering and traineeships) for at least three consecutive months in another country than (OUR COUNTRY) You have attended school or studied for at least half an academic year in another country than (OUR COUNTRY) You have lived for reasons other than study or work for at least three consecutive months in another country than (OUR COUNTRY) You own real property/ properties in another country than (OUR COUNTRY) (not timesharing) Yes No Yes No Yes No Yes No EU27 BE BG CZ DE EE IE EL ES FR IT CY LV LT LU HU MT NL AT PL PT RO SI SK FI SE UK 13% 87% 8% 92% 10% 90% 3% 96% 11% 89% 9% 91% 12% 88% 5% 95% 10% 90% 2% 98% 3% 97% 1% 99% 6% 94% 3% 97% 3% 97% 1% 99% 22% 78% 12% 88% 17% 83% 3% 97% 13% 87% 8% 92% 11% 89% 4% 95% 12% 88% 7% 93% 11% 89% 2% 98% 27% 73% 15% 85% 18% 82% 4% 96% 12% 88% 9% 91% 9% 91% 3% 97% 15% 85% 14% 86% 17% 83% 7% 92% 13% 87% 7% 93% 12% 88% 4% 96% 7% 93% 4% 96% 5% 95% 2% 98% 17% 83% 21% 79% 15% 85% 5% 95% 11% 89% 3% 97% 9% 91% 1% 99% 14% 86% 3% 97% 7% 93% 1% 99% 27% 73% 46% 54% 34% 66% 13% 84% 9% 91% 3% 97% 4% 96% 1% 99% 11% 88% 6% 94% 10% 90% 1% 99% 18% 82% 12% 88% 15% 85% 4% 96% 17% 83% 8% 91% 11% 88% 5% 94% 10% 90% 2% 98% 4% 96% 1% 99% 13% 87% 5% 95% 7% 93% 2% 98% 8% 91% 1% 98% 5% 95% 0% 99% 11% 89% 9% 91% 10% 90% 6% 94% 15% 85% 3% 97% 5% 95% 1% 99% 14% 86% 10% 90% 13% 87% 2% 98% 23% 77% 16% 84% 20% 80% 2% 98% 16% 84% 13% 87% 15% 85% 5% 94% 34
37 SPECIAL EUROBAROMETER 346 NEW EUROPEANS Socio-demographic analysis reveals the following general pattern regarding the influence of age, education and urbanisation on three of these four items: working, studying or staying for other reasons. Property ownership did not correlate with sociodemographic characteristics. Gender is of influence only with respect to work: more men than women have worked in another country. Age is of influence in that the age cohort reports higher percentages of all experiences (excluding property ownership) than younger respondents aged and the older age groups (40-54 and of 55+). Education is highly significant in this respect. Those who were educated until age 20 or later are more likely to have had one of these personal experiences abroad (excluding property ownership) than those with less education. Urbanisation carries some influence since interviewees who live in large towns are more likely to have had personal experiences abroad (excluding property ownership) than those who live in smaller towns or rural villages. Analysis of 'New Europeans' shows that 'New Europeans by ancestry' tend to have more personal experiences abroad, including property ownership, than those 'without foreign descent' 35
38 SPECIAL EUROBAROMETER 346 NEW EUROPEANS Work experience Country-by-country analysis shows that working abroad including volunteering and traineeships for at least a period of three months was mentioned by more than a quarter of the respondents in Ireland and in Luxembourg (each 27%), and somewhat less, but still by a considerable number, in Sweden (23%) and Denmark (22%). Countries where the fewest respondents had work experience abroad are the Czech Republic (6%), Italy (7%), Romania (8%) and Hungary (9%). Socio-demographic analysis reveals that gender, age, education, occupation and urbanisation all have an impact. Men (16%) are more likely than women (10%) to have worked in another country. Respondents aged (17%) are far more likely to have work experience abroad than those in the age group (6%) or older respondents aged (14%) and 55+ (11%). QB6.6 For each of these next statements, please tell me if it applies to you or not. You have worked (including volunteering and traineeships) for at least three consecutive months in another country than (OUR COUNTRY) Yes No EU27 13% 87% Age % 94% % 83% % 86% % 89% Sex Male 16% 84% Female 10% 90% Education (End of) 15-9% 91% % 89% % 78% Still studying 6% 94% Subjective urbanisation Rural village 11% 89% Small/mid size town 11% 89% Large town 17% 83% Ancestry/ Roots abroad Yes 29% 71% No, none 9% 91% Respondents who were educated till the age of 20 or later (22%) are by far the most likely to have work experience abroad, much more likely than those who finished school between the ages of 16 and 19 (11%) or who left school at age 15 or earlier (9%). Occupation is also relevant: managers (21%) and the self-employed (18%) are more likely to have worked in another country than other white collar workers (11%). 36
39 SPECIAL EUROBAROMETER 346 NEW EUROPEANS Urbanisation has some slight influence; inhabitants of large towns (17%) are more likely to have worked abroad than those living in smaller towns or rural villages (both 11%). Analysis of 'New Europeans' shows that 'New Europeans by ancestry' are more likely to have worked abroad than those 'without foreign descent' (29% compared to 9%) Study experience Country-by-country analysis reveals that Luxembourg (46%) is the country with by far the largest proportion of respondents who have lived abroad for educational reasons, i.e. to study for at least half an academic year abroad. It is followed by Cyprus (21%), then at some distance by Sweden (16%), Ireland (15%), Spain (14%), the United Kingdom (13%), Denmark and the Netherlands (both 12%), and Finland (10%). In contrast, the lowest percentages are found in Romania (1%), Poland (2%), Bulgaria (2%), Slovakia, Hungary, Lithuania, Latvia, and the Czech Republic (all 3%). Socio-demographic analysis shows the same pattern with respect to age, education and subjective urbanisation for educational experience abroad as for work experience. Those aged (12%) are more likely to have studied abroad than younger respondents aged (7%) or older respondents aged (7%) and 55+ (5%). Those who were educated until age 20 or later (16%) are much more likely to have studied abroad than those who finished school between the age of 16 and 19 (4%) or whose education ended at age 15 or earlier (6%). Urbanisation has an impact, as inhabitants of large towns (12%) far more frequently have study experience abroad than those who live in a smaller towns or rural village (both 6%). Analysis of 'New Europeans' shows that 'New Europeans by ancestry' are more likely to have studied abroad than those 'without foreign descent' (29% compared to 3%). 37
40 SPECIAL EUROBAROMETER 346 NEW EUROPEANS QB6.7 For each of these next statements, please tell me if it applies to you or not. You have attended school or studied for at least half an academic year in another country than (OUR COUNTRY) Yes No EU27 8% 92% Age % 93% % 88% % 93% % 95% Education (End of) 15-4% 96% % 94% % 84% Still studying 7% 93% Subjective urbanisation Rural village 6% 94% Small/mid size town 6% 94% Large town 12% 88% Ancestry/ Roots abroad Yes 29% 71% No, none 3% 97% Other reasons for temporarily living abroad Country-by-country analysis shows that respondents who had lived abroad for reasons other than study or work for at least three consecutive months are most numerous in Luxembourg (34%), followed at a distance by Sweden (20%) and Ireland (18%). The lowest percentages of respondents who had lived abroad for some other reason are recorded in the Czech Republic, Bulgaria (3% each), Poland, Hungary (4%), Slovakia, Romania and Italy (5%). Socio-demographic analysis shows that age and education are relevant. Respondents aged (14%) say that they have lived abroad for reasons other than study or work more frequently than younger interviewees aged (8%), or older respondents aged (11%) and 55+ (9%). Respondents who were educated until age 20 or later (18%) are much more likely to have lived abroad at some time in the past for reasons other than study or work than those who finished school between the ages of 16 and 19 (9%) or who left school at age 15 or earlier (7%). 38
41 SPECIAL EUROBAROMETER 346 NEW EUROPEANS QB6.8 For each of these next statements, please tell me if it applies to you or not. You have lived for reasons other than study or work for at least three consecutive months in another country than (OUR COUNTRY) Yes No EU27 10% 90% Age % 92% % 86% % 89% % 91% Education (End of) 15-7% 93% % 91% % 82% Still studying 8% 92% Ancestry/ Roots abroad Yes 34% 66% No, none 6% 94% Openness to other countries Yes 43% 57% No, none 2% 98% Links with other countries None 2% 98% Ancestry only 6% 94% Openness only 29% 71% Analysis of 'New Europeans' reveals, unsurprisingly, that 'New Europeans by ancestry' are more likely to have lived in another country for reasons other than work or study than those 'without foreign descent' (34% compared to 6%). Another striking result is that 'New Europeans by openness' are far more likely to have lived in another country for reasons other than study or work than those 'not open to other countries' (43% compared to 2%). When comparing only the non-overlapping groups, the analysis yields the following percentages: 'New Europeans by openness alone', 29%; 'New Europeans by ancestry alone', 6%; and 'Old Europeans' 2% Owning real property Country-by-country analysis shows that having a personal link to another country through property ownership (not timesharing) is reported mostly in Luxembourg (13%), followed by Spain (7%) and Slovenia (6%). Owners of property abroad are found the least frequently in Romania (0%), Slovakia, Poland, Malta, Hungary, Lithuania, Latvia, the Czech Republic and Bulgaria (all 1%). Socio-demographic analysis did not reveal any significant differences with respect to owning property abroad. 'New Europeans by ancestry', unsurprisingly, are more likely to have real property in another country than those 'without foreign descent' (13% compared to 1%). 39
42 SPECIAL EUROBAROMETER 346 NEW EUROPEANS To conclude, one in ten Europeans appear to have personal experience of another country as a result of having stayed there for at least three consecutive months for work, education or other reasons. This is a much smaller proportion than the one in four Europeans who have connections with other countries through personal relationships, which requires rather less purposeful effort on the part of respondents Socio-cultural links with other countries The connections that people feel with countries other than that in which they live may be related to socio-cultural links they have with that country. This can take various forms, such as a preference for foreign cuisine, interest in news, cultural life or sports of another country, spending leisure time abroad or having foreign language skills. In this section, respondents were asked to indicate whether they had such links with other countries 10. More than one-third of the respondents regularly eat food at home which is typical of another country (36%), regularly follow news, cultural life or sports from another country (34%) or fluently speak at least one other language than that of the country where they live (34%). Slightly more than one in five respondents (22%) regularly spend holidays or weekends in one particular country other than where he or she lives. 10 QB6 For each of the next statements please tell me if it applies to you or not. QB6.5 You are fluent in at least one other language than (INTERVIEW LANGUAGE) QB6.10You regularly spend your holidays/weekends in one particular country other than (OUR COUNTRY) QB6.11 You regularly follow news, cultural life or sports from another country than (OUR COUNTRY) QB6.12 You regularly eat food at home that is typical of another country than (OUR COUNTRY) 40
43 SPECIAL EUROBAROMETER 346 NEW EUROPEANS QB6.5 For each of these next statements, please tell me if it applies to you or not. You regularly eat food at home that is typical of another country than (OUR COUNTRY) You regularly follow news, cultural life or sports from another country than (OUR COUNTRY) You are fluent in at least one other language than (INTERVIEW LANGUAGE) You regularly spend your holidays/weekends in one particular country other than (OUR COUNTRY) Yes No Yes No Yes No Yes No EU27 BE BG CZ DE EE IE EL ES FR IT CY LV LT LU HU MT NL AT PL PT RO SI SK FI SE UK 36% 63% 34% 65% 34% 66% 22% 78% 55% 45% 55% 45% 55% 45% 48% 52% 5% 94% 24% 76% 38% 61% 1% 99% 28% 71% 29% 71% 33% 67% 16% 84% 61% 38% 51% 49% 77% 23% 39% 61% 45% 54% 39% 61% 45% 55% 38% 62% 17% 81% 42% 57% 72% 28% 9% 91% 52% 48% 53% 47% 18% 82% 29% 71% 14% 86% 27% 73% 35% 65% 4% 96% 28% 72% 36% 64% 34% 66% 13% 86% 51% 49% 39% 61% 29% 71% 22% 78% 8% 92% 21% 78% 18% 82% 10% 90% 24% 76% 59% 41% 48% 52% 9% 91% 23% 75% 49% 51% 87% 13% 4% 96% 13% 86% 37% 63% 76% 24% 8% 92% 80% 20% 84% 16% 96% 4% 78% 22% 25% 75% 43% 56% 19% 81% 3% 97% 42% 58% 81% 19% 86% 14% 20% 80% 81% 19% 68% 32% 76% 24% 51% 49% 39% 60% 36% 64% 41% 59% 43% 56% 12% 86% 17% 82% 24% 75% 4% 95% 24% 75% 38% 62% 30% 70% 6% 94% 16% 81% 20% 79% 26% 73% 5% 94% 26% 73% 36% 64% 65% 35% 45% 55% 31% 68% 42% 58% 48% 52% 22% 78% 28% 71% 25% 75% 59% 41% 13% 87% 50% 49% 42% 58% 70% 30% 26% 74% 66% 34% 35% 65% 20% 80% 33% 67% 41
44 SPECIAL EUROBAROMETER 346 NEW EUROPEANS Country-by-country analysis shows the following general pattern. Luxembourg and to a lesser extent the Netherlands stand out for all four types of socio-cultural links with other countries; they have among the largest numbers of interviewees who are fluent in at least one other language than the language of the interview (96% and 76% respectively), or who regularly eat food at home that is typical of another country (80% and 81%), follow news, cultural life or sports from another country (84% and 68%), or spend their holidays or weekends in one particular country other than their country of residence (78% and 51%). Other countries with high percentages of respondents with socio-cultural links to other countries though not in all four categories are Malta for speaking another language (86%) and following news, cultural life or sports from another country (81%), and Denmark for speaking another language (77%) and interest in the national cuisine of other countries (61%). Furthermore, the Baltic States Latvia (87%), Lithuania (76%) and Estonia (72%) stand out as all three of them rank highly in terms of the proportion of respondents speaking another language. Socio-demographic analysis reveals the following general pattern regarding the influence of age, education, occupation, urbanisation and difficulties paying bills on all four kinds of respondents socio-cultural links with other countries: food, information, language and leisure time. Variations by gender only affect information and leisure time. The general pattern outlined below will be explained in more detail in the following sections which will address each socio-cultural link separately. Gender differences only appear for information and leisure time, with men more likely than women to regularly follow news, cultural events and sports of another country or spend weekends or holidays in another country. Age is relevant as younger age cohorts are more likely to have socio-cultural links to another country than the older age cohorts. In particular the oldest respondents aged 55+ are less likely to have socio-cultural links to other countries. Education is highly significant, with those who are more educated i.e. studied until the age of 20 or later much more likely to have socio-cultural links with other countries than those who are less educated, i.e. those who ended their education between ages 16 to 19 and those who left school before the age of 16. Urbanisation appears relevant as those living in large towns report socio-cultural links with other countries more often than residents of smaller towns and villages. Occupation is relevant, with managers clearly standing out as having the most frequent socio-cultural links with other countries. Financial difficulties are relevant with those who almost never have problems with paying their bills having noticeably more frequent socio-cultural links with other countries than those who from time to time or most of the time have such difficulties. 42
45 SPECIAL EUROBAROMETER 346 NEW EUROPEANS QB6 For each of these next statements, please tell me if it applies to you or not. % answers Yes You regularly eat food at home that is typical of another country than (OUR COUNTRY) You regularly follow news, cultural life or sports from another country than (OUR COUNTRY) You are fluent in at least one other language than (INTERVIEW LANGUAGE) You regularly spend your holidays/weekends in one particular country other than (OUR COUNTRY) EU27 36% 34% 34% 22% Sex Male 36% 39% 24% 37% Female 33% 30% 20% 35% Age % 35% 46% 21% % 38% 43% 25% % 36% 34% 24% % 30% 23% 18% Education (End of) 15-21% 25% 15% 13% % 32% 28% 21% % 47% 57% 32% Still studying 44% 38% 56% 24% Subjective urbanisation Rural village 34% 34% 31% 20% Small/mid size town 35% 32% 32% 21% Large town 42% 38% 43% 25% Respondent occupation scale Self- employed 37% 36% 38% 24% Managers 54% 47% 56% 36% Other white collars 40% 37% 40% 27% Manual workers 42% 35% 31% 23% House persons 31% 26% 25% 16% Unemployed 35% 33% 31% 15% Retired 24% 30% 22% 17% Students 44% 38% 56% 24% Difficulties paying bills Most of the time 28% 26% 26% 12% From time to time 32% 30% 29% 14% Almost never 40% 38% 38% 27% Ancestry/ Roots abroad Yes 62% 53% 62% 41% No, none 31% 31% 28% 18% Openness to other countries Yes 62% 58% 66% 42% No, none 30% 28% 26% 17% Links with other countries None 27% 27% 24% 15% Ancestry only 50% 37% 44% 29% Openness only 54% 51% 56% 34% 43
46 SPECIAL EUROBAROMETER 346 NEW EUROPEANS Analysis of 'New Europeans' reveals that 'New Europeans by ancestry' are far more likely to have at least one of the socio-cultural links with other countries than those 'without foreign descent'. Similarly, as one would expect, 'New Europeans by openness' report far more frequent socio-cultural links to other countries than those 'not open to other countries'. When comparing only the non-overlapping groups there is a clear trend for all four socio-cultural links, showing that 'New Europeans by openness alone' have the highest percentages of cultural links, followed by 'New Europeans by ancestry alone' Food Country-by-country analysis shows that two countries stand out in reporting food as a socio-cultural link to another country. The highest percentages of respondents who regularly eat food at home that is typical of other countries than their country of residence are found in the Netherlands (81%) and Luxembourg (80%), followed at some distance by the United Kingdom (66%) and Denmark (61%). The lowest percentages of respondents interested in other national cuisines are found in Bulgaria (5%) and Italy (8%). Socio-demographic analysis shows that age, education, occupation, urbanisation and financial situation are relevant. Older interviewees are much less fond of foreign cuisine than younger age cohorts: those aged 55+ (25%) report eating food typical of another country at home much less often than those aged years (40%), years (45%) and years (42%). As the level of education increases, respondents are more likely to eat foreign food at home; one in two (50%) of those who studied until the age of 20 regularly have a foreign meal at home compared to one in five (21%) of those who left school at 15 or earlier. Regarding occupation, managers (54%) stand out for their fondness for foreign food, with retired respondents (24%) at the other extreme. Turning to urbanisation, interviewees who live in cities (42%) tend to have food that is typical of another country more often than those who live in a smaller town (35%) or village (34%). Interviewees who almost never have problems paying their bills (40%) eat foreign food at home significantly more often than those who do have such problems from time to time (32%) or most of the time (28%). Analysis of 'New Europeans' shows that 'New Europeans by ancestry' are twice as likely to eat food at home that is typical of another country than those 'without foreign descent' (62% compared to 31%). The comparison between 'New Europeans by openness' and those 'not open to other countries' shows the same pattern (62% against 30%). Analysis of the non-overlapping groups reveals that 'New Europeans by openness alone' (54%) and 'New Europeans by ancestry alone' (50%) are both more likely to eat food from another country at home than 'Old Europeans' (27%). 44
47 SPECIAL EUROBAROMETER 346 NEW EUROPEANS Follow news, cultural life and sports Country-by-country analysis reveals that two countries stand out with a vast majority of interviewees who regularly follow news, cultural life or sports of another country than that in which they live: Luxembourg (84%) and Malta (81%) followed at some distance by the Netherlands (68%) and Cyprus (59%). The lowest percentages of respondents interested in news, cultural life or sports of another country are in Poland (17%), Romania (20%) and Italy (21%). Socio-demographic analysis shows that gender, age, education, occupation, urbanisation and financial situation are all relevant. Gender is highly significant as men (39%) are more likely to regularly follow news, cultural life or sports from another country than women (30%). Older interviewees are less interested in such information than the younger: those aged 55+ (30%) follow foreign news, cultural life or sports less often than those aged (36%), (38%) or (35%). The longer they were educated, the more likely respondents are to follow foreign news, cultural life or sports: almost one in two (47%) of those who studied until they were 20 or later regularly do this, compared to one in four (25%) of those who left school by 15. Turning to occupation, managers (47%) stand out for their interest foreign news, cultural life or sports, compared to retired respondents (30%). Furthermore, city-dwellers (38%) tend to follow foreign news, cultural life or sports more often than those living in small towns (32%) or villages (34%). Interviewees who have no difficulty paying their bills (38%) are more likely to be interested in information from another country than those who are in bad financial situation most of the time (26%). Analysis of 'New Europeans' shows that respondents 'New Europeans by ancestry' are more likely to regularly follow news, cultural life or sports from another country than those 'without a foreign descent' (53% against 31%). Likewise with 'New Europeans by openness' compared with those 'not open to other countries' (58% against 28%). Analysis of the non-overlapping groups reveals, remarkably, that 'New Europeans by openness alone' (51%) are more likely to regularly follow news, cultural life or sports of another country than 'New Europeans by ancestry alone' (37%). 'Old Europeans' show the least interest in such information (27%). 45
48 SPECIAL EUROBAROMETER 346 NEW EUROPEANS Foreign language skills One in three Europeans interviewed is fluent in at least one other language than the language in which the interview took place. Having foreign language skills may be the cause or the result of feeling connected to another country. Country-by-country analysis reveals that in three countries almost all interviewees speak at least one other language than the language of the interview: Luxembourg (96%), Latvia (87%) and Malta (86%). Countries where somewhat fewer, but still a substantial majority speak another language are Denmark (77%), Lithuania (76%), the Netherlands (76%), Estonia (72%) and Sweden (70%). The countries with the lowest numbers of respondents speaking foreign languages are Italy (18%), Ireland (18%) and Hungary (19%). Socio-demographic analysis reveals a number of variations with age, education, occupation, urbanisation and financial situation. Younger respondents are more likely to speak another language: almost one in two (46%) of those aged 15 or older, compared to almost one in four (23%) of those aged 55 or older. As the level of education increases, respondents are more likely to speak another language: 15% of those who left school at 15 compared to 57% of those who studied until the age of 20. As to occupation, again managers stand out with 56% of them speaking another language fluently. Turning to subjective urbanisation, inhabitants of cities (43%) tend to speak another language more often than rural dwellers (31%). Finally, citizens without financial problems (38%) are more likely to speak another language than those who report difficulties in paying bills most of the time (26%). Analysis of 'New Europeans' shows that 'New Europeans by ancestry' are much more likely to speak another language than those 'without a foreign descent' (62% compared to 28%). This is even more so for 'New Europeans by openness' compared to those 'not open to other countries' (66% compared to 26%). The analysis of the non-overlapping groups reveals that 'New Europeans by openness alone' (56%) far more frequently speak another language than 'New Europeans by ancestry alone' (44%). As expected, 'Old Europeans' are the least likely to speak another language (24%). Respondents were also asked which languages other than their mother tongue they could speak well enough to be able to hold a conversation 11. The language which European respondents speak most often - besides their mother tongue - is English. Almost one in three (31%) of the interviewees (non native English speakers) can hold a conversation in English. Other languages follow some way behind. Almost one in ten of European respondents can speak German (9%) or French (8%) besides their mother tongue. Much rarer, but still significant are Spanish (4%) and Russian (3%). 11 QB7a What is (are) your mother tongues(s)? QB7b And what other language(s) do you speak well enough to be able to have a conversation? 46
49 SPECIAL EUROBAROMETER 346 NEW EUROPEANS Holidays and weekends Country-by-country analysis reveals that respondents who regularly spend their holidays or weekends in one particular country other than their country of residence are most numerous in Luxembourg (78%), the Netherlands (51%), Belgium (48%), Slovenia (45%) and Austria (43%). Countries with the smallest proportions of respondents that spend leisure time abroad on a regular basis are Bulgaria (1%), Hungary (3%), Poland, Latvia, Greece (all 4%), Romania (5%), Portugal (6%), Lithuania (8%) and Cyprus (9%). Socio-demographic analysis of leisure time shows significant variation by gender, age, education, occupation, urbanisation and financial situation. The pattern is similar to that observed in the other items of that section on socio-cultural links with other countries 12. Analysis of 'New Europeans' shows that 'New Europeans by ancestry' are more likely to spend holidays or weekends in another country than the country where they reside than respondents 'without a foreign descent' (41% against 18%). There is a similar picture for 'New Europeans by openness' compared with those 'not open to other countries' (42% against 17%). Analysis of non-overlapping groups shows that 'New Europeans by openness alone' (34%) and to a lesser extent those 'by ancestry alone' (29%) are both more likely to spend leisure time abroad than 'Old Europeans' (15%). * * * To summarize, the aim of this first part of the report was to evaluate to what extent and in which ways Europeans are connected to countries other than their country of residence. We saw that cross-border connections through personal relationships (close friends and close relatives) are most widespread. Other types of connection (foreign descent, personal experiences abroad and socio-cultural links with other countries) occur much less often across the European Union. Luxembourg stands out as having large proportions of respondents with all four types of connection to other countries measured in this survey. Ireland and Sweden stand out in terms of personal relationships and personal experience abroad and the Netherlands for socio-cultural links with other countries. Respondents in the age group, those with the longest educations, and those who live in large towns show the highest levels of cross-border connectedness of all four types. In addition, the youngest group aged show high proportions of socio-cultural links to other countries and are more likely than average to have foreign grandparents : Socio-cultural links with other countries. Page 39 of the report:. Food ; Follow news, cultural life and sports; Foreign language skills 47


50 SPECIAL EUROBAROMETER 346 NEW EUROPEANS 2. PLANS TO MOVE TO ANOTHER COUNTRY While the previous chapter dealt with Europeans connectedness with other countries through their personal relationships and their own experiences in other countries, this chapter focuses more on how respondents are likely to behave in the future as regards settling in another country Inclination to emigrate within ten years The interviewees were asked to estimate how likely they are to settle in another country within ten years. Economic reasons can be important, e.g. migration for access to better labour markets. It may also be considered that respondents enthusiasm for moving to another country shows their openness to other countries. For a large majority of Europeans (86%) it is probably not be the case: not at all likely (66%) or not very likely (20%). A minority of 11%, however, think that they are fairly or very likely to move to another country. Country-by-country analysis reveals that respondents in the following countries are the most likely to move abroad: Latvia (34%), Lithuania (24%), Luxembourg (20%), Ireland (18%), Denmark and Sweden (each 17%). 48


 and the lowest number of close relatives living abroad, which may")

51 SPECIAL EUROBAROMETER 346 NEW EUROPEANS The countries with the highest proportions of respondents saying it is 'not at all likely' they will move abroad are the Czech Republic (80%), Italy (76%), Cyprus (75%) and Hungary (74%). The Czech Republic, Italy and Hungary are also among the countries that have the lowest percentages of interviewees with personal experiences in another country (e.g. work, study) and the lowest number of close relatives living abroad, which may deter them from moving abroad. Cyprus is an exception here, ranking among the highest in those respects, and respondents unwillingness to leave their island appears to have other reasons. 49
52 SPECIAL EUROBAROMETER 346 NEW EUROPEANS Socio-demographic analysis reveals differences related to age, education and occupational situation. The younger the respondents are, the more likely they are to move abroad. More than a quarter (27%) of the respondents aged expect to move to another country within 10 years, followed by 15% of those aged and 9% of those aged Only 3% of the oldest respondents aged 55 and over expect they may move to another country. Respondents who stayed in full-time education up to age 20 or beyond are more likely to move to another country than those who left school between 16-19, or at 15 or earlier (14%, 9% and 4% respectively). Last but not least, respondents occupational situation appears to be of importance: those who are unemployed (17%) or still studying (30%) are more inclined to move abroad compared to those who are employed or have retired. QB8 How likely do you think it is that you will move to another country within the next ten years, to live there? Total 'Likely' Total 'Not likely' EU27 11% 86% 3% Age % 66% 7% % 81% 4% % 89% 2% % 96% 1% Education (End of) 15-4% 95% 1% % 89% 2% % 84% 2% Still studying 30% 62% 8% Respondent occupation scale Self- employed 10% 88% 2% Managers 13% 84% 3% Other white collars 9% 88% 3% Manual workers 13% 84% 3% House persons 7% 92% 1% Unemployed 17% 79% 4% Retired 2% 97% 1% Students 30% 62% 8% Ancestry/ Roots abroad Yes 23% 73% 4% No, none 8% 90% 2% Openness to other countries Yes 24% 72% 4% No, none 8% 90% 2% Links with other countries None 6% 92% 2% Ancestry only 15% 83% 2% Openness only 19% 78% 3% 50
, similarly with the 'New Europeans by ancestry' (23% compared to 8% of those 'without foreign descent').")
, which confirms that 'New Europeans' are somewhat more open to a Europe without internal borders than 'Old Europeans'. 2.")
53 SPECIAL EUROBAROMETER 346 NEW EUROPEANS Analysis of 'New Europeans' shows that almost one-quarter of the 'New Europeans by openness' are likely to move to another country to live there (24% against 8% of those 'not open to other countries'), similarly with the 'New Europeans by ancestry' (23% compared to 8% of those 'without foreign descent'). Comparing non-overlapping groups, 'New Europeans by openness alone' are slightly more likely to move abroad (19%) than those 'by ancestry alone' (15%). Both groups are more likely to move abroad than 'Old Europeans' (6%), which confirms that 'New Europeans' are somewhat more open to a Europe without internal borders than 'Old Europeans' Countries of preference Those respondents who are likely to move abroad were asked to which country that would be 13. Half of them (50%) would expect to move to another EU Member State while 7% mentioned another country in Europe (outside the EU). For more than a third (36%) of the respondents who are likely to move abroad, their preferred country lies outside Europe: the United States of America, Canada, Japan, Australia or New Zealand (22%). The standard of living in these countries could explain this preference. Finally, a significant number expect to move to some other country outside Europe (14%). The country-by-country analysis reveals some differences, but these should be interpreted with caution because of the smaller sample sizes, since this question was only put to those who expect to move to another country. 13 QB9 And if you were to move, where would it be to? 51
54 SPECIAL EUROBAROMETER 346 NEW EUROPEANS Another EU Member State is the favoured destination for interviewees in Romania (81%), Greece (78%) and Lithuania (74%). A country in Europe that is not a EU Member State is mentioned most often in Italy (18%), Slovenia (17%) and Finland (14%). The United States of America, Canada, Japan, Australia and New Zealand are the most popular for respondents in the United Kingdom (37%) and Ireland (36%), maybe for language reasons (except for Japan). Some other country outside Europe is favoured most in the Netherlands (27%), Spain (22%) and France (21%). Socio-demographic analysis reveals some interesting differences on the basis of the socio-demographic profile of the interviewee, gender and age in particular. However, as pointed out above, these differences should be interpreted cautiously because of small sample sizes. Of those who expect to move abroad, the youngest are the most likely to choose these countries: 29% of those aged 15-24, followed by 22% of those aged 25-39, 17% of those aged and 11% of those aged 55 and over. All in all, for the younger generation, the USA seems to exert a pull factor. It is also possible that language plays a role in the attractiveness of the USA for the young generation of Europeans. Analysis of 'New Europeans' shows that both types of 'New Europeans' are more likely to move to another country outside Europe other than the USA, Canada, Japan, Australia or New Zealand (20% for 'New Europeans by ancestry' and 18% for 'New Europeans by openness') than those 'without a foreign descent' or 'not open to other countries' (11% and 9% respectively). 52
55 SPECIAL EUROBAROMETER 346 NEW EUROPEANS 3. ATTACHMENT AND FEELINGS OF BELONGING People may feel attachment to several places and have feelings of belonging to various groups. This section firstly deals with respondents attachment to places at various geographical levels: other countries, their own country, their region, and their city, town or village. Secondly, respondents feelings of belonging to specific groups will be examined. The issue of particular interest in this section is to explore the differences that might exist between 'Old and New Europeans' regarding their feelings of attachment and belonging. 3.1 Attachment to other countries Respondents were asked to name two other countries to which they feel most attached, apart from their country of residence. The country of first choice will be discussed first, followed by the country of second choice. Country-by-country analysis shows that more than half (51%) of the interviewees feel some attachment to a country other than the country where they reside 14. The highest proportions of those feeling affinity with another country are found in Luxembourg (84%), Sweden (82%), the Netherlands (79%), Malta (77%), Cyprus (77%), Belgium, Denmark (both 69%), the Czech Republic (66%), Slovakia and Germany (both 62%). These countries, accordingly, have the fewest respondents reporting that they have no attachment to any other country. Countries where respondents feel the least attachment to other countries are Italy (31%), Latvia (32%), Poland (35%), Portugal (38%), Slovenia (39%), Greece (40%), Bulgaria and Romania (both 42%). Accordingly, these countries have the highest percentages of respondents reporting no attachments. Respondents in Latvia, who are most likely to emigrate (see part 2 of this report), have a low attachment to other countries. Their desire to move seems to be due to other factors, for example the employment situation: other surveys conducted these last months show that Latvia is one of the EU Member States with the highest proportion of respondents saying the employment situation in their country is bad 15. The countries people feel affinity with (other than their own country) and which they mentioned most often are France, Italy and Spain (each 5%), Germany (4%) and Austria, the UK, and the USA (each 3%). 14 QB10a Which country other than (OUR COUNTRY) do you feel the most attached to? Firstly? 15 Special Eurobarometer n 315 Social Climate: Standard Eurobarometer Autumn 2009 (72): 53


, the UK and the USA (both 5%), and Austria (4%).")
56 SPECIAL EUROBAROMETER 346 NEW EUROPEANS Interviewees were also asked to mention a second country they feel attached to 16. Analysis of the first and second country together 17 did not change the ranking of the most popular countries. On the contrary, it confirms the popularity of France, Italy and Spain (all 8%), Germany (6%), the UK and the USA (both 5%), and Austria (4%). Greece joins the list when second favorite countries are included (3%). 16 QB10b And secondly? 17 QB10T Firstly? And secondly? 54
57 SPECIAL EUROBAROMETER 346 NEW EUROPEANS QB10T Countries other than (OUR COUNTRY) which you feel the most attached to France Italy Spain Germany United Kingdom United States Austria Greece Other (SPECIFY) EU27 BE BG CZ DE EE IE EL ES FR IT CY LV LT LU HU MT NL AT PL PT RO SI SK FI SE UK 8% 8% 8% 6% 5% 5% 4% 3% 12% 38% 13% 14% 7% 5% 4% 3% 2% 11% 3% 6% 6% 7% 6% 4% 1% 6% 6% 6% 5% 3% 10% 7% 3% 7% 5% 5% 5% 7% 8% 15% 14% 7% 3% 6% 22% 9% 11% 8% - 4% 4% 16% 4% 11% 1% 1% 2% 6% 5% 2% 1% 1% 9% 8% 3% 9% 4% 26% 17% 1% 1% 9% 6% 8% 4% 11% 5% 3% 1% 0% 6% 13% 9% - 4% 6% 4% 0% 0% 12% - 12% 17% 6% 5% 4% 1% 1% 17% 9% - 9% 3% 6% 7% 1% 2% 5% 2% 2% 1% 2% 22% 4% 0% 59% 10% 1% 1% 1% 5% 7% 2% 1% 0% 7% 2% 2% 3% 7% 12% 3% 0% 0% 8% 40% 14% 8% 21% 4% 3% 4% 1% 10% 7% 12% 7% 18% 7% 5% 15% 8% 6% 3% 36% 2% 2% 47% 6% 2% 0% 18% 19% 10% 9% 19% 11% 6% 6% 3% 20% 5% 17% 5% 18% 3% 5% - 6% 8% 4% 6% 4% 9% 7% 3% 2% 2% 5% 13% 2% 10% 3% 6% 2% 0% 0% 11% 8% 13% 7% 8% 5% 4% 2% 2% 2% 1% 6% 1% 6% 1% 1% 10% 1% 21% 1% 3% 2% 6% 3% 3% 5% 2% 4% 2% 2% 5% 6% 6% 5% 1% 2% 15% 8% 12% 12% 8% 16% 12% 3% 9% 38% 9% 5% 11% 4% - 10% 1% 3% 20% The highest results per value The highest results per country * Respondents mentioned the following countries in 2% of the cases: Belgium, Ireland, Portugal, The Netherlands and Sweden ** Other answers included a wide range of countries, none of which was mentioned by more than 1% of respondents. Canada, Norway, Switzerland and Australia were all mentioned by slightly less than 1% of respondents. 55
58 SPECIAL EUROBAROMETER 346 NEW EUROPEANS The general pattern of attachment seems to follow historical-cultural principles (language) or simply geographical proximity. More than half of the Cypriots surveyed (59%) mention Greece; a considerable number of respondents in Malta (47%) and a lesser but still considerable proportion of interviewees in Ireland (26%) feel attached to the UK. A significant number of Maltese respondents (36%) also cite Italy as a country they feel attached to. A sizeable minority of respondents in Slovakia (44%) mentioned the Czech Republic and, similarly, respondents in the Czech Republic are most likely to mention affinity with Slovakia (40%). Over a quarter of the respondents in Luxembourg (40%) and in Belgium (38%) feel attached to France. One fifth of respondents in Finland (23%) feel attached to Sweden. Interviewees in Sweden rarely mention their neighbor Finland (6%), instead displaying more interest than any other respondents in a variety of other countries (38%). Socio-demographic analysis reveals that gender, age, education and occupation are of influence regarding respondents mentioning at least one other country they feel attached to. Gender carries limited influence as men (53%) are slightly more likely to cite another country than women (48%). The younger the respondents are, more likely they are to mention another country they feel attached to: 58% of the youngest aged compared to 43% of the oldest respondents 55+. An analysis by education shows that the longer they have been in education, the more likely respondents are to cite another country: 65% of those who studied till the age of 20 or beyond compared to 36% of those who had finished education at the age of 15 or earlier. A similar pattern is found for occupation. Managers (68%), students (61%) and white collar workers (57%) more often mention other countries than retired people (41%) and house persons (42%). Analysis of 'New Europeans' shows that 64% of 'New Europeans by ancestry' cite another country, and this proportion goes up to 73% amongst 'New Europeans by openness'. In comparison, this figure drops to 42% for 'Old Europeans'. 56
59 SPECIAL EUROBAROMETER 346 NEW EUROPEANS QB10 Which country other than (OUR COUNTRY) do you feel the most attached to? At least one country None EU27 51% 44% 5% Sex Male 53% 41% 6% Female 48% 47% 5% Age % 36% 6% % 40% 5% % 42% 5% % 52% 5% Education (End of) 15-36% 60% 4% % 45% 5% % 30% 5% Still studying 61% 34% 5% Respondent occupation scale Self- employed 52% 43% 5% Managers 68% 27% 5% Other white collars 57% 38% 5% Manual workers 51% 43% 6% House persons 42% 53% 5% Unemployed 50% 44% 6% Retired 41% 54% 5% Students 61% 34% 5% Ancestry/ Roots abroad Yes 74% 22% 4% No, none 47% 48% 5% Openness to other countries Yes 77% 20% 3% No, none 45% 50% 5% Links with other countries None 41% 53% 6% Ancestry only 64% 32% 4% Openness only 73% 24% 3% 57


60 SPECIAL EUROBAROMETER 346 NEW EUROPEANS 3.2. Reasons for attachment to other countries Feelings of attachment to a country other than one s country of residence can have various reasons. We have seen that considerable numbers of respondents feel attached to one or even two countries other than their country of residence. We next asked these respondents about their reasons for attachment to their first preference QB11 And what are the three main reasons you feel attached to (COUNTRY QB10a)? 58
61 SPECIAL EUROBAROMETER 346 NEW EUROPEANS The top three reasons for attachment to the country of first preference are spending holidays or weekends in that country (25%) and having personal relationships there, that is close friends (23%) and/or close relatives (21%). These reasons correspond to the personal links that constitute an important factor for connection to other countries as discussed in part 1 of this report. These are followed by socio-cultural interests, such as keeping up with news, cultural life or sports of that country (16%) or regularly eating typical foreign foods at home (11%). Reasons mentioned less often, but still significantly, include having close friends who moved from that other country (8%), being born there (8%) and having had work experience there (7%). The reasons mentioned least often are having studied (4%) or having a partner from that country (4%) and owning property there (2%). Last but not least, more than one in ten respondents (11%) cannot come up with any particular reason why they feel attached to that other country, which might exactly be an indication of subjective, emotional attachment. 59

62 SPECIAL EUROBAROMETER 346 NEW EUROPEANS Reasons for attachment to the countries of first and second preference: The analysis of the first and second countries together generally reveals the same pattern as for the attachment to the first country mentioned. In the remainder of this section, the analyses of the two preferred countries will therefore be aggregated. The country-by-country analysis will be done on these aggregated results. 60
.")
, Denmark (59%), Belgium and")
, Austria (48%), the UK (42%) and Sweden (40%).")

63 SPECIAL EUROBAROMETER 346 NEW EUROPEANS Holidays and weekends Spending weekends or holidays in another country is the most common reason for attachment to that country (30% at EU level). However, a closer look at the respondents main reasons by country reveals some differences. More than half of the respondents mention this reason in the Netherlands (65%), Denmark (59%), Belgium and Luxembourg (each 52%). Almost half of the respondents mention this reason in Germany (49%), Austria (48%), the UK (42%) and Sweden (40%). All these countries have been EU Member States since 15 years or more and share a relatively high standard of living; spending holidays abroad may be part of respondents life style. Holidays are seldom mentioned as a reason for attachment to another country in Bulgaria (1%), Lithuania and Greece (each 3%). Basis: those who feel attached to a first or second other country (51% of the sample) 61
64 SPECIAL EUROBAROMETER 346 NEW EUROPEANS Close friends The second most common reason for attachment (28% at EU level) to another country is having close friends living there. Approaching half of the respondents in Slovakia (48%), Lithuania, Ireland (each 47%), Finland (45%), Estonia (42%), Luxembourg, Cyprus (each 41%) and Bulgaria (40%) mention this reason. Respondents cite this much less often in Hungary (17%), Italy (21%), Spain (23%) and France (24%). Basis: those who feel attached to a first or second other country (51% of the sample) 62
. This reason is mentioned most often in Ireland and Lithuania (52% each), Luxembourg (50%), Cyprus (45%), Romania (42%), Portugal and Estonia (39%), Malta and Latvia (37% each).")
65 SPECIAL EUROBAROMETER 346 NEW EUROPEANS Close relatives The third most common reason for attachment to another country (across all respondents) is, as we have seen, having close relatives who live there (34%). This reason is mentioned most often in Ireland and Lithuania (52% each), Luxembourg (50%), Cyprus (45%), Romania (42%), Portugal and Estonia (39%), Malta and Latvia (37% each). It is mentioned least often in Italy (10%), Hungary (12%) and the Czech Republic (14%). Basis: those who feel attached to a first or second other country (51% of the sample) 63
66 SPECIAL EUROBAROMETER 346 NEW EUROPEANS Other reasons for attachment to another country One in five Europeans follow news, cultural life or sports in their preferred other countries. In Malta, half of the interviewees (49%) have this interest, followed by Denmark (38%), Slovakia (36%), Belgium, the Netherlands, Luxembourg (all 32%), Cyprus (31%) and Latvia (30%). One in seven European respondents regularly eat typical food from another country of preference at home (14%), particularly in Austria (27%), Germany (23%), Denmark (22%), Sweden (21%) and Slovakia (20%). Austria also has the highest proportion of interviewees who feel attached to another country because they have friends who came from this other country (22%, compared to 12% at EU level), followed by the Czech Republic and Latvia (both 17%). Attachment to another country because of past work experience there is stronger in the Nordic countries - Sweden (17%), Finland and Denmark (both 16%) - compared to 9% at EU level. Luxembourg has the highest percentages of interviewees (24%) who were born in other countries they feel attached to, followed by Spain (18%). These proportions are much higher than the score observed at EU level (8%). The highest percentages of respondents who say spontaneously that they have no particular reason for their feelings of attachment to their preferred other country are found in Italy (43%), Hungary (41%), Poland (37%), Bulgaria (33%), the Czech Republic (27%) and Greece (22%). However, bear in mind the small number of respondents who actually feel such affinities in these countries (except Hungary and the Czech Republic); this refusal to identify a reason might reflect the reluctance of minority groups to reveal their cultural or ethnic background. 64
67 SPECIAL EUROBAROMETER 346 NEW EUROPEANS Socio-demographic analysis reveals some interesting differences regarding the reasons underlying attachment to other countries: age, education, subjective urbanisation and financial situation are of importance, and to a lesser extent gender and occupation. Gender has almost no influence on the reasons for attachment to other countries measured in this survey. However, it can be noted that more men than women say that they follow news, cultural life and sports in the other country (23% compared to 17%). Age is clearly an important determinant of reasons for attachment to another country. Older respondents aged and 55+ are the most likely to mention holidays as a reason for attachment (34% and 33% respectively), more often than younger respondents aged and (26% and 27%). Interviewees aged are the age group the most likely to mention close friends (31%) or close relatives (27%) who live in their preferred other country. The youngest age group (15-24) are the most likely to give following news, cultural life and sports in their preferred country as a reason for attachment (23%). Education is even more important than age in this context. Here the results are more straightforward: those educated until age 20 or beyond record higher percentages for all reasons for attachment than those with lower levels of education, as can be seen in the table below. Occupational situation is of limited relevance. More managers mention holidays in their preferred other country (42%) as a reason for attachment to that country, followed by having close friends living there (33%) and eating food typical of that country (21%). House persons, on the other hand, most often mention having close relatives living in their preferred other country (29%) as a reason for attachment. Financial situation influences the reasons for attachment, for instance the ability to take holidays. Those who 'almost never' have difficulties with paying their bills, more often mention holidays (36%) than those who have financial problems 'most of the time' (15%). 65
68 SPECIAL EUROBAROMETER 346 NEW EUROPEANS QB11_QB12 And what are the three main reasons you feel attached to (COUNTRY QB10a + QB10b) Basis: those who feel attached to a first or second other country (51% of the sample) You regularly spend your holidays/ weekends in this country You have close friends who live in this country You have close relatives (brothers, sisters, children, parents) who live in this country You regularly follow news, cultural life or sports from this country You regularly eat food at home that is typical of this country Other (SPONTANEOUS) No particular reason (SPONTANEOUS) EU27 30% 28% 24% 20% 14% 22% 15% Sex Male 31% 28% 23% 23% 14% 21% 14% Female 29% 29% 25% 17% 14% 22% 16% Age % 28% 25% 23% 14% 23% 16% % 31% 27% 20% 14% 18% 15% % 29% 22% 18% 16% 22% 14% % 25% 23% 19% 12% 24% 16% Education (End of) 15-24% 20% 24% 13% 10% 22% 17% % 26% 22% 18% 13% 21% 18% % 35% 27% 23% 17% 21% 11% Still studying 26% 30% 25% 26% 15% 26% 15% Respondent occupation scale Self-employed 28% 35% 23% 19% 13% 20% 18% Managers 42% 33% 24% 23% 21% 19% 9% Other white collars 35% 27% 22% 20% 15% 20% 17% Manual workers 28% 27% 25% 19% 14% 20% 14% House persons 27% 25% 29% 13% 14% 20% 19% Unemployed 15% 28% 26% 17% 9% 21% 17% Retired 31% 25% 22% 19% 11% 25% 16% Students 26% 30% 25% 26% 15% 26% 15% Difficulties paying bills Most of the time 15% 30% 26% 18% 11% 27% 14% From time to time 21% 27% 26% 17% 12% 21% 21% Almost never 36% 28% 24% 21% 15% 21% 13% Links with other countries None 31% 22% 15% 20% 13% 25% 20% Ancestry only 34% 30% 39% 18% 18% 25% 9% Openness only 31% 37% 21% 20% 15% 16% 9% 66
69 SPECIAL EUROBAROMETER 346 NEW EUROPEANS Analysis of 'New Europeans' shows that the reasons for attachment the most often mentioned by 'New Europeans by ancestry alone' are, obviously, having relatives who live there (39%), spending holidays there (34%), and, to a lesser extent, eating food typical of that country (18%). For 'New Europeans by openness alone' the corresponding figures are 21%, 31% and 15% respectively; for 'Old Europeans' they are 15%, 31% and 13% respectively. 'New Europeans by openness alone' are more likely to mention close friends who live there (37%) than are 'New Europeans by ancestry alone' (30%) or 'Old Europeans' (22%). 'Old Europeans' resemble 'New Europeans by openness alone' in recording comparable proportions of respondents who mention spending holidays (both 31%), following news, cultural life or sports (both 20%) and eating typical national food as reasons for attachment (13% and 15%). In conclusion, personal relationships (friends, relatives) and socio-cultural interests (holiday, news, sports, culture, food) are the most common reasons for feelings of attachment to another specific country, while personal experiences (work, study) in that country are mentioned less often. This corroborates the picture regarding connectedness to other countries in general (part 1 of this report) Different levels of attachment: city, region, country and EU People can experience attachment to different geographical levels: to the municipality they inhabit (their city, town or village), to the region where they live, to their country, or to the European Union. This distinction was made to investigate if and how attachment is influenced by geographical proximity. We asked the respondents to what extent they feel attached to different geographical levels QB13 People may feel different levels of attachment to their village, town or city, to their region, to their country or to the European Union. Please tell me how attached you feel to QB13.1 Your city/ town/ village (SPLIT A) or The city/ town/ village where you live (SPLIT B) QB13.3 Your region (SPLIT A) or The region where you live (SPLIT B) QB13.5 (OUR COUNTRY) QB13.8 The European Union 67
 was asked about 'your city/town/village' and 'your region' while the other half (split B) was asked about 'the city/ town/ village where you live' and 'the region where")
70 SPECIAL EUROBAROMETER 346 NEW EUROPEANS An experiment was conducted during the survey in order to explore the influence of changes in the exact wording of the items on the results. Half of the sample (split A) was asked about 'your city/town/village' and 'your region' while the other half (split B) was asked about 'the city/ town/ village where you live' and 'the region where you live' (split B). The reason for this nuance is that it was unclear in advance whether respondents would think of their city, town, village or region of origin. The results, nevertheless, demonstrate that the changes in wording had almost no influence on the measured attachment to city/ town/ village (87% and 86% for split A and split B) and to region (88% for both split A and B). Therefore it was decided that treating the two split samples together in further analyses is justified. For the Europeans interviewed, feelings of attachment reported are mostly to a nation (93%), followed by a region (88%), and a city, town or village (87%). Feelings of attachment to the European Union are reported much less often (53%). In other words, national attachment is clearly the strongest, followed at some distance by local attachments, whether regional or even more local. 68
71 SPECIAL EUROBAROMETER 346 NEW EUROPEANS QB13 People may feel different levels of attachment to - Total 'Attached' Your city/town/village - The city/town/village where you live Your region - The region where you live (OUR COUNTRY) The European Union Mar Evo. Mar Aut Mar Evo. Mar Feb.-Mar Mar Evo. Mar Aut Mar Evo. Mar Aut EU27 87% 0 88% +3 93% +2 53% +4 BE 76% -7 80% -4 82% -2 50% -15 BG 93% -2 94% +3 95% +1 54% +14 CZ 83% +2 86% +3 92% +4 40% +1 86% -1 75% -6 98% 0 38% -5 DE 86% -1 88% +5 91% +1 55% +3 EE 85% +5 83% 0 97% +4 35% +1 IE 92% +1 92% +3 98% +5 52% +4 EL 96% -1 95% -1 99% +2 45% +8 ES 93% -2 90% +2 90% -2 61% +8 FR 73% -5 81% +1 95% +3 55% -2 IT 94% +5 95% +8 97% +6 73% +16 CY 92% +6 89% +3 98% +2 29% +4 LV 89% +2 87% +2 91% +3 49% +4 LT 89% +3 87% +4 94% +2 37% +1 LU 78% -3 87% +3 92% +1 69% +11 HU 91% +3 89% +1 97% +4 58% +8 MT 73% 0 72% -4 94% +2 50% +1 NL 64% -8 67% 0 82% -3 33% +1 AT 94% +3 93% +2 95% +2 54% +13 PL 94% +2 94% +2 99% +2 64% +1 PT 95% +2 96% +5 98% +4 54% +2 RO 95% +5 94% +2 92% +2 46% -10 SI 92% +2 91% 0 95% 0 43% -5 SK 90% +2 92% +3 96% +6 62% +20 FI 83% 0 87% -2 97% -1 33% +6 SE 82% -6 78% -5 94% -2 37% -6 UK 83% +1 85% +3 91% +7 29% +2 69
72 SPECIAL EUROBAROMETER 346 NEW EUROPEANS Attachment to city, town or village A large majority of Europeans (87%) feel attached to their city, town or village, which is exactly the same percentage as in autumn 2007 (standard Eurobarometer 68). More specifically, they felt very attached (49%), fairly attached (38%), not very attached (10%), or not at all attached (3%): these percentages are found both in 2010 and Country-by-country analysis shows that respondents attachment to their city, town or village is the strongest in Greece (96%), Portugal and Romania (95% each), Italy, Austria and Poland (94% each). In contrast, this local attachment is reported the least in the Netherlands (64%). In terms of evolutions, the largest decline in the feeling of belonging to the city, town or village of residence occurs in Belgium, down from 83% to 76% (-7% points) and in the Netherlands, where it fall from 72% to 64% (-8% points). Socio-demographic analysis reveals that the attachment to the city, town or village is stronger among older respondents (91% of those aged 55+) than among younger respondents (83% of those aged 15-24). This attachment to the city, town or village is also more important among those who left school at or before age 15 (92%) than among those who studied until 20 or later (83%). There are only few differences according to subjective urbanisation. It can be noted, however, that inhabitants of large towns (89%) are slightly more likely to be attached to their city than those living in small or mid-sized towns (85%) or rural dwellers (87%). Attachment to region A vast majority of European respondents (88%) feel attached to their region, up three points since March 2007 (67.1). More specifically, there was an increase in the number of respondents who feel attached to their region: 'very attached' rose from 45% to 47% (+2 points) and fairly attached from 40% to 41% (+1 point). Accordingly, there was a decrease in the number of respondents who do not feel attached to their region: not very attached decreased from 12% to 10% (-2 points) and not at all attached from 3% to 2% (-1 point). 70
73 SPECIAL EUROBAROMETER 346 NEW EUROPEANS Country-by-country analysis shows that highest proportions of respondents who feel attached to their region are found in Portugal (96%), Greece, Italy (both 95%), and Bulgaria, Poland and Romania (all 94%). Respondents in the Netherlands once again feel the least attachment (67%). They are followed by respondents in Malta (72%), Denmark (75%) and Sweden (78%). The strongest increase in feelings of attachment to the region occurred in Italy, from 87% to 95% (+8 points). Socio-demographic analysis reveals that respondents age also influences the extent of attachment to the region: 93% of those aged 55+ are attached to their region compared to 82% of those aged Education also plays a role: 94% of those who left school by the age of 15 feel regional attachments, compared to 84% of those whose education ended at or after the age of 20. Attachment to respondents own country The vast majority of European respondents (93%) feel attached to their country, up two points since autumn 2007 (91%). More specifically, the number of respondents who feel 'very attached' to their own country increased from 52% to 56% (+4 points), whereas there was a decrease in the number of respondents who feel fairly attached from 39% to 37%, not very attached from 7% to 6% (-1 points) and not at all attached from 2% to 1% (-1 point). The strongest increases in national attachment are in the UK, from 84% to 91% (+7 points), Slovakia, from 90% to 96% (+6 points), Italy, from 91% to 97% (+6 points), and Ireland, from 93% to 98% (+5 points). Countries with the highest proportions of respondents with a sense of national attachment are Greece, Poland (both 99%), Denmark, Ireland, Cyprus and Portugal (all 98%). The lowest proportions are found in Belgium and the Netherlands (both 82%). Socio-demographic variables have no significant influence on respondents attachment to their country, except that it is slightly stronger in the older respondents group (96% for those aged 55+) than in younger respondents group (90% for those aged 15-24). 71
74 SPECIAL EUROBAROMETER 346 NEW EUROPEANS Attachment to the EU More than half (53%) of the respondents feel attached to the European Union, which represents an increase of four points since autumn 2007 (49%). Nevertheless, national attachment is far stronger than attachment to the EU. There was an increase in the number of respondents who feel attached to the EU: 'very attached' rose from 11% to 12% (+1 point) and fairly attached from 38% to 41% (+3 points). This coincides with a decrease in the number of respondents who do not feel attached to the EU: not very attached fell from 33% to 32% (-1 point) and not at all attached from 15% to 13% (-2 points). At national level, significant increases and decreases are found. The greatest increases were found in Slovakia, from 42% to 62% (+20 points), Italy, from 57% to 73% (+16 points), Bulgaria, from 40% to 54% (+14 points) and Austria, from 41% to 54% (+13 points). The greatest declines in attachment to the EU are recorded in Belgium, from 65% to 50% (-15 points) and Romania, from 56% to 46% (-10 points). Countries with the largest proportions of respondents feeling attachment to the EU are Italy (73%), Luxembourg (69%) and Poland (64%). The lowest proportions are found in the UK, Cyprus (both 29%), Finland, the Netherlands (both 33%), Estonia (35%), Sweden, Lithuania (37% each) and Denmark (38%). Some differences can be found in accordance with the socio-demographic profile of the respondents. Attachment to the EU is stronger in younger respondents (57%) than in older respondents (50% for those aged 55+). Education and self-positioning on the social scale are also relevant as those with higher education or higher self-positioning (both 58%) are more likely to feel attached to the EU than those with the least education or who position themselves at the bottom of the social ladder (46% and 45%). Analysis of 'New Europeans' demonstrates that 'New Europeans by openness alone' feel somewhat more attachment to the EU (55%) than 'New Europeans by ancestry alone' (50%) and 'Old Europeans' (51%). 72
75 SPECIAL EUROBAROMETER 346 NEW EUROPEANS 3.4 Comparison of attachment: own country versus other countries To compare the feelings of attachment respondents have for their own country with those they have for the other two countries for which they feel an affinity, they were also asked about the extent of their feelings towards these other countries 20. The interviewees mainly report feelings of attachment to their own country (93%), followed by the first other country mentioned (66%) and then by the second (55%). Basis: item 6 asked to those who cited a first country they feel attached to (51%); Item 7 asked to those who cited a second country they feel attached to (30%). When comparing the strength of attachment Europeans feel to their own country as compared to their other two favoured countries, it appears that for respondents in all countries, without exception, their attachment to their own country is the strongest, followed by the first and second other countries of preference. Some interesting differences between countries emerge. The three Baltic countries, Estonia, Lithuania and Latvia, record considerable differences (of +56, +52 and +41 points respectively) between the degree of attachment respondents feel towards their own country and their first other country of preference. Hungary (+55 points), Poland 20 QB13 People may feel different levels of attachment to their village, town or city, to their region, to their country or to the European Union. Please tell me how attached you feel to QB13.5 (OUR COUNTRY) QB13.6 (COUNTRY QB10a) (first country cited) QB13.7 (COUNTRY QB10b) (second country cited) 73
76 SPECIAL EUROBAROMETER 346 NEW EUROPEANS (+51 points), Finland (+45 points) and the Czech Republic (+41 points) also show differences. Conversely, respondents in Luxembourg, the country with most New Europeans, demonstrate the least difference between the strength of their attachment to their country of residence and to their first other country of preference (+7 points). QB People may feel different levels of attachment to their village, town or city, to their region, to their country or to the European Union. Please tell me how attached you feel to % Total 'Attached' Item (OUR COUNTRY) Country mentioned in QB10a Basis All respondents Respondents who feel attached to another country, codes 1-29 in QB10a (OUR COUNTRY - Country QB10a) Country mentioned in QB10b Respondents who feel attached to a second other country, codes 1-29 in QB10b (Country QB10b - Country QB10a) EU27 BE BG CZ DE EE IE EL ES FR IT CY LV LT LU HU MT NL AT PL PT RO SI SK FI SE UK 93% 66% % % 66% % % 59% % +6 92% 51% % +9 98% 67% % % 75% % % 41% % +8 98% 72% % +9 99% 64% % % 57% % % 75% % +6 97% 66% % % 75% % % 50% % +8 94% 42% % % 85% +7 72% % 42% % +8 94% 60% % % 53% % % 80% % +3 99% 48% % % 61% % % 63% % +8 95% 55% % % 75% % % 52% % % 76% % % 67% % +11 The highest results per value The lowest results per value 74
77 SPECIAL EUROBAROMETER 346 NEW EUROPEANS Analysis of the answers of 'Old Europeans' and 'New Europeans' reveals that 'New Europeans by openness alone' (71%) and those 'by ancestry alone' (73%) both have much stronger attachments to another country than 'Old Europeans' (58%). Nevertheless, attachment to their country of residence is stronger in all three groups (89%, 93%, 94% respectively). Far more respondents say they are very attached to their country of residence (51%, 52%, 58%) than to their first other country of preference (16%, 20%, 9%). 'New Europeans' show more interest in and attachment to other countries than do 'Old Europeans', but these feelings are far weaker than their feelings for their own country. 75
78 SPECIAL EUROBAROMETER 346 NEW EUROPEANS 3.5 Belonging to a group The feeling of belonging to a group is an important aspect of the quality of life and it may influence the extent to which respondents feel attached to a place. A distinction can be made between majority and minority groups. We asked respondents whether they feel they belong to one of the majority groups in their country or to a minority group in terms of religion, culture or ethnic origin. Furthermore, the feeling of belonging to a group may be determined both by self-identification and by our impression of how others perceive us. Therefore we asked the respondents both questions 21. Nevertheless, there appears to be no significant differences between the two: a majority of respondents feel that they belong to a majority group (70%) and/or feel that other people in their country generally perceive them as belonging to a majority group (70%). Nearly one in ten respondents feel that they belong to a minority group (9%) and/or feel that others have that perception (8%). Remarkably, a sizeable relative minority (16%) spontaneously answer neither group, as opposed to the 5% who either say that they did not know or refused to answer. The members of this sizeable minority might feel they do not belong to any group. The second group may not answer because they feel that they belong at once to a majority and a minority group and do not (wish to) make a choice between them. There is also a small but significant minority of 14% that spontaneously answered neither group when asked how they feel that other people perceive them as opposed to the 8% who said that they did not know or refused to answer. 21 QB14 For each of the following statements, please tell me which situation applies to you. QB14.1 You have the feeling that you belong to QB14.2 You have the feeling that people in (OUR COUNTRY) generally perceive you as belonging to 76
79 SPECIAL EUROBAROMETER 346 NEW EUROPEANS This absence of difference between the two dimensions (self perception and feeling of being perceived by the others) can be interpreted in several ways. It is possible that an individual s feeling of belonging to a group corresponds objectively to the perception of others. However, it could be that the two variables are interrelated: the feeling of belonging to a group is influenced by how respondents think others perceive them. In other words, someone may see himself as belonging to a minority group because that is how he thinks he is perceived by others. Feelings of belonging to a group Country-by-country analysis shows that the highest proportions of respondents who feel they belong to a majority group are found in Denmark (91%), Finland (90%), Cyprus (88%), the Netherlands (87%), Sweden (87%), the Czech Republic (85%) and Bulgaria (82%). In contrast, the highest proportions of respondents who feel they belong to a minority group are found in Luxembourg (18%), the UK (14%) and Spain (13%). Once again, Luxembourg stands out: this confirms the special situation of Luxembourg previously highlighted when it comes to connection with other countries. Furthermore, respondents in Portugal (46%), Greece (29%), France (28%) and Italy (26%) are most likely to report that they feel they do not belong to either group. 77

.")
.")
80 SPECIAL EUROBAROMETER 346 NEW EUROPEANS Socio-demographic analysis reveals some differences regarding education, occupation and standard of living. The longer they have remained in education, the more likely it is that respondents feel that they belong to a majority group (74% of those educated to age 20 or beyond, compared to 68% of those who left school at 15 or earlier). Managers are thus most likely to feel they belong to a majority group (78%) and the unemployed least likely (65%). Respondents without employment are most likely to feel that they belong to a minority group (13%). Last but not least, those who have difficulties with paying their bills are more likely to feel they belong to a minority group: 14 % of respondents who have such difficulties, as compared to 7% of those who almost never have these problems. 78
81 SPECIAL EUROBAROMETER 346 NEW EUROPEANS Analysis of 'New Europeans' shows that those 'by ancestry alone' significantly more often (14%) feel they belong to a minority group than those 'by openness alone' (8%) and 'Old Europeans' (6%). In short, 'New Europeans by ancestry' are more likely to feel that they do not belong to the majority group, which is not the case for 'New Europeans by openness'. QB14.1 For each of the following statements, please tell me which situation applies to you. You have the feeling that you belong to One of the majority groups in (OUR COUNTRY) One of the minority groups in (OUR COUNTRY) in terms of religion, culture or ethnic origin Neither one nor the other No specific group (SPONTANEOUS) Refusal (SPONTANEOUS) EU27 70% 9% 16% 1% 4% Education (End of) 15-68% 9% 16% 2% 5% % 8% 17% 1% 4% % 9% 13% 1% 3% Still studying 72% 9% 14% 1% 4% Respondent occupation scale Self- employed 70% 8% 17% 1% 4% Managers 78% 8% 10% 1% 3% Other white collars 71% 8% 17% 1% 3% Manual workers 68% 11% 16% 1% 4% House persons 66% 8% 18% 1% 7% Unemployed 65% 13% 16% 2% 4% Retired 71% 7% 16% 1% 5% Students 72% 9% 14% 1% 4% Difficulties paying bills Most of the time 61% 14% 17% 1% 7% From time to time 64% 10% 19% 2% 5% Almost never 75% 7% 13% 1% 4% Ancestry/ Roots abroad Yes 59% 21% 16% 1% 3% No, none 73% 6% 16% 1% 4% Openness to other countries Yes 64% 17% 15% 1% 3% No, none 72% 6% 16% 1% 5% Links with other countries None 72% 6% 16% 1% 5% Ancestry only 66% 14% 15% 1% 4% Openness only 75% 8% 14% 1% 2% 79


82 SPECIAL EUROBAROMETER 346 NEW EUROPEANS 3.6 Reasons for belonging to a group People s own perceptions or the feeling of being perceived by others as belonging to a majority or minority group, can have various reasons. Respondents were therefore asked why they think other people in their country perceive them as belonging to a specific group QB15 Regardless of whether you or others think that you belong to the majority or to a minority group, for which of the following reasons, if any, could people in (OUR COUNTRY) perceive you as belonging to a specific group? If you have no opinion or prefer not to answer, please say so. 80
83 SPECIAL EUROBAROMETER 346 NEW EUROPEANS Firstly, about one in three Europeans think it is because of their language or accent (34%) and/or their culture, values or lifestyle (30%) that people in their country perceive as belonging to a specific group. Secondly, interviewees often mention ethnic or origin characteristics: skin colour and/or ethnic origin (22%), the area where they live (19%), their religion (17%) and their name (15%). Thirdly, they quote their physical condition or appearance (14%) and to a lesser extent the way they dress (9%), their age (7%) and their occupation (7%). Country-by-country analysis reveals a general pattern. The great majority of countries record the same two chief reasons for being seen as belonging to a group, but there are differences with respect to the third most prevalent reason. Socio-demographic analysis shows a general pattern in which young respondents are the most likely to cite almost all the reasons for being seen as belonging to a group. This also goes for those who are more highly educated and those who place themselves higher on the social ladder, perhaps because of greater awareness of discrimination. 'New Europeans' are not very different from 'Old Europeans' in this respect, with the exception of skin colour and name as reasons for being perceived as belonging to a group. A more detailed analysis of country-by-country and socio-demographic results will be conducted in the next section. 81
84 SPECIAL EUROBAROMETER 346 NEW EUROPEANS QB15 Regardless of whether you or others think that you belong to the majority or to a minority group, for which of the following reasons, if any, could people in (OUR COUNTRY) perceive you as belonging to a specific group? If you have no opinion or prefer not to answer, please say so. (MULTIPLE ANSWERS POSSIBLE) Your language or accent Your culture, values, lifestyle Your skin colour or ethnic origin The area where you live Your religion EU27 34% 30% 22% 19% 17% Age % 29% 28% 19% 19% % 30% 23% 18% 16% % 32% 23% 19% 17% % 28% 17% 20% 17% Education (End of) 15-33% 25% 18% 19% 19% % 29% 22% 20% 16% % 34% 24% 17% 17% Still studying 38% 34% 29% 19% 19% Respondent occupation scale Self- employed 35% 30% 22% 18% 18% Managers 40% 35% 30% 18% 17% Other white collars 38% 36% 23% 20% 17% Manual workers 33% 28% 22% 18% 15% House persons 34% 28% 20% 19% 18% Unemployed 27% 25% 19% 17% 14% Retired 31% 27% 17% 20% 18% Students 38% 34% 29% 19% 19% Difficulties paying bills Most of the time 28% 25% 19% 18% 15% From time to time 32% 29% 21% 18% 18% Almost never 36% 31% 23% 20% 17% Self-positioning on the social staircase Low (1-4) 29% 25% 20% 17% 16% Medium (5-6) 34% 30% 22% 19% 18% High (7-10) 39% 35% 24% 21% 17% Ancestry/ Roots abroad Yes 37% 28% 25% 14% 17% No, none 34% 31% 22% 20% 17% Openness to other countries Yes 38% 31% 24% 14% 16% No, none 33% 30% 21% 20% 17% Links with other countries None 34% 30% 21% 21% 17% Ancestry only 32% 28% 26% 17% 18% Openness only 34% 32% 26% 18% 16% * First five items 82
85 SPECIAL EUROBAROMETER 346 NEW EUROPEANS Language or accent Slightly more than a third (34%) of the respondents generally think that their language or accent is one of the most obvious reason why other people in their country classify them as belonging to a specific group. Country-by-country analysis shows that respondents are the most likely to think that language or accent matters in Greece (50%), Ireland (49%), Sweden (48%), Austria (48%), Germany (45%) and the UK (45%). In contrast, at the other end of the scale respondents in Lithuania (14%), France (18%) and Hungary (19%) are the least likely to believe this. 83

86 SPECIAL EUROBAROMETER 346 NEW EUROPEANS Socio-demographic analysis reveals that there are not many differences apart from occupation, financial situation and self positioning on the social scale. Only 27% of the unemployed think that their language or accent is of importance, compared to 40% of managers. Those who almost never have problems paying their bills (36%) are more likely to think that their language or accent is a major reason why other people classify them as belonging to a specific group than those who have such problems most of the time (28%). Accordingly, those who position themselves higher on the social scale (39%) more often think this is the case than those who place themselves towards the bottom (29%). Culture values and lifestyle Just short of a third (30%) of the European respondents think that their culture, values or lifestyle make other people in their country perceive them as belonging to a specific group. 84
87 SPECIAL EUROBAROMETER 346 NEW EUROPEANS Country-by-country analysis shows that Cyprus (56%) leads the ranking in this respect, followed at some distance by Malta (45%), Sweden (42%), Austria (41%), the Netherlands (41%) and Estonia (40%). The fewest respondents with this opinion are found in Lithuania (13%), Poland (18%), France (19%), Romania (21%), Portugal (22%) and Finland (24%). Socio-demographic analysis reveals that education, occupation, financial situation and self positioning on the social ladder are all significant. As the level of education increases, respondents are more likely to believe that their culture, values or lifestyle make others perceive them as belonging to a specific group. One third (34%) of those educated to age 20 or beyond hold this belief, whereas this figure shrinks to one quarter (25%) for those who left school at 15 or earlier. Managers (36%) and white collar workers (36%) are more likely to take this view than the unemployed (25%). Those who 'almost never' have difficulties paying their bills (31%) and respondents who position themselves high on the social scale (35%) are more likely to mention culture, values and lifestyle as a major reason than those who have difficulties paying their bills 'most of the time' and those who place themselves at the bottom of the social ladder (both 25%). Other reasons for being perceived as belonging to a group are mentioned less often, but there are some striking results. The area where one lives is of importance in Estonia (35%) and the Czech Republic (33%), compared to 19% at EU level. Religion is more important in the Mediterranean countries of Cyprus (49%), Greece (43%) and Malta (36%), compared to 17% at EU level, while a person s name and physical appearance is very influential in Sweden (44% and 36% respectively, compared to 15% and 14% at EU level). 85
88 SPECIAL EUROBAROMETER 346 NEW EUROPEANS ***** A general pattern emerged regarding respondents attachment to specific countries other than their country of residence, reflecting historical-cultural (language) communalities or merely geographical proximity. The analysis of reasons for attachment to other countries reveals that personal relationships (friends, relatives) and socio-cultural interests (holidays) are the most common reasons, while personal experiences (work, study) in the other country are mentioned less often. There are only limited differences between 'New and Old Europeans'. Analysis of attachment at different geographical levels shows that attachment to the country of residence is by far the strongest, followed at some distance by regional or even more local attachments. Attachment to the EU is less strong, though it has increased since 'New Europeans by openness alone' are slightly more inclined to feel attachment to the EU than 'New Europeans by foreign ancestry' alone and 'Old Europeans', though the difference is small. Europeans strength of attachment to their own country is by far stronger than the strength of attachment to their favoured other countries. Both types of 'New Europeans' feel stronger attachment to their favoured other countries than 'Old Europeans' do, but still all three groups are most attached to their own country. A minority - not quite one in ten - feel they belong to a minority group. 'New Europeans by ancestry alone' are more likely to feel that they belong to a minority group than 'New Europeans by openness alone' and 'Old Europeans'. 86
89 SPECIAL EUROBAROMETER 346 NEW EUROPEANS 4. IDENTITY This last section of the report addresses the multi-dimensional concept of identity. Identity can, for example, be considered a matter of self-expression, citizenship, loyalty or group membership. Identity can also vary from one level to another: one s regional, national and European identity can indeed be very different. Respondents were asked about the most important characteristics of being a national of their country of residence, and about how European they feel National identity We saw in the previous part of the report that almost all respondents feel most attached to their own country, i.e. not only more than to other countries, but also more than to their region, city, town or village. This is the case in every EU Member State. Respondents were then asked what they think are the most important characteristics of being a national of their country QB1 People differ in what they think it means to be (NATIONALITY). In your view, among the following,what do you think are the most important characteristics to be (NATIONALITY)? 87
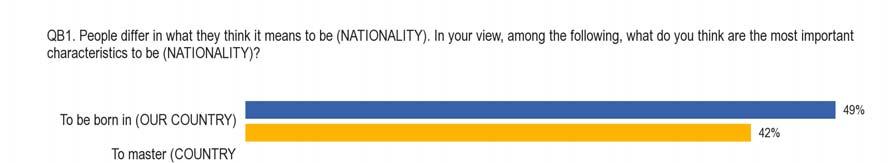
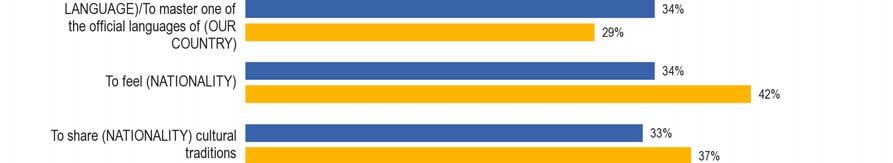


90 SPECIAL EUROBAROMETER 346 NEW EUROPEANS 88
91 SPECIAL EUROBAROMETER 346 NEW EUROPEANS Almost half of the respondents think that being born in that country is an important characteristic of national feeling (49%). It is by far the most cited aspect. This is followed by four characteristics, all mentioned by approximately equal proportions of respondents: mastering a country s national language (34%), feeling of that nationality (34%), sharing cultural traditions (33%) and exercising citizens rights, for example by voting (33%). Over a quarter of the interviewees say that to have been brought up in that country (28%) is an important characteristic of being a national of that country. Mentioned less often, but still significant, is having at least one parent of that nationality (18%). The least frequently cited characteristics are being a Christian (9%) and being active in any association or organisation in that country (3%). Comparing these figures with spring 2009 (Standard Eurobarometer 71), there are some interesting changes. Firstly, the largest difference is that feeling of that nationality has lost quite some significance, having dropped 8 points from 42% to 34%, while at the same time being born in that country has clearly gained importance, up 7 points from 42% to 49%. While these two items were equally ranked in first place in June 2009, there is now a 15 percentage point difference between them. Secondly, characteristics which are mentioned by an increasing number of interviewees are mastering a country s national language, from 29% to 34% (+5 points), having at least one parent of that nationality, from 13% to 18% (+5 points), exercising citizens rights, for example by voting, from 29% to 33% (+4 points), and having been brought up in that country, from 25% to 28% (+3 points). Thirdly, the characteristics mentioned less often than in spring 2009 are besides feeling of that nationality as noted above sharing national cultural traditions, down from 37% to 33% (-4 points), being active in any association or organisation, from 5% to 3% (-2 points) and being a Christian (from 10% to 9% (-1 point). To sum up, the determining factors of the national identity seem to have changed since spring 2009 in the sense that the emphasis on the most elusive, subjective concepts (feeling, sharing, believing) is diminishing, while there is a growing emphasis on the most objective, concrete concepts (places of birth of the respondents and their parents, place of upbringing, language skills and civil rights). Country-by-country analysis reveals that being born in that country is indeed the primary characteristic of national identity in 13 Member States: Portugal (69%), Malta (68%), Ireland (65%), Cyprus (64%), Spain (63%), Romania (63%), Bulgaria (58%), the Czech Republic (56%), the United Kingdom (55%), Italy (53%), Greece (51%), Belgium (50%) and Poland (45%). Conversely, it is least important in Sweden (22%) and Denmark (25%). 89
92 SPECIAL EUROBAROMETER 346 NEW EUROPEANS In other countries, mastering a national language is of more importance: Estonia (66%), Denmark (65%), Germany (62%), Lithuania (59%), the Netherlands (58%), Austria (53%), Slovakia (53%), Luxembourg (51%) and Slovenia (46%). Across the EU, mastering a national language is least important in Portugal (4%). Feeling of the relevant nationality is the most prominent characteristic in Hungary (63%), Sweden (56%), Finland (52%) and Latvia (46%). It is least important in Germany, Italy and Ireland (all 24%). Exercising the rights of a citizen is the most significant characteristic in France (50%). This characteristic is also quite important in Sweden (54%), almost as important as feeling Swedish (56%). Exercising citizens rights is least often mentioned in Spain (20%), Portugal and Lithuania (both 21%). Shared cultural traditions are not the leading characteristic in any of the countries surveyed; at its highest it is in second place. It is mentioned most frequently in Denmark (49%), Belgium (45%) and Luxembourg (42%). Countries where sharing cultural traditions is mentioned least often are Spain (19%), Portugal, Slovakia and Hungary (all 20%). Having been brought up in that country is the most often considered important in Finland (46%) and the Czech Republic (41%), and the least often in Greece (14%) and Luxembourg (16%). Having at least one parent of that nationality is the most frequently considered important in Cyprus (48%) and Greece (44%). It is the least important to those in Sweden, Denmark and Latvia (all 9%). Being a Christian is more cited in Romania (36%), Cyprus (35%), Greece (33%) countries with a strong religious tradition - and Malta (29%) as compared to Sweden and the Czech Republic (2% each), the Netherlands, Belgium, Spain and Estonia (all 3%). Being active in any association or organisation in that country is mentioned the most often in Denmark (9%) and the Netherlands (8%). 90
93 SPECIAL EUROBAROMETER 346 NEW EUROPEANS QB1 People differ in what they think it means to be (NATIONALITY). In your view, among the following, what do you think are the most important characteristics to be (NATIONALITY)? (ROTATE MAX. 3 ANSWERS) To be born in (OUR COUNTRY) To feel (NATIONALITY) To master (COUNTRY LANGUAGE)/To master one of the official languages of (OUR COUNTRY) To share (NATIONALITY) cultural traditions To exercise citizens' rights, for example voting in (OUR COUNTRY) To have been brought up in (OUR COUNTRY) To have at least one (NATIONALITY) parents To be a Christian Being active in any association or organization in (OUR COUNTRY) EU27 BE BG CZ DE EE IE EL ES FR IT CY LV LT LU HU MT NL AT PL PT RO SI SK FI SE UK 49% 34% 34% 33% 33% 28% 18% 9% 3% 50% 41% 29% 34% 36% 29% 15% 3% 4% 58% 48% 15% 45% 27% 20% 24% 26% 1% 56% 37% 49% 24% 29% 41% 20% 2% 2% 25% 44% 65% 49% 47% 22% 9% 5% 9% 40% 24% 62% 29% 36% 35% 17% 4% 1% 37% 51% 66% 38% 24% 28% 18% 3% 5% 65% 24% 3% 30% 29% 39% 24% 13% 6% 51% 44% 12% 29% 29% 14% 44% 33% 1% 63% 42% 8% 19% 20% 29% 17% 3% 4% 42% 40% 43% 41% 50% 17% 18% 4% 5% 53% 24% 19% 40% 38% 25% 15% 13% 4% 64% 28% 16% 36% 40% 19% 48% 35% 3% 33% 46% 37% 41% 33% 26% 9% 6% 4% 48% 34% 59% 30% 21% 21% 28% 12% 3% 41% 42% 51% 42% 33% 16% 12% 6% 7% 37% 63% 30% 20% 33% 20% 31% 6% 4% 68% 31% 13% 30% 31% 36% 19% 29% 1% 36% 48% 58% 37% 43% 29% 11% 3% 8% 45% 29% 53% 41% 28% 39% 17% 7% 4% 45% 43% 32% 31% 24% 23% 13% 16% 1% 69% 31% 4% 20% 21% 33% 24% 5% 1% 63% 26% 29% 30% 23% 24% 15% 36% 1% 41% 40% 46% 37% 33% 21% 24% 10% 3% 45% 46% 53% 20% 35% 33% 20% 7% 2% 48% 52% 31% 31% 37% 46% 13% 10% 4% 22% 56% 52% 31% 54% 22% 9% 2% 3% 55% 26% 22% 36% 24% 36% 21% 5% 6% Highest percentage per item Lowest percentage per item 91
94 SPECIAL EUROBAROMETER 346 NEW EUROPEANS Compared to spring 2009 (Standard Eurobarometer 71), significant changes occurred at a national level which show a general shift from subjective aspects to more objective ones in the make up of national identity. Being born in the country has gained importance considerably at the expense of feeling of being the relevant nationality in several countries. The most striking drops in the latter accompanied by a significant increase in the former are found in Lithuania (-20 points from 54% to 34% and +12 points from 36% to 48%) 24 and Luxembourg (-16 points from 58% to 42% and +13 points from 28% to 41%). Impressive changes for both items are also noted in Cyprus (-15 points, from 43% to 28% and +16 points from 48% to 64%), Malta (-15 points, from 46% to 31% and +8 points from 60% to 68%) and Romania (-12 points, from 38% to 26% and +14 points from 49% to 63%). 24 The first percentage is the result of to be born in (OUR COUNTRY) ; second percentage: to feel (NATIONALITY). 92

, being raised in that country (30% versus 25%) and being")

, feeling as")
95 SPECIAL EUROBAROMETER 346 NEW EUROPEANS Socio-demographic analysis reveals the influence of education on all nine characteristics of national identity. Those who left school at 15 or earlier put more emphasis than those who studied till 20 or after on being born in that country (57% versus 39%), being raised in that country (30% versus 25%) and being a Christian (13% versus 6%). The better educated, in turn, put more emphasis on all the remaining characteristics. The following differences are found between those who finished education at 15 or before and those who studied to 20 or beyond: exercising civil rights, such as voting (25% versus 41%), feeling as being of that nationality (31% versus 39%), sharing cultural traditions (28% versus 39%) and mastering a national language (28% versus 38%). 93
96 SPECIAL EUROBAROMETER 346 NEW EUROPEANS Turning to age, the youngest respondents aged attached the least weight (27%) to sharing cultural traditions compared to all older age groups (33% to 34%), while the oldest respondents aged 55+ attach more importance (13%) to being a Christian than all the younger groups (6% to 7%). Analysis of 'New Europeans' shows that 'Old Europeans' tend to attach more importance to being born in their country (54%) compared to either type of 'New Europeans' (42% and 43%); 'Old Europeans' also attach less importance to citizens rights (31%) compared to 'New Europeans' (both 37%). 'New Europeans by openness alone' most often mention the sharing of cultural traditions (37%) as an important aspect of national identity, compared to 'Old Europeans' (32%) and 'New Europeans by ancestry alone' (31%). 'New Europeans by ancestry alone' in turn, stand out by being the most likely (42%) to mention mastering the national language as an important element of national identity, compared to both 'Old Europeans' (32%) and 'New Europeans by openness alone' (35%). 94


97 SPECIAL EUROBAROMETER 346 NEW EUROPEANS 4.2 European identity Elements of European identity More than half (53%) of the Europeans surveyed feel attached to the European Union. To gain more insight into this connectedness to Europe, we asked respondents what they think are the most important elements of European identity QB2 In your opinion, which of the following are the two most important elements that go to make up a European identity? 95
98 SPECIAL EUROBAROMETER 346 NEW EUROPEANS The most important elements, each mentioned by around a third of the respondents, are the euro (36%) and democratic values (32%). The next two most defining elements are geography and common culture (each mentioned by 22%). They are followed by common history (17%), the high level of social protection (13%) and by symbols flag, hymn and motto unity in diversity (11%). Only a small minority mentioned common religious heritage (5%). Finally, only 3% of the Europeans surveyed answered spontaneously that there is no such thing as a European identity. Compared with the last time this question was asked, in Standard Eurobarometer 71 (spring 2009), the question had changed with the introduction of two new elements in 2010, namely the euro and the symbols flag, hymn and motto. The great importance given to the euro (36%) and to a much lesser extent that of symbols (11%) as primary elements of European identity seems to be at the expense of the other elements; the euro and the symbols have pushed the other elements down from their previous ranks because respondents were allowed to choose only two elements. This means that comparison of the 2009 and 2010 results is unjustified, because the group of elements from which the respondents had to choose in 2010 is not the same as in The results are nevertheless presented here for information. In spring 2009, democratic values stood out as the leading element in European identity, followed by four elements (geography, high level of social protection, common history and common culture). Now, the introduction of the two new items has led to the emergence of a much clearer hierarchy of elements, with the euro in first place. On this question, interesting differences can be seen between groups of countries: euro zone countries far more often (46%) consider the euro as an important element of European identity than the remaining EU Member States (18%). The single currency is also of more importance to the fifteen old Member States (39%) than to the twelve new Member States 26 (25%), as well the democratic values (34% compared to 24%). For the new Member States, in turn, common history and symbols are more important as elements of European identity (22% and 17%) than for the old Member States (16% and 9%). 26 Old Member States are those that joined the EU before New Member States are those that have acceded to the EU from 2004 onwards. 96
99 SPECIAL EUROBAROMETER 346 NEW EUROPEANS QB2 In your opinion, which of the following are the two most important elements that go to make up a European identity? (ROTATE MAX. 2 ANSWERS) The single currency, the Euro Democratic values Geography Common culture Common history EU27 36% 32% 22% 22% 17% EU accession date EU15 39% 34% 22% 22% 16% NMS12 25% 24% 23% 22% 22% Using the European single currency Euro zone 46% 34% 22% 22% 16% Non euro zone 18% 28% 24% 23% 19% Country-by-country analysis shows that the euro is indeed the most important element in 17 Member States: Slovenia (61%), France (59%), Slovakia (57%), Belgium, Finland (55% each), Greece (53%), Ireland (52%), the Netherlands (49%), Luxembourg (48%), Spain (48%), Malta (45%), Italy (39%), Portugal (39%), Germany (38%), Estonia (34%), Latvia (31%) and Romania (29%). Note that the last three countries named are not in the euro zone at present (although Estonia will join on 1 January 2011). The euro is the least important in the United Kingdom (12%), Sweden (17%), Hungary and Denmark (each 18%), all non-euro zone countries. Another important element of European identity is democratic values. It is the most important element in six Member States: Sweden (71%), Denmark (65%), Cyprus (51%), Austria (40%), Lithuania (34%) and the Czech Republic (31%). Two other important elements are geography, the most important element in Bulgaria (35%) and common culture, the most important element in the United Kingdom (26%) and Poland (25%). Finally, common history is the most important in Hungary (33%). Socio-demographic analysis reveals that almost all categories selected the euro as the most important element in a European identity. The longer educated are an exception in this respect, putting democratic values in first position (43%), before the euro (35%). The importance of democratic values as an element of European identity is influenced by education and age. Those who left education at 20 or beyond mention democratic values much more often than those who left school at 15 or earlier (43% versus 23%). Regarding age, those aged mentioned democratic values more often (35%) than the youngest respondents (27%). 97
100 SPECIAL EUROBAROMETER 346 NEW EUROPEANS The importance of geography as an element of European identity is influenced slightly by gender, education and age. More men (24%) than women (20%) mention geography as an element of European identity, as do more of those who were educated until the age of 20 or beyond (25%) compared with those who left school at the age of 15 or earlier (20%). The older respondents, 55+, mention geography less often (20%) than those in the and age groups (23% each) and those aged (25%). Young interviewees attribute more importance to symbols the flag, the hymn and the motto 'unity in diversity' as elements of European identity. Some 17% of those aged mention this aspect, as compared to 12% of those aged 25-39, 10% of those aged and 8% of the oldest respondents 55+. In terms of 'New Europeans' there appear to be no significant differences regarding important elements of European identity, except that democratic values are mentioned more often by 'New Europeans by ancestry alone' (36%) and 'New Europeans by openness alone' (38%) than by 'Old Europeans' (30%). 98
 of respondents indicate that being European matters to them, whereas four in ten (40%) say it does not matter.")
101 SPECIAL EUROBAROMETER 346 NEW EUROPEANS Importance of European identity Respondents were then asked to indicate how important it is for them to be European 27. Almost six in ten (58%) of respondents indicate that being European matters to them, whereas four in ten (40%) say it does not matter. Compared to the last time this question was asked (Standard Eurobarometer 71, spring 2009), the proportion of those to whom it matters a lot increased from 15% to 18% (+3 points), at the expense of those to whom it matters somewhat, which declined from 43% to 40% (-3 points). On the other hand, the proportion of respondents saying that it does not matter to them at all increased from 13% to 15% (+2 points). Opinion thus seems slightly more polarised than in June QB3 Thinking now about the fact that you are European, how important is being European to you personally? Being European 99
, the Czech Republic (73%), Slovakia (73%), Austria (72%), and Finland (70%). At the other end of the scale, the lowest percentages are recorded in the United Kingdom (34%) and Latvia (39%).")
102 SPECIAL EUROBAROMETER 346 NEW EUROPEANS At the national level, the highest percentages of respondents to whom being European matters personally are found in Italy (82%), Hungary (76%), Luxembourg (74%), the Czech Republic (73%), Slovakia (73%), Austria (72%), and Finland (70%). At the other end of the scale, the lowest percentages are recorded in the United Kingdom (34%) and Latvia (39%). A comparison with the spring 2009 national results shows that the Member States with growing proportions of respondents to whom being European matters are Italy, with a great leap from 58% to 82% (+24 points), Austria, up from 64% to 72% (+8 points) and Hungary, up from 71% to 76% (+5 points). Seventeen Member States saw a decline in the perceived importance of being European, with the largest falls in Estonia, down from 73% to 54% (-19 points), Denmark, down from 75% to 56% (-19 points), Cyprus, down from 64% to 48% (-16 points) and Slovenia, down from 74% to 58% (-16 points). 100
103 SPECIAL EUROBAROMETER 346 NEW EUROPEANS Socio-demographic analysis reveals that education and occupation are of influence: the more educated, the more it matters to be European. Indeed, 65% of those who studied until the age of 20 or beyond and 63% of the self-employed and white-collar workers indicate that it matters to them personally, as compared to 53% of those who finished school at the age of 15 or earlier, 55% of the manual workers, and 51% of the unemployed. No significant differences were found between 'New Europeans' and 'Old Europeans' in terms of their opinion on the importance of being European. ***** Generally speaking, attitudes towards identity vary from country to country but also between socio-demographic groups, such as those with different levels of education. However, it seems that being an 'Old European' or a 'New European' has only a limited impact on attitudes and opinions regarding European identity, and this is an important finding of this survey. 101
104 SPECIAL EUROBAROMETER 346 NEW EUROPEANS CONCLUSION In the light of a general interest in European connectedness or 'Europeanness', the purpose of this study was to gain insight in the concept of 'New Europeans': people who live in the EU and have connections with more than just the country where they reside. The first challenge was to identify these 'New Europeans' and then to gain insight into the varying degrees of connectedness, which involves diverse and complex connections. This report approached connectedness from four angles: different types of connection, Europeans plans to emigrate, feelings of attachment to places and belonging to groups, and identity. Four different types of connectedness were discerned: Firstly, varying degrees of connectedness may exist through family descent. One in fourteen Europeans were born in a country other than their country of residence, one in ten have at least one parent born abroad, and one in eight have at least one grandparent born abroad. Symmetrically, around two out of ten Europeans have at least one grandparent who was born with a different citizenship than that of the respondent s country of residence. Secondly, personal relationships with people from or in other countries appear to be the most widespread type of connection within Europe among those analysed in this survey. Four in ten Europeans have close friends living in another country, more than a quarter have close friends who came from abroad and/or close relatives brothers, sisters, children, parents who live abroad. One out of twelve Europeans live or have lived with a partner of a different citizenship than their own. Thirdly, personal experiences abroad are less widespread, but significant. Almost one in eight Europeans have worked abroad, one in twelve have studied abroad, and one in ten have lived abroad for other reasons. Finally, one in thirty Europeans own a real property abroad. Fourthly, socio-cultural links with other countries are widespread. More than one-third of Europeans regularly eat food typical of another country, follow news, cultural life or sports from another country, are fluent in at least one foreign language or regularly spend holidays or weekends abroad. 102
105 SPECIAL EUROBAROMETER 346 NEW EUROPEANS More than one in ten Europeans plan to move to another country within the next ten years, half of them expecting to move to another EU Member State. On this question, being 'Old European' or 'New European' influences respondents attitudes significantly: for 'New Europeans by ancestry alone', moving abroad is more likely (15%), and even more so for 'New Europeans by openness alone' (19%). By contrast, only one in twenty 'Old Europeans' expect to move to another country. Around half of Europeans feel some attachment to a country other than the country in which they live. Around two in three 'New Europeans by ancestry alone', and close to three in four 'New Europeans by openness alone' feel attached to at least one country other than their country of residence, compared to 41% of the 'Old Europeans'. Analysis of attachment at different geographical levels shows that national attachment is by far the strongest. More than nine in ten Europeans feel attachment to their own country (of residence). This is followed at some distance by regional or even more local attachment (city/town/village). Attachment to the EU is mentioned by slightly more than one in two Europeans, thus less frequently than attachment to the lower geographical levels in all EU Member States. Nevertheless, attachment to the EU has increased since 2007, but so did national attachment. 'New Europeans by openness alone' are more likely to feel attachment to the EU than 'New Europeans by ancestry alone' and 'Old Europeans'. Europeans strength of attachment to their own country (of residence) is far stronger than that to their other favoured countries: there is no exception to this pattern, which is seen in all Member States and among all socio-demographic categories. Both types of 'New Europeans' feel stronger attachment to their other favoured countries than 'Old Europeans' do, but all three types of Europeans are still most attached to their own country. A general pattern emerged regarding respondents attachment to specific countries other than their country of residence, reflecting common historical-cultural (language) factors or merely geographical proximity. The top three reasons for attachment to other countries are spending holidays there, followed by having close friends and close relatives who live in that other country. 'New Europeans by ancestry' mostly mention holidays and close relatives abroad, while 'New Europeans by openness' more frequently mention having friends living there as reasons for attachment to another country. 103
106 SPECIAL EUROBAROMETER 346 NEW EUROPEANS Turning to feelings of belonging to a group, seven in ten Europeans feel that they belong to a majority group and almost one in ten feel they belong to a minority group: similar proportions are seen when it comes to the way respondents feel they are perceived by others. 'New Europeans by ancestry alone' are also more likely to feel that they belong to a minority group than 'New Europeans by openness alone' or 'Old Europeans'. Europeans own feelings and their feelings about other people s perception of reasons to belong to a specific group emphasise the importance of language, culture, values and lifestyle. There are no differences in this respect between 'Old Europeans' and 'New Europeans'. Both national identity and European identity were explored. By far the most important element that makes up Europeans national identity is to be born in their country. This is followed by four equally important factors: mastering the national language, feeling of that nationality, sharing cultural traditions and exercising citizens rights, for example voting. In general, national identity seems to have changed since spring 2009 in the sense that the emphasis on the more elusive, subjective concepts (feeling, sharing, believing) is diminishing, whereas there is a growing emphasis on the more objective, concrete concepts (birthplaces of respondents and their parents, place of upbringing, language skills and civil rights). 'New Europeans' attach less importance to being born in their country as a determinant of national identity and more on exercising citizens rights than 'Old Europeans'. 'New Europeans by openness' most often mention the sharing of cultural traditions and feeling of the appropriate nationality as important aspects of national identity, whereas 'New Europeans by ancestry' identify mastering the national language of their country of residence. Elements that make up European identity are clearly the single currency and democratic values, particularly in the euro area and in Member States that have joined the EU since These are followed at some distance by geography, common culture and shared history. Six in ten Europeans say that being European is important to them, the same as in spring Regarding 'Old Europeans' and 'New Europeans', there are no significant differences in the context of European identity, the only exception being that 'New Europeans' consider democratic values to be more important as an element of European identity than 'Old Europeans' do. 104
107 SPECIAL EUROBAROMETER 346 NEW EUROPEANS Overall, the most widespread type of connection with another country is through personal relationships (close relatives or friends that come from or live in another country). However, the other types of connectedness with other countries are not insignificant. Regardless of their type of connection across borders, 'New Europeans' attitudes and opinions differ from those of 'Old Europeans' in the sense that they are much more attached to countries other than their own, and more tempted to move abroad in the coming years. However, when it comes to identity national and European - the differences between 'New Europeans' and 'Old Europeans' are relatively limited and sometimes even insignificant. 105
108
109 ANNEXES
110 TECHNICAL SPECIFICATIONS
111 EUROBAROMETER SPECIAL N 346 TECHNICAL SPECIFICATIONS Between the 12 th of March and the 1st of April 2010, TNS Opinion & Social, a consortium created between TNS plc and TNS opinion, carried out the wave of the EUROBAROMETER, on request of the EUROPEAN COMMISSION, Directorate-General for Communication, Research and Political Analysis. The SPECIAL EUROBAROMETER N 346 is part of the wave and covers the population of the respective nationalities of the European Union Member States, resident in each of the Member States and aged 15 years and over. The basic sample design applied in all states is a multi-stage, random (probability) one. In each country, a number of sampling points was drawn with probability proportional to population size (for a total coverage of the country) and to population density. In order to do so, the sampling points were drawn systematically from each of the "administrative regional units", after stratification by individual unit and type of area. They thus represent the whole territory of the countries surveyed according to the EUROSTAT NUTS II (or equivalent) and according to the distribution of the resident population of the respective nationalities in terms of metropolitan, urban and rural areas. In each of the selected sampling points, a starting address was drawn, at random. Further addresses (every Nth address) were selected by standard "random route" procedures, from the initial address. In each household, the respondent was drawn, at random (following the "closest birthday rule"). All interviews were conducted face-to-face in people's homes and in the appropriate national language. As far as the data capture is concerned, CAPI (Computer Assisted Personal Interview) was used in those countries where this technique was available.
112 ABBREVIATIONS COUNTRIES INSTITUTES N INTERVIEWS FIELDWORK DATES POPULATION 15+ BE Belgium TNS Dimarso /03/10 01/04/ BG Bulgaria TNS BBSS /03/10 21/03/ CZ Czech Rep. TNS Aisa /03/10 28/03/ Denmark TNS Gallup /03/10 30/03/ DE Germany TNS Infratest /03/10 30/03/ EE Estonia Emor /03/10 29/03/ IE Ireland MRBI /03/10 28/03/ EL Greece TNS ICAP /03/10 28/03/ ES Spain TNS Demoscopia /03/10 29/03/ FR France TNS Sofres /03/10 29/03/ IT Italy TNS Infratest /03/10 27/03/ CY Rep. of Cyprus Synovate /03/10 29/03/ LV Latvia TNS Latvia /03/10 29/03/ LT Lithuania TNS Gallup Lithuania /03/10 25/03/ LU Luxembourg TNS ILReS /03/10 26/03/ HU Hungary TNS Hungary /03/10 28/03/ MT Malta MISCO /03/10 28/03/ NL Netherlands TNS NIPO /03/10 30/03/ AT Austria Österreichisches Gallup-Institut /03/10 28/03/ PL Poland TNS OBOP /03/10 29/03/ PT Portugal TNS EUROTESTE /03/10 29/03/ RO Romania TNS CSOP /03/10 23/03/ SI Slovenia RM PLUS /03/10 29/03/ SK Slovakia TNS AISA SK /03/10 28/03/ FI Finland TNS Gallup Oy /03/10 31/03/ SE Sweden TNS GALLUP /03/10 30/03/ UK United Kingdom TNS UK /03/10 28/03/ TOTAL EU /03/10 01/04/


113 For each country a comparison between the sample and the universe was carried out. The Universe description was derived from Eurostat population data or from national statistics offices. For all countries surveyed, a national weighting procedure, using marginal and intercellular weighting, was carried out based on this Universe description. In all countries, gender, age, region and size of locality were introduced in the iteration procedure. For international weighting (i.e. EU averages), TNS Opinion & Social applies the official population figures as provided by EUROSTAT or national statistic offices. The total population figures for input in this post-weighting procedure are listed above. Readers are reminded that survey results are estimations, the accuracy of which, everything being equal, rests upon the sample size and upon the observed percentage. With samples of about 1,000 interviews, the real percentages vary within the following confidence limits: Observed percentages 10% or 90% 20% or 80% 30% or 70% 40% or 60% 50% Confidence limits ± 1.9 points ± 2.5 points ± 2.7 points ± 3.0 points ± 3.1 points
Flash Eurobarometer 408 EUROPEAN YOUTH REPORT
 Flash Eurobarometer EUROPEAN YOUTH REPORT Fieldwork: December 2014 Publication: April 2015 This survey has been requested by the European Commission, Directorate-General for Education and Culture and co-ordinated
Flash Eurobarometer 458. Report. The euro area
 The euro area Survey requested by the European Commission, Directorate-General for Economic and Financial Affairs and co-ordinated by the Directorate-General for Communication This document does not represent
Flash Eurobarometer 398 WORKING CONDITIONS REPORT
 Flash Eurobarometer WORKING CONDITIONS REPORT Fieldwork: April 2014 Publication: April 2014 This survey has been requested by the European Commission, Directorate-General for Employment, Social Affairs
Special Eurobarometer 418 SOCIAL CLIMATE REPORT
 Special Eurobarometer 418 SOCIAL CLIMATE REPORT Fieldwork: June 2014 Publication: November 2014 This survey has been requested by the European Commission, Directorate-General for Employment, Social Affairs
Flash Eurobarometer 470. Report. Work-life balance
 Work-life balance Survey requested by the European Commission, Directorate-General for Justice and Consumers and co-ordinated by the Directorate-General for Communication This document does not represent
PUBLIC PERCEPTIONS OF VAT
 Special Eurobarometer 424 PUBLIC PERCEPTIONS OF VAT REPORT Fieldwork: October 2014 Publication: March 2015 This survey has been requested by the European Commission, Directorate-General for Taxations and
Flash Eurobarometer 386 THE EURO AREA REPORT
 Eurobarometer THE EURO AREA REPORT Fieldwork: October 2013 Publication: November 2013 This survey has been requested by the European Commission, Directorate-General for Economic and Financial Affairs and
Fieldwork February March 2008 Publication October 2008
 Special Eurobarometer 298 European Commission Consumer protection in the internal market Fieldwork February March 2008 Publication October 2008 Report Special Eurobarometer 298 / Wave 69.1 TNS Opinion
Flash Eurobarometer N o 189a EU communication and the citizens. Analytical Report. Fieldwork: April 2008 Report: May 2008
 Gallup Flash Eurobarometer N o 189a EU communication and the citizens Flash Eurobarometer European Commission Expectations of European citizens regarding the social reality in 20 years time Analytical
Flash Eurobarometer 458. The euro area
 The euro area Survey requested by the European Commission, Directorate-General for Economic and Financial Affairs and co-ordinated by the Directorate-General for Communication This document does not represent
Fieldwork November - December 2009 Publication June 2010
 Special Eurobarometer 337 European Commission Geographical and labour market mobility Report Fieldwork November - December 2009 Publication June 2010 Special Eurobarometer 337 / Wave TNS Opinion & Social
Active Ageing. Fieldwork: September November Publication: January 2012
 Special Eurobarometer 378 Active Ageing SUMMARY Special Eurobarometer 378 / Wave EB76.2 TNS opinion & social Fieldwork: September November 2011 Publication: January 2012 This survey has been requested
0pinions on organised, cross-border crime and corruption
 Special Eurobarometer European Commission 0pinions on organised, cross-border crime and corruption Fieldwork: November - December 2005 Publication: March 2006 Special Eurobarometer 245 / Wave 64.3 TNS
Social Protection and Social Inclusion in Europe Key facts and figures
 MEMO/08/625 Brussels, 16 October 2008 Social Protection and Social Inclusion in Europe Key facts and figures What is the report and what are the main highlights? The European Commission today published
SOLIDARITY THAT SPANS THE GLOBE: EUROPEANS AND DEVELOPMENT AID
 Special Eurobarometer 392 SOLIDARITY THAT SPANS THE GLOBE: EUROPEANS AND DEVELOPMENT AID REPORT Fieldwork: June 2012 Publication: October 2012 This survey has been requested by Directorate-General Development
Employment and Social Policy
 Special Eurobarometer 377 European Commission Employment and Social Policy REPORT Special Eurobarometer 377 / Wave TNS opinion & social Fieldwork: September October 2011 Publication: December 2011 This
January 2010 Euro area unemployment rate at 9.9% EU27 at 9.5%
 STAT//29 1 March 20 January 20 Euro area unemployment rate at 9.9% EU27 at 9.5% The euro area 1 (EA16) seasonally-adjusted 2 unemployment rate 3 was 9.9% in January 20, the same as in December 2009 4.
Europeans attitudes towards the issue of sustainable consumption and production. Analytical report
 Flash Eurobarometer 256 The Gallup Organisation Analytical Report Flash EB N o 251 Public attitudes and perceptions in the euro area Flash Eurobarometer European Commission Europeans attitudes towards
October 2010 Euro area unemployment rate at 10.1% EU27 at 9.6%
 STAT//180 30 November 20 October 20 Euro area unemployment rate at.1% EU27 at 9.6% The euro area 1 (EA16) seasonally-adjusted 2 unemployment rate 3 was.1% in October 20, compared with.0% in September 4.
Flash Eurobarometer 441. Report. European SMEs and the Circular Economy
 European SMEs and the Circular Economy Survey requested by the European Commission, Directorate-General Environment and co-ordinated by the Directorate-General for Communication This document does not
Fieldwork February March 2008 Publication June 2008
 Special Eurobarometer 297 European Commission Attitudes towards radioactive waste Fieldwork February March 2008 Publication June 2008 Report Special Eurobarometer 297 / Wave 69.1 TNS Opinion & Social This
Attitudes of Europeans Towards Tourism REPORT
 Flash Eurobarometer Attitudes of Europeans Towards Tourism REPORT Fieldwork: January 22 Publication: March 22 This survey has been requested by the Directorate-General Enterprise and co-ordinated by Directorate-
Standard Eurobarometer
 Standard Eurobarometer 67 / Spring 2007 Standard Eurobarometer European Commission SPECIAL EUROBAROMETER EUROPEANS KNOWELEDGE ON ECONOMICAL INDICATORS 1 1 This preliminary analysis is done by Antonis PAPACOSTAS
European Employment and Social Policy
 Special Eurobarometer European Commission European Employment and Social Policy Report Fieldwork : May 2009 June 2009 Publication: September 2009 Special Eurobarometer 316 / Wave 71.2 TNS Opinion & Social
Social climate. Fieldwork May-June 2009 Publication January 2010
 Special Eurobarometer European Commission Social climate Full report Fieldwork May-June 2009 Publication January 2010 Special Eurobarometer 315 / Wave - European Opinion Research Group EEIG This survey
Vocational Training. Fieldwork October-November 2004 Publication August 2005
 Special Eurobarometer European Commission Vocational Training Fieldwork October-November 2004 Publication August 2005 Special Eurobarometer 216 / Wave 62..1 TNS Opinion & Social This survey was requested
DATA SET ON INVESTMENT FUNDS (IVF) Naming Conventions
 Naming Conventions") DIRECTORATE GENERAL STATISTICS LAST UPDATE: 10 APRIL 2013 DIVISION MONETARY & FINANCIAL STATISTICS ECB-UNRESTRICTED DATA SET ON INVESTMENT FUNDS (IVF) Naming Conventions The series keys related to Investment
DIRECTORATE GENERAL STATISTICS LAST UPDATE: 10 APRIL 2013 DIVISION MONETARY & FINANCIAL STATISTICS ECB-UNRESTRICTED DATA SET ON INVESTMENT FUNDS (IVF) Naming Conventions The series keys related to Investment
EUROBAROMETER 71. Fieldwork: June - July 2009 Publication: January 2010
 EUROBAROMETER 66 Standard Eurobarometer Report European Commission EUROBAROMETER 71 Future of Europe Fieldwork: June - July 2009 Publication: January 2010 Standard Eurobarometer 71/ Spring 2009 - TNS Opinion
Europeans and the Common Agricultural Policy
 Special Eurobarometer European Commission Europeans and the Common Agricultural Policy Fieldwork October - November 2005 Publication January 2006 Special Eurobarometer 242 / Wave 64.2 - TNS Opinion & Social
Two years to go to the 2014 European elections European Parliament Eurobarometer (EB/EP 77.4)
") Directorate-General for Communication PUBLIC OPINION MONITORING UNIT Brussels, 23 October 2012. Two years to go to the 2014 European elections European Parliament Eurobarometer (EB/EP 77.4) FOCUS ON THE
Directorate-General for Communication PUBLIC OPINION MONITORING UNIT Brussels, 23 October 2012. Two years to go to the 2014 European elections European Parliament Eurobarometer (EB/EP 77.4) FOCUS ON THE
PROGRESS TOWARDS THE LISBON OBJECTIVES 2010 IN EDUCATION AND TRAINING
 PROGRESS TOWARDS THE LISBON OBJECTIVES IN EDUCATION AND TRAINING In 7, reaching the benchmarks for continues to pose a serious challenge for education and training systems in Europe, except for the goal
Themes Income and wages in Europe Wages, productivity and the wage share Working poverty and minimum wage The gender pay gap
 5. W A G E D E V E L O P M E N T S At the ETUC Congress in Seville in 27, wage developments in Europe were among the most debated issues. One of the key problems highlighted in this respect was the need
Standard Eurobarometer 83 Spring 2015 THE EU BUDGET REPORT
 Standard Eurobarometer 83 Spring 2015 THE EU BUDGET REPORT Fieldwork: May 2015 This survey has been requested and co-ordinated by the European Commission, Directorate-General for Communication. http://ec.europa.eu/public_opinion/index_en.htm
Special Eurobarometer 459. Report. Climate change
 Climate change Survey requested by the European Commission, Directorate-General for Climate Action and co-ordinated by the Directorate- General for Communication This document does not represent the point
Europeans knowledge of economic indicators
 Special Eurobarometer 323 European Commission Europeans knowledge of economic indicators Fieldwork: August - September 2009 Publication: January 2010 Special Eurobarometer 323 / Wave 72.1 TNS Opinion &
Eco-label Flower week 2006
 Special Eurobarometer European Commission Eco-label Flower week 2006 Fieldwork: November-December 2006 Publication: January 2007 Special Eurobarometer 275 / Wave 66.3 TNS Opinion & Social This survey was
PROGRESS TOWARDS THE LISBON OBJECTIVES 2010 IN EDUCATION AND TRAINING
 PROGRESS TOWARDS THE LISBON OBJECTIVES IN EDUCATION AND TRAINING In, reaching the benchmarks for continues to pose a serious challenge for education and training systems in Europe, except for the goal
NOTE ON EU27 CHILD POVERTY RATES
 NOTE ON EU7 CHILD POVERTY RATES Research note prepared for Child Poverty Action Group Authors: H. Xavier Jara and Chrysa Leventi Institute for Social and Economic Research (ISER) University of Essex The
European Commission Directorate-General "Employment, Social Affairs and Equal Opportunities" Unit E1 - Social and Demographic Analysis
 Research note no. 1 Housing and Social Inclusion By Erhan Őzdemir and Terry Ward ABSTRACT Housing costs account for a large part of household expenditure across the EU.Since everyone needs a house, the
Safer Internet. Fieldwork Dec Jan 2006 Publication May 2006
 Special Eurobarometer European Commission Safer Internet Fieldwork Dec 2005 - Jan 2006 Publication May 2006 Special Eurobarometer 250 / Wave 64.4 TNS Opinion & Social This survey was requested by Directorate
Gender pension gap economic perspective
 Gender pension gap economic perspective Agnieszka Chłoń-Domińczak Institute of Statistics and Demography SGH Part of this research was supported by European Commission 7th Framework Programme project "Employment
Eurofound in-house paper: Part-time work in Europe Companies and workers perspective
 Eurofound in-house paper: Part-time work in Europe Companies and workers perspective Presented by: Eszter Sandor Research Officer, Surveys and Trends 26/03/2010 1 Objectives Examine the patterns of part-time
Introduction of the euro in the new member states
 EOS Gallup Europe Introduction of the euro in the new member states - Report p. 1 Introduction of the euro in the new member states Conducted by EOS Gallup Europe upon the request of the European Commission.
Taylor & Francis Open Access Survey Open Access Mandates
 Taylor & Francis Open Access Survey Open Access Mandates Annex C European Union November 2014 November 2014 0 The results presented in this report are based on research carried out on behalf of Taylor
Europeans attitudes towards climate change. Report. Special Eurobarometer 300. Fieldwork March April 2008 Publication September 2008
 Special Eurobarometer 300 EUROPEAN PARLIAMENT European Commission Europeans attitudes towards climate change Fieldwork March April 2008 Publication September 2008 Report Special Eurobarometer 300 / Wave
of the European Commission. Communication. This document of the authors. Standard Eurobarometer 75 / Spring 2011 TNS opinion & social
 Standard Eurobarometer European Commission EUROBAROMETER 75 SPRING 2011 Europeans and the European Union budget REPORT Standard Eurobarometer 75 / Spring 2011 TNS opinion & social Fieldwork: May 2011 Publication:
Air Passengers Rights
 Special Eurobarometer European Commission Air Passengers Rights Report Fieldwork: May June 2009 Publication: December 2009 Special Eurobarometer 319 / Wave 71.2 TNS Opinion & Social This survey was requested
The Skillsnet project on Medium-term forecasts of occupational skill needs in Europe: Replacement demand and cohort change analysis
 The Skillsnet project on Medium-term forecasts of occupational skill needs in Europe: Replacement demand and cohort change analysis Paper presented at the Workshop on Medium-term forecast of occupational
May 2009 Euro area external trade surplus 1.9 bn euro 6.8 bn euro deficit for EU27
 STAT/09/106 17 July 2009 May 2009 Euro area external trade surplus 1.9 6.8 deficit for EU27 The first estimate for the euro area 1 (EA16) trade balance with the rest of the world in May 2009 gave a 1.9
Fieldwork: October 2006 Report: December 2006
 Flash Eurobarometer European Commission Business attitudes towards cross-border sales and consumer protection Summary Fieldwork: October 2006 Report: December 2006 Flash Eurobarometer 186 The Gallup Organization
Securing sustainable and adequate social protection in the EU
 Securing sustainable and adequate social protection in the EU Session on Social Protection & Security IFA 12th Global Conference on Ageing 11 June 2014, HICC Hyderabad India Dr Lieve Fransen European Commission
August 2008 Euro area external trade deficit 9.3 bn euro 27.2 bn euro deficit for EU27
 STAT/08/143 17 October 2008 August 2008 Euro area external trade deficit 9.3 27.2 deficit for EU27 The first estimate for the euro area 1 (EA15) trade balance with the rest of the world in August 2008
Taxation trends in the European Union EU27 tax ratio at 39.8% of GDP in 2007 Steady decline in top personal and corporate income tax rates since 2000
 DG TAXUD STAT/09/92 22 June 2009 Taxation trends in the European Union EU27 tax ratio at 39.8% of GDP in 2007 Steady decline in top personal and corporate income tax rates since 2000 The overall tax-to-gdp
Employment of older workers Research Note no. 5/2015
 Research Note no. 5/2015 E. Őzdemir, T. Ward M. Fuchs, S. Ilinca, O. Lelkes, R. Rodrigues, E. Zolyomi February - 2016 EUROPEAN COMMISSION Directorate-General for Employment, Social Affairs and Inclusion
January 2009 Euro area external trade deficit 10.5 bn euro 26.3 bn euro deficit for EU27
 STAT/09/40 23 March 2009 January 2009 Euro area external trade deficit 10.5 26.3 deficit for EU27 The first estimate for the euro area 1 (EA16) trade balance with the rest of the world in January 2009
Health and food. Fieldwork November December 2005 Publication November 2006
 Special Eurobarometer European Commission Health and food Fieldwork November December 2005 Publication November 2006 Special Eurobarometer 246 / Wave 64.3 TNS Opinion & Social This survey was requested
Parlemeter - November 2012 European Parliament Eurobarometer (EB/EP 78.2)
") Directorate-General for Communication Public Opinion Monitoring Unit Parlemeter - November European Parliament Eurobarometer (EB/EP 78.2) ANALYTICAL SYNTHESIS Brussels, 14 February 2013. Coverage: Population:
Directorate-General for Communication Public Opinion Monitoring Unit Parlemeter - November European Parliament Eurobarometer (EB/EP 78.2) ANALYTICAL SYNTHESIS Brussels, 14 February 2013. Coverage: Population:
Special Eurobarometer 465. Gender Equality 2017
 Summary Gender Equality 01 Gender Pay Gap Survey requested by the European Commission, Directorate-General for Justice and Consumers and co-ordinated by the Directorate-General for Communication This document
Pan-European opinion poll on occupational safety and health
 REPORT Pan-European opinion poll on occupational safety and health Results across 36 European countries Final report Conducted by Ipsos MORI Social Research Institute at the request of the European Agency
The 2009 European elections
 Special Eurobarometer 299 EUROPEAN PARLIAMENT European Commission The 2009 European elections Fieldwork: March May 2008 Publication: September 2008 Report Special Eurobarometer 299/ Wave 69.2 TNS opinion
Development Aid in times of economic turmoil
 Special Eurobarometer European Commission Development Aid in times of economic turmoil Fieldwork: May 2009 June 2009 Publication: October 2009 Special Eurobarometer 318 / Wave 71.2 TNS Opinion & Social
COMMISSION DECISION of 23 April 2012 on the second set of common safety targets as regards the rail system (notified under document C(2012) 2084)
 2084)") 27.4.2012 Official Journal of the European Union L 115/27 COMMISSION DECISION of 23 April 2012 on the second set of common safety targets as regards the rail system (notified under document C(2012) 2084)
27.4.2012 Official Journal of the European Union L 115/27 COMMISSION DECISION of 23 April 2012 on the second set of common safety targets as regards the rail system (notified under document C(2012) 2084)
in focus Statistics T he em ploym ent of senior s in t he Eur opean Union Contents POPULATION AND SOCIAL CONDITIONS 15/2006 Labour market
 T he em ploym ent of senior s in t he Eur opean Union Statistics in focus OULATION AND SOCIAL CONDITIONS 15/2006 Labour market Authors Christel ALIAGA Fabrice ROMANS Contents In 2005, in the EU-25, 22.2
H Marie Skłodowska-Curie Actions (MSCA)
") H2020 Key facts and figures (2014-2020) Number of BE researchers funded by MSCA: EU budget awarded to BE organisations (EUR million): Number of BE organisations in MSCA: 274 161,04 227 In detail, the number
H2020 Key facts and figures (2014-2020) Number of BE researchers funded by MSCA: EU budget awarded to BE organisations (EUR million): Number of BE organisations in MSCA: 274 161,04 227 In detail, the number
Growth, competitiveness and jobs: priorities for the European Semester 2013 Presentation of J.M. Barroso,
 Growth, competitiveness and jobs: priorities for the European Semester 213 Presentation of J.M. Barroso, President of the European Commission, to the European Council of 14-1 March 213 Economic recovery
COMMISSION STAFF WORKING DOCUMENT Accompanying the document
 EUROPEAN COMMISSION Brussels, 9.10.2017 SWD(2017) 330 final PART 13/13 COMMISSION STAFF WORKING DOCUMENT Accompanying the document REPORT FROM THE COMMISSION TO THE EUROPEAN PARLIAMENT, THE COUNCIL, THE
Library statistical spotlight
 /9/2 Library of the European Parliament 6 4 2 This document aims to provide a picture of the, in particular by looking at car production trends since 2, at the number of enterprises and the turnover they
H Marie Skłodowska-Curie Actions (MSCA)
") H2020 Key facts and figures (2014-2020) Number of IE researchers funded by MSCA: EU budget awarded to IE organisations (EUR million): Number of IE organisations in MSCA: 253 116,04 116 In detail, the number
H2020 Key facts and figures (2014-2020) Number of IE researchers funded by MSCA: EU budget awarded to IE organisations (EUR million): Number of IE organisations in MSCA: 253 116,04 116 In detail, the number
H Marie Skłodowska-Curie Actions (MSCA)
") H2020 Key facts and figures (2014-2020) Number of LV researchers funded by MSCA: EU budget awarded to LV organisations (EUR million): Number of LV organisations in MSCA: 35 3.91 11 In detail, the number
H2020 Key facts and figures (2014-2020) Number of LV researchers funded by MSCA: EU budget awarded to LV organisations (EUR million): Number of LV organisations in MSCA: 35 3.91 11 In detail, the number
ENTREPRENEURSHIP IN THE EU AND BEYOND
 Flash Eurobarometer 354 ENTREPRENEURSHIP IN THE EU AND BEYOND COUNTRY REPORT SPAIN Fieldwork: June 2012 This survey has been requested by the European Commission, Directorate-General Enterprise and Industry
Aggregation of periods for unemployment benefits. Report on U1 Portable Documents for mobile workers Reference year 2016
 Aggregation of periods for unemployment benefits Report on U1 Portable Documents for mobile workers Reference year 2016 Frederic De Wispelaere & Jozef Pacolet - HIVA KU Leuven June 2017 EUROPEAN COMMISSION
Fieldwork: September 2008 Publication: October 2008
 Flash Eurobarometer 247 The Gallup Organization Flash EB N o 23 Animal Cloning Analytical report Flash Eurobarometer European Commission Family life and the needs of an ageing population Fieldwork: September
H Marie Skłodowska-Curie Actions (MSCA)
") H2020 Key facts and figures (2014-2020) Number of NL researchers funded by MSCA: EU budget awarded to NL organisations (EUR million): Number of NL organisations in MSCA: 427 268.91 351 In detail, the number
H2020 Key facts and figures (2014-2020) Number of NL researchers funded by MSCA: EU budget awarded to NL organisations (EUR million): Number of NL organisations in MSCA: 427 268.91 351 In detail, the number
Weighting issues in EU-LFS
 Weighting issues in EU-LFS Carlo Lucarelli, Frank Espelage, Eurostat LFS Workshop May 2018, Reykjavik carlo.lucarelli@ec.europa.eu, frank.espelage@ec.europa.eu 1 1. Introduction The current legislation
Transition from Work to Retirement in EU25
 EUROPEAN CENTRE EUROPÄISCHES ZENTRUM CENTRE EUROPÉEN 1 Asghar Zaidi is Director Research at the European Centre for Social Welfare Policy and Research, Vienna; Michael Fuchs is Researcher at the European
H Marie Skłodowska-Curie Actions (MSCA)
") H2020 Key facts and figures (2014-2020) Number of FR researchers funded by MSCA: EU budget awarded to FR organisations (EUR million): Number of FR organisations in MSCA: 1 072 311.72 479 In detail, the
H2020 Key facts and figures (2014-2020) Number of FR researchers funded by MSCA: EU budget awarded to FR organisations (EUR million): Number of FR organisations in MSCA: 1 072 311.72 479 In detail, the
H Marie Skłodowska-Curie Actions (MSCA)
") H2020 Key facts and figures (2014-2020) Number of FI researchers funded by MSCA: EU budget awarded to FI organisations (EUR million): Number of FI organisations in MSCA: 155 47.93 89 In detail, the number
H2020 Key facts and figures (2014-2020) Number of FI researchers funded by MSCA: EU budget awarded to FI organisations (EUR million): Number of FI organisations in MSCA: 155 47.93 89 In detail, the number
H Marie Skłodowska-Curie Actions (MSCA)
") H2020 Key facts and figures (2014-2020) Number of PT researchers funded by MSCA: EU budget awarded to PT organisations (EUR million): Number of PT organisations in MSCA: 716 66,67 165 In detail, the number
H2020 Key facts and figures (2014-2020) Number of PT researchers funded by MSCA: EU budget awarded to PT organisations (EUR million): Number of PT organisations in MSCA: 716 66,67 165 In detail, the number
HOW RECESSION REFLECTS IN THE LABOUR MARKET INDICATORS
 REPUBLIC OF SLOVENIA HOW RECESSION REFLECTS IN THE LABOUR MARKET INDICATORS Matej Divjak, Irena Svetin, Darjan Petek, Miran Žavbi, Nuška Brnot ??? What is recession?? Why in Europe???? Why in Slovenia?
Entrepreneurship in the EU and beyond. Analytical report
 Flash Eurobarometer The Gallup Organization Flash Eurobarometer European Commission Entrepreneurship in the EU and beyond A survey in the EU, EFTA countries, Croatia, Turkey, the US, Japan, South Korea
H Marie Skłodowska-Curie Actions (MSCA)
") H2020 Key facts and figures (2014-2020) Number of SE researchers funded by MSCA: EU budget awarded to SE organisations (EUR million): Number of SE organisations in MSCA: 138 114.71 150 In detail, the number
H2020 Key facts and figures (2014-2020) Number of SE researchers funded by MSCA: EU budget awarded to SE organisations (EUR million): Number of SE organisations in MSCA: 138 114.71 150 In detail, the number
I. EUROPEANS AND THE TAX ON FINANCIAL TRANSACTION (TFT)...10 IV. THE REACTIONS OF THE MEMBER STATES TO THE CRISIS...19
...10 IV. THE REACTIONS OF THE MEMBER STATES TO THE CRISIS...19") Directorate General for Communication Directorate C - Relations with Citizens PUBLIC OPINION MONITORING UNIT Brussels, 22 June 2011 EUROPEANS AND THE CRISIS European Parliament Eurobarometer ( Parlemeter
Directorate General for Communication Directorate C - Relations with Citizens PUBLIC OPINION MONITORING UNIT Brussels, 22 June 2011 EUROPEANS AND THE CRISIS European Parliament Eurobarometer ( Parlemeter
LEADER implementation update Leader/CLLD subgroup meeting Brussels, 21 April 2015
 LEADER 2007-2013 implementation update Leader/CLLD subgroup meeting Brussels, 21 April 2015 #LeaderCLLD 2,416 2,416 8.9 Progress on LAG selection in the EU (2007-2013) 3 000 2 500 2 000 2 182 2 239 2 287
State of play of CAP measure Setting up of Young Farmers in the European Union
 State of play of CAP measure Setting up of Young Farmers in the European Union Michael Gregory EN RD Contact Point Seminar CEJA 20 th September 2010 Measure 112 rationale: Measure 112 - Setting up of young
Humanitarian Aid. Fieldwork June July 2006 Publication October 2006
 Special Eurobarometer European Commission Humanitarian Aid Fieldwork June July 2006 Publication October 2006 Special Eurobarometer 268 / Wave 65.4 TNS Opinion & Social This survey was requested by Directorate
The Future Constitutional Treaty
 Special Eurobarometer European Commission The Future Constitutional Treaty Fieldwork: November 2004 Publication: March 2005 Special Eurobarometer 214 / Wave 62.1 TNS Opinion & Social This survey was requested
Fiscal competitiveness issues in Romania
 Fiscal competitiveness issues in Romania Ionut Dumitru President of the Fiscal Council, Chief Economist Raiffeisen Bank* October 2014 World Bank Doing Business Report Ranking (out of 189 countries) Ease
Overview of Eurofound surveys
 Overview of Eurofound surveys Dublin 21 st October 2010 Maija Lyly-Yrjänäinen Eurofound data European Working Conditions Survey 91, 95, 00, 05, 10 European Quality of Life Survey 03, 07, 09, 10 (EB), 11
Traffic Safety Basic Facts Main Figures. Traffic Safety Basic Facts Traffic Safety. Motorways Basic Facts 2015.
 Traffic Safety Basic Facts 2013 - Main Figures Traffic Safety Basic Facts 2015 Traffic Safety Motorways Basic Facts 2015 Motorways General Almost 30.000 people were killed in road accidents on motorways
Attitudes of consumers towards the welfare of farmed animals
 Special Eurobarometer European Commission Attitudes of consumers towards the welfare of farmed animals Fieldwork : February- March 2005 Publication : June 2005 Special Eurobarometer 229 / Wave 63.2 TNS
H Marie Skłodowska-Curie Actions (MSCA)
") H2020 Key facts and figures (2014-2020) Number of AT researchers funded by MSCA: EU budget awarded to AT organisations (EUR million): Number of AT organisations in MSCA: 215 78.57 140 In detail, the number
H2020 Key facts and figures (2014-2020) Number of AT researchers funded by MSCA: EU budget awarded to AT organisations (EUR million): Number of AT organisations in MSCA: 215 78.57 140 In detail, the number
H Marie Sklodowska-Curie Actions (MSCA)
") H2020 Key facts and figures (2014-2020) Number of FR researchers funded by MSCA: EU budget awarded to FR organisations (EUR million): Number of FR organisations in MSCA: 565 198.92 370 In detail, the number
H2020 Key facts and figures (2014-2020) Number of FR researchers funded by MSCA: EU budget awarded to FR organisations (EUR million): Number of FR organisations in MSCA: 565 198.92 370 In detail, the number
STAT/14/ October 2014
 STAT/14/158-21 October 2014 Provision of deficit and debt data for 2013 - second notification Euro area and EU28 government deficit at 2.9% and 3.2% of GDP respectively Government debt at 90.9% and 85.4%
December 2010 Euro area annual inflation up to 2.2% EU up to 2.6%
 STAT/11/9 14 January 2011 December 2010 Euro area annual inflation up to 2.2% EU up to 2.6% Euro area 1 annual inflation was 2.2% in December 2010 2, up from 1.9% in November. A year earlier the rate was
The EFTA Statistical Office: EEA - the figures and their use
 The EFTA Statistical Office: EEA - the figures and their use EEA Seminar Brussels, 13 September 2012 1 Statistics Comparable, impartial and reliable statistical data are a prerequisite for a democratic
Country Health Profiles
 State of Health in the EU Country Health Profiles Brussels, November 2017 1 The Country Health Profiles 1. Highlights 2. Health status 3. Risk Factors 4. Health System (description) 5. Performance of Health
COVER NOTE The Employment Committee Permanent Representatives Committee (Part I) / Council EPSCO Employment Performance Monitor - Endorsement
 / Council EPSCO Employment Performance Monitor - Endorsement") COUNCIL OF THE EUROPEAN UNION Brussels, 15 June 2011 10666/1/11 REV 1 SOC 442 ECOFIN 288 EDUC 107 COVER NOTE from: to: Subject: The Employment Committee Permanent Representatives Committee (Part I) / Council
COUNCIL OF THE EUROPEAN UNION Brussels, 15 June 2011 10666/1/11 REV 1 SOC 442 ECOFIN 288 EDUC 107 COVER NOTE from: to: Subject: The Employment Committee Permanent Representatives Committee (Part I) / Council
H Marie Skłodowska-Curie Actions (MSCA)
") H2020 Key facts and figures (2014-2020) Number of LT researchers funded by MSCA: EU budget awarded to LT organisations (EUR million): Number of LT organisations in MSCA: 79 5.03 21 In detail, the number
H2020 Key facts and figures (2014-2020) Number of LT researchers funded by MSCA: EU budget awarded to LT organisations (EUR million): Number of LT organisations in MSCA: 79 5.03 21 In detail, the number
STAT/14/64 23 April 2014
 STAT/14/64 23 April 2014 Provision of deficit and debt data for 2013 - first notification Euro area and EU28 government deficit at 3.0% and 3.3% of GDP respectively Government debt at 92.6% and 87.1% In
In 2009 a 6.5 % rise in per capita social protection expenditure matched a 6.1 % drop in EU-27 GDP
 Population and social conditions Authors: Giuseppe MOSSUTI, Gemma ASERO Statistics in focus 14/2012 In 2009 a 6.5 % rise in per capita social protection expenditure matched a 6.1 % drop in EU-27 GDP Expenditure