Parlemeter - November 2012 European Parliament Eurobarometer (EB/EP 78.2)
|
|
|
- Adam Townsend
- 5 years ago
- Views:
Transcription
 Europeans aged 15 or over Face-to-face (CAPI) 17 Nov. - 2 Dec., carried out by TNS opinion INTRODUCTION... 3 A.")
1 Directorate-General for Communication Public Opinion Monitoring Unit Parlemeter - November European Parliament Eurobarometer (EB/EP 78.2) ANALYTICAL SYNTHESIS Brussels, 14 February Coverage: Population: Methodology: Fieldwork: EU 27 (26,739 European citizens) Europeans aged 15 or over Face-to-face (CAPI) 17 Nov. - 2 Dec., carried out by TNS opinion INTRODUCTION... 3 A. INTEREST IN THE EU AND IN THE EUROPEAN PARLIAMENT B. INFORMATION ABOUT THE EUROPEAN PARLIAMENT MEDIA RECALL OF THE EUROPEAN PARLIAMENT PREFERRED SOURCES OF INFORMATION TOPICS OR POLICY AREAS ABOUT WHICH EUROPEANS WOULD LIKE MORE INFORMATION C. IMAGE OF THE EUROPEAN PARLIAMENT OVERALL IMAGE OF THE EUROPEAN PARLIAMENT DETAILED ATTRIBUTES OF THE EP S IMAGE D. KNOWLEDGE OF THE EUROPEAN PARLIAMENT KNOWLEDGE OF HOW THE EUROPEAN PARLIAMENT FUNCTIONS KNOWLEDGE OF THE DECISION-MAKING PROCESS WITHIN THE EUROPEAN PARLIAMENT E. ROLE OF THE EUROPEAN PARLIAMENT STATE OF PLAY PERCEPTIONS (PAST) WISHES (FUTURE) F. THE EUROPEAN PARLIAMENT TODAY AND TOMORROW: PRIORITY POLICIES AND VALUES PRIORITY POLICIES VALUES TO BE DEFENDED... 48
2 Eurobarometer surveys used for the trend questions: EB77.4 Two years to go to the 2014 European elections Fieldwork: 2-17 June (TNS opinion) Coverage: 26,622 European citizens interviewed face-to-face Population: Europeans aged 15 and over EB 76.3 EB 71.1 EB 68.1 EB 66.1 Parlemeter Fieldwork: Coverage: Population: Parlemeter Fieldwork: Coverage: Population: Parlemeter Fieldwork: Coverage: Population: Standard EC Fieldwork: Coverage: Population: 3 Nov (TNS opinion) 26,594 people interviewed face-to-face Europeans aged 15 and over 16 January - 22 February 2009 (TNS opinion) 26,718 people interviewed face-to-face Europeans aged 15 and over 22 September - 3 November 2007 (TNS opinion) 26,768 people interviewed face-to-face Europeans aged 15 and over 6 September - 10 October 2006 (TNS opinion) 29,152 people interviewed face-to-face Europeans aged 15 and over Readers should bear in mind that the results of a survey are estimates, the accuracy of which, all things being equal, depends on the sample size and the observed percentage. For samples of around 1,000 interviews (the sample size generally used at the Member State level), the actual percentage, that is to say if the whole population had been interviewed, varies within the following confidence intervals: Observed percentages 10% or 90% 20% or 80% Confidence limits +/- 1.9 points +/- 2.5 points 30% or 70% +/- 2.7 points 40% or 60% +/- 3.0 points 50% +/- 3.1 points 2
3 INTRODUCTION This seventh Parlemeter survey was carried out by TNS Opinion & Social between 17 November and 2 December and involved European citizens from the 27 EU Member States. Readers will note that the analysis of the evolution of results over time dates back to the previous Parlemeter of November However, for some questions, the trends go further back, to autumn In these instances, the objective is to compare the current results, a year and a half before the 2014 European elections, with the same questions that were asked around a year and a half before the 2009 European elections. As for all surveys of this type, it should be borne in mind that the European average is weighted, and that the six most populous Member States represent around 70 % of this average. Finally, readers are reminded that every survey is an estimate, the accuracy of which depends on the size of the sample. There is always an estimated margin of error which provides an indication of the reliability of the results 1. Context As for all surveys, the context in which the fieldwork is carried out has an influence on the responses given in interviews. In the economic sphere, several meetings were held or were under preparation within the European institutions (ECOFIN Council, European Council). Important outcomes were awaited on a variety of issues: banking supervision, growth pact, banking union and the recapitalisation of banks, etc. There was great uncertainty surrounding both these matters and the outcome of discussions concerning the revision of long-term financial forecasts. In the political sphere, elections were held in several Member States before, during or after the survey: presidential elections in Slovenia; parliamentary elections in Romania; in October, regional and local elections in Belgium, Spain, Italy, the Czech Republic and Finland. All were characterised by very lively debates. When analysing the evolution of results over time, account must be taken of the events that took place between the two surveys (November 2011 and November-December ), notably the various crisis summits, the presidential elections in Finland and France, and other elections in several Member States. Finally, we should also remember the background to the 2011 Parlemeter with which the current survey results are compared: a proposed referendum on the euro and the appointment of a new Prime Minister in Greece; a new Prime Minister in Italy; and a rise in sovereign debt interest rates in many eurozone countries. 1 See technical specifications on page 2. 3
4 Main findings The main findings of this survey can be summarised as follows: There has been a net increase in public interest in European affairs since The economic crisis has been a major preoccupation for Europeans since 2008, and this is certainly a consequence of the europeanisation of the political debates that were held during the most recent national elections. Since autumn 2007, around a year and a half before the 2009 European elections, there has been an increase of 22 percentage points in citizens media recall of the European Parliament. However, media recall has fallen slightly since Europeans image of the European Parliament has remained more or less stable over the past year. For a relative majority, the European Parliament conjures up a neutral image, while positive and negative images were each mentioned by just over a quarter of Europeans. Three questions focused on the importance Europeans give to the role of the Parliament in the functioning of the EU: - three-quarters of Europeans think Parliament plays an important role today; - an absolute majority of them would like to see Parliament play a larger role in the future; - finally, more than a third of Europeans think that Parliament s role has been strengthened during the last ten years. However, this proportion has fallen significantly since There has been a marked change in the sources of information consulted by Europeans. For the first time in the history of this question, the Internet has become the second most frequently mentioned source among those that they would use to search for information about the European Parliament. The Internet still lags far behind television, which remains the principal source of information. However, the Internet now stands ten percentage points ahead of the written press. As was previously the case, an absolute majority of Europeans consider that tackling poverty is the policy that should be upheld as a matter of priority by the European Parliament. Coordinating economic policies comes in second place, cited by more than a third of respondents, followed by improving consumer and public health protection, cited by a third. The protection of human rights remains the most important value in the eyes of Europeans. Solidarity between EU Member States comes in second place, cited by more than a third of respondents and overtaking equality between men and women, which has dropped to third place alongside freedom of speech. * * * 4
5 The focus This analytical synthesis is accompanied by four specific analyses or focuses. Each focus aims to provide an in-depth analysis of the results of this Parlemeter from a specific angle, thus complementing the main findings. The four focuses present: 1) the differences between results in the eurozone and the non-euro zone; 2) the differences between men and women; 3) the differences broken down by age; 4) the differences broken down by occupational category. 5
6 A. Interest in European affairs Europeans are significantly more interested in European affairs than they were in 2006, the last time this question was asked. In, 51 % (+7) of Europeans stated that they were interested in European affairs, while 48% (-6%) were not interested. This result is probably due to the fact that Europe is at the heart of national political debates more than ever before, especially during the legislative and presidential elections that have taken place since The most significant increases occurred in Sweden (65 %, +26), the Netherlands (73 %, +21) and the United Kingdom (50 %, +18). The most marked decreases occurred in the Czech Republic (25 %, -19), Poland (57 %, -14), Slovakia (40 %, -12) and Greece (50 %, -12). When represented on a map, these evolutions present a very marked geographical east/west trend: upward evolutions in the west, downward evolutions in the east. This last trend should be seen in the context of the circumstances in 2006, which could have contributed to a greater interest in European issues than today in the new Member States that joined in 2004 and the two candidate countries at the time. Those circumstances included: - the recent accession of the new Member States; - the fact that the European Parliament had welcomed 53 observers from Bulgaria and Romania in January 2006; - the agreement reached by the EU-25 on the Services Directive (29 May 2006). B. Information about the European Parliament 1) Media recall of the European Parliament Nearly two-thirds of Europeans say that they have recently heard about the European Parliament in the media (64 %, -5 points since November 2011). We must remember that a year ago the crisis was at its peak and the resulting media impact was considerable. However, comparison with the same period preceding the European elections in 2009 proves highly revealing: today, media recall is 22 points higher (64 %) than in autumn 2007 (42 %). 6
7 2) Preferred sources of information For obtaining information about the European Parliament, the internet is now Europeans second preferred source (43 %, +10 since November 2011), behind television (64 %, -5) and ahead of the written press (33 %, -2). Radio follows in fourth place, cited by 15 % (-3). In particular, the item websites of the European Parliament has gained ground, rising from 12 % to 17 % in just one year (+5). The socio-demographic categories most likely to mention the Internet are respondents under the age of 35, the most educated respondents, and students. 3) Topics or policy areas about which Europeans would like more information Unsurprisingly, EU solutions to tackle the crisis is the most frequently cited item at the European level (34 %), very closely followed by an investment plan to create new jobs, including jobs for young people (33 %). 28 % of Europeans would most like to receive information on their rights as European citizens, while 20 % would like information on consumer protection and 19% on the future of energy within the EU. In the non-euro zone, an investment plan to create new jobs, including jobs for young people leads the way (35 %), ahead of your rights as a European citizen (28 %) and solutions to tackle the crisis (27 %). In the eurozone, solutions to tackle the crisis is in first place with 37 %; this is the majority response in 13 of the EU-17 Member States. At this point it is interesting to recall the results of a question in our previous survey entitled Two years to go to the 2014 European elections 2, published on 6 September. Respondents were asked which policy areas should be given priority, given the economic crisis. Jobs and combating unemployment led the way with 72 %, followed by reducing EU Member States public debt (37 %). In joint third place were purchasing power and combating inflation and stimulating growth (35 %). C. Image of the European Parliament 1) Global image of the European Parliament The image of the European Parliament has remained largely unchanged since the November 2011 survey. 43 % (-2) of Europeans continue to have a neutral image of the institution. The proportion of Europeans who have a positive image of the EP has risen slightly in the past year, from 26 % to 27 %, as has the proportion of respondents having a negative image, from 26 % to 28 %. 2 EB/EP Fieldwork: 2-17 June. 7
8 However, since autumn 2007 (i.e. just over a year and a half before the 2009 European elections), the EP s positive image has lost ground: at that time, 39 % of Europeans had a positive image of the EP (-12 points to ). At the national level in, a majority of respondents in four countries have a positive image of the European Parliament (Bulgaria, Malta, Romania and Italy), while a majority of respondents in three countries have a negative image (the United Kingdom, Greece and Portugal). A majority of respondents in the other 20 countries have a neutral image of the European Parliament. At the socio-demographic level, young people are most likely to have a positive image of the EP, an established trend throughout the surveys. In terms of occupation, managers and directors, white-collar workers and students are also more likely to have a positive than a negative image of the institution, as are respondents who wish to see the EP play a more important role. In terms of age, respondents aged 40 and over have the most negative image of the EP, as do unemployed, self-employed and retired respondents, as well as those who wish to see the EP play a less important role. D. Knowledge of the European Parliament What do Europeans know about how the European Parliament functions and its decisionmaking process? It is clear that the European elections in 2014 will see an increasingly politicised debate, not least thanks to the indirect election of the President of the Commission by Europe s citizens. The responses point to awareness of the unique characteristics that are inherent to a Parliament elected by direct universal suffrage on both a national and a political basis. 1) Knowledge of how the European Parliament functions When asked about how MEPs sit in the European Parliament, 44 % of respondents said according to their political affinities (+11 since autumn 2007). However, 36 % (-8) still think that MEPs sit according to their nationality. 2) Knowledge of the decision-making process Respondents are equally divided between the two suggested methods of decisionmaking. 37 % (+12 since autumn 2007) think that decisions are made according to the political affinities of the MEPs, while another 37 % (-4) say that they are made according to the interests of the Member States which the MEPs represent. 13 % (-2) spontaneously replied both, and 13 % said they did not know (-6). 8
9 E. Role of the European Parliament Respondents were asked three questions about their perceptions of the role played by the European Parliament. Details are given below. It is interesting to consider the rationale for the answers given in the eurozone countries most affected by the economic crisis. In those Member States, respondents tend to think that the role of the European Parliament has been weakened during the last ten years, while also, in some cases in significant proportions, wishing to see the institution play a more important role in the future. 1) State of play 75 % (-2 since November 2011) of Europeans continue to believe that the EP currently plays an important role in the running of the EU. This is the same proportion as in autumn ) Perceptions (past) Question: Would you say that over the last 10 years the European Parliament s role within the EU has been strengthened, has been weakened, or has stayed the same? The results show that since January 2009, when this question was last asked, a majority of Europeans have continued to believe that the role of the EP within the EU has been strengthened (35 %, -7). However, more respondents now believe the role of the EP has been weakened: the relevant percentage has risen from 11 % in January 2009 to 24 % in November (+13). As previously mentioned, this impression is particularly widespread in those Member States most affected by the crisis: 47 % of respondents in Spain (+35) think the role of the EP has been weakened, as do 42 % in Portugal (+29), 44 % in Greece (+25), and 31 % in Ireland (+21). 3) Wishes (future) Today, 54 % of Europeans would like the EP to play a more important role in the future: this is 9 percentage points higher than in November For the comparable period in autumn 2007, this proportion was only 48 %. Respondents in all of the eurozone countries most affected by the crisis hope that the EP will play a more important role in the future: Cyprus (79 %, +6), Spain (68 %, +6), Greece (66 %, +9), Ireland (51 %, +21), and Italy (49 %, +8). The most significant evolutions were recorded in the United Kingdom (44 %, +20), Bulgaria (61 %, +17), and Poland (63 %, +15). Despite the 20-point rise in the UK, it still has one of the lowest scores for this question. Only three Member States registered a fall in the number of respondents wishing to see the EP play a more important role in the future: the Netherlands (47 %, -6), Austria (35 %,-2) and Slovakia (56 %, -1). 9
10 F. The European Parliament today and tomorrow: values and priority policies The phenomenon observed since the start of the crisis continues to gain momentum. Above all, Europeans want the European Parliament to promote the development of EU policies that respond to their day-to-day concerns. 1) Priority policies: Tackling poverty remains the policy that Europeans want to see developed as a matter of priority by the EP, with 53 % mentioning the issue (+3 since November 2011). In the euro zone, this is the most cited priority policy in 15 Member States (54 %), the sole exceptions being Malta and Italy. It is also the first policy mentioned in all the non-euro countries (52 %), with the exception of Lithuania. Coordinating economic, budget and tax policies is cited as the second priority policy, being mentioned by 35 % of respondents (-2). In this instance there is a wide gap between the euro zone (39%) and the non-euro countries (28%). 2) Values to be defended: As in previous surveys, the protection of human rights (56 %, no change) is by far the first value that Europeans want to see defended by the EP. Solidarity between EU Member States (35 %, +4) follows in second place. Freedom of speech remains in third place with 32 %, and is joined by equality between men and women (32 %, -1). Public Opinion Monitoring Unit Jacques Nancy EPEurobarometer@europarl.europa.eu 10
 European average + 7-6 - 1 EU27")
11 A. INTEREST IN THE EU AND IN THE EUROPEAN PARLIAMENT a) European average EU27 EU25 11
12 b) National results 12
13 c) National results: evolution QP13a Would you say that you are very interested, fairly interested, not very interested or not at all interested in European affairs? Total 'Interested' Total 'Not interested' Don't know EB66.1* Sept.-Oct EB66.1* Sept.-Oct EB66.1* Sept.-Oct EU27 (EU25*) 44% 51% +7 54% 48% -6 2% 1% -1 EURO ZONE 43% 51% +8 56% 48% -8 2% 1% -1 NON-EURO - 49% % - - 1% - SE 39% 65% % 35% -25 1% 0% -1 NL 52% 73% % 27% -21 0% 0% = UK 32% 50% % 50% -16 2% 0% -2 BE 40% 57% % 43% -17 0% 0% = LV 37% 51% % 49% -11 3% 0% -3 IT 39% 52% % 46% -13 2% 2% = CY 42% 53% % 47% -10 1% 0% -1 DK 57% 68% % 32% -10 1% 0% -1 DE 51% 61% % 38% -8 3% 1% -2 FR 40% 49% +9 60% 51% -9 0% 0% = EE 38% 46% +8 60% 54% -6 2% 0% -2 ES 25% 33% +8 73% 66% -7 2% 1% -1 LT 37% 45% +8 63% 55% -8 0% 0% = HU 45% 53% +8 54% 47% -7 1% 0% -1 IE 52% 59% +7 44% 41% -3 4% 0% -4 PT 35% 40% +5 64% 59% -5 1% 1% = LU 64% 67% +3 35% 33% -2 1% 0% -1 MT 51% 50% -1 45% 49% +4 4% 1% -3 AT 50% 48% -2 47% 52% +5 3% 0% -3 FI 73% 68% -5 27% 32% +5 0% 0% = BG 49% 44% -5 49% 52% +3 2% 4% +2 SI 49% 43% -6 50% 57% +7 1% 0% -1 RO 40% 30% % 67% +12 5% 3% -2 EL 62% 50% % 50% +12 0% 0% = SK 52% 40% % 60% +13 1% 0% -1 PL 71% 57% % 40% +12 1% 3% +2 CZ 44% 25% % 75% +19 0% 0% = 13
14 B. INFORMATION ABOUT THE EUROPEAN PARLIAMENT 1. MEDIA RECALL OF THE EUROPEAN PARLIAMENT a) European average 14
15 b) National results 15
16 c) National results: evolution QP1 Have you recently read in the press, seen on the Internet or on television or heard on the radio something about the European Parliament? Yes No Don't know EU27 69% 64% -5 30% 34% +4 1% 2% +1 EURO ZONE 70% 64% -6 29% 34% +5 1% 2% +1 NON-EURO 67% 64% -3 32% 35% +3 1% 1% = MT 74% 85% % 14% -10 2% 1% -1 CY 70% 79% +9 30% 21% -9 0% 0% = LV 70% 75% +5 30% 24% -6 0% 1% +1 RO 74% 79% +5 23% 18% -5 3% 3% = DK 65% 69% +4 34% 30% -4 1% 1% = HU 65% 69% +4 34% 29% -5 1% 2% +1 ES 72% 74% +2 28% 25% -3 0% 1% +1 BE 73% 74% +1 27% 26% -1 0% 0% = SI 82% 82% = 17% 17% = 1% 1% = PT 68% 67% -1 31% 32% +1 1% 1% = LT 79% 78% -1 19% 21% +2 2% 1% -1 PL 60% 59% -1 37% 41% +4 3% 0% -3 EE 77% 75% -2 22% 25% +3 1% 0% -1 LU 75% 73% -2 24% 27% +3 1% 0% -1 BG 68% 66% -2 28% 30% +2 4% 4% = SE 79% 77% -2 20% 23% +3 1% 0% -1 DE 77% 73% -4 21% 23% +2 2% 4% +2 NL 82% 78% -4 18% 21% +3 0% 1% +1 FI 87% 81% -6 13% 19% +6 0% 0% = CZ 63% 57% -6 36% 42% +6 1% 1% = UK 67% 60% -7 33% 40% +7 0% 0% = EL 86% 78% -8 14% 22% +8 0% 0% = IT 65% 56% -9 33% 42% +9 2% 2% = SK 82% 73% -9 18% 26% +8 0% 1% +1 FR 51% 40% % 59% +11 1% 1% = AT 70% 59% % 36% +7 1% 5% +4 IE 73% 55% % 44% +20 3% 1% -2 16
 European average - 5 + 10-2 - 3")
17 2. PREFERRED SOURCES OF INFORMATION a) European average
18 b) National results 18
19 c) National results: evolution QP12 If you were looking for information on the European Parliament, which of the following sources would you use? Total 'Television' Total 'Internet' Total 'Press' Radio EU27 69% 64% -5 33% 43% % 33% -2 18% 15% -3 EURO ZONE 71% 67% -4 30% 40% % 38% -3 21% 16% -5 NON-EURO 65% 59% -6 40% 48% +8 24% 24% = 14% 14% = IE 62% 50% % 48% % 27% -5 35% 19% -16 CY 73% 70% -3 21% 37% % 32% +8 22% 16% -6 ES 59% 49% % 44% % 18% % 12% -6 UK 56% 49% -7 47% 60% % 25% -2 9% 8% -1 DE 79% 79% = 26% 38% % 58% -2 28% 20% -8 BE 75% 70% -5 36% 48% % 43% +1 26% 22% -4 MT 60% 59% -1 32% 42% % 16% -2 14% 14% = EE 61% 59% -2 48% 58% % 29% -2 33% 30% -3 IT 80% 73% -7 17% 27% % 33% -1 6% 4% -2 LU 54% 59% +5 43% 51% +8 49% 50% +1 29% 24% -5 PT 68% 73% +5 14% 22% +8 24% 15% -9 13% 4% -9 FR 60% 61% +1 38% 46% +8 33% 36% +3 26% 24% -2 PL 68% 54% % 39% +8 13% 16% +3 9% 13% +4 EL 74% 55% % 32% +7 26% 16% % 8% -4 LT 61% 54% -7 43% 50% +7 25% 18% -7 23% 20% -3 DK 60% 67% +7 65% 71% +6 26% 28% +2 19% 24% +5 CZ 66% 64% -2 41% 47% +6 37% 31% -6 18% 21% +3 BG 82% 82% = 26% 31% +5 34% 33% -1 23% 20% -3 LV 55% 53% -2 50% 54% +4 17% 17% = 23% 20% -3 HU 80% 73% -7 28% 32% +4 29% 28% -1 20% 18% -2 AT 82% 78% -4 21% 24% +3 67% 65% -2 34% 33% -1 FI 65% 71% +6 56% 58% +2 48% 50% +2 24% 21% -3 NL 61% 61% = 68% 70% +2 46% 48% +2 22% 15% -7 SE 50% 55% +5 76% 78% +2 42% 42% = 20% 16% -4 SI 63% 60% -3 53% 54% +1 36% 31% -5 29% 24% -5 SK 81% 68% % 43% +1 43% 34% -9 31% 20% -11 RO 77% 78% +1 22% 23% +1 17% 17% = 20% 19% -1 19
20 QP12 Breakdown of Total The Internet : News websites Websites of the European Parliament Online social networks Blogs EU27 26% 31% +5 12% 17% +5 3% 8% +5 2% 3% +1 IT 14% 23% +9 5% 8% +3 1% 2% +1 1% 2% +1 IE 16% 25% +9 15% 30% +15 3% 6% +3 1% 2% +1 PT 10% 18% +8 5% 6% +1 2% 3% +1 1% 2% +1 DE 21% 29% +8 8% 10% +2 4% 8% +4 2% 2% = ES 24% 32% +8 11% 20% +9 2% 9% +7 2% 7% +5 UK 40% 48% +8 13% 22% +9 4% 7% +3 2% 4% +2 LU 27% 34% +7 25% 16% -9 3% 12% +9 2% 5% +3 BE 29% 36% +7 14% 24% +10 2% 8% +6 1% 3% +2 CZ 29% 35% +6 21% 20% -1 3% 6% +3 3% 3% = FI 44% 49% +5 26% 17% -9 6% 10% +4 4% 6% +2 EE 39% 44% +5 17% 26% +9 6% 10% +4 3% 4% +1 BG 20% 24% +4 6% 10% +4 6% 9% +3 3% 5% +2 DK 43% 45% +2 42% 46% +4 4% 13% +9 2% 6% +4 EL 12% 14% +2 8% 12% +4 9% 14% +5 10% 15% +5 CY 10% 12% +2 11% 17% +6 6% 13% +7 7% 11% +4 PL 27% 29% +2 8% 15% +7 2% 9% +7 1% 2% +1 MT 24% 26% +2 10% 19% +9 5% 8% +3 3% 5% +2 HU 21% 22% +1 7% 8% +1 7% 8% +1 1% 4% +3 FR 28% 29% +1 15% 18% +3 3% 8% +5 2% 1% -1 SI 40% 40% = 25% 27% +2 5% 8% +3 5% 5% = SE 49% 47% -2 53% 48% -5 8% 16% +8 4% 7% +3 LT 27% 25% -2 13% 13% = 15% 20% +5 9% 13% +4 AT 18% 15% -3 5% 7% +2 4% 11% +7 1% 3% +2 RO 17% 14% -3 6% 10% +4 1% 4% +3 1% 3% +2 SK 32% 28% -4 18% 22% +4 10% 10% = 7% 5% -2 LV 38% 32% -6 12% 16% +4 14% 19% +5 1% 1% = NL 50% 44% -6 31% 39% +8 6% 8% +2 1% 3% +2 20


")
21 3. TOPICS OR POLICY AREAS ABOUT WHICH EUROPEANS WOULD LIKE MORE INFORMATION a) European average 21
22 National results 22
23 b) National results: all items QP11T On which topic or policy area debated within the European Parliament or on which other topic related to the EU would you like to have more information? Firstly? And then? EU solutions to tackle the crisis (sharing the debt, Eurobonds, tax on financial transactions TFT, etc.) A European investment plan to create new jobs including jobs for young people Your rights as a European citizen EU27 34% 33% 28% EURO ZONE 37% 32% 28% NON-EURO 27% 35% 28% NL 52% 37% 34% CY 49% 57% 47% BG 49% 55% 40% SI 46% 44% 19% LU 45% 41% 26% SK 45% 42% 32% DK 44% 45% 33% IT 43% 40% 29% CZ 39% 40% 30% EL 38% 33% 35% ES 38% 38% 29% AT 38% 31% 30% FI 35% 26% 30% RO 35% 44% 37% FR 34% 23% 19% BE 33% 32% 33% DE 33% 28% 32% IE 32% 41% 36% SE 32% 51% 26% LT 30% 28% 30% HU 29% 39% 18% PL 28% 30% 25% EE 26% 33% 33% PT 23% 25% 23% LV 22% 28% 32% MT 16% 33% 43% UK 15% 28% 25% Top items by country among the top 3 items at European level 23
24 C. IMAGE OF THE EUROPEAN PARLIAMENT 1. OVERALL IMAGE OF THE EUROPEAN PARLIAMENT a) European average b) Image of the European Parliament broken down by interest in European affairs QP3 In general, does the European Parliament conjure up for you a very positive, fairly positive, neutral, fairly negative or very negative image? Total 'Positive' Neutral Total 'Negative' Don't know EU27 27% 43% 28% 2% Interest in European affairs Interested 39% 37% 23% 1% Not interested 15% 48% 33% 4% 24
25 c) National results 25
26 d) National results: evolution QP3 In general, does the European Parliament conjure up for you a very positive, fairly positive, neutral, fairly negative or very negative image? Total 'Positive' Neutral Total 'Negative' Don't know EU27 26% 27% +1 45% 43% -2 26% 28% +2 3% 2% -1 EURO ZONE 26% 27% +1 45% 43% -2 26% 28% +2 3% 2% -1 NON-EURO 27% 28% +1 42% 41% -1 27% 28% +1 4% 3% -1 MT 38% 47% +9 39% 33% -6 13% 14% +1 10% 6% -4 DE 22% 29% +7 48% 46% -2 28% 23% -5 2% 2% = AT 17% 24% +7 41% 42% +1 41% 34% -7 1% 0% -1 UK 12% 17% +5 36% 36% = 48% 44% -4 4% 3% -1 LV 18% 21% +3 62% 57% -5 16% 19% +3 4% 3% -1 BE 29% 31% +2 50% 41% -9 21% 27% +6 0% 1% +1 IE 31% 33% +2 36% 35% -1 27% 28% +1 6% 4% -2 FR 19% 21% +2 50% 51% +1 26% 25% -1 5% 3% -2 NL 26% 28% +2 44% 41% -3 30% 30% = 0% 1% +1 SK 35% 36% +1 42% 41% -1 22% 23% +1 1% 0% -1 DK 25% 26% +1 54% 51% -3 19% 21% +2 2% 2% = HU 29% 30% +1 46% 42% -4 24% 27% +3 1% 1% = EE 24% 24% = 61% 60% -1 13% 14% +1 2% 2% = LU 39% 39% = 42% 45% +3 17% 15% -2 2% 1% -1 IT 40% 39% -1 36% 35% -1 20% 24% +4 4% 2% -2 PT 20% 19% -1 40% 37% -3 34% 40% +6 6% 4% -2 BG 55% 54% -1 31% 30% -1 9% 13% +4 5% 3% -2 LT 28% 27% -1 57% 60% +3 12% 10% -2 3% 3% = PL 35% 34% -1 50% 50% = 11% 13% +2 4% 3% -1 SE 26% 25% -1 52% 48% -4 21% 26% +5 1% 1% = SI 35% 33% -2 38% 40% +2 24% 25% +1 3% 2% -1 FI 21% 19% -2 52% 50% -2 26% 30% +4 1% 1% = RO 45% 43% -2 38% 33% -5 11% 18% +7 6% 6% = EL 26% 23% -3 39% 34% -5 34% 42% +8 1% 1% = CZ 24% 21% -3 49% 48% -1 26% 29% +3 1% 2% +1 CY 38% 33% -5 42% 38% -4 13% 24% +11 7% 5% -2 ES 21% 15% -6 52% 44% -8 23% 38% +15 4% 3% -1 26
27 2. DETAILED ATTRIBUTES OF THE EP S IMAGE a) European average 27
28 b) National results: evolution QP2 Please tell me for each of the following words/ expressions whether it describes very well, fairly well, fairly badly or very badly your perception of the European Parliament. Dynamic Democratic Listening to European citizens Total 'Describes well' Total 'Describes well' Total 'Describes well' EU27 38% 43% +5 61% 62% +1 33% 35% +2 EURO ZONE 37% 41% +4 62% 61% -1 29% 32% +3 NON-EURO 40% 46% +6 59% 62% +3 39% 42% +3 AT 36% 50% % 61% +5 25% 32% +7 NL 27% 39% % 65% -1 29% 29% = BE 44% 55% % 69% +3 38% 42% +4 EE 36% 47% % 66% +2 42% 46% +4 LV 37% 47% % 53% +6 39% 41% +2 MT 40% 50% % 65% +8 51% 64% +13 UK 20% 30% % 47% +8 24% 32% +8 DE 30% 39% +9 72% 75% +3 24% 30% +6 IT 48% 57% +9 61% 63% +2 38% 42% +4 DK 38% 45% +7 70% 73% +3 43% 43% = IE 40% 47% +7 52% 56% +4 28% 43% +15 PL 53% 60% +7 73% 74% +1 51% 53% +2 LT 56% 61% +5 67% 70% +3 53% 54% +1 HU 55% 60% +5 71% 67% -4 57% 55% -2 SE 34% 39% +5 71% 70% -1 39% 35% -4 LU 50% 54% +4 72% 76% +4 39% 47% +8 SK 57% 61% +4 72% 73% +1 53% 51% -2 FI 46% 50% +4 57% 56% -1 40% 37% -3 RO 55% 58% +3 67% 66% -1 44% 46% +2 SI 50% 53% +3 57% 55% -2 31% 32% +1 BG 63% 65% +2 73% 71% -2 51% 51% = PT 39% 41% +2 41% 41% = 26% 21% -5 FR 32% 33% +1 56% 55% -1 22% 28% +6 CY 53% 54% +1 60% 60% = 51% 38% -13 CZ 46% 45% -1 66% 65% -1 41% 40% -1 EL 55% 48% -7 46% 43% -3 27% 24% -3 ES 34% 25% -9 61% 47% % 22% -8 28
29 QP2 Please tell me for each of the following words/ expressions whether it describes very well, fairly well, fairly badly or very badly your perception of the European Parliament. Not well known Total 'Describes well' Inefficient Total 'Describes well' EU27 51% 47% -4 42% 46% +4 EURO ZONE 54% 49% -5 42% 47% +5 NON-EURO 47% 45% -2 40% 44% +4 ES 58% 54% -4 44% 59% +15 EL 26% 22% -4 51% 64% +13 PT 23% 26% +3 39% 52% +13 CY 18% 21% +3 29% 40% +11 MT 17% 22% +5 15% 23% +8 RO 43% 40% -3 21% 29% +8 SI 49% 47% -2 47% 55% +8 BG 43% 48% +5 12% 19% +7 SK 37% 34% -3 34% 41% +7 LU 47% 47% = 36% 42% +6 SE 49% 38% % 65% +6 IE 26% 42% % 45% +5 FR 58% 57% -1 35% 40% +5 DK 60% 49% % 52% +4 IT 56% 47% -9 32% 36% +4 FI 57% 55% -2 50% 54% +4 HU 61% 58% -3 42% 45% +3 PL 41% 37% -4 31% 34% +3 UK 49% 50% +1 53% 56% +3 CZ 47% 44% -3 39% 41% +2 LT 20% 35% % 28% +2 BE 60% 51% -9 48% 48% = NL 61% 58% -3 59% 59% = AT 38% 41% +3 51% 51% = LV 54% 51% -3 43% 42% -1 DE 58% 48% % 46% -3 EE 40% 40% = 39% 35% -4 D. KNOWLEDGE OF THE EUROPEAN PARLIAMENT 29
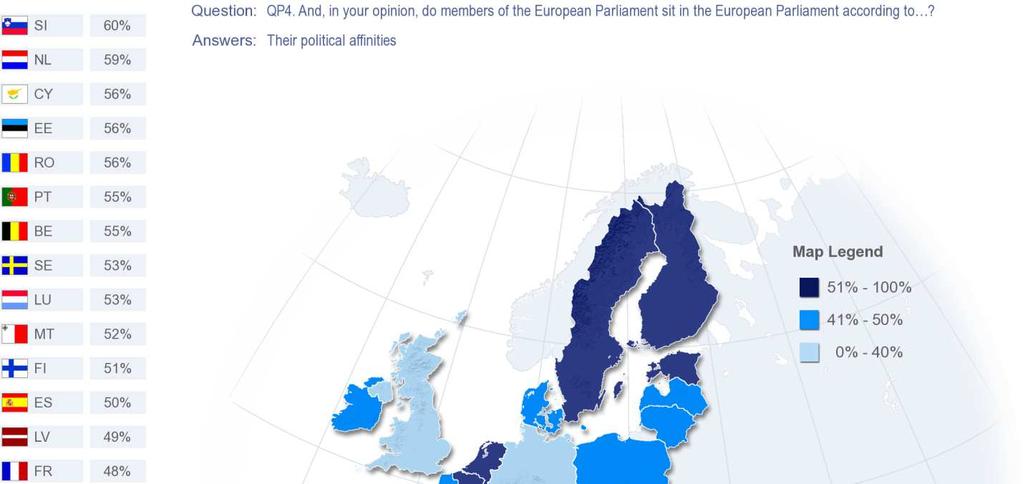
30 1. KNOWLEDGE OF HOW THE EUROPEAN PARLIAMENT FUNCTIONS a) European average b) Knowledge of how the European Parliament functions broken down by interest in European affairs QP4 And, in your opinion, do members of the European Parliament sit in the European Parliament according to? Their political affinities Their nationality Don't know EU27 44% 36% 20% Interest in European affairs Interested 47% 40% 13% Not interested 40% 33% 27% c) National results 30
31 31
32 d) National results: evolution QP4 And, in your opinion, do members of the European Parliament sit in the European Parliament according to? Their nationality Their political affinities Don't know EU27 36% 36% = 43% 44% +1 21% 20% -1 EURO ZONE 36% 35% -1 43% 44% +1 21% 21% = NON-EURO 38% 39% +1 42% 42% = 20% 19% -1 PT 32% 27% -5 43% 55% % 18% -7 MT 29% 24% -5 45% 52% +7 26% 24% -2 IE 36% 35% -1 39% 45% +6 25% 20% -5 CY 29% 24% -5 50% 56% +6 21% 20% -1 LV 46% 38% -8 43% 49% +6 11% 13% +2 RO 28% 25% -3 51% 56% +5 21% 19% -2 IT 45% 46% +1 32% 35% +3 23% 19% -4 UK 35% 36% +1 37% 40% +3 28% 24% -4 EL 54% 51% -3 35% 37% +2 11% 12% +1 BG 38% 34% -4 34% 36% +2 28% 30% +2 AT 43% 46% +3 45% 45% = 12% 9% -3 LU 34% 36% +2 53% 53% = 13% 11% -2 DE 32% 30% -2 39% 39% = 29% 31% +2 CZ 61% 57% -4 29% 29% = 10% 14% +4 ES 30% 25% -5 50% 50% = 20% 25% +5 NL 34% 34% = 60% 59% -1 6% 7% +1 SK 63% 60% -3 30% 29% -1 7% 11% +4 FR 31% 34% +3 50% 48% -2 19% 18% -1 PL 40% 45% +5 44% 41% -3 16% 14% -2 SI 25% 29% +4 63% 60% -3 12% 11% -1 DK 40% 44% +4 48% 45% -3 12% 11% -1 HU 42% 46% +4 46% 43% -3 12% 11% -1 SE 34% 37% +3 58% 53% -5 8% 10% +2 EE 29% 31% +2 61% 56% -5 10% 13% +3 FI 28% 33% +5 56% 51% -5 16% 16% = BE 35% 37% +2 61% 55% -6 4% 8% +4 LT 26% 30% +4 56% 46% % 24% +6 32
33 2. KNOWLEDGE OF THE DECISION-MAKING PROCESS WITHIN THE EUROPEAN PARLIAMENT a) European average 33

34 b) National results 34
35 c) National results: evolution QP5 Would you say that the European Parliament s decisions are adopted above all? According to the interests of the Member States from which the MEPs are coming According to the political affinities of the MEPs Both (SPONTANEOUS) Don't know EU27 36% 37% +1 37% 37% = 13% 13% = 14% 13% -1 EURO ZONE 35% 35% = 36% 37% +1 15% 16% +1 14% 12% -2 NON-EURO 38% 41% +3 39% 38% -1 8% 7% -1 15% 14% -1 BG 37% 36% -1 22% 31% +9 21% 19% -2 20% 14% -6 LU 39% 38% -1 36% 43% +7 14% 10% -4 11% 9% -2 RO 40% 35% -5 35% 41% +6 9% 9% = 16% 15% -1 MT 33% 36% +3 33% 37% +4 7% 7% = 27% 20% -7 PT 26% 27% +1 40% 44% +4 19% 19% = 15% 10% -5 FI 37% 38% +1 44% 47% +3 10% 8% -2 9% 7% -2 ES 25% 25% = 43% 46% +3 9% 7% -2 23% 22% -1 EL 53% 47% -6 30% 33% +3 10% 13% +3 7% 7% = SK 60% 54% -6 26% 29% +3 8% 11% +3 6% 6% = CY 38% 40% +2 38% 40% +2 7% 9% +2 17% 11% -6 DE 32% 30% -2 33% 35% +2 22% 22% = 13% 13% = IE 27% 33% +6 34% 35% +1 15% 15% = 24% 17% -7 IT 37% 41% +4 28% 28% = 23% 23% = 12% 8% -4 PL 44% 48% +4 36% 36% = 8% 3% -5 12% 13% +1 LT 36% 39% +3 34% 34% = 14% 6% -8 16% 21% +5 FR 40% 38% -2 40% 39% -1 5% 8% +3 15% 15% = EE 35% 30% -5 36% 35% -1 15% 22% +7 14% 13% -1 HU 39% 41% +2 33% 32% -1 22% 22% = 6% 5% -1 CZ 57% 54% -3 29% 28% -1 8% 9% +1 6% 9% +3 AT 28% 35% +7 43% 41% -2 21% 20% -1 8% 4% -4 SI 30% 36% +6 50% 48% -2 15% 11% -4 5% 5% = LV 39% 34% -5 40% 38% -2 11% 17% +6 10% 11% +1 UK 30% 36% +6 45% 42% -3 4% 3% -1 21% 19% -2 SE 43% 47% +4 45% 42% -3 8% 7% -1 4% 4% = DK 40% 43% +3 44% 40% -4 11% 12% +1 5% 5% = NL 42% 47% +5 44% 38% -6 9% 10% +1 5% 5% = BE 39% 40% +1 49% 43% -6 8% 11% +3 4% 6% +2 35
36 E. ROLE OF THE EUROPEAN PARLIAMENT 1. STATE OF PLAY a) European average 36
37 b) National results 37
38 c) National results: evolution QP6 In your opinion, is the role played by the European Parliament in the running of the EU? Total 'Important' Total 'Not important' Don't know EU27 77% 75% -2 17% 20% +3 6% 5% -1 EURO ZONE 76% 74% -2 18% 21% +3 6% 5% -1 NON-EURO 77% 76% -1 16% 18% +2 7% 6% -1 AT 66% 72% +6 32% 26% -6 2% 2% = PT 68% 73% +5 23% 22% -1 9% 5% -4 LT 79% 82% +3 16% 13% -3 5% 5% = UK 65% 68% +3 23% 25% +2 12% 7% -5 BE 83% 84% +1 16% 14% -2 1% 2% +1 EE 78% 79% +1 16% 14% -2 6% 7% +1 DE 76% 76% = 18% 20% +2 6% 4% -2 IE 79% 79% = 8% 15% +7 13% 6% -7 IT 78% 78% = 16% 18% +2 6% 4% -2 MT 85% 85% = 6% 9% +3 9% 6% -3 RO 78% 77% -1 16% 16% = 6% 7% +1 NL 85% 82% -3 13% 16% +3 2% 2% = FI 80% 77% -3 18% 21% +3 2% 2% = BG 85% 82% -3 9% 11% +2 6% 7% +1 CZ 80% 77% -3 17% 18% +1 3% 5% +2 DK 78% 75% -3 17% 20% +3 5% 5% = PL 86% 83% -3 8% 11% +3 6% 6% = FR 77% 73% -4 17% 20% +3 6% 7% +1 SK 91% 87% -4 8% 11% +3 1% 2% +1 HU 89% 85% -4 8% 12% +4 3% 3% = LU 86% 81% -5 12% 16% +4 2% 3% +1 SI 86% 81% -5 12% 17% +5 2% 2% = SE 86% 81% -5 10% 16% +6 4% 3% -1 ES 67% 61% -6 23% 29% +6 10% 10% = CY 87% 81% -6 6% 13% +7 7% 6% -1 LV 74% 66% -8 21% 28% +7 5% 6% +1 EL 80% 67% % 31% +13 2% 2% = 38
39 2. PERCEPTIONS (PAST) a) European average 39
40 b) National results 40
41 c) National results: evolution QP7 Would you say that over the last 10 years the European Parliament s role within the EU has? Been strengthened Been weakened Stayed the same Don't know EB71.1 Jan.-Feb EB71.1 Jan.-Feb EB71.1 Jan.-Feb EB71.1 Jan.-Feb EU27 42% 35% -7 11% 24% % 29% = 18% 12% -6 EURO ZONE 43% 37% -6 12% 25% % 27% -3 15% 11% -4 NON-EURO 39% 31% -8 11% 23% % 33% +5 22% 13% -9 BG 34% 40% +6 4% 8% +4 22% 33% % 19% -21 PL 34% 36% +2 8% 15% +7 30% 37% +7 28% 12% -16 LV 27% 29% +2 11% 16% +5 37% 43% +6 25% 12% -13 DE 54% 55% +1 7% 8% +1 28% 28% = 11% 9% -2 FR 32% 32% = 12% 24% % 31% -9 16% 13% -3 IT 39% 36% -3 15% 28% % 26% -1 19% 10% -9 BE 46% 43% -3 18% 27% +9 29% 26% -3 7% 4% -3 HU 39% 34% -5 16% 29% % 29% -1 15% 8% -7 IE 37% 31% -6 10% 31% % 28% +2 27% 10% -17 NL 64% 58% -6 5% 15% % 19% -5 7% 8% +1 RO 46% 40% -6 7% 15% +8 16% 28% % 17% -14 EE 37% 30% -7 8% 22% % 33% +4 26% 15% -11 MT 52% 43% -9 2% 14% % 26% % 17% -13 FI 47% 37% -10 8% 22% % 32% -3 10% 9% -1 AT 41% 31% % 27% +8 30% 36% +6 10% 6% -4 DK 53% 43% -10 8% 20% % 31% +2 10% 6% -4 LT 39% 29% % 20% +8 28% 37% +9 21% 14% -7 EL 34% 22% % 44% % 29% -16 2% 5% +3 UK 34% 22% % 32% % 32% +1 19% 14% -5 PT 28% 13% % 42% % 27% -2 30% 18% -12 LU 53% 38% % 24% % 31% +5 11% 7% -4 SK 58% 41% -17 5% 22% % 31% +6 12% 6% -6 SE 55% 37% -18 6% 19% % 33% +9 15% 11% -4 ES 39% 17% % 47% % 21% -5 23% 15% -8 SI 55% 30% -25 6% 26% % 35% +8 12% 9% -3 CY 62% 34% -28 2% 17% % 30% % 19% +2 CZ 61% 29% -32 6% 20% % 41% % 10% = 41
42 3. WISHES (FUTURE) a) European average 42
43 b) National results 43
44 c) National results: evolution QP8 Would you personally like to see the European Parliament play a more important or less important role than it currently does? More important The same (SPONTANEOUS) Less important Don't know EU27 45% 54% +9 24% 16% -8 20% 21% +1 11% 9% -2 EURO ZONE 48% 56% +8 25% 17% -8 16% 18% +2 11% 9% -2 NON-EURO 39% 52% % 12% % 27% +1 11% 9% -2 IE 30% 51% % 18% % 23% +7 17% 8% -9 UK 24% 44% % 6% % 42% +6 14% 8% -6 BG 44% 61% % 21% -13 7% 6% -1 15% 12% -3 PL 48% 63% % 11% % 17% -1 11% 9% -2 DE 42% 54% % 21% -8 19% 18% -1 10% 7% -3 LU 53% 65% % 16% % 14% +1 8% 5% -3 MT 57% 69% % 15% -8 7% 6% -1 13% 10% -3 BE 52% 61% +9 32% 17% % 18% +4 2% 4% +2 EL 57% 66% +9 23% 16% -7 16% 15% -1 4% 3% -1 IT 41% 49% +8 33% 24% -9 15% 18% +3 11% 9% -2 SI 52% 60% +8 32% 21% % 14% +3 5% 5% = ES 62% 68% +6 16% 8% -8 9% 10% +1 13% 14% +1 FR 52% 58% +6 18% 12% -6 15% 17% +2 15% 13% -2 CY 73% 79% +6 12% 10% -2 5% 5% = 10% 6% -4 PT 49% 55% +6 21% 17% -4 17% 16% -1 13% 12% -1 DK 34% 40% +6 22% 20% -2 38% 33% -5 6% 7% +1 HU 45% 51% +6 27% 22% -5 21% 21% = 7% 6% -1 RO 60% 66% +6 15% 14% -1 14% 10% -4 11% 10% -1 FI 41% 46% +5 27% 22% -5 26% 28% +2 6% 4% -2 LT 49% 53% +4 27% 22% -5 14% 16% +2 10% 9% -1 CZ 39% 42% +3 24% 19% -5 28% 30% +2 9% 9% = LV 48% 51% +3 21% 23% +2 23% 16% -7 8% 10% +2 SE 42% 45% +3 18% 13% -5 30% 34% +4 10% 8% -2 EE 52% 52% = 23% 23% = 15% 16% +1 10% 9% -1 SK 57% 56% -1 21% 19% -2 18% 20% +2 4% 5% +1 AT 37% 35% -2 33% 35% +2 28% 28% = 2% 2% = NL 53% 47% -6 12% 13% +1 30% 35% +5 5% 5% = 44

 European")

45 F. THE EUROPEAN PARLIAMENT TODAY AND TOMORROW: PRIORITY POLICIES AND VALUES 1. PRIORITY POLICIES a) European average = = = - 2 Items obtaining 20% or more 45
46 b) National results 46
47 c) National results: evolution QP9T The European Parliament promotes the development of certain policies at EU level. In your opinion which of the following policies should be given priority? Firstly? And then? (SEVERAL ANSWERS POSSIBLE) Tackling poverty and social exclusion Coordinating economic, budget and tax policies Improving consumer and public health protection A security and defence policy that enables the EU to face up to international crisis EB77.4 June Dec.-June EB77.4 June Dec.-June EB77.4 June Dec.-June EB77.4 June EU27 50% 53% +3 37% 35% -2 31% 30% -1 28% 28% = EURO ZONE 51% 54% +3 42% 39% -3 31% 30% -1 30% 28% -2 Dec.-June NON-EURO 49% 52% +3 29% 28% -1 30% 30% = 26% 28% +2 CY 59% 70% % 48% +7 60% 63% +3 48% 39% -9 UK 37% 47% % 27% +3 24% 24% = 19% 20% +1 BE 50% 59% +9 38% 35% -3 31% 34% +3 22% 20% -2 FR 52% 61% +9 35% 30% -5 32% 27% -5 35% 29% -6 IE 44% 48% +4 38% 35% -3 36% 36% = 23% 19% -4 EL 67% 71% +4 39% 38% -1 44% 46% +2 29% 25% -4 SK 45% 49% +4 44% 47% +3 34% 33% -1 28% 33% +5 FI 58% 62% +4 43% 40% -3 29% 34% +5 32% 28% -4 RO 50% 54% +4 21% 26% +5 39% 41% +2 40% 48% +8 SI 59% 62% +3 46% 45% -1 27% 32% +5 15% 15% = SE 55% 58% +3 28% 21% -7 16% 18% +2 33% 28% -5 EE 48% 50% +2 51% 50% -1 29% 32% +3 28% 26% -2 ES 63% 65% +2 41% 36% -5 36% 40% +4 24% 26% +2 AT 51% 53% +2 40% 38% -2 26% 28% +2 25% 25% = CZ 50% 51% +1 38% 37% -1 34% 36% +2 29% 29% = DE 51% 51% = 54% 47% -7 24% 25% +1 27% 25% -2 MT 41% 41% = 18% 17% -1 44% 42% -2 29% 25% -4 NL 50% 50% = 49% 46% -3 36% 33% -3 26% 24% -2 BG 61% 61% = 22% 27% +5 42% 39% -3 28% 30% +2 DK 48% 48% = 18% 13% -5 24% 26% +2 28% 28% = LV 61% 61% = 47% 42% -5 33% 30% -3 23% 20% -3 LT 57% 57% = 55% 59% +4 32% 31% -1 19% 20% +1 IT 39% 37% -2 35% 37% +2 31% 29% -2 37% 39% +2 PT 63% 61% -2 32% 38% +6 36% 32% -4 21% 22% +1 PL 57% 55% -2 30% 25% -5 38% 34% -4 26% 31% +5 LU 49% 45% -4 31% 28% -3 28% 27% -1 31% 32% +1 HU 62% 58% -4 54% 49% -5 25% 25% = 30% 31% +1 top 4 items 47

48 2. VALUES TO DEFEND a) European average = + 4 = = - 1 = =
49 b) National results 49
50 c) National results: evolution QP10 In your opinion, which of the following values should the European Parliament defend as a matter of priority? (MAX. 3 ANSWERS) The protection of human rights Solidarity between EU Member States Equality between men and women Freedom of speech EU27 56% 56% = 31% 35% +4 33% 32% -1 32% 32% = EURO ZONE 58% 57% -1 34% 37% +3 35% 33% -2 31% 29% -2 NON-EURO 52% 55% +3 27% 32% +5 29% 29% = 35% 36% +1 ES 56% 55% -1 26% 34% +8 37% 31% -6 31% 27% -4 PL 50% 54% +4 29% 37% +8 24% 20% -4 23% 25% +2 RO 54% 64% % 45% +7 33% 41% +8 24% 34% +10 AT 54% 58% +4 29% 35% +6 44% 39% -5 27% 27% = SI 68% 64% -4 38% 44% +6 38% 28% % 31% -1 UK 43% 46% +3 14% 20% +6 31% 32% +1 46% 44% -2 FR 60% 61% +1 30% 35% +5 50% 49% -1 45% 44% -1 DE 68% 69% +1 34% 38% +4 36% 30% -6 21% 20% -1 MT 49% 49% = 22% 26% +4 43% 32% % 24% +3 PT 43% 41% -2 33% 37% +4 27% 27% = 18% 17% -1 FI 68% 66% -2 27% 30% +3 35% 37% +2 48% 46% -2 BG 67% 67% = 58% 61% +3 25% 27% +2 21% 22% +1 EE 64% 61% -3 36% 38% +2 23% 22% -1 39% 40% +1 CY 82% 78% -4 49% 51% +2 41% 37% -4 32% 32% = CZ 63% 63% = 38% 40% +2 29% 26% -3 29% 26% -3 DK 64% 62% -2 25% 27% +2 26% 30% +4 56% 54% -2 LV 55% 49% -6 34% 36% +2 12% 14% +2 31% 32% +1 LU 54% 46% -8 41% 42% +1 37% 45% +8 32% 35% +3 LT 66% 62% -4 33% 34% +1 16% 16% = 34% 33% -1 IT 46% 43% -3 37% 37% = 23% 23% = 23% 23% = NL 61% 59% -2 32% 31% -1 33% 38% +5 52% 55% +3 SK 65% 61% -4 45% 44% -1 28% 28% = 29% 30% +1 BE 51% 46% -5 35% 34% -1 39% 35% -4 40% 34% -6 IE 51% 55% +4 31% 29% -2 41% 34% -7 35% 36% +1 SE 70% 68% -2 22% 20% -2 46% 50% +4 55% 55% = HU 60% 57% -3 41% 38% -3 25% 19% -6 22% 21% -1 EL 59% 54% -5 62% 57% -5 13% 12% -1 34% 30% -4 top 4 items 50
Two years to go to the 2014 European elections European Parliament Eurobarometer (EB/EP 77.4)
") Directorate-General for Communication PUBLIC OPINION MONITORING UNIT Brussels, 23 October 2012. Two years to go to the 2014 European elections European Parliament Eurobarometer (EB/EP 77.4) FOCUS ON THE
Directorate-General for Communication PUBLIC OPINION MONITORING UNIT Brussels, 23 October 2012. Two years to go to the 2014 European elections European Parliament Eurobarometer (EB/EP 77.4) FOCUS ON THE
Special Eurobarometer 418 SOCIAL CLIMATE REPORT
 Special Eurobarometer 418 SOCIAL CLIMATE REPORT Fieldwork: June 2014 Publication: November 2014 This survey has been requested by the European Commission, Directorate-General for Employment, Social Affairs
Two years to go to the 2014 European elections European Parliament Eurobarometer (EB/PE 77.4)
") Directorate-General for Communication Public Opinion Monitoring Unit Two years to go to the 2014 European elections European Parliament Eurobarometer (EB/PE 77.4) Brussels, 6 February 2013 FOCUS REPORT
Directorate-General for Communication Public Opinion Monitoring Unit Two years to go to the 2014 European elections European Parliament Eurobarometer (EB/PE 77.4) Brussels, 6 February 2013 FOCUS REPORT
January 2010 Euro area unemployment rate at 9.9% EU27 at 9.5%
 STAT//29 1 March 20 January 20 Euro area unemployment rate at 9.9% EU27 at 9.5% The euro area 1 (EA16) seasonally-adjusted 2 unemployment rate 3 was 9.9% in January 20, the same as in December 2009 4.
I. EUROPEANS AND THE TAX ON FINANCIAL TRANSACTION (TFT)...10 IV. THE REACTIONS OF THE MEMBER STATES TO THE CRISIS...19
...10 IV. THE REACTIONS OF THE MEMBER STATES TO THE CRISIS...19") Directorate General for Communication Directorate C - Relations with Citizens PUBLIC OPINION MONITORING UNIT Brussels, 22 June 2011 EUROPEANS AND THE CRISIS European Parliament Eurobarometer ( Parlemeter
Directorate General for Communication Directorate C - Relations with Citizens PUBLIC OPINION MONITORING UNIT Brussels, 22 June 2011 EUROPEANS AND THE CRISIS European Parliament Eurobarometer ( Parlemeter
October 2010 Euro area unemployment rate at 10.1% EU27 at 9.6%
 STAT//180 30 November 20 October 20 Euro area unemployment rate at.1% EU27 at 9.6% The euro area 1 (EA16) seasonally-adjusted 2 unemployment rate 3 was.1% in October 20, compared with.0% in September 4.
PUBLIC PERCEPTIONS OF VAT
 Special Eurobarometer 424 PUBLIC PERCEPTIONS OF VAT REPORT Fieldwork: October 2014 Publication: March 2015 This survey has been requested by the European Commission, Directorate-General for Taxations and
Flash Eurobarometer 470. Report. Work-life balance
 Work-life balance Survey requested by the European Commission, Directorate-General for Justice and Consumers and co-ordinated by the Directorate-General for Communication This document does not represent
Employment and Social Policy
 Special Eurobarometer 377 European Commission Employment and Social Policy REPORT Special Eurobarometer 377 / Wave TNS opinion & social Fieldwork: September October 2011 Publication: December 2011 This
Fieldwork February March 2008 Publication October 2008
 Special Eurobarometer 298 European Commission Consumer protection in the internal market Fieldwork February March 2008 Publication October 2008 Report Special Eurobarometer 298 / Wave 69.1 TNS Opinion
Standard Eurobarometer 83 Spring 2015 THE EU BUDGET REPORT
 Standard Eurobarometer 83 Spring 2015 THE EU BUDGET REPORT Fieldwork: May 2015 This survey has been requested and co-ordinated by the European Commission, Directorate-General for Communication. http://ec.europa.eu/public_opinion/index_en.htm
Standard Eurobarometer
 Standard Eurobarometer 67 / Spring 2007 Standard Eurobarometer European Commission SPECIAL EUROBAROMETER EUROPEANS KNOWELEDGE ON ECONOMICAL INDICATORS 1 1 This preliminary analysis is done by Antonis PAPACOSTAS
The 2009 European elections
 Special Eurobarometer 299 EUROPEAN PARLIAMENT European Commission The 2009 European elections Fieldwork: March May 2008 Publication: September 2008 Report Special Eurobarometer 299/ Wave 69.2 TNS opinion
Flash Eurobarometer 398 WORKING CONDITIONS REPORT
 Flash Eurobarometer WORKING CONDITIONS REPORT Fieldwork: April 2014 Publication: April 2014 This survey has been requested by the European Commission, Directorate-General for Employment, Social Affairs
Special Eurobarometer 459. Report. Climate change
 Climate change Survey requested by the European Commission, Directorate-General for Climate Action and co-ordinated by the Directorate- General for Communication This document does not represent the point
Growth, competitiveness and jobs: priorities for the European Semester 2013 Presentation of J.M. Barroso,
 Growth, competitiveness and jobs: priorities for the European Semester 213 Presentation of J.M. Barroso, President of the European Commission, to the European Council of 14-1 March 213 Economic recovery
May 2009 Euro area external trade surplus 1.9 bn euro 6.8 bn euro deficit for EU27
 STAT/09/106 17 July 2009 May 2009 Euro area external trade surplus 1.9 6.8 deficit for EU27 The first estimate for the euro area 1 (EA16) trade balance with the rest of the world in May 2009 gave a 1.9
Flash Eurobarometer 458. The euro area
 The euro area Survey requested by the European Commission, Directorate-General for Economic and Financial Affairs and co-ordinated by the Directorate-General for Communication This document does not represent
Social Protection and Social Inclusion in Europe Key facts and figures
 MEMO/08/625 Brussels, 16 October 2008 Social Protection and Social Inclusion in Europe Key facts and figures What is the report and what are the main highlights? The European Commission today published
Flash Eurobarometer 408 EUROPEAN YOUTH REPORT
 Flash Eurobarometer EUROPEAN YOUTH REPORT Fieldwork: December 2014 Publication: April 2015 This survey has been requested by the European Commission, Directorate-General for Education and Culture and co-ordinated
Flash Eurobarometer N o 189a EU communication and the citizens. Analytical Report. Fieldwork: April 2008 Report: May 2008
 Gallup Flash Eurobarometer N o 189a EU communication and the citizens Flash Eurobarometer European Commission Expectations of European citizens regarding the social reality in 20 years time Analytical
Europeans knowledge of economic indicators
 Special Eurobarometer 323 European Commission Europeans knowledge of economic indicators Fieldwork: August - September 2009 Publication: January 2010 Special Eurobarometer 323 / Wave 72.1 TNS Opinion &
Flash Eurobarometer 458. Report. The euro area
 The euro area Survey requested by the European Commission, Directorate-General for Economic and Financial Affairs and co-ordinated by the Directorate-General for Communication This document does not represent
Taxation trends in the European Union EU27 tax ratio at 39.8% of GDP in 2007 Steady decline in top personal and corporate income tax rates since 2000
 DG TAXUD STAT/09/92 22 June 2009 Taxation trends in the European Union EU27 tax ratio at 39.8% of GDP in 2007 Steady decline in top personal and corporate income tax rates since 2000 The overall tax-to-gdp
Flash Eurobarometer 441. Report. European SMEs and the Circular Economy
 European SMEs and the Circular Economy Survey requested by the European Commission, Directorate-General Environment and co-ordinated by the Directorate-General for Communication This document does not
Eco-label Flower week 2006
 Special Eurobarometer European Commission Eco-label Flower week 2006 Fieldwork: November-December 2006 Publication: January 2007 Special Eurobarometer 275 / Wave 66.3 TNS Opinion & Social This survey was
Fieldwork February March 2008 Publication June 2008
 Special Eurobarometer 297 European Commission Attitudes towards radioactive waste Fieldwork February March 2008 Publication June 2008 Report Special Eurobarometer 297 / Wave 69.1 TNS Opinion & Social This
January 2009 Euro area external trade deficit 10.5 bn euro 26.3 bn euro deficit for EU27
 STAT/09/40 23 March 2009 January 2009 Euro area external trade deficit 10.5 26.3 deficit for EU27 The first estimate for the euro area 1 (EA16) trade balance with the rest of the world in January 2009
Securing sustainable and adequate social protection in the EU
 Securing sustainable and adequate social protection in the EU Session on Social Protection & Security IFA 12th Global Conference on Ageing 11 June 2014, HICC Hyderabad India Dr Lieve Fransen European Commission
Traffic Safety Basic Facts Main Figures. Traffic Safety Basic Facts Traffic Safety. Motorways Basic Facts 2015.
 Traffic Safety Basic Facts 2013 - Main Figures Traffic Safety Basic Facts 2015 Traffic Safety Motorways Basic Facts 2015 Motorways General Almost 30.000 people were killed in road accidents on motorways
August 2008 Euro area external trade deficit 9.3 bn euro 27.2 bn euro deficit for EU27
 STAT/08/143 17 October 2008 August 2008 Euro area external trade deficit 9.3 27.2 deficit for EU27 The first estimate for the euro area 1 (EA15) trade balance with the rest of the world in August 2008
Gender pension gap economic perspective
 Gender pension gap economic perspective Agnieszka Chłoń-Domińczak Institute of Statistics and Demography SGH Part of this research was supported by European Commission 7th Framework Programme project "Employment
DATA SET ON INVESTMENT FUNDS (IVF) Naming Conventions
 Naming Conventions") DIRECTORATE GENERAL STATISTICS LAST UPDATE: 10 APRIL 2013 DIVISION MONETARY & FINANCIAL STATISTICS ECB-UNRESTRICTED DATA SET ON INVESTMENT FUNDS (IVF) Naming Conventions The series keys related to Investment
DIRECTORATE GENERAL STATISTICS LAST UPDATE: 10 APRIL 2013 DIVISION MONETARY & FINANCIAL STATISTICS ECB-UNRESTRICTED DATA SET ON INVESTMENT FUNDS (IVF) Naming Conventions The series keys related to Investment
Safer Internet. Fieldwork Dec Jan 2006 Publication May 2006
 Special Eurobarometer European Commission Safer Internet Fieldwork Dec 2005 - Jan 2006 Publication May 2006 Special Eurobarometer 250 / Wave 64.4 TNS Opinion & Social This survey was requested by Directorate
0pinions on organised, cross-border crime and corruption
 Special Eurobarometer European Commission 0pinions on organised, cross-border crime and corruption Fieldwork: November - December 2005 Publication: March 2006 Special Eurobarometer 245 / Wave 64.3 TNS
NOTE ON EU27 CHILD POVERTY RATES
 NOTE ON EU7 CHILD POVERTY RATES Research note prepared for Child Poverty Action Group Authors: H. Xavier Jara and Chrysa Leventi Institute for Social and Economic Research (ISER) University of Essex The
SOLIDARITY THAT SPANS THE GLOBE: EUROPEANS AND DEVELOPMENT AID
 Special Eurobarometer 392 SOLIDARITY THAT SPANS THE GLOBE: EUROPEANS AND DEVELOPMENT AID REPORT Fieldwork: June 2012 Publication: October 2012 This survey has been requested by Directorate-General Development
PROGRESS TOWARDS THE LISBON OBJECTIVES 2010 IN EDUCATION AND TRAINING
 PROGRESS TOWARDS THE LISBON OBJECTIVES IN EDUCATION AND TRAINING In 7, reaching the benchmarks for continues to pose a serious challenge for education and training systems in Europe, except for the goal
New Europeans. Fieldwork : March 2010 April 2010 Publication: April 2011
 Special Eurobarometer European Commission New Europeans Report Fieldwork : March 2010 April 2010 Publication: April 2011 Special Eurobarometer 346 / Wave TNS Opinion & Social This survey was requested
December 2010 Euro area annual inflation up to 2.2% EU up to 2.6%
 STAT/11/9 14 January 2011 December 2010 Euro area annual inflation up to 2.2% EU up to 2.6% Euro area 1 annual inflation was 2.2% in December 2010 2, up from 1.9% in November. A year earlier the rate was
STAT/14/ October 2014
 STAT/14/158-21 October 2014 Provision of deficit and debt data for 2013 - second notification Euro area and EU28 government deficit at 2.9% and 3.2% of GDP respectively Government debt at 90.9% and 85.4%
Traffic Safety Basic Facts Main Figures. Traffic Safety Basic Facts Traffic Safety. Motorways Basic Facts 2017.
 Traffic Safety Basic Facts 2013 - Main Figures Traffic Safety Basic Facts 2015 Traffic Safety Motorways Basic Facts 2017 Motorways General More than 24.000 people were killed in road accidents on motorways
Europeans attitudes towards the issue of sustainable consumption and production. Analytical report
 Flash Eurobarometer 256 The Gallup Organisation Analytical Report Flash EB N o 251 Public attitudes and perceptions in the euro area Flash Eurobarometer European Commission Europeans attitudes towards
PROGRESS TOWARDS THE LISBON OBJECTIVES 2010 IN EDUCATION AND TRAINING
 PROGRESS TOWARDS THE LISBON OBJECTIVES IN EDUCATION AND TRAINING In, reaching the benchmarks for continues to pose a serious challenge for education and training systems in Europe, except for the goal
Europeans attitudes towards climate change. Report. Special Eurobarometer 300. Fieldwork March April 2008 Publication September 2008
 Special Eurobarometer 300 EUROPEAN PARLIAMENT European Commission Europeans attitudes towards climate change Fieldwork March April 2008 Publication September 2008 Report Special Eurobarometer 300 / Wave
Traffic Safety Basic Facts Main Figures. Traffic Safety Basic Facts Traffic Safety. Motorways Basic Facts 2016.
 Traffic Safety Basic Facts 2013 - Main Figures Traffic Safety Basic Facts 2015 Traffic Safety Motorways Basic Facts 2016 Motorways General Almost 26.000 people were killed in road accidents on motorways
of the European Commission. Communication. This document of the authors. Standard Eurobarometer 75 / Spring 2011 TNS opinion & social
 Standard Eurobarometer European Commission EUROBAROMETER 75 SPRING 2011 Europeans and the European Union budget REPORT Standard Eurobarometer 75 / Spring 2011 TNS opinion & social Fieldwork: May 2011 Publication:
HOW RECESSION REFLECTS IN THE LABOUR MARKET INDICATORS
 REPUBLIC OF SLOVENIA HOW RECESSION REFLECTS IN THE LABOUR MARKET INDICATORS Matej Divjak, Irena Svetin, Darjan Petek, Miran Žavbi, Nuška Brnot ??? What is recession?? Why in Europe???? Why in Slovenia?
Vocational Training. Fieldwork October-November 2004 Publication August 2005
 Special Eurobarometer European Commission Vocational Training Fieldwork October-November 2004 Publication August 2005 Special Eurobarometer 216 / Wave 62..1 TNS Opinion & Social This survey was requested
Development Aid in times of economic turmoil
 Special Eurobarometer European Commission Development Aid in times of economic turmoil Fieldwork: May 2009 June 2009 Publication: October 2009 Special Eurobarometer 318 / Wave 71.2 TNS Opinion & Social
State of play of CAP measure Setting up of Young Farmers in the European Union
 State of play of CAP measure Setting up of Young Farmers in the European Union Michael Gregory EN RD Contact Point Seminar CEJA 20 th September 2010 Measure 112 rationale: Measure 112 - Setting up of young
COMMISSION DECISION of 23 April 2012 on the second set of common safety targets as regards the rail system (notified under document C(2012) 2084)
 2084)") 27.4.2012 Official Journal of the European Union L 115/27 COMMISSION DECISION of 23 April 2012 on the second set of common safety targets as regards the rail system (notified under document C(2012) 2084)
27.4.2012 Official Journal of the European Union L 115/27 COMMISSION DECISION of 23 April 2012 on the second set of common safety targets as regards the rail system (notified under document C(2012) 2084)
COMMISSION STAFF WORKING DOCUMENT Accompanying the document. Report form the Commission to the Council and the European Parliament
 EUROPEAN COMMISSION Brussels, 4.5.2018 SWD(2018) 246 final PART 5/9 COMMISSION STAFF WORKING DOCUMENT Accompanying the document Report form the Commission to the Council and the European Parliament on
THE 2015 EU JUSTICE SCOREBOARD
 THE 215 EU JUSTICE SCOREBOARD Communication from the Commission to the European Parliament, the Council, the European Central Bank, the European Economic and Social Committee and the Committee of the Regions
Overview of Eurofound surveys
 Overview of Eurofound surveys Dublin 21 st October 2010 Maija Lyly-Yrjänäinen Eurofound data European Working Conditions Survey 91, 95, 00, 05, 10 European Quality of Life Survey 03, 07, 09, 10 (EB), 11
European Employment and Social Policy
 Special Eurobarometer European Commission European Employment and Social Policy Report Fieldwork : May 2009 June 2009 Publication: September 2009 Special Eurobarometer 316 / Wave 71.2 TNS Opinion & Social
Fieldwork November - December 2009 Publication June 2010
 Special Eurobarometer 337 European Commission Geographical and labour market mobility Report Fieldwork November - December 2009 Publication June 2010 Special Eurobarometer 337 / Wave TNS Opinion & Social
COMMISSION STAFF WORKING DOCUMENT Accompanying the document
 EUROPEAN COMMISSION Brussels, 9.10.2017 SWD(2017) 330 final PART 13/13 COMMISSION STAFF WORKING DOCUMENT Accompanying the document REPORT FROM THE COMMISSION TO THE EUROPEAN PARLIAMENT, THE COUNCIL, THE
May 2009 Euro area annual inflation down to 0.0% EU down to 0.7%
 STAT/09/88 16 June 2009 May 2009 Euro area annual inflation down to 0.0% EU down to 0.7% Euro area 1 annual inflation was 0.0% in May 2009 2, down from 0.6% in April. A year earlier the rate was 3.7%.
Fiscal sustainability challenges in Romania
 Preliminary Draft For discussion only Fiscal sustainability challenges in Romania Bucharest, May 10, 2011 Ionut Dumitru Anca Paliu Agenda 1. Main fiscal sustainability challenges 2. Tax collection issues
Active Ageing. Fieldwork: September November Publication: January 2012
 Special Eurobarometer 378 Active Ageing SUMMARY Special Eurobarometer 378 / Wave EB76.2 TNS opinion & social Fieldwork: September November 2011 Publication: January 2012 This survey has been requested
Europeans and the Common Agricultural Policy
 Special Eurobarometer European Commission Europeans and the Common Agricultural Policy Fieldwork October - November 2005 Publication January 2006 Special Eurobarometer 242 / Wave 64.2 - TNS Opinion & Social
Library statistical spotlight
 /9/2 Library of the European Parliament 6 4 2 This document aims to provide a picture of the, in particular by looking at car production trends since 2, at the number of enterprises and the turnover they
Themes Income and wages in Europe Wages, productivity and the wage share Working poverty and minimum wage The gender pay gap
 5. W A G E D E V E L O P M E N T S At the ETUC Congress in Seville in 27, wage developments in Europe were among the most debated issues. One of the key problems highlighted in this respect was the need
How much does it cost to make a payment?
 How much does it cost to make a payment? Heiko Schmiedel European Central Bank Directorate General Payments & Market Infrastructure, Market Integration Division World Bank Global Payments Week 23 October
Eurofound in-house paper: Part-time work in Europe Companies and workers perspective
 Eurofound in-house paper: Part-time work in Europe Companies and workers perspective Presented by: Eszter Sandor Research Officer, Surveys and Trends 26/03/2010 1 Objectives Examine the patterns of part-time
Flash Eurobarometer 386 THE EURO AREA REPORT
 Eurobarometer THE EURO AREA REPORT Fieldwork: October 2013 Publication: November 2013 This survey has been requested by the European Commission, Directorate-General for Economic and Financial Affairs and
Country Health Profiles
 State of Health in the EU Country Health Profiles Brussels, November 2017 1 The Country Health Profiles 1. Highlights 2. Health status 3. Risk Factors 4. Health System (description) 5. Performance of Health
EUROSTAT SUPPLEMENTARY TABLE FOR REPORTING GOVERNMENT INTERVENTIONS TO SUPPORT FINANCIAL INSTITUTIONS
 EUROPEAN COMMISSION EUROSTAT Directorate D: Government Finance Statistics (GFS) and Quality Unit D1: Excessive deficit procedure and methodology Unit D2: Excessive deficit procedure (EDP) 1 Unit D3: Excessive
Humanitarian Aid. Fieldwork June July 2006 Publication October 2006
 Special Eurobarometer European Commission Humanitarian Aid Fieldwork June July 2006 Publication October 2006 Special Eurobarometer 268 / Wave 65.4 TNS Opinion & Social This survey was requested by Directorate
Trust, Statistics & Knowledge Evidence from the EC Special Eurobarometer survey 2009
 Charting Progress, Building Visions, Improving Life Busan, Korea - 27 October 2009 Trust, Statistics & Knowledge Evidence from the EC Special Eurobarometer survey 2009 Marco Mira d Ercole (OECD), A. Papacostas(Eurobarometer)
Attitudes of Europeans Towards Tourism REPORT
 Flash Eurobarometer Attitudes of Europeans Towards Tourism REPORT Fieldwork: January 22 Publication: March 22 This survey has been requested by the Directorate-General Enterprise and co-ordinated by Directorate-
LEADER implementation update Leader/CLLD subgroup meeting Brussels, 21 April 2015
 LEADER 2007-2013 implementation update Leader/CLLD subgroup meeting Brussels, 21 April 2015 #LeaderCLLD 2,416 2,416 8.9 Progress on LAG selection in the EU (2007-2013) 3 000 2 500 2 000 2 182 2 239 2 287
FIRST REPORT COSTS AND PAST PERFORMANCE
 FIRST REPORT COSTS AND PAST PERFORMANCE DECEMBER 2018 https://eiopa.europa.eu/ PDF ISBN 978-92-9473-131-9 ISSN 2599-8862 doi: 10.2854/480813 EI-AM-18-001-EN-N EIOPA, 2018 Reproduction is authorised provided
For further information, please see online or contact
 For further information, please see http://ec.europa.eu/research/sme-techweb online or contact Lieve.VanWoensel@ec.europa.eu Seventh Progress Report on SMEs participation in the 7 th R&D Framework Programme
Fiscal competitiveness issues in Romania
 Fiscal competitiveness issues in Romania Ionut Dumitru President of the Fiscal Council, Chief Economist Raiffeisen Bank* October 2014 World Bank Doing Business Report Ranking (out of 189 countries) Ease
Harmonised Index of Consumer Prices (HICP) August 2015
 August 2015") Aug-14 Sep-14 Oct-14 Nov-14 Dec-14 Jan-15 Feb-15 Mar-15 Apr-15 May-15 Jun-15 MONTENEGRO STATISTICAL OFFICE R E L E A S E Broj: 201 Podgorica, 18 September 2015 When using the data please name the source
Aug-14 Sep-14 Oct-14 Nov-14 Dec-14 Jan-15 Feb-15 Mar-15 Apr-15 May-15 Jun-15 MONTENEGRO STATISTICAL OFFICE R E L E A S E Broj: 201 Podgorica, 18 September 2015 When using the data please name the source
EUROPEAN COMMISSION EUROSTAT
 EUROPEAN COMMISSION EUROSTAT Directorate F: Social statistics Unit F-3: Labour market Doc.: Eurostat/F3/LAMAS/29/14 WORKING GROUP LABOUR MARKET STATISTICS Document for item 3.2.1 of the agenda LCS 2012
The EFTA Statistical Office: EEA - the figures and their use
 The EFTA Statistical Office: EEA - the figures and their use EEA Seminar Brussels, 13 September 2012 1 Statistics Comparable, impartial and reliable statistical data are a prerequisite for a democratic
EUROSTAT SUPPLEMENTARY TABLE FOR REPORTING GOVERNMENT INTERVENTIONS TO SUPPORT FINANCIAL INSTITUTIONS
 EUROPEAN COMMISSION EUROSTAT Directorate D: Government Finance Statistics (GFS) and Quality Unit D1: Excessive deficit procedure and methodology Unit D2: Excessive deficit procedure (EDP) 1 Unit D3: Excessive
Transition from Work to Retirement in EU25
 EUROPEAN CENTRE EUROPÄISCHES ZENTRUM CENTRE EUROPÉEN 1 Asghar Zaidi is Director Research at the European Centre for Social Welfare Policy and Research, Vienna; Michael Fuchs is Researcher at the European
Issues Paper. 29 February 2012
 29 February 212 Issues Paper In the context of the European semester, the March European Council gives, on the basis of the Commission's Annual Growth Survey, guidance to Member States for the Stability
Report on the distribution of direct payments to agricultural producers (financial year 2016)
") Report on the distribution of direct payments to agricultural producers (financial year 2016) Every year, the Commission publishes the distribution of direct payments to farmers by Member State. Figures
Report on the distribution of direct payments to agricultural producers (financial year 2016) Every year, the Commission publishes the distribution of direct payments to farmers by Member State. Figures
2 ENERGY EFFICIENCY 2030 targets: time for action
 ENERGY EFFICIENCY 2030 targets: time for action The Coalition for Energy Savings The Coalition for Energy Savings strives to make energy efficiency and savings the first consideration of energy policies
November 5, Very preliminary work in progress
 November 5, 2007 Very preliminary work in progress The forecasting horizon of inflationary expectations and perceptions in the EU Is it really 2 months? Lars Jonung and Staffan Lindén, DG ECFIN, Brussels.
Introduction to EU Regional and Innovation Policy
 China EU Training on Regional Policy () Twinning session in Tianjin: Regional development and innovation Introduction to EU Regional and Innovation Policy Tianjin, 29 July 2014 Pablo Gándara Coordinator
No work in sight? The role of governments and social partners in fostering labour market inclusion of young people
 No work in sight? The role of governments and social partners in fostering labour market inclusion of young people Joint seminar of the European Parliament and EU agencies 30 June 2011 1. Young workers
COVER NOTE The Employment Committee Permanent Representatives Committee (Part I) / Council EPSCO Employment Performance Monitor - Endorsement
 / Council EPSCO Employment Performance Monitor - Endorsement") COUNCIL OF THE EUROPEAN UNION Brussels, 15 June 2011 10666/1/11 REV 1 SOC 442 ECOFIN 288 EDUC 107 COVER NOTE from: to: Subject: The Employment Committee Permanent Representatives Committee (Part I) / Council
COUNCIL OF THE EUROPEAN UNION Brussels, 15 June 2011 10666/1/11 REV 1 SOC 442 ECOFIN 288 EDUC 107 COVER NOTE from: to: Subject: The Employment Committee Permanent Representatives Committee (Part I) / Council
EUROBAROMETER 71. Fieldwork: June - July 2009 Publication: January 2010
 EUROBAROMETER 66 Standard Eurobarometer Report European Commission EUROBAROMETER 71 Future of Europe Fieldwork: June - July 2009 Publication: January 2010 Standard Eurobarometer 71/ Spring 2009 - TNS Opinion
Health and food. Fieldwork November December 2005 Publication November 2006
 Special Eurobarometer European Commission Health and food Fieldwork November December 2005 Publication November 2006 Special Eurobarometer 246 / Wave 64.3 TNS Opinion & Social This survey was requested
REGIONAL PROGRESS OF THE LISBON STRATEGY OBJECTIVES IN THE EUROPEAN REGION EGRI, ZOLTÁN TÁNCZOS, TAMÁS
 REGIONAL PROGRESS OF THE LISBON STRATEGY OBJECTIVES IN THE EUROPEAN REGION EGRI, ZOLTÁN TÁNCZOS, TAMÁS Key words: Lisbon strategy, mobility factor, education-employment factor, human resourches. CONCLUSIONS
Aggregation of periods for unemployment benefits. Report on U1 Portable Documents for mobile workers Reference year 2016
 Aggregation of periods for unemployment benefits Report on U1 Portable Documents for mobile workers Reference year 2016 Frederic De Wispelaere & Jozef Pacolet - HIVA KU Leuven June 2017 EUROPEAN COMMISSION
EBA REPORT ON HIGH EARNERS
 EBA REPORT ON HIGH EARNERS DATA AS OF END 2017 LONDON - 11/03/2019 1 Data on high earners List of figures 3 Executive summary 4 1. Data on high earners 6 1.1 Background 6 1.2 Data collected on high earners
In 2008 gross expenditure on social protection in EU-27 accounted for 26.4 % of GDP
 Population and social conditions Author: Antonella PUGLIA Statistics in focus 17/2011 In 2008 gross expenditure on social protection in EU-27 accounted for 26.4 % of GDP Social protection benefits are
COUNCIL OF THE EUROPEAN UNION. Brussels, 13 June /1/13 REV 1 SOC 409 ECOFIN 444 EDUC 190
 COUNCIL OF THE EUROPEAN UNION Brussels, 13 June 2013 10373/1/13 REV 1 SOC 409 ECOFIN 444 EDUC 190 COVER NOTE from: to: Subject: The Employment Committee Permanent Representatives Committee (Part I) / Council
Macroeconomic overview SEE and Macedonia
 Macroeconomic overview SEE and Macedonia Zoltan Arokszallasi Chief Analyst, Macro & FX/FI Research Erste Group Bank Erste Investors Breakfast, 29 September, Skopje 02. Oktober SEE shows mixed performance
WELCOME TO THE EUROPEAN PARLIAMENT! Directorate General for Communication, Visits and Seminars Unit
 WELCOME TO THE EUROPEAN PARLIAMENT! jan.rebrina@ep.europa.eu Directorate General for Communication, Visits and Seminars Unit WORKING PLACES 2 EU OBJECTIVES 3 Peace Stability Sustainability Freedom and
Taylor & Francis Open Access Survey Open Access Mandates
 Taylor & Francis Open Access Survey Open Access Mandates Annex C European Union November 2014 November 2014 0 The results presented in this report are based on research carried out on behalf of Taylor
European Commission. Statistical Annex of Alert Mechanism Report 2017
 European Commission Statistical Annex of Alert Mechanism Report 2017 COMMISSION STAFF WORKING DOCUMENT STATISTICAL ANNEX Accompanying the document REPORT FROM THE COMMISSION TO THE EUROPEAN PARLIAMENT,
Implementation by the Member States- Supervision of repositories
 Implementation by the Member States- Supervision of repositories "Safer Europe without Falsified Medicines" 8 November 2017 Tallin Agnès Mathieu-Mendes Deputy Head of Unit DG SANTE European Commission