Employment and Social Policy
|
|
|
- Deborah Hillary Harper
- 5 years ago
- Views:
Transcription
.")
1 Special Eurobarometer 377 European Commission Employment and Social Policy REPORT Special Eurobarometer 377 / Wave TNS opinion & social Fieldwork: September October 2011 Publication: December 2011 This survey has been requested by the Directorate-General Employment, Social Affairs and Inclusion and co-ordinated by Directorate-General for Communication (DG COMM Research and Speechwriting Unit). This document does not represent the point of view of the European Commission. The interpretations and opinions contained in it are solely those of the authors.
2 SPECIAL EUROBAROMET Special Eurobarometer 377 Employment and Social Policy Conducted by TNS Opinion & Social at the request of the European Commission's Directorate-General for Employment, Social Affairs and Inclusion Survey co-ordinated by the Directorate-General for Communication
3 INTRODUCTION... 3 EXECUTIVE SUMMARY PERCEIVED IMPACT OF THE ECONOMIC CRISIS ON THE JOB MARKET Concern about impact of the crisis on jobs Perceived economic crisis cycle EUROPEANS CURRENT EMPLOYMENT SITUATION Sample structure Length of current/last job Frequency of changing employers EUROPEANS ATTITUDES TOWARDS EMPLOYMENT Europeans support for flexicurity Perceived impact of austerity measures and poverty The effectiveness of employment measures CONFIDENCE RISE IN RETAINING EMPLOYMENT Confidence in retaining jobs Confidence in having a job in two years time CONSEQUENCES OF JOB LOSS Confidence in finding new employment Expectations regarding the level of unemployment insurance JOB SEEKING Job seeking strategies Perceived obstacles to starting a business The importance of qualifications and professional experience TRAINING Participation in training The need for training to retain current employment The need for training to find employment Perceived obstacles to training TRAINEESHIP AND CAREER GUIDANCE Participation in traineeship Assessments of the value of traineeships in finding a job Assessments of career guidance and information on future skills PERCEPTIONS OF EU EMPLOYMENT AND SOCIAL POLICIES Familiarity with the European Social Fund and European Globalisation Adjustment Fund Impact of the EU on employment and social policy CONCLUSION ANNEXES Technical Note Questionnaire Tables 2
4 INTRODUCTION Despite Europe s initially promising recovery from the economic and financial crisis of , by 2011 severe economic turbulence had returned to Europe. Several EU Member States Greece, Ireland and Portugal have been forced to seek assistance from the European Union via the stabilisation fund put in place as a part of an emergency package and from the International Monetary Fund, while many other European countries have been implementing difficult and unpopular austerity measures in order to tackle their mounting debts. At the time of writing, the euro-zone was under particular pressure, amid intense speculation over whether Greece would be able to remain a member of the single currency. The situation in every EU country today is different, but overall there is clearly wide popular discontent among many Europeans at the loss of jobs and the cuts in public spending. That is why strengthening the social dimension of the Europe 2020 strategy is the key priority for EU employment and social policies, to mitigate the impact of the present period of economic restructuring. The Europe 2020 strategy includes among its targets 1 the raising of the average EU employment rate to 75%; it also aims to lift 20 million people in or at risk of poverty and social exclusion out of this category. While the economic crisis makes these objectives even more challenging, the EU s coordination efforts in the area of social protection and social inclusion 2 alongside its European Employment Strategy 3 provide the necessary framework to enable national governments to work together with the EU to help minimise the damage caused by the economic downturn. Although there are 23 million people out of work across the EU, some employers are still reporting recruitment difficulties, especially for high-skilled jobs. Making sure job seekers have the right skills for the current and future labour market is crucial. EU funds are available precisely to support Member States efforts in training and retraining workers. The European Social Fund 4 is the main financial lever for EU employment and social policy. To reach its employment and poverty-reduction targets, the EU has also launched a number of practical initiatives: 'Youth on the Move' - to promote the employment of young people, help them in their transition from education to work, and encourage mobility within Europe. 'An Agenda for new skills and jobs' to address more structural challenges in Europe's labour markets, particularly in matching skills with available jobs. The European Platform against Poverty and Social Exclusion to step up coordination between a wider range of partners in the fight against exclusion
5 As part of the first 'European Semester' which provides the coordination and monitoring cycle for achieving our Europe 2020 targets and changes the way governments shape their economic and fiscal policies, the EU also set specific recommendations for each country. The Annual Growth Surveys (AGS) 5 in January and November 2011 including the Joint Employment Reports to help with identifying the key structural labour market reforms to combat unemployment, to address the unacceptable unemployment situation of young people, supporting growth and Member States' efforts towards successful exit from the crisis. Proposing a budget reinforced by at least 7.5% for the European Social Fund that provides 10 billion each year, helping 10 million Europeans annually to find a job or to keep the job they have. Making 3 billion available for the European Globalisation Fund 6, to support workers in all sectors who lose their job. Proposing for the next EU budget an EU Programme for Social Change and Innovation to support employment and social policy across the Union. New, innovative approaches can help combine the needs of the socially excluded and Member States budget constraints. Running the EURES jobs portal that provides support for jobseekers who want to take up the right to work in another European country. Continuous monitoring of the employment and social situation, including the publication of a new series of monthly and quarterly monitoring reports on the rapidly changing situation. Publication of a series of surveys on perceptions of the social climate and the impact of the crisis 7 to provide a timely review of European citizens' perceptions of key aspects of the socio-economic situation. The EU played a leading role in the G20 Summit in Paris in September 2011, which produced recommendations fuelling employment policies, especially youth employment and vulnerable groups. To measure the impact of the economic crisis on jobs and employment prospects across the EU, the European Commission's Directorate-General for Employment, Social Affairs and Inclusion has commissioned this Eurobarometer study. The report builds on the work of an earlier report published in September 2009 Special Eurobarometer 316 European Employment and Social Policy 8 and wherever possible charts the evolution in respondents opinions over the intervening two years. This is particularly useful in gauging whether Europeans now feel more or less confident about their employment prospects than they did in Special Eurobarometer 316, conducted in May-June 2009: 4
6 The study begins by considering the perceived impact of the economic crisis on the job market, asking respondents how concerned they are about their own jobs and those of their family members, and about how soon they expect the downturn to end. It then looks at the employment status of the respondents themselves, whether they are in work, and how long they tend to stay with the same employer. It goes on to look at the level of public support for the EU s promotion of flexicurity, a policy approach that links the flexibility of the labour market with job security and social rights, and the perceived impact of the austerity measures and the EU s employment measures. It also assesses whether respondents who are currently working feel confident about retaining their jobs. The study then asks respondents how they would respond should they lose their job, and about their expectations in the event of redundancy. It also looks at attitudes to starting a business as a possible response to redundancy, and at the assets that job seekers should emphasise in order to return to work. The Eurobarometer report also tackles issues associated with training, such as its usefulness in helping participants to secure a job and also barriers to participating in training programmes. It also looks at traineeship and its value in finding employment, and evaluates the importance of information on skills required in the future. Finally, it considers the overall impact that respondents think the EU has in the area of employment and social policy, for example. helping people in finding a job, fighting poverty and social exclusion, and helping to modernise social protection systems. The report presents the principal results obtained 9. These are analysed in terms of the European average for the 27 Member States (EU27), then by EU sub-groups such as the euro-zone and non-euro area, and finally on a country-by-country basis. The reader should be aware that there are two types of reports for this Eurobarometer study. The full report contains an in-depth analysis and focuses on all the questions asked in the Eurobarometer survey. It reports in detail at the overall EU level as well as at national level and provides insights into socio-demographic analysis of the results. The summary report provides a concise snapshot of the main findings of this Eurobarometer. This Eurobarometer was carried out by TNS Opinion & Social between 24 September and 9 October The respondents were interviewed face-to-face by the interviewers of the TNS Opinion & Social network (the interviewers asked the questions in the respondent s home). The methodology used is that of Eurobarometer surveys as carried out by the Directorate General for Communication ( Research and Speech writing Unit). A technical note with further information on the interview methods and the confidence intervals is appended as an annex to this report. 9 Please also note that the total percentages shown in the tables of this report may exceed 100% where the respondent is allowed to give several answers to a particular question. 5
7 ********** The Eurobarometer website can be consulted at the following address: We wish to thank the people interviewed throughout the European Union who gave their time to take part in this survey. Without their active participation, this survey would not have been possible Note In this report, countries are referred to by their official abbreviation. The abbreviations used in this report correspond to: ABBREVIATIONS EU27 European Union 27 Member States Don t know BE BG CZ DE EE EL ES FR IE IT CY LT LV LU HU MT NL AT PL PT RO SI SK FI SE UK Belgium Bulgaria Czech Republic Denmark Germany Estonia Greece Spain France Ireland Italy Republic of Cyprus Lithuania Latvia Luxembourg Hungary Malta The Netherlands Austria Poland Portugal Romania Slovenia Slovakia Finland Sweden The United Kingdom 6
8 EXECUTIVE SUMMARY The most important findings of this survey include: Nearly half (47%) of all European respondents are concerned that their children might lose their jobs, though concern about their own jobs or their partners jobs is lower. The average time spent working for an employer has risen from 11.6 years in 2009 to 12.3 years in On average, Europeans have changed jobs 3.2 times, marking no change from the 2009 survey. Most respondents are pessimistic about the chances of the economic crisis ending soon: 71% think it will not be over in two years time. 82% of respondents currently working are confident that they will keep their job, more than in May-June % are confident that they will have a job in two years time. However, a third of Europeans currently working (32%) think they would be unlikely to find another job within six months of being made redundant. Around a third (30%) of Europeans who are currently working think that their country s unemployment and insurance system would compensate them to the tune of 51 to 70% of their income if they were to be laid off. More than a fifth think that they would receive more than 70% (22%); 28% of Europeans are more pessimistic, and think they would receive 50% or less of their current income. Fairness and social justice in the EU have suffered as a consequence of the economic crisis, according to 79% of respondents. In line with this, 83% of the respondents think that the burden of public spending cuts and other austerity measures has affected some people more than others in their country. 87% of people think that poverty has increased over the last three years (+3 points since September 2010), and only 22% think that enough is being done to address this. If they were made redundant, close to half of respondents currently working would look for work by applying for the same kind of job in the same location but for another employer. More than a third would apply for the same kind of job but in a different location. Overall, 35% of respondents currently working would consider starting their own business in response to redundancy. A majority of Europeans agree that starting your own business is more difficult for some categories of the population (e.g. a person with a disability, a young person leaving full-time education, a person over 50 years old, etc.). Europeans broadly agree with the principles of flexicurity, but 51% disagree that many people retire too early. The EU s measures for getting more people into work, such as supporting people who want to start a business, are broadly seen as being effective. 7
9 Professional experience and the level of one s qualifications remain the two assets that should be emphasised in order to find a job, according to European public opinion. Over the past 12 months, 23% of Europeans have participated in training courses; over half (55%) of them were funded by their employer. A third of respondents (34%) have completed a traineeship; 44% of them think it helped them to get a permanent job. However, more than a quarter consider that it did not help them to find a job (26%). Over a third of the respondents (36%) say spontaneously that they did not receive any careers guidance at school; a third (33%) say that careers guidance helped them to acquire the skills they needed for the type of job they wanted. A quarter says that it did not help them acquire these skills. It is therefore unsurprising to find that there is a general appetite for better information about the future job market: 57-58% would like to receive information that would help them decide what training courses to take, and what jobs to apply for in the future. There is growing awareness of the European Social Fund, which 45% of respondents have now heard of (compared with 40% in 2009). Recognition of the European Globalisation Adjustment Fund remains somewhat lower. In both cases, awareness is substantially higher inside the euro-zone than outside it. More than half of Europeans think the EU has a beneficial impact on general employment and social policies. However, when interviewed more precisely on the different measures, the number of people who think the EU is having a positive impact has fallen in most countries since 2009, very substantially in some. 8

10 1. PERCEIVED IMPACT OF THE ECONOMIC CRISIS ON THE JOB MARKET 1.1 Concern about impact of the crisis on jobs - While the level of concern has stayed stable across the EU, there have been notable evolutions in some countries since European respondents were asked to quantify the level of concern they feel about the current economic crisis and its potential impact on their own jobs, as well as on those of their partners and children 10. For each of the statements analysed in the survey, there was a high rate of spontaneous mentions of not applicable, largely from those not working, not living with a partner, or with no children. It would therefore be prudent to exclude these respondents from the analysis. By a significant margin, respondents are most concerned that their children might lose their jobs: 47% say they are concerned about this (answers 4 and 5 on the scale), while 19% are neither concerned nor not concerned, and 31% are not concerned (answers 1 and 2). By comparison, 38% of respondents say they are concerned that their partners could lose their jobs, with 18% neither concerned nor not concerned, and 43% not concerned. Base: those who did not spontaneously answer not applicable nqa1.2 (Your partner) =57% of the total sample / nqa1.3 (Your children) =48% of the total sample 10 QA1: And thinking about the current economic crisis and its potential impact on the job-market, how would you rate your concern, if at all, about each of the following? Please use a scale from 1 to 5 where '1' means that you are "not at all concerned", and '5' that you are "very concerned". You losing your job; your partner (spouse, etc.) losing their job; your children losing their job. 9

, 38% worried that their partners might lose their jobs (no change), and 33% said they were concerned")
11 Almost one in three respondents (31%) say that they are very concerned that their children could lose their jobs, whereas 24% are very concerned about their partner s job security, and 21% are very concerned about the possibility of losing their own job. Comparing these results with those of the previous survey, it is clear that the public s level of concern about the potential impact of the economic crisis on employment has remained stable since 2009, when 47% were concerned about the potential impact on their children s jobs (no change), 38% worried that their partners might lose their jobs (no change), and 33% said they were concerned about their own job security (now 35%). When asked about themselves, 35% of people say they are concerned for their own jobs, whereas 20% are neither concerned nor not concerned, and 45% are not concerned. Base: those who are currently working, and who did not spontaneously answer not applicable =48% of the total sample A comparison of the data from the EU15 11 and NMS12 12 countries suggests that respondents in the NMS12 countries are somewhat more likely to feel concern about their own jobs and those of their partners. Though similar numbers of respondents say they are concerned that their children might lose their jobs (47% in the NMS12 and 48% in the EU15), 42% of NMS12 respondents worry about their partners job security as opposed to just 37% in the EU15, while 41% are concerned that they could lose their own jobs, compared to 34% in the EU EU15 refers to the 15 countries forming the European Union before the enlargements of 2004 and 2007: Belgium, Denmark, Germany, Greece, Spain, France, Ireland, Italy, Luxembourg, The Netherlands, Austria, Portugal, Finland, Sweden and the United Kingdom. 12 The NMS12 are the 12 new Member States which joined the European Union during the 2004 and 2007 enlargements. These are Bulgaria, the Czech Republic, Estonia, the Republic of Cyprus, Lithuania, Latvia, Hungary, Malta, Poland, Romania, Slovenia and Slovakia. 10
, while 72% are concerned for their")
, while 60% are concerned for their partners (43% very concerned ) and 78%")
, 65% worry about their partners (55% very concerned ) and")
12 - Greater concern in Greece, Spain, and Lithuania - The highest levels of concern about potential job losses were recorded in Greece, Lithuania and Spain. In Spain, 72% of respondents are concerned about the possible loss of their own jobs (of whom 56% are very concerned ), while 72% are concerned for their partners (57% very concerned ) and 73% for their children (61% very concerned ). In Greece, 63% worry about losing their own jobs (of whom 40% are very concerned ), while 60% are concerned for their partners (43% very concerned ) and 78% for their children (57% very concerned ). And in Lithuania, 61% are concerned about losing their own jobs (of whom 52% are very concerned ), 65% worry about their partners (55% very concerned ) and 69% are concerned that their children might lose their jobs (60% very concerned ). Base: those who are currently working, and who did not spontaneously answer not applicable =48% of the total sample 11
 worry that their partners")
 are concerned about the potential impact on their children s jobs.")

; Denmark (14%, 14%, 25%); and the Netherlands (16%, 17%, 28%).")
13 Overall, a majority of respondents in four countries (Spain, Greece, Lithuania and Slovakia) are concerned about their own job security, whereas a majority in five Member States (Spain, Greece, Lithuania, Bulgaria and Cyprus) worry that their partners could lose their jobs, and a majority in 12 countries (Belgium, Bulgaria, Ireland, Greece, Spain, France, Italy, Cyprus, Latvia, Lithuania, Portugal and Slovenia) are concerned about the potential impact on their children s jobs. At the other end of the scale, concern about the impact of the economic crisis is relatively low in northern European countries, most particularly in Sweden, where just 4% of respondents are concerned about their own jobs, 6% worry about their partner, and 17% are concerned about their children; Finland (8% concerned about themselves, 13% about their partners, and 21% about their children); Denmark (14%, 14%, 25%); and the Netherlands (16%, 17%, 28%). Base: those who did not spontaneously answer not applicable =57%of the total sample 12


, and 54% were concerned about their children (now 78%, +24).")
; 67% concerned about their children")
14 Base: those who did not spontaneously answer not applicable =48% of the total sample In comparison with the national results from the 2009 survey, concern has risen significantly in some countries. This particularly applies to Greece, reflecting the severity of the economic problems in that Member State. In 2009, 40% of respondents in Greece were concerned about the possible loss of their own jobs (compared with 63% now, +23), 43% worried about their partners (now 60%, +17), and 54% were concerned about their children (now 78%, +24). Levels of concern have also risen noticeably since 2009 in: Cyprus: 43% are concerned that they could lose their own jobs (+11 points); 67% concerned about their children (+16) Bulgaria: 42% are concerned that they could lose their own jobs (+4); 53% worry about their partner (+13); 57% concerned about their children (+7) 13
15 Luxembourg: 36% are concerned that their children could lose their jobs (+14) Portugal: 48% are concerned about their own jobs (+14); 46% concerned about their partners (+6) Romania: 47% are concerned about their own jobs (+6); 49% concerned about their partners (+8) Slovakia: 56% are concerned about their own jobs (+7) The Netherlands: 16% are concerned about losing their own jobs (+7); 28% concerned about their children losing their jobs (+7) The UK: 31% are concerned about their own jobs (+5) Denmark: 14% are concerned that they could lose their own jobs (+7); 14% worry about their partner (+4); 25% concerned about their children (+5) Spain: 72% are concerned that they could lose their own jobs (+6) However, in several Member States concern about the potential impact of the economic crisis on jobs has declined, probably reflecting the unusual severity of the crisis in those Member States. In Estonia, this trend is particularly noticeable. In 2011, only 20% of respondents in Estonia say they are concerned that they might lose their own jobs, down from 37% in 2009 (-17 points); 27% are concerned about their partners, compared with 40% previously (-13); and 34% are concerned about their children, compared with 46% in 2009 (-12). There is a similar trend in Latvia, where 34% are concerned about the possible loss their own jobs (-13); 46% are concerned about their partners (-14); and 56% are concerned about their children (-16). 14
16 QA1 And thinking about the current economic crisis and its potential impact on the job-market, how would you rate your concern, if at all, about each of the following? Please use a scale from 1 to 5 where '1' means that you are "not at all concerned", and '5' that you are "very concerned". Total 'concerned' You losing your job - (Sept-Oct May-June 2009) Your partner (spouse, etc.) losing their job - (Sept-Oct May-June 2009) Your children losing their job - (Sept-Oct May-June 2009) EU27 35% +2 38% = 47% = BE 31% -1 37% = 51% = BG 42% +4 53% % +7 CZ 40% +5 34% -2 38% -2 14% +7 14% +4 25% +5 DE 23% +2 25% -2 32% -4 EE 20% % % -12 IE 36% = 42% +1 53% +1 EL 63% % % +24 ES 72% +6 72% = 73% -4 FR 29% -2 30% % -2 IT 41% +1 43% +5 54% +3 CY 43% % +4 67% +16 LV 34% % % -16 LT 61% % -7 69% = LU 24% +2 26% +4 36% +14 HU 46% +3 40% -1 49% +2 MT 27% -3 30% % -5 NL 16% +7 17% +5 28% +7 AT 35% -5 36% -4 40% -4 PL 32% = 37% +3 44% +3 PT 48% % +6 56% +4 RO 47% +6 49% +8 48% +4 SI 31% -8 35% -5 52% -6 SK 56% +7 49% -2 41% -4 FI 8% -5 13% -1 21% -7 SE 4% -4 6% -5 17% -6 UK 31% +5 33% -1 45% +2 Base: those who did not spontaneously answer not applicable. nqa1.2 (Your partner) =57% of the total sample / nqa1.3 (Your children) =48% of the total sample The item you losing your job was asked only to those who are currently working =48%of the total sample 15
17 The socio-demographic data show that: Women are more likely to be concerned about the potential impact of the economic crisis on employment than men. 38% of women are concerned that they could lose their own jobs, compared with 34% of men; 42% are concerned about their partner (33% for men); and 50% are concerned that their children might lose their jobs (42% for men). People aged are the most likely to be concerned that they could lose their own jobs, with 39% saying this as opposed to 32% of those in the 55+ group (this question was only put to those respondents who currently work). By contrast, respondents aged 40 years and over are far more concerned about their children s job security (46% of the age group; 52% of respondents aged 55+), compared with around a third of those aged below 40. Respondents whose education ended earlier are the most likely to be concerned on all three measures, and this variable highlights substantial variations between categories. 48% of people who left school aged 15 or before are concerned that they could lose their own jobs (39% for the group, and 28% for the 20+ group), while 46% of respondents in this category are concerned about their partners jobs (40% for the group, and 31% for the 20+ group), and 58% are concerned about their children s jobs (46% for the group, and 36% for the 20+ group). Respondents who tend to have difficulty paying their bills are much more likely to express concern about the impact of the economic crisis on employment. 61% of people who have difficulty paying their bills most of the time say they are concerned that they might lose their own jobs, as opposed to 45% who have difficulty from time to time and 28% who almost never have trouble; 61% of this category say they are concerned about their partners jobs, compared with 50% who have difficulty from time to time and 29% who almost never have trouble; and 67% say they worry that their children might lose their jobs, compared with 56% who have difficulty from time to time and 42% who almost never have trouble. Overall, this analysis points to the logical conclusion that the most precarious categories of respondents are the most concerned about potential job losses, both personally and in their family circle 16
18 QA1R.1 And thinking about the current economic crisis and its potential impact on the job-market, how would you rate your concern, if at all, about each of the following? Please use a scale from 1 to 5 where '1' means that you are "not at all concerned", and '5' that you are "very concerned". Your partner (spouse, etc.) losing their You losing your job Your children losing their job job Concerned (4+5) Neither concerned nor not concerned (3) Not concerned (1+2) Concerned (4+5) Neither concerned nor not concerned Not concerned (1+2) Concerned (4+5) Neither concerned nor not concerned Not concerned (1+2) EU27 35% 20% 45% 38% 18% 43% 47% 19% 31% Sex Male 34% 20% 46% 33% 18% 47% 42% 20% 35% Female 38% 20% 42% 42% 17% 39% 50% 18% 29% Age % 17% 43% 39% 18% 38% 33% 13% 39% % 21% 44% 40% 20% 39% 32% 15% 47% % 21% 42% 41% 20% 38% 46% 18% 33% % 15% 52% 31% 12% 55% 52% 20% 27% Education (End of) 15-48% 19% 33% 46% 13% 40% 58% 17% 23% % 20% 40% 40% 19% 40% 46% 20% 31% % 20% 52% 31% 19% 49% 36% 19% 42% Still studying 35% 19% 38% 30% 15% 39% Difficulties paying bills Most of the time 61% 17% 22% 61% 14% 23% 67% 12% 17% From time to time 45% 24% 31% 50% 20% 29% 56% 19% 22% Almost never 28% 18% 54% 29% 17% 53% 42% 19% 37% Base: those who did not spontaneously answer not applicable. nqa1.2 (Your partner) =57% of the total sample / nqa1.3 (Your children) =48% of the total sample The item you losing your job was asked only to those who are currently working =48% of the total sample 1.2 Perceived economic crisis cycle - 71% of Europeans do not believe that the economic crisis will be over, and that the employment situation in their country will be better in two years time - Rising concern about the potential impact of the economic crisis on jobs in a number of Member States is reflected in a generally downbeat assessment of how the crisis will unfold over the next two years 13. Less than a quarter (23%) of respondents agree that in two years time the crisis will be over and the employment situation in their country will be better than today, while just 3% totally agree and 20% tend to agree. By contrast, 71% of European respondents do not believe that the crisis will be over in two years 36% tending to disagree and 35% totally disagreeing demonstrating that most Europeans share a pessimistic assessment of their country s short-term economic prospects. 13 QA2 Please tell me to what extent you agree or disagree with the following statement: In two years, the crisis will be over and the employment situation in (OUR COUNTRY) will be better than today. Totally agree; tend to agree; tend to disagree; totally disagree; don t know. 17

19 While the economic outlook is generally seen as gloomy in both the euro and non-euro zones, respondents in non-euro countries are slightly more optimistic overall: 27% of people outside the euro-zone think the crisis will be over in two years, whereas only 22% of respondents in the euro-zone agree. In five Member States, at least a third of respondents agree that the economic crisis will be over in two years: Sweden, where 52% of people believe this (combining totally agree and tend to agree ), Denmark (40%), Estonia (40%), Finland (38%) and Austria (34%). Sweden is the only country in which a majority of respondents agree. However, in many other countries the level of pessimism is very high, and more than two-thirds of respondents do not think the crisis will be over in two years in 17 countries. The level of disagreement is highest in France (85%), Greece (85%) - where an exceptionally high 61% of respondents totally disagree that the crisis will be over soon - and Slovenia (80%). 18


20 Analysis of the socio-demographic data reveals as follows: Young respondents are most optimistic that the crisis will end soon. Just over six in ten respondents aged disagree that it will be over in two years, compared with 72-74% of people in the three older age groups. Respondents whose education ended earlier are more likely to be pessimistic. 75% of those who left school at 15 or under disagree that the crisis will be over in two years, compared with 73% of those who left aged and 69% of those who left at 20 or over. Unemployed respondents are more pessimistic about the economic crisis than employed people or students. While 34% of students, 27% of self-employed people and 27% of managers believe that the crisis will be over in two years time, only 18% of unemployed people say the same. 19
21 People who tend to have trouble paying their bills are the most pessimistic. While 79% of those who have difficulty paying their bills most of the time disagree that the crisis will be over in two years, this falls to 74% among respondents who have trouble sometimes and to 68% among those who almost never have trouble disagree. Though some variations can be seen, pessimism about the short-term future is preponderant in all categories. QA2 Please tell me to what extent you agree or disagree with the following statement: In two years, the crisis will be over and the employment situation in(our COUNTRY) will be better than today. Totally agree Tend to agree Tend to disagree Totally disagree Total 'Agree' Total 'Disagree' EU27 3% 20% 36% 35% 6% 23% 71% Sex Male 4% 20% 36% 35% 5% 24% 71% Female 3% 20% 37% 34% 6% 23% 71% Age % 27% 33% 28% 8% 31% 61% % 21% 38% 34% 4% 24% 72% % 18% 37% 37% 5% 21% 74% % 18% 35% 37% 7% 21% 72% Education (End of) 15-3% 15% 35% 40% 7% 18% 75% % 18% 36% 37% 5% 22% 73% 20+ 4% 23% 39% 30% 4% 27% 69% Still studying 4% 30% 33% 23% 10% 34% 56% Respondent occupation scale Self-employed 4% 23% 36% 32% 5% 27% 68% Managers 5% 22% 39% 31% 3% 27% 70% Other white collars 3% 23% 38% 32% 4% 26% 70% Manual workers 4% 17% 39% 36% 4% 21% 75% House persons 2% 18% 36% 38% 6% 20% 74% Unemployed 3% 15% 31% 46% 5% 18% 77% Retired 3% 18% 35% 37% 7% 21% 72% Students 4% 30% 33% 23% 10% 34% 56% Difficulties paying bills Most of the time 4% 12% 30% 49% 5% 16% 79% From time to time 3% 17% 36% 38% 6% 20% 74% Almost never 4% 23% 37% 31% 5% 27% 68% 20
22 2. EUROPEANS CURRENT EMPLOYMENT SITUATION 2.1 Sample structure - Just over half of the European population (51%) aged 15 and above are not currently in work - It is important to place the findings of this report into context by establishing the proportion of Europeans currently in work, as well as the evolutions in employment levels since May-June This will also enable a comparison of the level of employment in different Member States. Across the whole EU, we find that half of all respondents (51%) are not currently working, with 42% of people saying they are currently employed and 7% selfemployed 14. These statistics are very much in line with the results gathered in 2009, when 50% of respondents said they were not working, 42% said they were employed, and 8% said they were self-employed. As well as showing a breakdown of respondents occupations, the following graphic demonstrates that these occupations have generally remained very stable over the last two years. A tiny rise in the number of people saying they are retired or unable to work through illness, from 25% in 2009 to 26% today, is matched by a corresponding drop in the number of skilled manual workers, from 10% to 9%. All other occupational groups have remained static. 14 D15a: What is your current occupation? 21


.")
 and Slovakia (50%).")
23 Among those people who are not currently working, 70% say they were previously employed, 7% say they were self-employed, and 23% say they have not worked before 15. These results are very much in line with those of the 2009 survey. At individual country level, in 16 Member States at least 50% of respondents say they are not currently working, led by Portugal, where 60% of respondents are not currently working, Lithuania (59%) and Spain (58%). In three Member States a majority of respondents describe themselves as employed: Austria (52%), Sweden (52%) and Slovakia (50%). However, relatively few say they are currently employed in Greece (26%), Poland (34%), Spain (34%) and Portugal (35%). Self-employment is highest in Greece (18%), Italy (14%) and Poland (10%). 15 D15b: Did you do any paid work in the past? What was your last occupation? 22
 and Greece (48%).")


24 At least 80% of respondents who are not currently working say that they were previously in work in the UK (85%), Denmark (82%), Austria (80%), Estonia (80%) and Lithuania (80%). Relatively few people give this answer in Italy (41%) and Greece (48%). In five EU countries, at least 30% of respondents who are not working say they have not worked previously: Cyprus (35%), Greece (35%), Belgium (31%), Romania (31%) and Malta (30%). Only 11% of people in Denmark and the UK who are not currently working say they have not worked before. In Greece, 17% of people not working currently say that they were formerly self-employed, as do 13% of those in Italy and 11% of those in Finland. Most countries register only small changes in employment levels compared with However, two countries have experienced significant rises in the numbers of people saying that they are not currently working: Portugal (60%, up from 50%, +10 points), and Ireland (55%, up from 48%, +7 points). In Italy, however, fewer people say they are not working than did so in 2009 (44%, down from 50%, -6 points). 23
25 According to the socio-demographic data: Women are more likely than men to say they are not working, by a margin of 57% to 45%. Among respondents who are not currently working, women (25%) are less likely to have worked previously than men (20%). 70% of people aged and 80% of those aged 55 and over are not working, compared with just 25% of those aged and Among respondents who are not working, year-olds are by far the least likely to have worked previously: 72% have not done so. Respondents who finished their education early are much more likely not to be working. 76% of those who left school at 15 or under are not working, compared with 41% of those who left aged and 29% of those who completed their education at 20 or over. Individuals who live alone are the most likely not to be working. 65% of people in this group are not working, compared with 58% of those in two-person households and 40-42% of people in households of three or more. D15a.2 What is your current occupation? Self-employed Employed Not working EU27 7% 42% 51% Sex Male 9% 46% 45% Female 5% 38% 57% Age % 29% 70% % 65% 25% % 62% 25% % 15% 80% Education (End of) 15-4% 20% 76% % 51% 41% % 59% 29% Still studying % Household composition 1 6% 29% 65% 2 6% 36% 58% 3 8% 52% 40% 4+ 9% 49% 42% 24
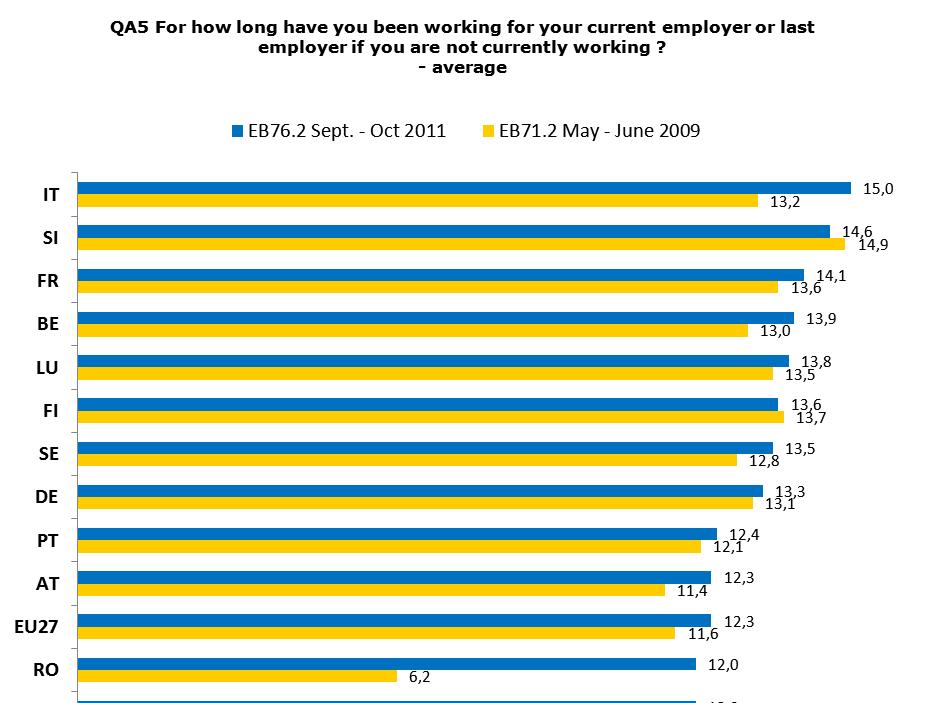
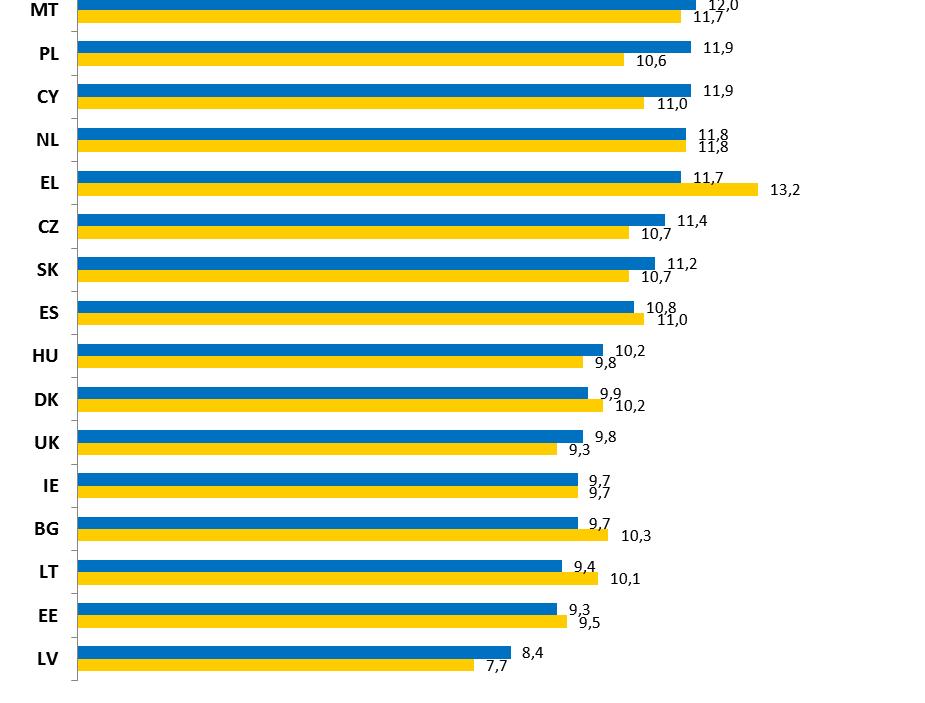
26 2.2 Length of current/last job - The average time spent working for the current employer is 12.3 years, marginally higher than in Europeans were then asked how long they have been working for their current employer (or last employer for those who are not currently working): the largest group say they have been with their current employer for one to five years (29%, compared with 31% in 2009) % have been with their employer for more than 20 years (compared with 16% in 2009), while 16% have worked for the same employer for 11 to 20 years (15% in 2009), and 15% have done so for 6 to 10 years (the same as in 2009). Just 5% have been with their current employer for less than a year (4% in 2009). Slightly less than one respondent in eight (12%) have never had any paid work, the same as in the 2009 survey. The average length of service with an employer is now 12.3 years, higher than the 11.6 recorded two years earlier (the average figures exclude mentions of don t know and never had any paid work ). In the case of respondents who are currently working (excluding those who answered never had any paid work ), 1 to 5 years is the most common response (32%), and more than 20 years the next most common (21%). While 18% of respondents say they have been with their employer for 11 to 20 years and 17% have been with the same employer for 6 to 10 years, just 6% say they have been with their current employer for less than one year. To compare national results, the analysis first focuses on the average time that respondents from each Member State have been with their current employer. On average, respondents in the EU15 17 countries stay with their employer for longer 12.5 years compared with 11.3 years in the NMS The average for both groups has increased since 2009, when the EU15 average was 12.1, while the NMS12 average was 9.9. The average length of service with an employer is higher in the euro-zone than outside it, by a margin of 13.1 years to Turning to the individual Member States, Italy (15.0 years, compared with 12.3 at EU level), Slovenia (14.6 years) and France (14.1 years) have the highest averages. By contrast, the lowest averages are seen in Latvia (8.4 years), Estonia (9.3 years), and Lithuania (9.4 years). 16 QA5: For how long have you been working for your current employer or last employer if you are not currently working? Never had any paid work; less than one year; 1 to 5 years; 6 to 10 years; 11 to 20 years; more than 20 years; don t know. 17 EU15 refers to the 15 countries forming the European Union before the enlargements of 2004 and 2007: Belgium, Denmark, Germany, Greece, Spain, France, Ireland, Italy, Luxembourg, The Netherlands, Austria, Portugal, Finland, Sweden and the United Kingdom. 18 The NMS12 are the 12 new Member States which joined the European Union during the 2004 and 2007 enlargements. These are Bulgaria, the Czech Republic, Estonia, the Republic of Cyprus, Lithuania, Latvia, Hungary, Malta, Poland, Romania, Slovenia and Slovakia. 25
27 The average length of service with an employer has increased in 17 Member States. Among the countries with the highest average length, the average in Italy has risen from 13.2 in the 2009 survey, while in France it has risen from 13.6; but in Slovenia, which had the highest average in 2009, it has slipped from 14.9 to In Romania, which averaged just 6.2 years of service in 2009, it has risen sharply to In eight Member States, the average service length has decreased since 2009, most strikingly in Greece (11.7, -1.5 points), and Lithuania (9.4, -0.7). 19 In 2009, an unusually high number of respondents in Romania (33%) said they did not know how long they had been working for their current employer. But only 13% give this answer now, and this accounts for the large increase in this country s average. 26
28 27
29 A more detailed analysis of the results reveals that Italy, which has the highest average length of service, also has the highest proportion of people saying they have never had paid work: 20% of respondents in Italy say this, as do 20% of people in Greece, 18% in Cyprus and 18% in Romania. At least 10% of respondents say they have never had paid work in 16 Member States. The lowest proportions of people who say that they have never had a paid job are in Austria (5%), Denmark (5%), Finland (6%) and the UK (6%). The highest proportions of respondents who have been with their employer for less than one year are found in Lithuania (12%), Spain (11%), Estonia (10%), Greece (8%), and Luxembourg (8%), compared with an EU average of 5%. Important increases on this measure can be seen in Lithuania (12%, +11 points), Spain (11%, +9 points), Greece (8%, +8), Estonia (10%, +7) and Luxembourg (8%, +7). In some of these cases, the data may point to an increase in the number of people undertaking precarious work in countries that have been hit hardest by the economic crisis. However, we can see the opposite effect in some other Member States, with substantial falls in Latvia (2%, -11 points), Poland (6%, -5) and the UK (5%, -5). The socio-demographic data show that: Women are more likely than men never to have had any paid work: 14% of women say this, compared with 9% of men. Men, on the other hand, are somewhat more likely to have worked for their current employer for more than 20 years, by a margin of 22% to 15%. Generally, average length of service was longer for men (13.3, for 11.2 of women). Young respondents are by far the most likely never to have had any paid work: 51% of year-olds are in this category, compared with just 3-7% of people in the three older age groups. Very logically, the average length increases with the age of the interviewees: 2.3 for the age group, 5.3 for respondents aged 25-39, 11.4 for those aged 40-54, and 20.5 for the 55+ group. Respondents who left education earlier are the most likely both never to have had paid employment and also to have worked for their current employer for over 20 years. 10% of those who left school at 15 or under have never had paid employment (compared with 2-4% of those who spent longer in education), while 27% have worked for their current employer for over 20 years (compared with 17-19% of those in the other groups). In terms of averages, respondents who left school at 15 or under tend to spend much longer with an employer: 16.6 years, compared with years for the other two groups. The average length of service with a current or last employer varies greatly with the respondent s occupation. Retired people on average worked for their last employer for 21.6 years, while managers did so for 11.7 years. However, unemployed people average just 5.0 years with their most recent employer, while house persons average 6.6 years. 28
30 Individuals who almost never have trouble paying their bills are the most likely to have worked for their current employer for over 20 years: 22% give this response, compared with 11-12% of people who regularly or sometimes have trouble paying their bills. The averages bear this out: 14.0 years with the current employer for people who almost never have trouble paying their bills, compared with 9.8 for those who sometimes have trouble and 8.2 for those who have difficulty most of the time. QA5 For how long have you been working for your current employer or last employer if you are not currently working? Never had any paid work Less than one year 1 to 5 years 6 to 10 years 11 to 20 years More than 20 years Average EU27 12% 5% 29% 15% 16% 18% 5% 12,3 Sex Male 9% 5% 28% 14% 17% 22% 5% 13,3 Female 14% 5% 29% 16% 15% 15% 6% 11,2 Age % 11% 32% 2% 1% - 3% 2, % 7% 49% 22% 12% 1% 4% 5, % 4% 30% 19% 24% 16% 4% 11, % 2% 12% 12% 19% 39% 9% 20,5 Education (End of) 15-10% 4% 19% 13% 18% 27% 9% 16, % 6% 33% 17% 18% 17% 5% 11, % 5% 35% 18% 17% 19% 4% 11,6 Still studying 78% 8% 11% % 1,5 Respondent occupation scale Self-employed - 4% 28% 19% 23% 17% 9% 12,3 Managers - 4% 33% 20% 22% 20% 1% 11,7 Other white collars - 5% 40% 22% 20% 11% 2% 9,3 Manual workers - 6% 43% 20% 18% 11% 2% 8,7 House persons 35% 5% 28% 13% 8% 3% 8% 6,6 Unemployed 10% 14% 49% 11% 6% 4% 6% 5 Retired 4% 2% 11% 11% 20% 42% 10% 21,6 Students 78% 8% 11% % 1,5 Difficulties paying bills Most of the time 12% 11% 39% 12% 10% 11% 5% 8,2 From time to time 12% 5% 34% 16% 14% 12% 7% 9,8 Almost never 11% 4% 25% 15% 18% 22% 5% 14 29
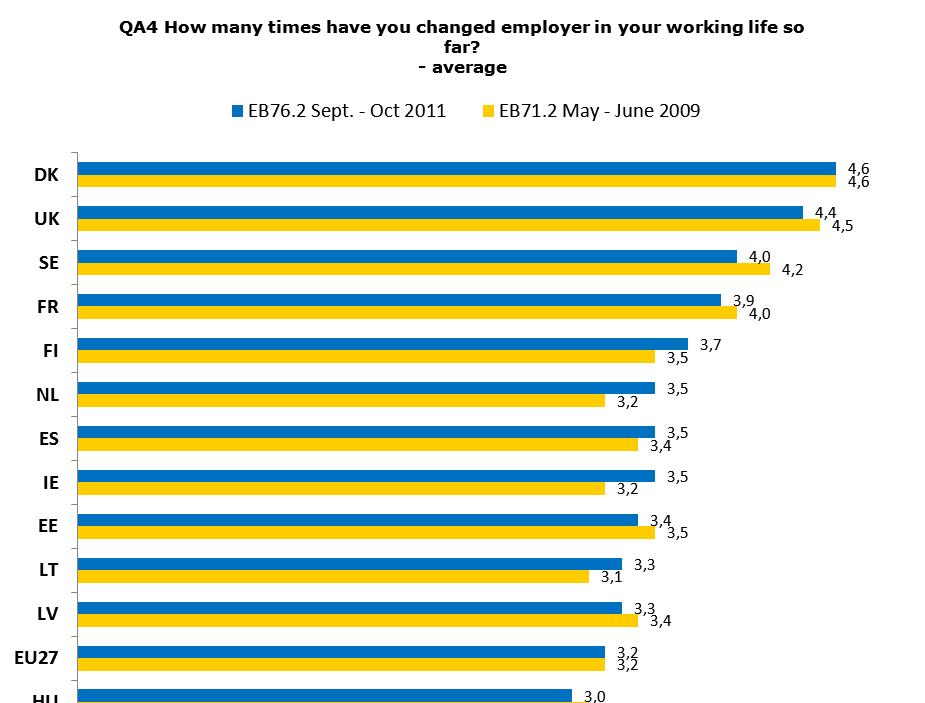
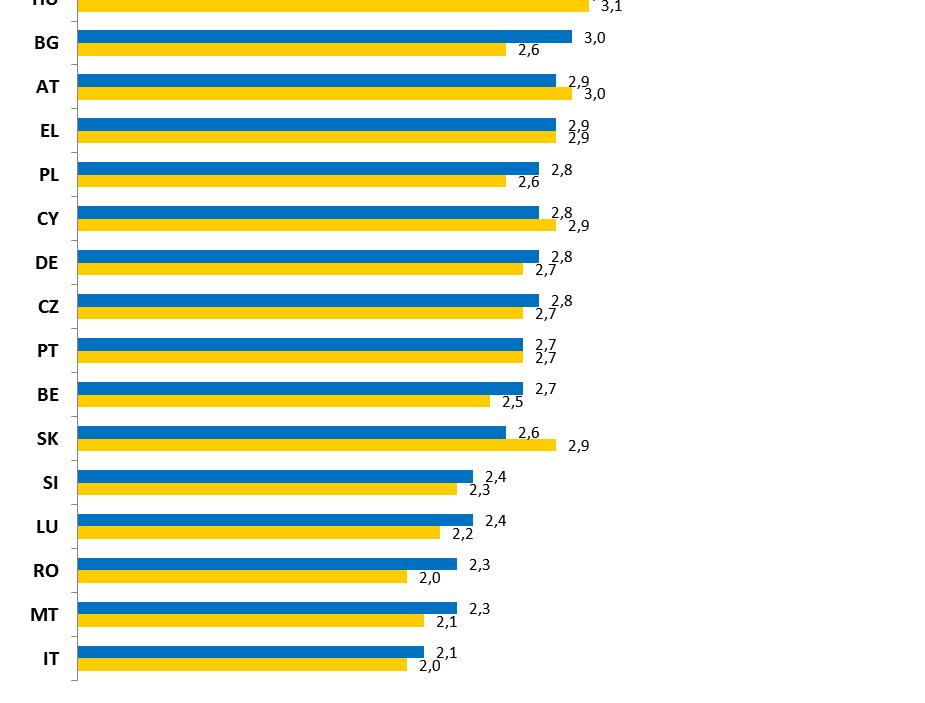
31 2.3 Frequency of changing employers - Most Europeans have changed their employer between one and five times in their working lives - A clear majority of respondents (62%, compared with 60% in 2009) say that they have changed employer between one and five times during their career % (compared with 13% in 2009) have never changed their employer, while 9% have changed 6 to 10 times (the same as in 2009), and 2% have changed more than 10 times (no change). 12% of respondents have never had any paid work (no change). On average, European respondents have changed jobs 3.2 times, marking no change from the 2009 survey (the average figures exclude mentions of don t know and never had any paid work ). Taking as a base the respondents who have had at least one job, 70% say that they have changed employer between one and five times, while 13% have never changed their employer. 11% have changed 6 to 10 times, and just 2% have changed more than 10 times. On average, respondents in EU15 countries tend to have changed employer more than their counterparts in the NMS12, by a margin of 3.3 times to 2.8. A similar distinction applies in and outside the euro-zone, in that respondents in non-euro countries tend to have changed employer more often: the average number of changes of employer outside the euro-zone is 3.5, as opposed to 3.0 within the euro-zone. At individual country level, the Member States with the highest average number of changes of employer are Denmark (4.6), the UK (4.4) and Sweden (4.0) the same countries that had the highest averages in the 2009 survey. The countries with the lowest averages are Italy (2.1), Malta (2.3) and Romania (2.3). 20 QA4 How many times have you changed employer in your working life so far? Never had any paid work; never changed employer; 1 to 5 times; 6 to 10 times; more than 10 times; don t know. 30
32 31
33 A more detailed look at the changes that individual countries have experienced since 2009 reveals that the largest rises in the average number of changes of employer were recorded in Bulgaria (3.0, +0.4), Romania (2.3, +0.3), Ireland (3.5, +0.3) and the Netherlands (3.5, +0.3). In Romania this result is partly explained by a sharp drop in the number of people who say that they have never changed employer, from 18% to 8%, with a corresponding rise in the number of people saying they have changed jobs between 1 and 5 times (58%, up from 49%). The most important fall in the average number of changes occurred in Slovakia (2.6, -0.3). Here, a rise of 12% in the number of people saying they have never changed employer (up from 0% in 2009) accounts for the change. Overall, these data have remained quite stable since May-June
34 The socio-demographic data show that: Men are marginally more likely to have changed employer than women, by a margin of 3.4 to 3.0. On average respondents in the age group have changed employer most often: 3.7 times, compared with 3.2 for year-olds, 3.1 for over-55s, and 2.2 for year-olds. Individuals who spent longer in education are somewhat more likely never to change their employer. While respondents who completed their education aged 20 or over have changed employer an average of 3.0 times, those in the other two education groups have averaged changes. While unemployed respondents have changed employer an average of 4.6 times, managers, self-employed respondents and retired people have an average of just 3.0 changes. QA4 How many times have you changed employer in your working life so far? Never had any paid work Never changed of employer 1 to 5 times 6 to 10 times More than 10 times Average EU27 12% 11% 62% 9% 2% 4% 3,2 Sex Male 9% 11% 63% 10% 3% 4% 3,4 Female 14% 12% 61% 8% 1% 4% 3 Age % 10% 33% 3% - 3% 2, % 12% 67% 11% 2% 3% 3, % 10% 68% 12% 4% 3% 3, % 13% 65% 9% 2% 4% 3,1 Education (End of) 15-10% 10% 63% 10% 3% 4% 3, % 11% 69% 11% 2% 3% 3, % 16% 67% 10% 2% 3% 3 Still studying 78% 5% 14% 1% - 2% 2,2 Respondent occupation scale Self-employed - 16% 65% 10% 2% 7% 3 Managers - 18% 69% 9% 2% 2% 3 Other white collars - 12% 73% 10% 2% 3% 3,1 Manual workers - 12% 71% 11% 3% 3% 3,4 House persons 36% 7% 50% 4% 1% 2% 2,7 Unemployed 10% 4% 59% 19% 5% 3% 4,6 Retired 4% 13% 67% 9% 2% 5% 3 Students 78% 5% 14% 1% - 2% 2,2 Difficulties paying bills Most of the time 12% 7% 59% 14% 4% 4% 4,1 From time to time 12% 9% 62% 11% 2% 4% 3,4 Almost never 11% 13% 63% 8% 2% 3% 3 33


35 3. EUROPEANS ATTITUDES TOWARDS EMPLOYMENT 3.1 Europeans support for flexicurity - Europeans tend to agree with the concepts that underpin flexicurity, although many reject the idea that people generally retire too early - The concept of flexicurity is one that links the flexibility of the labour market with job security and social rights. Respondents were asked whether they agreed with five statements directly or indirectly related to flexicurity 21. A clear majority of respondents agree with four of these five propositions. 87% agree (i.e. either totally agree or tend to agree ) that regular training improves job opportunities (compared with 88% in 2009). 78% agree that being able to change easily from one job to another is a useful asset which helps people find a job nowadays (compared with 76% in 2009), while 77% think that life-time jobs with the same employer are a thing of the past (up from 73% in 2009). 72% of respondents agree that work contracts should become more flexible to encourage job creation (as did 71% in 2009), but only 44% think that many people retire too early in their country (43% agreed in 2009). A majority (51%) disagree that many people retire too early, up slightly from the 49% who disagreed previously. 21 QA15.1 Please tell me, for each of the following statements, to what extent you agree or disagree with it. Life-time jobs with the same employer are a thing of the past; work contracts should become more flexible to encourage job creation; in (OUR COUNTRY) many people retire too early; regular training improves one s job opportunities; being able to change easily from one job to another is a useful asset to help people find a job nowadays. Totally agree; tend to agree; tend to disagree; totally disagree; don t know. 34
36 A significant majority of people in all Member States believe that regular training improves job opportunities. In several countries, respondents are almost unanimous, including Malta, where 97% agree, and Denmark and Sweden (both 95%). In six Member States under 80% of people agree that regular training improves job opportunities, with the lowest level of agreement in Slovakia (72%) and Hungary (74%). In all Member States, more than seven in ten respondents agree with this statement. The only country where significantly more people agree now than in 2009 is Luxembourg (91%, up from 84%), while falls of a similar magnitude were recorded in Portugal (80%, down from 88%) and the Czech Republic (77%, down from 84%). In most countries respondents strongly agree on the issue of whether being able to change easily from one job to another is a useful asset which helps people find a job nowadays, with at least three-quarters of respondents taking this view in 18 Member States. Agreement is strongest in Latvia, where 96% of people think that being able to change jobs easily is useful, followed by 91% in the Czech Republic, Denmark and Slovakia. Only 53% of respondents in Cyprus feel this way, however, as do 67% in Estonia, Spain and Malta. In all Member States, an absolute majority of respondents recognize the usefulness of being able to change easily from one job to another. Greece is the only country where opinion has moved dramatically since 2009: 70% now think that being able to change jobs easily is useful, up from just 51% two years earlier. Germany (75%, up from 69%) and Italy (74%, up from 68%) also saw rises. The most significant falls in the number of people agreeing occurred in Estonia (67%, down from 72%), Malta (67%, down from 72%) and Sweden (76%, down from 81%). A majority of respondents in all but one Member State Lithuania agree that life-time jobs with the same employer are a thing of the past. An overwhelming majority take this view in Hungary (90%), and in Slovenia, Slovakia and Sweden (all three 86%). But in Lithuania, only 39% of people believe that life-time jobs are a thing of the past, far fewer than in Malta, which has the next lowest proportion of people who think this (61%). The greatest evolutions since the previous survey are recorded in Cyprus, where 77% agree that life-time jobs are a thing of the past (up from 60% in 2009), Italy (67%, up from 56%) and Spain (81%, up from 70%). However, in Malta the proportion of respondents who agree with this statement has fallen from 70% to 61%, with a marked fall also witnessed in Romania (71%, down from 76%). 35
 than in the euro-zone (68%).")

37 In all but three Member States at least two-thirds of respondents agree that work contracts should become more flexible to encourage job creation. More respondents agree in non-euro countries (80%) than in the euro-zone (68%). In Slovenia 89% of people think that work contracts should become more flexible, as do 85% in Bulgaria, Ireland, Cyprus and Lithuania, compared to only 59% in the Netherlands, 62% in Portugal and 66% in Sweden. Despite these variations, large majorities of respondents agree with the statement in all Member States. The largest change since 2009 is in Italy, where 74% agree compared with 67% previously; more respondents also now agree in Spain (67%, up from 61%) and Lithuania (85%, up from 79%). No country saw a large reduction in the proportions agreeing that work contracts need to be more flexible, with the largest fall seen in Sweden (66%, down from 69%). 36


38 The issue of whether people retire too early exposes the widest differences in opinion between individual Member States. A distinction between EU15 and NMS12 respondents also emerges, with 48% agreeing that people retire too early in the NMS12 compared with just 42% in the EU15. In 12 countries a majority of respondents agree that people retire too early, with significant support for this view in Hungary (75%), Greece (65%) and Austria (65%). But elsewhere, relatively few people think that retirement should come later in life, with only 17% expressing this sentiment in Estonia, along with 18% in Lithuania and 22% in Malta. Several countries have seen sizeable swings in opinion over the last two years. In Greece, the proportion of respondents who say that people retire too early has risen from 49% to 65%; large increases also occurred in Austria (65%, up from 53%), Cyprus (54%, up from 43%) and Slovenia (50%, up from 39%). By contrast, a significant decline in this view was seen in Romania (47%, down from 60%) and Sweden (39%, down from
39 The socio-demographic data show that: Men are somewhat more inclined to agree that people retire too early: 46% agree with this, compared with 41% of women. Men are also slightly more likely to think that being able to change jobs easily is a useful asset, by a margin of 80% to 76%. Older respondents are more likely to agree that life-time jobs are a thing of the past: 79% of people in the 55+ group think this, compared with 69% of year-olds. Older respondents are also the most likely to agree that people in their country retire too early, with 50% of people in the 55+ bracket agreeing, as opposed to just 36% in the age group. People who spent longer in education are more inclined to think that being able to change jobs easily is a useful asset. 83% of those who finished their education aged 20 or over take this view, compared with just 71% who left school aged 15 or under. It is interesting to note that above-average levels of retired respondents (49%, compared to an EU average of 44%) agree that people retire too early. 52% of self-employed people also think that many people retire too early, whereas only 39% of unemployed respondents and students think this. Despite some variations between categories, results are generally quite uniform on this question. QA15 Please tell me, for each of the following statements, to what extent you agree or disagree with it. - Total 'Agree' Regular training improves one s job opportunities Being able to change easily from one job to another is a useful asset to help people find a job nowadays Life-time jobs with the same employer are a thing of the past Work contracts should In (OUR COUNTRY) many become more flexible to people retire too early encourage job creation EU27 87% 78% 77% 72% 44% Sex Male 87% 80% 77% 70% 46% Female 86% 76% 77% 73% 41% Age % 79% 69% 75% 36% % 80% 76% 73% 41% % 79% 78% 72% 44% % 76% 79% 71% 50% Education (End of) 15-82% 71% 78% 70% 46% % 79% 76% 73% 43% % 83% 79% 72% 46% Still studying 91% 79% 70% 73% 39% Respondent occupation scale Self-employed 90% 83% 78% 75% 52% Managers 92% 83% 78% 71% 44% Other white collars 87% 82% 77% 70% 44% Manual workers 86% 79% 74% 71% 40% House persons 85% 70% 76% 76% 42% Unemployed 82% 73% 81% 74% 39% Retired 85% 77% 80% 71% 49% Students 91% 79% 70% 73% 39% 38
40 3.2 Perceived impact of austerity measures and poverty - Over three-quarters of Europeans feel that fairness and social justice have been adversely affected by the economic crisis - There is a strong consensus among European citizens that the economic crisis has had a damaging impact on fairness and social justice in their country 22, with 44% of people totally agreeing that the impact has been negative and 35% tending to do so making for 79% overall agreement. Just 11% tend to disagree that fairness and social justice have suffered, while only 4% totally disagree. However, as a national analysis shows, agreement on this issue is not uniform across the EU: in 20 Member States at least 75% of respondents agree that the crisis has damaged fairness and social justice, while in others agreement is less widespread. Considerable variations are seen in the strength of agreement: in Cyprus 94% of people say the impact has been negative, with 75% totally agreeing that this is the case; and in Greece 93% agree, 67% totally. However, in three Member States fewer than 70% of respondents share this opinion: Luxembourg, where 65% agree (31% totally), the Netherlands (67%, 29% totally), and Malta (68%, 27% totally). 22 QA32: First of all, to what extent do you agree or disagree with the following statement: The economic crisis has had a negative impact on the fairness and social justice in (OUR COUNTRY)? Totally agree; tend to agree; tend to disagree; totally disagree; don t know. 39


41 In most socio-demographic groups, large majorities of respondents agree with the statement. However, some variations can be highlighted: Older respondents are slightly more inclined to agree that the economic crisis has had a damaging social impact. While 81% of year-olds and 79% of people in the and 55+ age groups agree that this is the case, only 75% of year-olds say the same thing. Respondents who have difficulty paying their bills most of the time are more likely to feel that the crisis has had an adverse impact on fairness and social justice. While 86% of people in this group agree, only 83% of those who have trouble paying their bills from time to time, and 77% of those who almost never have difficulty share this viewpoint. Individuals who say that poverty has increased in the past three years are, quite logically, the most likely to agree that the crisis has had a negative impact: 83% do so, compared with just 53% of those who do not think that poverty has increased. 40

42 - A clear majority of Europeans think that the economic crisis has affected some people more than others - Asked whether the burden of public spending cuts and austerity measures has affected some people in society more than others, there is even stronger agreement among Europeans that this is indeed so % of people hold this view, while just 14% think that spending cuts have affected everyone equally. The belief that austerity measures have affected some people more than others is held very strongly in some countries, with at least 90% support in six Member States: Slovenia and Sweden (both 95%), Cyprus (93%), Denmark (91%), Lithuania (91%), and Spain (90%). In six countries, at least 20% of respondents feel that the cuts have affected everyone equally: Austria (28%), Hungary and Romania (both 25%), Portugal (22%), Latvia (21%) and Bulgaria (20%). But in all Member States, more than twothirds of respondents think that the crisis has affected some people more than others. 23 QA33: Which of the following statements best describes how you feel the burden of public spending cuts and other austerity measures has affected people in (OUR COUNTRY)? It has affected everyone equally; it has affected some people more than others; don t know. 41


43 The socio-demographic data show only minor variations on this question; a very large majority of respondents in all categories say that some people have been affected more than others. However, some differences were observed: Respondents who spent more time in formal education are more likely to feel that the austerity measures have affected some people more than others: 86% of those who finished their education aged 20 or over think this, compared with 81-82% of those who left at a younger age. While 87% of managers believe that the cuts have affected some people more than others, only 81% of house persons and students agree. Interestingly, there are almost no differences by position on the social scale: 82% of those who position themselves at at the top of the scale agree with the statement, compared with 81% of those at the bottom. 42
 say that the poorest in society have been affected the most.")
44 - Most respondents believe the poorest people in society are the most affected by the economic crisis - People who felt that some members of society were more affected by spending cuts and austerity measures than others were then asked which groups in particular were affected 24. The great majority of respondents (69%) say that the poorest in society have been affected the most. In second position, over one in three respondents (36%) identify the elderly as one of the hardest-hit groups. Low skilled/manual workers are cited by 28% of respondents, with the same number saying that unemployed people and people in precarious work are the most affected. Young adults are one of the most severely affected groups according to 22% of respondents, while 21% identify large families and 17% single parents. Just 8% of people think that children are affected the most. Finally, only 3% think that immigrants or women are the hardest hit, and 2% consider that the most well-off are one of the worst affected groups. There are interesting differences between the EU15 and NMS12 countries on this question. Respondents from the NMS12 countries are more likely to think that the poorest are the most affected (76%, compared with 68%), along with the elderly (41% versus 34%) and large families (26% versus 19%). However, people in the EU15 are more inclined to say that young adults are the most affected (by a margin of 23% to 18%), as well as lowskilled/manual workers (30%, compared with 18%), unemployed people (by 29% to 24%) and people in precarious work (by 29% to 20%). Base: those who think that some people have been affected by the crisis more than others =83% of the total sample 24 QA34 Who do you think have been affected the most by public spending cuts and other austerity measures in (OUR COUNTRY)? (MAX. 3 ANSWERS). The poorest; the most well off; the elderly; children; young adults; large families; single parents; low skilled/manual workers; unemployed people; people in precarious work; women; immigrants; other (SPONTANEOUS); don t know. 43
45 It is striking that the poorest is by far the most widespread answer in all Member States, with a majority of the respondents who think that the crisis has affected some people more than others giving this answer in all 27 EU countries. In Cyprus 88% of respondents think that the poorest are one of the groups most affected by spending cuts and austerity measures, followed by 81% in Poland and 80% in Hungary and Romania. At the other end of the scale, just 56% of people in Denmark identify the poorest as the one of the worst affected groups, as do 57% in both Estonia and Sweden. In five Member States more than half of respondents think that the elderly are the most affected group: Lithuania (63%), Slovakia (57%), Latvia (54%), the Czech Republic (52%), and Finland (51%). However, in other Member States relatively few people think the elderly are affected the most, with the lowest scores in Luxembourg, (16%) and Cyprus (23%). Just above half of respondents in Slovenia (52%) take the view that lowskilled/manual workers are one of the most affected groups, significantly more than in France (38%), which has the next highest proportion of people giving this answer. Elsewhere, relatively few people cite low-skilled/manual workers as one of the most affected groups, with the lowest scores in Finland (12%), Poland and Greece (both 14%). In Sweden 57% of respondents say that unemployed people are one of society s most affected groups, as do 46% in both Cyprus and Spain. At least a third of respondents cite the unemployed in eight Member States. But in Slovenia, just 16% of respondents consider unemployed people to be one of the most affected groups, followed by 18% in Austria. People in precarious work are regarded as one of the most affected groups by 49% of respondents in Slovenia and by 38% of those in France (these results being similar to those for low-skilled/manual workers). Just 7% of respondents in Lithuania and 9% in Latvia regard people in precarious work as one of the hardest-hit groups. There is a strong view that young adults are most affected by public spending cuts and other austerity measures in Ireland (38%), Greece (38%) and Cyprus (32%), although relatively few respondents think that young adults are suffering most in Malta, Poland and Slovenia (all 11%). A relatively high proportion of respondents in Cyrpus (53%), Latvia (44%) and Estonia (42%) argue that large families are affected the most, but in 14 Member States less than a quarter of people think that this is the case. Only 4% do so in Sweden. Single parents are one of the most affected groups according to 40% of respondents in the Czech Republic (40%), with 33% of those in Sweden and 32% in Austria also mentioning single parents. However, just 3% of respondents in Portugal and 6% in both Italy and Spain identify single parents as one of the groups most affected by the cuts. 44
46 While relatively few people overall think that the other groups under discussion here are the most affected by the austerity measures, a relatively high 24% of people in Denmark, 20% in Latvia and 18% in Finland think that children are the one of the most affected sections of society, though in 19 Member States less than 10% think that this is the case. 45
47 QA34 Who do you think have been affected the most by public spending cuts and other austerity measures in (OUR COUNTRY)? The poorest The elderly Low skilled/ manual workers Unemployed people People in precarious work Young adults Large families Single parents Children Immigrants Women Other (SPONTANE- OUS) Don't know EU27 69% 36% 28% 28% 28% 22% 21% 17% 8% 3% 3% 2% 1% BE 69% 34% 31% 26% 27% 22% 15% 31% 2% 6% 2% 2% 0% BG 65% 50% 25% 44% 29% 25% 11% 10% 5% 0% 2% 2% 1% CZ 62% 52% 17% 25% 18% 24% 25% 40% 9% 0% 3% 1% 1% 56% 36% 35% 40% 23% 19% 15% 23% 24% 13% 1% 1% 0% DE 61% 30% 36% 22% 30% 14% 21% 31% 17% 3% 2% 1% 2% EE 57% 28% 25% 23% 22% 24% 42% 27% 16% 1% 2% 2% 0% IE 65% 30% 37% 32% 16% 38% 29% 9% 9% 2% 1% 8% 1% EL 78% 45% 14% 39% 22% 38% 27% 9% 3% 3% 6% 2% 0% ES 75% 24% 23% 46% 25% 28% 23% 6% 2% 8% 4% 0% 0% FR 75% 30% 38% 29% 38% 25% 14% 11% 3% 8% 5% 2% 1% IT 62% 37% 33% 30% 36% 23% 24% 6% 2% 1% 3% 2% 0% CY 88% 23% 20% 46% 11% 32% 53% 17% 1% 0% 1% 1% 0% LV 69% 54% 18% 19% 9% 17% 44% 17% 20% 1% 3% 1% 1% LT 76% 63% 23% 27% 7% 21% 28% 8% 8% 1% 2% 2% 0% LU 70% 16% 35% 24% 23% 22% 27% 20% 3% 11% 3% 1% 1% HU 80% 35% 23% 36% 23% 19% 26% 17% 6% 0% 2% 2% 0% MT 70% 48% 31% 27% 17% 11% 36% 13% 3% 2% 1% 2% 1% NL 67% 40% 33% 20% 32% 18% 24% 30% 2% 0% 2% 0% 2% AT 60% 33% 35% 18% 29% 15% 34% 32% 11% 3% 7% 2% 1% PL 81% 31% 14% 19% 23% 11% 25% 15% 6% 0% 2% 0% 1% PT 75% 44% 18% 36% 21% 16% 17% 3% 5% 0% 2% 4% 0% RO 80% 47% 16% 19% 10% 28% 32% 9% 12% 0% 3% 2% 1% SI 72% 26% 52% 16% 49% 11% 14% 11% 4% 9% 2% 3% 0% SK 61% 57% 21% 32% 25% 20% 21% 24% 4% 1% 4% 2% 1% FI 59% 51% 12% 26% 29% 26% 16% 28% 18% 5% 2% 3% 1% SE 57% 40% 24% 57% 25% 17% 4% 33% 9% 15% 1% 3% 1% UK 69% 43% 25% 21% 23% 31% 16% 20% 11% 2% 2% 4% 1% Highest percentage per country Highest percentage per item Lowest percentage per country Lowest percentage per item Base: those who think that some people have been affected by the crisis more than others =83% of the total sample 46
48 There are some variations between categories. The socio-demographic analysis reveals that: Older respondents are more likely to feel that the elderly are one of the most affected groups, while younger respondents are more inclined to think that young adults are among the worst hit. However, it should be noted that the year olds still think that the elderly (29%) are more affected than young adults (26%). 42% of people in the 55+ bracket think the elderly are among the most affected, compared with just 29% of those in the age group. However, 26% of those in the latter group say that young adults are among the most affected, as opposed to 20% of those in the 55+ group. Respondents who spent less time in education are more inclined to think that the poorest are among the worst affected: 72% of people who left school at 15 or under say this, compared with 67% of those who finished their education aged 20 or over. They are also the most likely to identify the elderly among the most affected groups (42%, compared with 33% in the 20+ group), as well as unemployed people (32%, compared with 27-28% in the and 20+ groups). However, 32% of people who finished their education aged 20 or over say that people in precarious work are among the most affected, whereas only 24% of those who left school at 15 or under say this. Unsurprisingly, a relatively high proportion of unemployed respondents feel that unemployed people are one of the groups affected the most: 39% say this, compared with just 24% of managers. Respondents who live alone are the most likely to regard the elderly as one of the most affected groups: 41% of people who live alone think this, compared with just 31% of people who live in households of four or more. By contrast, 25% of people who live in households of four or more say that large families are among the worst hit, compared with just 18% of people who live alone. Divorced or separated people are the most likely to cite single parents as one of the most affected groups: 27% do so, compared with 18% of single living with a partner and 16% of married people. People who have difficulty paying their bills most of the time are the most inclined to identify the poorest people in society as the most affected by spending cuts: 74% say this, compared with 68% of those who almost never have trouble with bills. 34% of respondents with financial difficulties most of the time also say that the unemployed are among the worst affected groups, compared with just 27% of those who almost never have trouble. Overall, all socio-demographic categories agree that the poorest are the group that has been affected the most by public spending cuts and other austerity measures. Respondents are otherwise more likely than average to mention the groups to which they belong. 47
49 QA34 Who do you think have been affected the most by public spending cuts and other austerity measures in (OUR COUNTRY)? (MAX. 3 ANSWERS) The poorest The elderly Low skilled\ manual workers Unemployed people People in precarious work Young adults Large families Single parents Children The most well off Immigrants Women Other (SPONTA- NEOUS) EU27 69% 36% 28% 28% 28% 22% 21% 17% 8% 2% 3% 3% 2% 1% Sex Male 70% 34% 30% 29% 27% 23% 21% 15% 7% 2% 3% 2% 2% 1% Female 68% 37% 26% 28% 28% 22% 20% 19% 9% 2% 3% 4% 2% 1% Age % 29% 28% 30% 26% 26% 22% 18% 8% 4% 5% 2% 1% 1% % 30% 26% 29% 29% 24% 22% 17% 8% 2% 4% 3% 2% 1% % 35% 29% 27% 28% 21% 21% 18% 8% 2% 3% 3% 2% 1% % 42% 28% 29% 26% 20% 19% 17% 7% 2% 3% 4% 2% 1% Education (End of) 15-72% 42% 26% 32% 24% 20% 22% 14% 6% 2% 3% 3% 1% 1% % 36% 29% 27% 27% 22% 22% 19% 8% 2% 2% 3% 2% 1% % 33% 29% 28% 32% 23% 18% 18% 8% 2% 5% 3% 2% 1% Still studying 67% 27% 26% 31% 29% 26% 22% 16% 8% 4% 6% 2% 1% 1% Household composition 1 70% 41% 26% 29% 26% 19% 18% 17% 7% 3% 3% 3% 1% 1% 2 70% 38% 29% 28% 28% 22% 19% 18% 8% 2% 4% 3% 2% 1% 3 68% 34% 29% 30% 29% 23% 20% 17% 8% 2% 3% 4% 1% 1% 4+ 68% 31% 27% 27% 28% 23% 25% 16% 7% 3% 4% 2% 2% 1% Respondent occupation scale Self-employed 69% 31% 29% 27% 31% 22% 22% 13% 7% 2% 3% 3% 3% 1% Managers 63% 37% 31% 24% 32% 23% 18% 21% 10% 3% 4% 3% 2% 1% Other white collars 67% 36% 27% 27% 32% 24% 22% 18% 5% 3% 3% 3% 2% 0% Manual workers 70% 33% 31% 27% 26% 23% 23% 17% 8% 1% 4% 3% 1% 1% House persons 71% 35% 24% 29% 24% 20% 23% 18% 9% 3% 2% 4% 2% 1% Unemployed 73% 30% 26% 39% 25% 22% 19% 18% 9% 2% 4% 3% 1% 0% Retired 71% 43% 27% 27% 25% 20% 19% 17% 7% 2% 3% 4% 2% 1% Students 67% 27% 26% 31% 29% 26% 22% 16% 8% 4% 6% 2% 1% 1% Difficulties paying bills Most of the time 74% 33% 27% 34% 23% 26% 21% 15% 6% 2% 3% 4% 2% 1% From time to time 72% 38% 25% 28% 25% 23% 22% 16% 8% 2% 2% 3% 1% 1% Almost never 68% 35% 29% 27% 29% 21% 20% 18% 8% 2% 4% 3% 2% 1% Base: those who think that some people have been affected by the crisis more than others =83% of the total sample 48
 25.")
50 - A large and growing majority of Europeans think that poverty is on the increase - When asked whether poverty has increased or decreased over the last three years, 87% of all Europeans say that it has increased (compared with 84% in August-September 2010) % say that it has strongly increased, compared with just 30% who gave this response in the 2010 survey, while 44% think it has somewhat increased (down from 54% in 2010, reflecting a shift towards the strongly increased response). The belief that poverty has increased in the last three years is much more strongly held than in autumn Only 6% of people think that poverty has decreased in their country, 5% somewhat and just 1% strongly, results that reflect little change from Respondents living in the euro-zone are more inclined to agree that poverty has increased over the last three years: 90% say this, compared with 81% outside the eurozone. In 14 Member States at least 90% of people agree that poverty has increased in their country over the last three years, and there is near-unanimous agreement on this point in Greece (99%), and Spain (98%). In five EU countries, fewer than 80% of respondents feel that poverty is on the increase: Sweden (70%), Poland (72%), Denmark (76%), Malta (77%) and Finland (79%). In all but one Member State Latvia more people now think that poverty has strongly increased in the last three years than in The most significant shifts in opinion are observed in Cyprus, where 61% of people now think poverty has increased strongly, compared with just 21% in 2010, Greece (80%, up from 55%), and Italy (43%, up from just 19%). Latvia is the exception presumably as a result of the severity of the crisis there with 47% of people saying that poverty is increasing strongly, down from 58% in QA35: Generally speaking, would you say that poverty has strongly increased, somewhat increased, somewhat decreased or strongly decreased in the last three years in (OUR COUNTRY)? Strongly increased; somewhat increased; somewhat decreased; strongly decreased; stayed about the same (SPONTANEOUS); don t know. 49
 over the last three years.")
 now think that poverty has increased than previously: Germany (83%,")
51 However, Latvia is not one of the countries with the highest proportion of respondents who think that poverty has actually decreased (somewhat or strongly) over the last three years. More people believe this to have been the case in Sweden (15%), Poland (12%) and Estonia (11%). In five countries, fewer respondents in total (strongly and somewhat) now think that poverty has increased than previously: Germany (83%, down from 91%), Estonia (80%, down from 86%), Latvia (90%, down from 96%), Lithuania (86%, down from 94%), and Hungary (94%, down from 97%). 50
52 There are some differences in perceptions of changing poverty levels in different socio-demographic categories. In fact, the impression that poverty has increased in the last three years is generally widespread in most categories, but interesting variations are seen for the item strongly increased : Female respondents are more likely to think that poverty has increased strongly over the last three years: 46% do so, compared with 41% of male respondents. While 47% of respondents in the and 55+ age groups think that poverty has increased strongly, only 42% in the category and 32% of yearolds share this view. People who finished their education earlier are more likely to see a strong increase in poverty. While 55% of people who left school at 15 or under say that poverty has increased strongly, only 46% of those who left aged and 37% of those who finished their education aged 20 or over say this. While 52% of unemployed people and 53% of house persons see a strong increase in poverty, only 28% of students and 34% of managers share this opinion. 67% of those who have difficulty paying their bills most of the time think that poverty has increased strongly, whereas only 52% of people who have difficulty sometimes and 36% of those who almost never have difficulty say this. 51
53 - Only 22% of Europeans think that enough is being done to address the issue of poverty - While most respondents clearly feel that poverty is on the rise, it is equally clear that relatively few believe that enough is being done to fight it 26. Just 22% of all respondents think that enough is being done: 4% definitely and 18% to some extent. By contrast, 75% do think that enough is being done to fight poverty, 39% saying no, not really, and 36% no, not at all. * Yes, definitely 4% / Don t know 3% There is a marked distinction between EU15 and NMS12 countries on this question. While 24% of EU15 respondents think that enough is being done to fight poverty in their country, only 14% of people in the NMS12 share this view. By contrast, 81% of NMS12 respondents say that not enough is being done, whereas only 73% of EU15 citizens say this. Interestingly, results in the euro-zone (23% yes ) and non-euro countries (21% yes ) are similar. 26 QA36: Do you think that enough is being done to fight poverty in (OUR COUNTRY)? Yes, definitely; yes, to some extent; no, not really; no, not at all; don t know. 52


, Romania (58%), Lithuania (52%) and Slovenia")
54 In six Member States, at least a third of respondents believe that enough is being done to fight poverty in their country, led by Luxembourg (53%), the Netherlands (48%) and Austria (44%). By contrast, in 12 Member States at least 80% of respondents say that not enough is being done to fight poverty, with scores as high as 91% in both Greece and Romania and 88% in Latvia. In four countries, half or more of respondents answer no, not at all : Greece (60%), Romania (58%), Lithuania (52%) and Slovenia (50%). 53
55 In all socio-demographic categories, large majorities of respondents think that efforts to fight poverty are insufficient in their country. The socio-demographic data reveal some variations between categories, however: Men are somewhat more likely than women to think that enough is being done to fight poverty: 24% think so, compared with 20% of women. Young people are more inclined to say that enough is being done to fight poverty in their country. While 27% of year-olds see it this way, only 19-22% of people in the older age groups do so. While 25% of people who finished their education at 20 or over feel enough is being done to fight poverty, only 20% of those who left school at and 18% of those who left at 15 or under agree. People who have difficulty paying their bills most of the time are more likely to feel that not enough is being done to fight poverty: 84% of respondents in this group hold this view, compared with 80-72% of people who have trouble paying their bills sometimes or almost never. Only 19% of respondents who previously said that poverty is on the increase think that enough is being done to fight it, compared with 42% of those who said that poverty is generally decreasing. 54

56 - Around one European in ten has had to stay with friends or relatives because they had nowhere else to live - When asked about their personal experiences of poverty, 87% of all EU respondents say spontaneously that they have not experienced any of the situations associated with poverty under consideration here 27. However, 9% of people say that they have experience of having to stay with friends, relatives or other people because they had nowhere else to live. Just 3% of respondents recall having to stay in emergency or temporary accommodation (e.g. a shelter, refuge or temporary hostel), while 2% say they have been homeless or have had to "sleep rough" and 1% have had to stay in insecure accommodation where they had no legal rights (e.g. squatting). In 13 Member States at least 90% of respondents say they have not experienced any of these situations. It is mostly the case in Malta (98%), Bulgaria (96%), Greece and Luxembourg (both 93%). At the other end of the scale, only 78% of respondents in the UK say that they have never experienced such situations, followed by 81% in Estonia and Italy. In six Member States at least 10% of respondents say that they have experience of having to stay with friends, relatives or other people because they had nowhere else to live. In the UK 17% of people have experience of this situation, as do 13% of respondents in both the Czech Republic and Denmark. While relatively few people overall have experience of having to stay in emergency or temporary accommodation, 6% of people in Cyprus, Italy and the UK say they have done so. The UK is the only country in which a significant proportion of respondents (6%) report that they have been homeless or slept rough, while Poland records the most respondents (3%) who have stayed in insecure accommodation where they had no legal rights. 27 QA37: Have you personally ever experienced in your life any of the following situations? (MULTIPLE ANSWERS POSSIBLE). Being homeless or having to "sleep rough"; having to stay with friends, relatives or other people because you didn't have anywhere else to live; having to stay in emergency or temporary accommodation (e.g. a shelter, refuge or temporary hostel); having to stay in insecure accommodation where you had no legal rights (e. g. squatting); none (SPONTANEOUS); don t know. 55
57 QA37 Have you personally ever experienced in your life any of the following situations? Having to stay with friends, relatives or other people because you didn't have anywhere else to live Having to stay in emergency or temporary accommodation (e.g. a shelter, refuge or temporary hostel) Being homeless or having to "sleep rough" Having to stay in an insecure accommodation where you had no legal rights (e. g. squatting) None (SPONTANEOUS) Don't know EU27 9% 3% 2% 1% 87% 1% BE 8% 3% 2% 2% 86% 2% BG 3% 1% 1% 0% 96% 1% CZ 13% 2% 2% 1% 84% 0% 13% 2% 2% 1% 85% 0% DE 6% 2% 1% 0% 92% 1% EE 7% 2% 1% 1% 81% 8% IE 6% 2% 1% 1% 91% 1% EL 6% 1% 0% 0% 93% 0% ES 7% 1% 1% 0% 91% 1% FR 10% 3% 2% 1% 86% 2% IT 8% 6% 2% 2% 81% 1% CY 12% 6% 1% 0% 82% 0% LV 7% 1% 1% 1% 88% 3% LT 5% 1% 1% 1% 92% 1% LU 4% 1% 2% 1% 93% 1% HU 6% 3% 1% 1% 89% 0% MT 1% 0% 1% 0% 98% 0% NL 6% 2% 1% 1% 92% 0% AT 10% 2% 0% 2% 86% 0% PL 9% 2% 2% 3% 85% 1% PT 5% 3% 0% 1% 90% 1% RO 5% 2% 0% 1% 89% 5% SI 6% 1% 2% 1% 91% 0% SK 7% 1% 1% 1% 91% 1% FI 9% 3% 2% 1% 88% 0% SE 7% 0% 0% 1% 92% 0% UK 17% 6% 6% 2% 78% 1% Highest percentage per country Highest percentage per item Lowest percentage per country Lowest percentage per item 56
58 The socio-demographic data show the following patterns: Individuals in the and age groups are the most likely to have experienced such situations. While 90% of those aged 55 and over and 88% of year-olds say that they have never experienced poverty, the figure falls to 84% in the and age groups. 11% of people in these two groups have had to stay with friends or relatives, compared with 6-8% of people in the youngest and oldest age brackets. People who live in rural areas are slightly less likely to have lived these experiences of poverty. While 89% of those who live in rural villages have never experienced poverty, only 84% of those who live in large towns are able to say the same. Respondents who live alone are more likely to have experienced poverty than people who live in larger households. While 87-88% of people who live in households of two people or more say they have experienced none of these situations, only 82% of respondents who live alone say this. While 92% of students, 89% of the retired and 88% of managers say they have never experienced poverty, only 77% of unemployed people are able to say this: 6% of the latter have been homeless or have had to sleep rough, 16% to stay with friends, relatives or other people, 6% to stay in emergency or temporary accommodation, and 3% to stay in an insecure accommodation. Overall, almost a quarter of unemployed people have experienced these situations of poverty. Individuals who have trouble paying their bills are much more likely to have experience of poverty. Only 74% of people in this category say they have not encountered any of these situations, whereas 83% of those who sometimes and 90% of those who almost never have difficulty say this. 57
59 QA37 Have you personally ever experienced in your life any of the following situations? (MULTIPLE ANSWERS POSSIBLE) Having to stay with friends, relatives or other people because you didn't have anywhere else to live Having to stay in emergency or temporary accommodation (e.g. a shelter, refuge or temporary hostel) Being homeless or having to "sleep rough" Having to stay in an insecure accommodation where you had no legal rights (e. g. squatting) None (SPONTANEOUS) EU27 9% 3% 2% 1% 87% 1% Sex Male 10% 3% 2% 2% 85% 1% Female 8% 3% 1% 1% 88% 1% Age % 2% 1% 1% 88% 1% % 3% 2% 1% 84% 1% % 4% 3% 2% 84% 1% % 3% 1% 1% 90% 1% Education (End of) 15-9% 4% 2% 1% 86% 1% % 3% 2% 1% 86% 1% 20+ 8% 2% 2% 1% 88% 1% Still studying 5% 2% 0% 1% 92% 1% Household composition 1 12% 5% 3% 2% 82% 1% 2 8% 3% 1% 1% 88% 1% 3 7% 3% 2% 1% 87% 2% 4+ 8% 3% 2% 1% 87% 1% Respondent occupation scale Self-employed 9% 3% 1% 1% 87% 1% Managers 9% 2% 1% 1% 88% 1% Other white collars 9% 3% 2% 1% 85% 1% Manual workers 10% 3% 2% 1% 85% 1% House persons 8% 3% 2% 2% 86% 2% Unemployed 16% 6% 6% 3% 77% 1% Retired 6% 3% 2% 1% 89% 1% Students 5% 2% 0% 1% 92% 1% Difficulties paying bills Most of the time 18% 6% 4% 2% 74% 2% From time to time 12% 4% 2% 2% 83% 1% Almost never 6% 2% 1% 1% 90% 1% 58
60 3.3 The effectiveness of employment measures - There is strong backing for incentives rather than punishment in order to tackle the problem of undeclared work - Most European respondents support incentives over sanctions in order to tackle undeclared work 28. Two-thirds (66%) of respondents think that governments should make it easier to work lawfully through incentives, while under a third (29%) would prefer to punish those responsible. There are considerable differences between Member States, maybe reflecting cultural differences. Support for punishment is much more widespread in some Member States than in others, with over 40% of respondents preferring this approach in five EU countries: Bulgaria (50%), Greece (46%), Portugal (46%), Spain (44%) and Malta (41%). In these countries (with the exception of Malta) more respondents back punishment than support incentivisation. But in seven Member States, under 20% of people think punishment is the answer, with only 11% supporting punitive measures in Sweden, followed by 14% in Denmark and 15% in Lithuania. Support for making it easier to work lawfully through incentives is very strong in several countries, notably Sweden (88%), Denmark (83%) and Lithuania (83%). Broadly speaking, we can see in these results a cultural predisposition in favour of coercive measures in some countries including the Mediterranean Member States and a preference for incentive measures in others, notably in the Nordic countries. 28 QA19: In your opinion, which of the two following measures is the more effective way of tackling the issue of undeclared work in (OUR COUNTRY)? (IF NECESSARY: Undeclared work is any paid activities that are lawful but not declared to the public authorities. This allows employers and employees to increase their earnings or reduce their costs by evading taxation. It also means that employees have no employment right or protection.) Punish those responsible (e.g. fines, prison); make it easier to work lawfully through incentives (e.g. reduction of bureaucracy and administration costs); don t know. 59

61 Despite some variations between socio-demographic categories, large majorities of respondents favour incentives over punishments. However, some differences can be highlighted: Individuals who spent less time in education are more likely to advocate punishment for people engaged in undeclared work. While 34% of those who left school at 15 or under favour punishment, only 29% who left at and only 24% of those who finished their education aged 20 or over think punishment is the answer. House persons are the most likely to advocate punishment: 32% do so, compared with 25% of managers. Respondents who are concerned that they might lose their jobs are also more inclined to think that punishment is the best option. 31% of people who are worried about their jobs back punishment but this falls to 29% among those who are only moderately concerned and 24% among those who are not concerned. 60
62 - The different measures to get more people into work or to stay at work longer are considered effective by large majorities of Europeans Respondents were asked what measures are effective in getting people into work, or encouraging them to stay in work for longer % of respondents believe that supporting people who want to start their own business would be an effective policy, with 44% saying this would be very effective and 44% fairly effective. Just 10% disagree, with 8% saying it would not be very effective and 2% saying it would not be at all effective. The same proportion of respondents (88%) would welcome regular training for people at work, with 43% saying this would be very effective and 45% fairly effective. Again, just 10% say that it would be ineffective, with 8% saying it would not be very effective and 2% saying it would not be at all effective. 85% of respondents think that increasing the availability of childcare facilities would be effective, with 41% saying this would be very effective and 44% fairly effective. Just 11% think that this measure would be ineffective, with 9% saying it would not be very effective and 2% saying it would not be at all effective. The same proportion of Europeans (85%) think that increasing the affordability of child care facilities would make an impact, with 45% saying this would be very effective and 40% fairly effective. Only 11% think that increasing the affordability of childcare facilities would be ineffective, with 9% saying it would not be very effective and 2% saying it would not be at all effective. Making traineeships a compulsory part of higher education would be an effective measure in the eyes of 80% of respondents, with 39% saying this would be very effective and 41% fairly effective. 14% do not think it would an effective approach: 11% say it would not be very effective and 3% say it would not be at all effective. Three quarters of respondents (76%) think that making it easier for people to move from undeclared work into regular jobs (e.g. through taxation, labour market regulation) would be an effective way of getting more people into work: 33% say it would be very effective, and 43% fairly effective. However, 17% believe that making it easier for people to move out of undeclared work would not be effective, with 13% saying it would not be very effective and 4% saying it would not be at all effective. Making it easier for people to work abroad would be effective according to 68% of respondents, with 23% saying this would be very effective and 45% fairly effective. A quarter of all respondents think this would be an ineffective way of getting more people into work: 20% say it would not be very effective and 5% think it would not be at all effective. 29 QA16.1 For each of the following measures, how effective or not do you think they are in getting more people into work or staying at work longer in their life? Increasing availability of child care facilities; increasing affordability of child care facilities; increasing the difference in income between working and non-working people; making it easier for people to work abroad; supporting people who want to start their own business; making it easier for people to move from undeclared work into regular jobs (e.g. through taxation, labour market regulation); regular training for people at work; making traineeships a compulsory part of higher education. Very effective; fairly effective; not very effective; not at all effective; don t know. 61
63 Increasing the difference in income between working and non-working people would be an effective way of getting more people into work according to 65% of respondents, with 29% saying this would be very effective and 36% fairly effective. But 27% do not think this is the right policy, with 19% saying it would not be very effective and 8% not at all effective. Trend analysis is only possible for three of the eight measures under discussion here, since only these appeared in the 2009 survey. Of these, two show almost no change: 88% think that regular training for people at work would be effective, as did 87% in the previous survey; and 88% believe that supporting people who want to start their own business would be effective, only slighly more than the 86% who said this in However, there has been a marked increase in the number of respondents arguing that increasing the difference in income between working and non-working people would be an effective way of getting more people into work: while 65% think this would be an effective policy now, only 59% thought so in


64 Respondents in the EU15 countries are more likely to think that increasing the availability of childcare would be effective: 86% do so, compared with 79% in the NMS12. Similarly, while 87% of EU15 respondents think that increasing the affordability of childcare would be effective, only 78% of their NMS12 counterparts agree. By contrast, NMS12 respondents are more likely than those in the EU15 to think that making it easier for people to work abroad would be effective, by a margin of 73% to 65%. Similar patterns can be observed when comparing the euro-zone and non-euro countries. While 87% in the euro-zone support increasing the availability of childcare and 88% are in favour of increasing its affordability, these figures drop to 80% and 77% respectively outside the euro-zone. There is little distinction between euro-zone and noneuro countries on the issue of making it easier for people to work abroad, however. 63
65 At least 75% of respondents in all but one Member State Hungary think that supporting people who want to start their own business would be an effective way of getting more people into work. In Cyprus and Spain 95% of people take this line, as do 94% in Greece. But in Hungary where a relatively high proportion of respondents doubt the effectiveness of many of the measures under discussion here 38% think that supporting people who want to start their own business would not be effective, significantly more than the 19% of respondents who say this in Portugal, which has the next highest proportion who think this policy would be ineffective. Despite this relatively low result, Hungary has actually witnessed the largest increase in the number of people considering this measure to be effective: 60% now think it would be effective, up from just 47% in The next largest shift was in Bulgaria, where 86% think that supporting people who want to start their own business is a good idea, up from 78% in Most countries have seen small rises in the number of people who see this measure as effective, although Portugal is an obvious exception: here, 76% of respondents say that supporting people who want to start their own business would be effective, down from 84% two years earlier. In all but three Member States at least 75% of respondents say that regular training for people at work would be an effective way of getting more people into work. A very high proportion of people think that this is the case in Malta (98%), Cyprus (96%) and Luxemburg (94%). However, a significant proportion in Hungary (36%), Slovakia (26%) and Portugal (21%) think this would not be an effective approach. Latvia (90%, up from 84%) and Slovenia (88%, up from 82%) have seen modest increases in the number of people saying that regular training for people at work would be effective. However, in Portugal as seen on the previous question only 74% of respondents think that regular training would be effective, down from 86% in In all but six EU countries at least 75% of people agree that increasing the availability of childcare facilities would be effective, led by Malta (95%), Belgium (92%) and Spain (90%) But a relatively high proportion of people in Hungary (33%), Denmark (29%) and Sweden (25%) say that this approach would not be effective. In all but six Member States at least 75% of people think that increasing the affordability of childcare facilities would be effective. The vast majority of people in Austria, Belgium, Cyprus and Spain (all 92%) think this would help to get people into work. But in Sweden (46%), Denmark (38%), and Hungary (37%), more than a third of respondents say that this policy would not be effective. At least three quarters of respondents in 22 EU countries think that making traineeships a compulsory part of higher education would be effective, led by Cyprus (97%), Belgium (90%) and Luxembourg (89%). But relatively large numbers of respondents say that this approach would be ineffective in Hungary (32%), Slovenia (23%), Finland (23%) and Portugal (20%). 64
66 In 16 EU countries, more than 75% of respondents think that making it easier for people to move from undeclared work into regular jobs (e.g. through taxation, labour market regulation) would help to get more people into work. Support is high in Romania, (87%), Italy (85%), Greece (84%) and Finland (84%). Relatively high numbers of respondents say that this approach would be ineffective in Hungary (39%), Denmark (31%) and the Netherlands (30%). Making it easier for people to work abroad would be effective according to at least 75% of respondents in just four Member States: Spain (83%), Slovakia (82%), Slovenia (77%) and Bulgaria (76%). In 13 countries over 30% of respondents believe that this approach would not be effective, with relatively high numbers of people saying this in the Netherlands (39%) and Luxembourg (37%). Increasing the difference in income between working and non-working people is a potentially effective measure according to at least 75% of respondents in just five countries: Belgium (83%), Slovakia (80%), Slovenia (78%), Austria (77%) and Ireland (77%). A significant proportion of people in Sweden (51%), Finland (46%) and Hungary (42%) say that this would not be an effective approach. In several Member States there have been substantial increases in the number of people who believe that this measure would be effective. In Lithuania 72% say it would be effective, up from just 48% in 2009; there were also big rises in Slovenia (78%, up from 64%), Germany (70%, up from 60%) and Austria (77%, up from 67%). However, in Greece (66%, down from 75% in 2009) there was a significant fall in the number of respondents who think that this policy would be effective. 65
67 QA16 For each of the following measures, how effective or not do you think they are in getting more people into work or staying at work longer in their life? - Total 'Effective' Supporting people who want to start their own business Regular training for people at work Increasing availability of child care facilities Increasing affordability of child care facilities Making traineeships a compulsory part of higher education Making it easier for people to move from undeclared work into regular jobs (e.g. through taxation, labour market regulation) Making it easier for people to work abroad Increasing the difference in income between working and non-working people EU27 88% 88% 85% 85% 80% 76% 68% 65% BE 90% 93% 92% 92% 90% 81% 64% 83% BG 86% 80% 86% 87% 80% 77% 76% 61% CZ 85% 82% 86% 83% 77% 66% 74% 73% 84% 91% 68% 59% 78% 64% 59% 58% DE 85% 92% 86% 88% 77% 74% 56% 70% EE 87% 92% 79% 82% 84% 71% 65% 60% IE 88% 89% 84% 86% 79% 79% 72% 77% EL 94% 91% 89% 91% 86% 84% 74% 66% ES 95% 92% 90% 92% 88% 82% 83% 56% FR 90% 89% 88% 91% 78% 72% 62% 61% IT 90% 84% 88% 88% 78% 85% 73% 60% CY 95% 96% 87% 92% 97% 83% 66% 72% LV 91% 90% 81% 86% 81% 78% 60% 65% LT 85% 84% 76% 75% 78% 82% 68% 72% LU 88% 94% 79% 80% 89% 74% 57% 59% HU 60% 60% 62% 58% 60% 57% 66% 53% MT 91% 98% 95% 91% 82% 80% 72% 66% NL 90% 90% 79% 80% 76% 66% 57% 66% AT 86% 90% 89% 92% 76% 82% 64% 77% PL 88% 84% 84% 84% 80% 79% 73% 66% PT 76% 74% 80% 76% 67% 72% 68% 60% RO 87% 85% 70% 68% 78% 87% 73% 64% SI 87% 88% 72% 74% 69% 79% 77% 78% SK 91% 72% 86% 88% 74% 75% 82% 80% FI 86% 81% 74% 72% 73% 84% 60% 51% SE 91% 86% 73% 51% 84% 78% 66% 46% UK 87% 92% 84% 84% 84% 73% 63% 72% Highest percentage per country Highest percentage per item Lowest percentage per country Lowest percentage per item 66
68 QA16 For each of the following measures, how effective or not do you think they are in getting more people into work or staying at work longer in their life? Total 'Effective' Supporting people who want to start their own business - Sept-Oct May-June 2009 Regular training for people at work - Sept-Oct May-June 2009 Increasing the difference in income between working and nonworking people - Sept-Oct May-June 2009 EU27 88% +2 88% +1 65% +6 BE 90% +2 93% +2 83% +8 BG 86% +8 80% +5 61% +8 CZ 85% +7 82% -4 73% +2 84% +5 91% -1 58% -2 DE 85% +1 92% +1 70% +10 EE 87% +1 92% +2 60% +5 IE 88% -3 89% -2 77% +4 EL 94% +1 91% -1 66% -9 ES 95% +2 92% -2 56% +8 FR 90% -3 89% = 61% +8 IT 90% +4 84% +1 60% +6 CY 95% -2 96% -2 72% -5 LV 91% +6 90% +6 65% +7 LT 85% = 84% +2 72% +24 LU 88% = 94% +3 59% +9 HU 60% % +2 53% = MT 91% -1 98% +3 66% -1 NL 90% +6 90% +4 66% +1 AT 86% -1 90% +1 77% +10 PL 88% +1 84% +3 66% +3 PT 76% -8 74% % = RO 87% +4 85% +3 64% -1 SI 87% +6 88% +6 78% +14 SK 91% +4 72% -5 80% -1 FI 86% = 81% -3 51% +3 SE 91% -1 86% -3 46% +1 UK 87% +2 92% +3 72% +9 67
69 Analysis of the socio-demographic data shows that: Women seem to be more sensitive to the issue of child-care facilities: they are more likely to believe that increasing the availability and affordability of child care is a very effective way of getting more people into work. While 45% and 49% of women say that increasing availability and affordability respectively would be 'very effective, only 37% and 40% of men say the same thing. Respondents in the age group are the most likely to think that increasing the availability and affordability of child care would be very effective: 46% (availability) and 49% (affordability) of those in this category think this, as opposed to 35% and 40% respectively of year-olds. By contrast, younger respondents are the most likely to think that making it easier for people to work abroad would be effective: 73% of year-olds and 77% of students back this idea, compared to 69% of year-olds and 65% of people aged 40 and over. Students support making traineeships a compulsory part of higher education: 85% think this would be effective, more than all other occupational groups. People who have difficulty paying their bills most of the time are less likely to be in favour of increasing the difference in income between working and nonworking people. Only 58% of people in this group think this measure would be effective, as opposed to 64% of those who sometimes have difficulty and 67% of those who almost never have difficulty paying their bills. People who think that poverty has increased over the last three years are more likely to think that seven of these eight measures would be effective than those who think poverty has decreased (the exception being increasing the difference in income between working and non-working people, for which there is no distinction between increased and decreased ). This is probably a logical result, given that people who believe that poverty is a growing problem are more likely to think that taking action will help to alleviate that problem. Despite the differences between socio-demographic groups, there is an overall consensus that these measures would be effective in terms of getting more people into work. 68

70 4. CONFIDENCE RISE IN RETAINING EMPLOYMENT 4.1 Confidence in retaining jobs - In 20 EU countries overall confidence in job security has risen over the past year, though confidence has ebbed in several Member States - A large majority of respondents who are currently working (82%) are confident that they will be able to keep their jobs in the coming months, with 43% describing themselves as very confident and 39% as fairly confident 30. Just 15% say they are not confident of keeping their jobs, with 11% not very confident and 4% not at all confident. Overall, people are slightly more confident about their ability to keep their jobs than they were in 2009, when only 37% said they were very confident (6% lower than in 2011), and 80% were either very or fairly confident (2% lower than now). *: Don t know 3% : Not at all 5% / Don t know 3% Base: those currently working =49% of the total sample 30 QA7: How confident would you say you are in your ability to keep your job in the coming months? Are you? Very confident; fairly confident; not very confident; not at all confident; don t know. 69
71 Respondents who are in work in the EU15 countries are generally more confident about their ability to keep their jobs than their counterparts in the NMS12 countries. While 46% of EU15 respondents describe themselves as being very confident, only 31% of NMS12 respondents say this. Overall, 83% of EU15 citizens are confident, compared with 77% in the NMS12. In nine Member States at least 90% of respondents who work are confident that they will be able to keep their jobs, with confidence levels highest in Sweden (95%, 87% very confident), Denmark (92%, 71% very confident), Germany (91%, 64% very confident) and Finland (91%, 62% very confident). However, in four EU countries fewer than twothirds of people are confident of their ability to keep their job, with correspondingly fewer respondents who are very confident : Greece (44%, 14% very confident), Slovakia (56%, 11% very confident), Spain (61%, 27% very confident), and Hungary (66%, 17% very confident). Twenty EU countries have experienced an overall rise in confidence over the previous year, with striking increases in Latvia (86% confident, up from 66%), Lithuania (76%, up from 58%), Romania (83%, up from 67%) and Slovenia (90%, up from 79%). However, a handful of countries witnessed significant falls in confidence, notably Greece (44%, down from 54%), Spain (61%, down from 69%), and Slovakia (56%, down from 61%). 70
72 QA7 How confident would you say you are in your ability to keep your job in the coming months? Are you? Very confident Fairly confident Not very confident Not at all confident Don't know Total 'Confident' Total 'Not confident' EU27 43% 39% 11% 4% 3% 82% 15% SE 87% 8% 2% 2% 1% 95% 4% 71% 21% 5% 2% 1% 92% 7% DE 64% 27% 6% 1% 2% 91% 7% FI 62% 29% 4% 2% 3% 91% 6% BE 55% 35% 7% 2% 1% 90% 9% LU 67% 23% 6% 2% 2% 90% 8% MT 63% 27% 4% 5% 1% 90% 9% SI 44% 46% 6% 2% 2% 90% 8% UK 52% 38% 7% 2% 1% 90% 9% CZ 28% 60% 8% 2% 2% 88% 10% AT 37% 51% 9% 1% 2% 88% 10% NL 70% 17% 5% 6% 2% 87% 11% LV 53% 33% 10% 3% 1% 86% 13% FR 45% 40% 7% 5% 3% 85% 12% IE 40% 44% 11% 3% 2% 84% 14% EE 46% 37% 12% 3% 2% 83% 15% RO 39% 44% 10% 2% 5% 83% 12% PT 20% 61% 13% 3% 3% 81% 16% IT 25% 55% 14% 4% 2% 80% 18% LT 40% 36% 19% 4% 1% 76% 23% PL 33% 43% 12% 6% 6% 76% 18% CY 49% 26% 14% 10% 1% 75% 24% BG 22% 46% 20% 7% 5% 68% 27% HU 17% 49% 22% 11% 1% 66% 33% ES 27% 34% 22% 11% 6% 61% 33% SK 11% 45% 34% 8% 2% 56% 42% EL 14% 30% 34% 20% 2% 44% 54% Base: those currently working =49% of the total sample 71
73 Base: those currently working =49%of the total sample 72
74 Socio-demographic analysis demonstrates that confidence about retaining employment is widespread in all categories. Some differences do exist, however: Older respondents are more likely to be very confident about keeping their jobs. While 48% of people in the 55-and-over group are very confident, only 42-43% of individuals in the three younger age groups say the same thing. Respondents who remained in education for longer are the most likely to feel confident about their ability to hold on to their jobs. While 86% of people who completed their education aged 20 or over express confidence, this figure falls to 82% of those who left school aged and 73% of those who left aged 15 or under. Managers are more confident of keeping their jobs than those in other occupations: 90% say they are confident, compared with 79% of manual workers and 81% of self-employed people. Respondents who have difficulty paying their bills most of the time have the least confidence that they will manage to keep their jobs. Only 62% of people in this group say they are confident, compared with 76% of those who have difficulty paying their bills from time to time, and 88% of those who almost never have difficulty. Very confident Fairly confident Not very confident Not at all confident Total 'Confident' Total 'Not confident' EU27 43% 39% 11% 4% 3% 82% 15% Sex Male 44% 39% 10% 4% 3% 83% 14% Female 43% 39% 11% 5% 2% 82% 16% Age % 35% 15% 5% 3% 77% 20% % 40% 11% 4% 2% 83% 15% % 41% 10% 5% 2% 83% 15% % 32% 10% 5% 5% 80% 15% Education (End of) 15-35% 38% 15% 7% 5% 73% 22% % 42% 11% 5% 2% 82% 16% % 35% 9% 3% 2% 86% 12% Still studying Respondent occupation scale Self-employed 43% 38% 11% 4% 4% 81% 15% Managers 58% 32% 7% 2% 1% 90% 9% Other white collars 38% 44% 11% 4% 3% 82% 15% Manual workers 40% 39% 12% 6% 3% 79% 18% House persons Unemployed Retired Students Difficulties paying bills QA7 How confident would you say you are in your ability to keep your job in the coming months? Are you? Most of the time 25% 37% 21% 13% 4% 62% 34% From time to time 31% 45% 15% 6% 3% 76% 21% Almost never 52% 36% 7% 3% 2% 88% 10% Base: those currently working =49% of the total sample 73
 say spontaneously that they do not plan to be in work or looking for a job two years from now 31.")
75 4.2 Confidence in having a job in two years time - Two-thirds of those who would like to have a job in two years time are confident that they will have one - When asked whether they were confident of having a job in two years time, over a third of respondents (34%) say spontaneously that they do not plan to be in work or looking for a job two years from now % are confident that they will have a job in two years (stable since 2009). However, 20% are not confident (+2 points). If, as seems prudent, we exclude the respondents who say spontaneously that they will not be in work or looking for a job in two years, we find that two-thirds (65%, -1 compared with 2009) of this sub-base are confident that they will have a job (27% are very confident, and 38% fairly confident ). Almost a third of respondents (30%, +2) say they are not confident that they will have a job (19% are not very confident, and 11% not at all confident ). These results are very much in line with those of the 2009 survey, when 66% of people who hoped to be in work two years later expressed confidence that they would be. Base: respondents who did NOT answer spontaneously that they will not be looking for a job in two years time =66% of the total sample 31 QA8: Would you say that you are very confident, fairly confident, not very confident or not at all confident in having a job in 2 years time? Very confident; fairly confident; not very confident; not at all confident; don t know. 74
, Sweden (87%, 54% very confident), Luxembourg (85%, 50% very confident), Germany (80%, 43% very confident)")
.")
76 The data for respondents who expect to be in the job market two years from now show that in 19 Member States a majority of these people are confident that they will have a job. In five countries over 80% of people express confidence: Finland (92%, 49% very confident), Sweden (87%, 54% very confident), Luxembourg (85%, 50% very confident), Germany (80%, 43% very confident) and the UK (80%, 37% very confident). Greece has by far the lowest confidence levels, with just 24% of people who hope to have a job in two years confident that they will have one (and only 7% saying they are very confident). After Greece, confidence is lowest in Slovakia (38%, 8% very confident), Bulgaria (43%, 9% very confident) and Spain (43%, 13% very confident). Base: respondents who did NOT answer spontaneously that they will not be looking for a job in two years time =66% of the total sample 75
77 An analysis of the confidence trends over the last Eurobarometer survey, conducted two years ago 32, shows that 17 Member States register increases in confidence. The biggest rises were in Sweden (87% express confidence, up from 76% in 2009) and Latvia (57%, up from 46%); Lithuania also saw a significant rise (47%, up from 39%). However, confidence fell in nine countries, and in some cases the falls were quite dramatic. In Greece, only 24% of respondents are now confident, compared with 47% in 2009; there are also big drops in Spain (43%, down from 62%), Cyprus (54%, down from 67%) and Romania (45%, down from 56%). These variations in level accurately reflect the economic difficulties met by these countries. Base: respondents who did NOT answer spontaneously that they will not be looking for a job in two years time =66% of the total sample 32 These results exclude respondents who say spontaneously they will not be looking for a job in two years time. 76
78 The socio-demographic data show that: Among those who expect to be in the job market in two years time, men are more likely to express confidence that they will have a job than women, by a margin of 68% to 61%. Unsurprisingly, people aged 55 and over are the least confident that they will have a job: only 53% say they are confident, compared with 64-69% of people in the three younger age groups. A higher level of education brings with it heightened confidence in having a job in the future. While 75% of people who finished their education aged 20 or over say they are confident they will have a job in two years, this figure drops to 64% of those who left school aged and 45% of those who left aged 15 or under. The respondent s occupation greatly influences confidence. While 88% of managers and 74% of self-employed people are confident they will have a job in two years, only 35% of house persons say that they are confident. The ability to make ends meet is also a crucial discriminant. While close to threequarters of respondents who almost never have difficulty paying bills say they are confident that they will have a job, only just above four in ten of those who have this kind of financial difficulty most of the time express confidence. The more precarious people are, the more worried they appear to be about their future in the job market. 77
79 QA8 Would you say that you are very confident, fairly confident, not very confident or not at all confident in having a job in 2 years time? Very confident Fairly confident Not very confident Not at all confident Total 'Confident' Total 'Not confident' EU27 27% 38% 19% 11% 5% 65% 30% Sex Male 29% 39% 18% 9% 5% 68% 27% Female 24% 37% 21% 13% 5% 61% 34% Age % 39% 22% 10% 4% 64% 32% % 41% 19% 9% 3% 69% 28% % 39% 18% 12% 4% 66% 30% % 30% 18% 17% 12% 53% 35% Education (End of) 15-17% 28% 25% 21% 9% 45% 46% % 39% 20% 11% 5% 64% 31% % 40% 14% 7% 4% 75% 21% Still studying 18% 42% 26% 10% 4% 60% 36% Respondent occupation scale Self-employed 34% 40% 14% 8% 4% 74% 22% Managers 46% 42% 8% 3% 1% 88% 11% Other white collars 28% 43% 19% 7% 3% 71% 26% Manual workers 30% 42% 17% 7% 4% 72% 24% House persons 13% 22% 29% 27% 9% 35% 56% Unemployed 12% 28% 28% 28% 4% 40% 56% Retired 8% 24% 22% 22% 24% 32% 44% Students 18% 42% 26% 10% 4% 60% 36% Difficulties paying bills Most of the time 14% 27% 28% 25% 6% 41% 53% From time to time 18% 40% 24% 14% 4% 58% 38% Almost never 34% 39% 15% 7% 5% 73% 22% Base: respondents who did NOT answer spontaneously that they will not be looking for a job in two years time =66% of the total sample 78

80 5. CONSEQUENCES OF JOB LOSS 5.1 Confidence in finding new employment - A third of respondents think they would be unlikely to find another job within six months if they were laid off - Those who are currently working are fairly optimistic that they would be able to find another job within six months if they were to be laid off 33. For 41% of respondents the prospect of finding work in this timeframe is very likely 34, with 22% saying it is neither likely nor unlikely. However, one third of respondents (32%) say they think it is unlikely that they would find another job relatively quickly, reflecting the fact that a sizeable minority of Europeans continue to find the search for work a significant challenge. Overall, respondents have grown marginally more optimistic on this question since 2009, when 39% saw re-employment as very likely (2% lower than now), and 21% thought it neither likely nor unlikely (1% lower). Respondents who work outside the euro-zone are somewhat more optimistic than their counterparts inside it. In the non-euro countries, 47% of respondents say reemployment is very likely and 23% say it is neither likely nor unlikely, compared with 39% in the euro-zone who regard it as very likely and 22% who think it neither likely nor unlikely. On a one-to-ten scale, non-euro countries average 6.1, compared with 5.5 for the euro-zone. Base: those currently working =49% of the total sample Analysis of the national data shows that there is a very high level of confidence in some Member States, with a majority of working respondents in nine countries saying that they think it highly likely that they would be able to find another job within six months if they were to be laid off. 33 QA9: If you were to be laid off, how would you rate on a scale of 1 to 10, the likelihood of you finding a job in the next six months? '1' means that it "would be not at all likely" and '10' means that it "would be very likely". 34 Very likely combines answers 7 to 10, likely 5 and 6, and unlikely 1 to 4. 79


, three countries severely hit by the debt crisis.")
, Cyprus (52%)")
81 Confidence on this point is highest in Sweden, where 72% of people regard reemployment within six months as very likely, followed by the Netherlands (64%), Austria (63%) and Finland (62%). But at the other end of the scale the belief that reemployment is very likely within six months is relatively low in Greece (17%), Spain (18%) and Italy (21%), three countries severely hit by the debt crisis. In three Member States, confidence is so low that a majority say they would be very unlikely to find a new job within six months: Greece (53%), Cyprus (52%) and Spain (52%). Base: those currently working =49% of the total sample 80
82 Trend analysis reveals that in 16 Member States more people think they would be very likely to get a new job within six months than did so in The largest rises in confidence are in Austria (63%, +18 points), Lithuania (40%, +16 points) and Latvia (52%, +15 points). In other countries, however, confidence has declined sharply, notably Greece (17%, -20 points), Cyprus (24%, -15 points) and Denmark (59%, -12 points). In 2009, Denmark had the highest proportion of respondents saying that re-employment was very likely, and it remains fifth despite the overall dip in confidence. QA9 If you were to be laid-off, how would you rate on a scale of 1 to 10, the likelihood of you finding a job in the next six months? '1' means that it "would be not at all likely" and '10' means that it "would be very likely". Total 'Very likely' (7-10) - (Sept-Oct May-June 2009) Total 'Neither likely nor unlikely' (5-6) - (Sept-Oct May-June 2009) Total 'Not likely' (1-4) - (Sept-Oct May-June 2009) Don't know - (Sept-Oct May-June 2009) EU27 41% +2 22% +1 32% -1 4% -3 AT 63% % -3 15% -11 1% -4 LT 40% % -2 32% -12 4% -1 LV 52% % -3 21% -11 4% -1 BE 53% +4 22% +1 23% -3 2% -1 DE 54% % -1 24% -10 5% = LU 45% % -2 28% -8 4% = SE 72% +9 12% -2 13% -7 3% = FR 42% +9 21% -3 34% -3 3% -3 PT 24% +8 31% +2 38% -3 7% -7 EE 49% +7 26% +1 22% -7 3% -2 IE 31% +5 21% +1 42% = 6% -6 SK 42% +5 30% +6 24% -5 4% -6 CZ 52% +4 24% = 23% -1 1% -3 MT 48% +3 16% -8 28% +4 8% +1 FI 62% +3 14% = 18% -6 6% +4 HU 30% +1 26% +6 42% -5 3% = NL 64% -1 10% -3 24% +6 2% -1 IT 21% -1 27% +6 46% = 6% -5 NL 64% -1 10% -3 24% +6 2% -1 BG 30% -2 28% +4 38% = 4% -3 PL 44% -3 21% +1 27% +3 8% -1 RO 44% -3 23% +6 25% +1 8% -4 SI 43% -4 24% +7 30% -3 4% +1 ES 18% -7 26% -6 52% +12 4% +1 59% % +8 19% +3 2% +1 CY 24% % -3 52% +21 2% -4 EL 17% % +3 53% +17 4% = UK 47% = 24% +5 26% = 2% -6 Base: those currently working =49% of the total sample 81
83 According to the socio-demographic data: Men are more likely to say that they would be very likely to find a new job within six months: 44% say this, compared with 39% of women. Younger respondents are more confident in their ability to find a new job relatively quickly. While 47-48% of year-olds and year-olds say they would be very likely to get another job, this falls to 40% of year-olds and 23% of those aged 55 and over. Respondents with a higher level of education are more likely to regard reemployment as very likely: 48% of those who finished their education aged 20 or over think this, compared with only 39% of those who left school aged and 27% of those who left aged 15 or under. While 51% of managers say they would be very likely to find another job, this falls to 38-39% of other white collar and manual workers. Respondents who almost never have difficulty paying their bills are the most likely to believe that they would be able to find another job relatively quickly: 47% say this, compared with 33% of those who have difficulty from time to time and just 23% of those who have difficulty most of the time. 82
84 QA9 If you were to be laid-off, how would you rate on a scale of 1 to 10, the likelihood of you finding a job in the next six months? '1' means that it "would be not at all likely" and '10' means that it "would be very likely". Total 'Very likely' Total 'Neither likely nor unlikely' Total 'Not likely' EU27 41% 22% 32% 4% Sex Male 44% 21% 30% 5% Female 39% 23% 34% 4% Age % 23% 27% 2% % 24% 25% 3% % 22% 33% 4% % 17% 52% 9% Education (End of) 15-27% 21% 47% 5% % 24% 33% 4% % 20% 28% 5% Still studying Respondent occupation scale Self-employed 39% 18% 32% 11% Managers 51% 19% 26% 5% Other white collars 38% 25% 33% 3% Manual workers 39% 23% 34% 3% House persons Unemployed Retired Students Difficulties paying bills Most of the time 23% 21% 51% 5% From time to time 33% 26% 37% 4% Almost never 47% 21% 28% 4% Base: those currently working =49% of the total sample 83
 of European respondents who are currently working think that their country s unemployment and insurance system would compensate them to the")
: 16% think that they would receive 30% or less of their current salary, and a")
85 5.2 Expectations regarding the level of unemployment insurance - A third of people think they would receive 51 to 70% of their current income if they lost their jobs, though many respondents do not know how much they would receive - Around a third (30%) of European respondents who are currently working think that their country s unemployment and insurance system would compensate them to the tune of 51 to 70% of their income if they were to be laid off % think they would receive 71 to 90% of their income, and just 4% that they would receive 91 to 100% of their income. Overall, less than a third think that they would receive less than 50% of their income, should they be laid off (28%): 16% think that they would receive 30% or less of their current salary, and a further 12% reckon they would receive 31 to 50% of their current income. One respondent in five (20%) say they do not know how much they would receive in compensation, making don t know cumulatively the second most common answer. These results are very similar to those obtained by the 2009 survey, although there has been a slight increase in the number of people who think they would receive 51 to 70% of their income (up by 2%) and 71 to 90% of their income (also up by 2%). Base: those currently working =49% of the total sample 35 QA14: If you were to be laid-off, how much do you think the unemployment insurance and the welfare system in (OUR COUNTRY) will compensate you for the loss of income during the first six months as a percentage of your current income? 91 to 100% of your current income; 71 to 90% of your current income; 51 to 70% of your current income; 31 to 50% of your current income; 30% or less of your current income; don t know. 84
86 Respondents in the euro-zone tend to have higher expectations of how much compensation they would receive than people in non-euro countries. In the euro-zone, 22% of respondents think they would receive 71 to 90% of their income, while 36% say they would get 51 to 70%; but outside it only 9% say they would expect to get 71 to 90% of their income, and 18% say they would received 51 to 70%. More respondents outside the euro-zone say they would get 31 to 50% of their income, by a margin of 18% to 9%, and also that they would get 30% or less (30%, as opposed to 9% in the eurozone). Overall, 63% of respondents in the euro-zone think they stand to receive more than 50% of their current income, as opposed to just 31% of their noneuro area counterparts. Nationally, there is a considerable degree of variation in people s expectations of how much compensation they would receive if they were to be laid off. In five Member States respondents most commonly expect 30% of their income or less: the UK (47%), Greece (41%), Ireland (31%), Poland (30%) and Romania (28%). In only one Member State, Hungary (33%), is 31 to 50% the most popular answer, but 51 to 70% is the most common response in 15 Member States, with majorities expecting this level of compensation in Germany (60%) and Finland (55%). In six countries, 71 to 90% is the most common answer: Luxembourg (57%), Sweden (44%), Spain (35%), Belgium and France (both 32%), and Latvia (30%). 91 to 100% is not the most common response in any Member State, although relatively high numbers of people give this answer in Belgium (13%), Spain (9%) and the Netherlands (9%). Don t know is the most common response in four Member States: Malta (51%), Lithuania (33%), Estonia (30%) and Bulgaria (28%). Trend analysis of individual Member State shows that a number of countries have experienced a general shift in expectations over the past two years. In some countries expectations have risen: Bulgaria: more people say they expect to get 51-70% of their income (24%, +10 points) and fewer expect to get 30% or less (12%, -10 points). Finland: more respondents say they expect to receive 51-70% of their income (55%, +7 points), while fewer say they expect to get 31-50% (12%, -8 points). The UK: a sizeable fall in the number of respondents saying they would get 30% or less (47%, -9 points), with rises in the 31-50% group (16%, +4 points) and also the 51-70% group (9%, +3 points). 85
87 Elsewhere, we find a drop in expectations in: Hungary: more people think they would get 30% or less (20%, +11 points), with a corresponding drop in the number saying they would get 51-70% of their income (27%, -13 points). Lithuania: significantly lowered expectations, with more people now saying they would get either 30% or less (20%, +12 points) or 31-50% (17%, +8 points). Malta: more people think they would get 30% or less (33%, +8 points), while fewer think they would receive 31 to 50% of their income (10%, -6 points). In other countries, a substantial fall in the number of people answering don t know accounts for rises in other categories: Cyprus: an increase in the number of people who think they will get 31-50% of their income (13%, +7 points), with a corresponding decrease in the Don t Know () rate (30%, -8 points). Latvia: more people say they would get 71-90% (30%, +13 points) and also 51-70% (26%, +7 points); falls in the number saying they would get % (8%, -7 points) and in the rate (22%, -14 points). Slovakia: more people say they would get 51-70% (47%, +9 points) and also 31-50% (27%, +6 points); falls in the rate (10%, -13 points). Portugal: a rise in the number of people expecting 71-90% (19%, +7 points) and also 51-70% (34%, +10 points), accounted for by a large drop in the rate. Romania: a significant increase in the proportion of people saying they would get 30% or less (28%, +9 points), and 51-70% (17%, +7 points), with a large fall in the rate. 86
88 QA14 If you were to be laid-off, how much do you think the unemployment insurance and the welfare system in (OUR COUNTRY) will compensate you for the loss of income during the first six months as a percentage of your current income? 30% or less of your current income - (Sept-Oct May- June 2009) 31 to 50% of your current income - (Sept-Oct May- June 2009) 51 to 70% of your current income - (Sept-Oct May- June 2009) 71 to 90% of your current income - (Sept-Oct May- June 2009) 91 to 100% of your current income - (Sept-Oct May- June 2009) Don't know EU27 16% -1 12% +1 30% +2 18% +2 4% = 20% -4 BE 7% +1 7% = 32% +1 32% -1 13% +4 9% -5 BG 12% % -3 24% % +8 6% +3 28% -8 CZ 6% +3 28% +2 43% -2 12% +5 5% = 6% -8 11% -2 20% +1 31% -1 24% = 8% +3 6% -1 DE 5% -1 5% -1 60% +2 15% +4 2% -1 13% -3 EE 10% = 16% -2 27% +7 13% +4 4% -4 30% -5 IE 31% = 24% +4 14% +3 2% = 1% = 28% -7 EL 41% +1 25% -1 11% -2 1% = 1% = 21% +2 ES 5% -1 4% -2 18% -2 35% +2 9% -2 29% +5 FR 6% +2 5% +1 32% +2 32% -2 6% -1 19% -2 IT 16% +2 16% = 25% +4 15% +5 4% +2 24% -13 CY 5% +2 13% +7 42% +1 9% +2 1% -4 30% -8 LV 7% = 7% +1 26% +7 30% +13 8% -7 22% -14 LT 20% % +8 17% +1 8% -8 5% -2 33% -11 LU 4% +1 4% = 13% +2 57% -7 8% +5 14% -1 HU 20% % +7 27% -13 7% -1 3% +2 10% -6 MT 33% +8 10% -6 6% -1 0% -1 0% = 51% = NL 6% = 1% -1 33% +7 28% -7 9% +1 23% = AT 3% +1 10% +3 47% -3 29% +2 2% -1 9% -2 PL 30% -2 18% +3 14% +3 6% -1 5% +1 27% -4 PT 6% +2 10% -4 34% % +7 2% +1 29% -16 RO 28% +9 18% +2 17% +7 7% +1 5% -7 25% -12 SI 4% +2 11% +2 33% +1 26% -4 1% = 25% -1 SK 6% +1 27% +6 47% +9 9% -3 1% = 10% -13 FI 6% -1 12% -8 55% +7 20% +3 1% +1 6% -2 SE 8% -3 10% +2 30% +1 44% +3 2% = 6% -3 UK 47% -9 16% +4 9% +3 2% = 2% = 24% +2 Base: those currently working =49% of the total sample - (Sept-Oct May- June 2009) 87
89 The socio-demographic data show that: While 19% of year-olds and 18% of year-olds think they would receive 71 to 90% of their current income, this falls to 14% of year-olds and 15% in the 55+ group. People in the last two groups are more likely to say they don t know how much they would get. Respondents who finished their education aged 20 or over are more likely to expect to receive 71 to 90% of their income: 21% do so, compared with 16% of those who left school at 19 or under. Respondents who left school earlier are the most likely to expect to receive 51 to 70%. While 20% of managers and 19% of other white collar workers and manual workers expect to receive 71 to 90% of their income in compensation, only 10% of self-employed people say this. Self-employed people are also the least likely to say they expect to get 31 to 50% of their income, and that is probably because they often have a different relationship with insurance and welfare benefits. Instead, they are the most inclined to expect 30% or less (26% of self-employed workers say this) or to say that they don t know what to expect (30%). 88


90 6. JOB SEEKING 6.1 Job seeking strategies - Half of Europeans would prefer to do the same kind of job in the same location, should they be laid off - Respondents who are currently in work were asked how they would go about finding another job, should they be laid off 36, and in particular whether they would try looking for a different type of job or look in a different location, or try to set up their own business instead. Almost half (48%) of all the respondents who are currently in work say they would apply for the same kind of job in the same location but for another employer, while just over a third (35%) say they would apply for the same kind of job but in a different location. 21% of respondents would apply for a completely different kind of job in the same location, while 12% would start their own business without employees and 11% would apply for a completely different kind of job in another location. Just 3% would attempt to start their own business with employees. While a similar question was asked in the 2009 survey, trend analysis is not possible here because previously respondents were only asked whether they would react to redundancy by starting their own business, without making any distinction between starting a business with or without employees. Base: those currently working =49% of the total sample 36 QA10: If you were to be laid-off, how would you find a job? (MAX. 2 ANSWERS). By applying for the same kind of job, in the same location, but for another employer; by applying for the same kind of job but in a different location; by applying for a completely different kind of job in the same location; by applying for a completely different kind of job in another location; by starting your own business without employees; by starting your own business with employees; other; don t know. 89
91 Comparison of the EU15 and NMS12 data shows that EU15 respondents are more likely to say they would apply for the same kind of job but in a different location, by a margin of 38% to 24%. NMS12 respondents (11%) are more likely to say they don t know how they would find a job than EU15 respondents (6%). Applying for the same kind of job in the same location but for a different employer is the most popular course of action in all but two Member States. At least half of respondents currently in work say they would take this option in 13 countries, led by Denmark (68%), Cyprus (65%) and Sweden (63%). But in Slovenia, only 24% would adopt this approach to finding another job, as would 38% in Spain. Slovenia and the Netherlands are the two countries where applying for the same kind of job but in a different location is the most common choice: 48% and 49% of respondents respectively say they would do this, as would at least a third of respondents in 16 Member States. Both these countries are relatively small in terms of surface area. However, in some countries, such as Romania (18%), Poland and Bulgaria, (both 20%) this is not an especially popular alternative. Applying for a completely different kind of job in the same location was mentioned by at least 25% of respondents in nine EU countries, with 35% in Bulgaria and 33% in Sweden saying that they would choose this course of action. But just 13% of respondents in Ireland and 14% in Luxembourg cited this approach. In 18 Member States at least 10% of respondents say that they would start their own business without employees, with 19% in the Netherlands and 18% in Greece saying that they would do this. Just 5% of people in Hungary and 6% in Portugal think that starting their own business without employees would be their response to losing their job. While very few respondents overall think that they would start their own business with employees in the event of being laid off, at least 5% of people say they would do this in four Member States: Latvia (6%), Finland (6%), Estonia (5%) and Lithuania (5%). In 19 EU countries at least 10% of respondents say that they would apply for a completely different kind of job in another location. In Slovenia 18% of respondents say they would try this approach, as do 17% in Lithuania, 16% in Spain, Luxembourg and Estonia; but only 4% in Bulgaria and 6% in Romania mention this. 90
92 QA10 If you were to be laid-off, how would you find a job? By applying for the same kind of job, in the same location, but for another employer By applying for the same kind of job but in a different location By applying for a completely different kind of job in the same location By starting your own business without employees By applying for a completely different kind of job in another location By starting your own business with employees Other (SPONTA NEOUS) Don't know EU27 48% 35% 21% 12% 11% 3% 4% 7% BE 61% 29% 25% 11% 12% 1% 2% 2% BG 54% 20% 35% 10% 4% 3% 2% 7% CZ 54% 29% 28% 11% 7% 1% 3% 3% 68% 46% 32% 9% 14% 3% 3% 2% DE 57% 47% 22% 8% 10% 2% 3% 6% EE 44% 36% 28% 12% 16% 5% 4% 4% IE 54% 35% 13% 8% 8% 4% 6% 8% EL 45% 26% 20% 18% 10% 3% 4% 10% ES 38% 37% 19% 11% 16% 2% 5% 5% FR 44% 40% 20% 16% 14% 3% 2% 5% IT 39% 26% 16% 16% 11% 3% 5% 9% CY 65% 35% 29% 12% 9% 2% 8% 3% LV 47% 23% 28% 8% 10% 6% 2% 7% LT 39% 27% 19% 7% 17% 5% 7% 6% LU 42% 37% 14% 11% 16% 4% 10% 3% HU 45% 31% 18% 5% 10% 1% 4% 6% MT 43% 34% 16% 9% 12% 2% 3% 11% NL 40% 49% 16% 19% 14% 2% 7% 2% AT 53% 47% 18% 9% 12% 3% 3% 4% PL 43% 20% 21% 12% 11% 4% 1% 15% PT 50% 35% 19% 6% 10% 2% 3% 14% RO 53% 18% 19% 10% 6% 3% 3% 15% SI 24% 48% 15% 12% 18% 4% 9% 3% SK 50% 32% 30% 10% 8% 2% 2% 5% FI 47% 36% 21% 12% 8% 6% 9% 4% SE 63% 42% 33% 17% 8% 2% 3% 2% UK 57% 38% 24% 12% 10% 2% 3% 5% Highest percentage per country Highest percentage per item Lowest percentage per country Lowest percentage per item Base: those currently working =49% of the total sample 91
93 According to the socio-demographic data for respondents who are currently in work: Female respondents are more likely to opt to apply for the same kind of job in the same location but for another employer (51%, compared with 46% for men), or to apply for a completely different kind of job in the same location (23%, compared with 19% for men). They seem more attached to their location than male respondents, maybe for family reasons (child facilities, etc.). However, male respondents are more likely to apply for the same kind of job but in a different location (37%, compared with 33% for women) or to start their own business without employees (14%, compared with 10% for women). Younger respondents are more likely to apply for the same kind of job, in the same location, but for another employer: while 54% of people in the category and 52% of those in the category say they would do this, only 47% of people in the group and 41% of those in the 55+ age bracket say they would take this approach. Younger respondents are also more likely to apply for the same kind of job but in a different location: 42% of people in the category would do this, compared with 36-37% of those in the and bands, and 25% of those in the 55+ group. While 57% of respondents who live in large towns think they would respond to redundancy by applying for the same kind of job in the same location but for another employer, this falls to 48% of individuals who live in small towns and 42% who live in rural villages. By contrast people who live in rural villages are the most likely to say they would apply for the same kind of job but in a different location, and also that they would apply for a completely different kind of job in another location. QA10 If you were to be laid-off, how would you find a job? (MAX. 2 ANSWERS) By applying for the same kind of job, in the same location, but for another employer By applying for the same kind of job but in a different location By applying for a completely different kind of job in the same location By starting your own business without employees By applying for a completely different kind of job in another location By starting your own business with employees Other (SPONTANEOUS) EU27 48% 35% 21% 12% 11% 3% 4% 7% Sex Male 46% 37% 19% 14% 12% 3% 4% 7% Female 51% 33% 23% 10% 10% 2% 4% 6% Age % 42% 23% 9% 11% 2% 2% 5% % 37% 21% 12% 12% 2% 2% 5% % 36% 22% 14% 11% 3% 4% 7% % 25% 17% 12% 9% 4% 9% 13% Subjective urbanisation Rural village 42% 38% 19% 14% 14% 2% 4% 8% Small/ Mid-size town 48% 36% 22% 11% 11% 3% 4% 6% Large town 57% 31% 22% 12% 7% 3% 3% 6% Base: those currently working =49% of the total sample 92
, just 12% of respondents said they would start their own business without employees, while only 3% said they would start their own business with")
94 6.2 Perceived obstacles to starting a business - One in four would start their own business, while three-quarters of respondents who are interested in starting a business think they know how to go about setting it up - In the previous question (QA10), just 12% of respondents said they would start their own business without employees, while only 3% said they would start their own business with employees. However, that question only asked respondents to mention two things that they might do if they were made redundant. Now, we ask respondents who did not mention starting their own business as one of their options in QA10 whether they would start a business if they were to lose their job 37, with the result that 8% said that they definitely would and 16% said that they probably would making for close to a quarter (24%) overall who say they would start their own business. However, 25% of respondents say they would probably not start a business, and 45% that they would definitely not do this a 70% negative response. Base: those currently working, and for whom starting their own business would not be a priority if they were laid off =42% of the total sample 37 QA11: Would you consider starting your own business if you were to lose your job? Yes, definitely; yes, probably; no, probably not; no, definitely not. 93
95 Respondents outside the euro-zone appear to be somewhat more inclined to start a business than those inside it: while 72% of euro-zone respondents say they would not start a business if they lost their jobs, this falls to 66% of respondents in non-euro countries. In nine Member States at least a quarter of respondents say they would start a business if they lost their job. In the UK 32% of people say they would start a business (13% definitely would), as would 31% in Latvia (9% definitely) and 30% in Italy (11% definitely). But at the other end of the scale, only 10% of people in Malta say they would start their own business (just 2% definitely would), followed by 11% in Bulgaria (2% definite) and 12% in Ireland (5% definite). In the case of Ireland it is worth noting that a very large proportion of respondents (41%) say they don t know whether they would start a business in the event of redundancy. The socio-demographic data show that: Men are more likely to say that they would start a business than women, by a margin of 29% to 20%. Respondents in the age group are the most likely to try starting a business: 27% say they would do this, compared with 24% of year-olds, 23% of year-olds and 18% of those in the 55+ category. Respondents who continued their studies after the age of 19 are more likely to start their own business (29%), compared with 22% who left aged or 18% who left aged 15 or under. While a majority of self-employed respondents (54%) say they would start another business, only 24% of managers, 22% of other white collar workers and 18% of manual workers say this. Respondents who are single but living with a partner are the most likely to try starting a business: 27% say they would do so, compared with 25% of married respondents, 23% of single people, 21% of divorced or separated respondents, and 19% of widowed respondents. 94

96 - Administrative procedures are not an obstacle for those who would start their own business - The following question combines respondents who said they would start a business in QA10 with those who said they would start a business in QA11, and asks them whether they would know how to start a new business in terms of administrative procedures 38. Three-quarters (74%) of these respondents say they would know how to go about starting a new business in terms of administrative procedures, with 38% saying that they would definitely know what to do and 36% saying they would probably know what to do. Just 24% say they would not know how to start a new business in terms of administrative procedures, with 15% saying no, probably not and 9% saying no, definitely not. This result suggests that some respondents have already started to seek information about starting a business, or that they already know the procedures, maybe because they have started their own business before. *Don t know 2% Base: those currently working who would start their own business if they were laid off =17% of the total sample Warning: Due to the small base (17% of the whole sample), the country-by-country and socio-demographic analyses should be interpreted with caution: in some countries and in some socio-demgraphic categories, the bases are very small. Therefore, we will describe trends, instead of giving figures. 38 QA12: Would you know how to start a new business in terms of administrative procedures? Yes, definitely; yes, probably; no, probably not; no, definitely not; don t know. 95
97 In 16 Member States at least three-quarters of respondents say they would know how to start a business. The countries where people are the most confident of their knowledge of the administrative procedures involved in starting a business are the Czech Republic, Slovakia, and Greece. But elsewhere in the EU people are less confident that they would know what do to, notably in Ireland and France. The socio-demographic analysis reveals that respondents who would know how to start a business are more likely to be: Men. Aged 25 or more, and especially people in the 55+ age category. Self-employed people, who probably already know the procedures. Respondents who almost never have difficulty paying their bills. - A majority of respondents think that individuals in five out of the six specific categories would find it more difficult to start their own business - All respondents were asked whether they thought it was more difficult for certain types of people to start their own business 39. Almost three-quarters (73%) of respondents think that it is more difficult for a disabled person to start his or her own business, with 34% totally agreeing that it is more difficult and 39% tending to agree. Just 23% disagree that it is more difficult: 17% tend to disagree and 6% totally disagree. Two-thirds of respondents (65%) say that it is more difficult for a young person leaving full-time education to start his or her own business, with 25% totally agreeing and 40% tending to agree. 32% disagree that it is more difficult: 23% tend to disagree and 9% totally disagree. Just under two-thirds of respondents (64%) say that it is more difficult for a person over 50 years old to start his or her own business, with 27% totally agreeing and 37% tending to agree. One third (33%) disagree that it is more difficult: 25% tend to disagree and 8% totally disagree. Over half of all respondents (54%) think that it is more difficult for a person from an ethnic minority to start his or her own business: 18% totally agree and 36% tend to agree. But 39% of people disagree, with 28% tending to disagree and 11% totally disagreeing. 39 QA13.1: Please tell me to what extent do you agree or disagree that it is more difficult for the following types of people than for others to start their own business. A young person leaving full time education; a person over 50 years old; a woman; a disabled person; a person from a different country living in (OUR COUNTRY); a person from an ethnic minority. 96


98 A majority of respondents (52%) also believe that it is more difficult for a person from a different country living in their country to start his or her own business, with 16% totally agreeing and 36% tending to agree. 42% disagree that it is more difficult, with 30% tending to disagree and 12% totally disagreeing. Fewer than half of all respondents (41%) think that it is more difficult for a woman to start her own business, with 12% totally agreeing and 29% tending to agree. 55% disagree that women find this more difficult: 36% tend to disagree and 19% totally disagree. Overall, large proportions of Europeans (majorities in most cases) agree that starting one s own business is more difficult for some categories. In all Member States, a majority of respondents think that starting a business is more difficult for a person with a disability than for the other groups under discussion, and in 17 countries the figure is at least 75%. 84% of people in both Latvia and Slovakia say this; but at the other end of the scale, only 59% of respondents in Romania and 63% in Sweden feel that people with a disability experience more difficulty when starting a business. In Ireland (79%), Malta (75%), the UK (73%) and Romania (65%) respondents feel that a young person leaving full-time education has more difficulty starting a business than the other groups. In Spain, the same proportion of respondents (73%) think that a young person leaving full-time education, a person over 50 years old, and a disabled person experience more difficulty starting a business than others. However, under half of all respondents in Poland (48%) and Finland (48%) reckon that a young person leaving full-time education has more difficulty starting a business than others. 97
99 A majority of respondents in all but two Member States think that a person over 50 years old experiences more difficulty starting a business than others. This view is especially common in Cyprus, where 76% say that people over 50 years have more difficulty, as well as in Lithuania (74%), Slovakia and Spain (both 73%). However, relatively few people in Sweden (32%) and Finland (37%) share this view. A majority of respondents in all but six Member States say that a person from an ethnic minority is likely to experience more difficulty when starting a business than others. In Greece 69% of respondents take this view, as do 67% in both Belgium and Slovakia. However, in the UK just 32% of people say that a person from an ethnic minority is likely to experience more difficulty when starting a business, as do 43% of those in Romania and 45% in Latvia. In 16 EU countries a majority of respondents think that a person from different country living in their country is likely to experience more difficulty when starting a business than others. Large majorities in Cyprus (65%), France (64%) and Greece (63%) say that this is the case, though this falls to 42% in Latvia, Bulgaria and Luxembourg. QA13 Please tell me to what extent do you agree or disagree that it is more difficult for the following types of people than for others to start their own business. Total 'Agree' A disabled person A young person leaving full time education A person over 50 years old A person from an ethnic minority A person from a different country living in (OUR COUNTRY) A wom an EU27 73% 65% 64% 54% 52% 41% BE 81% 69% 70% 67% 61% 41% BG 70% 68% 61% 54% 42% 55% CZ 81% 64% 59% 60% 45% 34% 77% 62% 51% 48% 53% 25% DE 77% 60% 66% 56% 49% 35% EE 77% 64% 61% 47% 44% 33% IE 74% 79% 67% 59% 56% 48% EL 80% 62% 71% 69% 63% 57% ES 73% 73% 73% 61% 52% 50% FR 78% 69% 66% 63% 64% 42% IT 69% 65% 67% 60% 55% 51% CY 78% 74% 76% 63% 65% 65% LV 84% 64% 71% 45% 42% 40% LT 82% 74% 74% 54% 53% 52% LU 75% 69% 65% 56% 42% 41% HU 82% 64% 72% 65% 48% 54% MT 72% 75% 71% 53% 44% 41% NL 73% 61% 52% 52% 57% 22% AT 80% 67% 67% 60% 52% 43% PL 68% 48% 61% 50% 51% 41% PT 76% 64% 66% 60% 57% 52% RO 59% 65% 57% 43% 45% 51% SI 78% 69% 66% 52% 57% 42% SK 84% 76% 73% 67% 54% 50% FI 78% 48% 37% 63% 56% 22% SE 63% 51% 32% 48% 46% 16% UK 65% 73% 61% 32% 44% 33% Highest percentage per country Highest percentage per item 98 Lowest percentage per country Lowest percentage per item
100 In just 10 Member States, a majority of respondents think that a woman is likely to experience more difficulty than others when starting a business. In Cyprus 65% of respondent think that women have more difficulty in this area than men, as do 57% in Greece and 55% in Bulgaria. However, in Sweden only 16% of respondents think that women have greater difficulty than men in starting a business, as do 22% of people in both Finland and the Netherlands. The socio-demographic data reveal that: Women are marginally more likely than men to say that all six of these groups would find it more difficult to start a business than others. The difference is the widest when it comes to saying whether it is more difficult for a woman to start a business, where 45% of female respondents agree, compared with 38% of men. And 66% of female respondents think that a person over 50 would have more difficulty, compared with 62% of male respondents. Younger respondents are not more likely to say that a young person leaving fulltime education would have more difficulty starting a business: 63% of year-olds agree with this, compared with 67% of people aged 55 and over. However, people aged 55 and over are somewhat more likely to think that a person over the age of 50 would have more difficulty starting their own business: 70% think this, compared with 64% of year-olds, 60% of year-olds and 58% of people in the category. Respondents who spent less time in formal education are much more likely to think that a woman would have more difficulty starting a business: 50% of those who left school at 15 or under say this, compared with 42% of those who left at and 38% who left education at 20 or over. Individuals in this group are also more likely to think that people over 50 years old are more likely to experience difficulty when trying to start a business. House persons and retired respondents (both 70%) are the most likely to think that people over the age of 50 would find it more difficult to start a business. These two groups are also the most likely to say that women would find it more difficult: 53% of house persons and 48% of retired people take this view. 99
101 QA13 Please tell me to what extent do you agree or disagree that it is more difficult for the following types of people than for others to start their own business. - Total 'Agree' A disabled person A young person leaving full time education A person over 50 years old A person from an ethnic minority A person from a different country living in (OUR COUNTRY) A woman EU27 73% 65% 64% 54% 52% 41% Sex Male 71% 64% 62% 53% 52% 38% Female 74% 66% 66% 56% 53% 45% Age % 63% 58% 51% 52% 36% % 64% 60% 53% 53% 39% % 64% 64% 54% 50% 41% % 67% 70% 57% 53% 47% Education (End of) 15-76% 68% 71% 55% 50% 50% % 66% 64% 53% 51% 42% % 64% 60% 56% 55% 38% Still studying 71% 60% 58% 52% 53% 35% Respondent occupation scale Self-employed 69% 61% 58% 54% 53% 37% Managers 68% 65% 56% 55% 53% 32% Other white collars 70% 65% 61% 56% 51% 38% Manual workers 71% 65% 63% 52% 51% 39% House persons 74% 68% 70% 56% 52% 53% Unemployed 73% 66% 67% 54% 52% 44% Retired 78% 67% 70% 57% 53% 48% Students 71% 60% 58% 52% 53% 35% 100

102 6.3 The importance of qualifications and professional experience - For Europeans, professional experience and the level of one s qualifications remain the two assets that should be emphasised in order to find a job - Respondents were asked which two assets should be emphasised in order to find a job easily in today s job market 40. A majority think that both professional experience (54%) and qualification levels (51%) should be emphasised, while over a third of respondents (35%) argue that the ability to adapt ought to be stressed. Just 19% think someone seeking work should emphasise his or her computer skills, while 17% say that language skills should be emphasised. Just 5% think that it is important to emphasise a willingness to work abroad. In all cases these results closely matched those gathered during the 2009 survey, suggesting that no shift in opinion has occurred. Some differences can be observed between the EU15 and NMS12 countries. While 26% of NMS12 respondents emphasise the importance of language skills, only 15% of respondents in the EU15 do so. By contrast, 37% of EU15 respondents say that the ability to adapt is important, whereas only 24% mention this item in the NMS12. In 16 Member States more respondents mention professional experience than any of the other answers. In France 69% of respondents cite this item, as do 66% in Portugal; at the other end of the scale only 37% in Malta and 42% in both Denmark and Ireland think that professional experience is one of the most important things to emphasise. While there has been no change at EU level over the past two years on this point, some individual Member States have experienced a significant shift in opinion. In Slovakia (56%, up from 48%) and Latvia (55%, up from 48%) there have been quite large increases in the numbers of 40 QA6: In your opinion, which two assets should one emphasise in order to easily find a job today? (MAX. 2 ANSWERS). Professional experience; level of one s qualifications; ability to adapt; computer skills; language skills; willingness to work abroad; other (SPONTANEOUS); none (SPONTANEOUS); don t know. 101
103 people who think that professional experience ought to be emphasised, whereas in Malta (37%, down from 46%) there has been a substantial fall. In 10 EU countries more respondents mention the level of applicants qualifications than the other alternatives. In both Malta and the Netherlands 69% of people say this, while just 37% of those in Slovakia and 38% in France do so. Only one country has experienced a large shift in opinion on this question over the last two years: Cyprus, where the number of people saying that qualification levels should be emphasised fell from 70% to 58%. The ability to adapt is the most common answer in one EU country Sweden and is stressed by a majority of respondents in just three Member States: Sweden (60%), France (54%) and Denmark (53%). Elsewhere, such as in Bulgaria (19%) and Poland (20%), relatively few people think that adaptability is something that a job seeker ought to emphasise. However, many countries have seen a slight rise in the number of people attributing importance to the ability to adapt, with the sharpest increases in Sweden (60%, up from 51%), Greece (21%, up from 15%) and Slovenia (36%, up from 30%). In just seven countries more than a quarter of respondents say that computer skills should be emphasised when applying for work. This view is most widely held in Malta (33%) and Cyprus (32%). However in Spain only 7% of respondents think that computer skills should be emphasised, as do 8% in Luxembourg. In Finland, there has been a significant increase in mentions of this item, up from only 11% in 2009 to 21% now. However, the number of respondents mentioning computer skills fell in Greece, from 29% to 23%. In nine Member States at least a quarter of respondents say that language skills should be emphasised when applying for work. This is a commonly held view in Estonia (43%), Poland (34%), Latvia (34%) and Slovakia (33%), though language skills are regarded as less important in Portugal (6%), Ireland (9%) and Romania (9%). Though many countries witnessed slight increases in the number of people who think that language skills ought to be emphasised, the largest change came in Slovakia, where the total fell from 40% to 33%. Ireland (11%) is the only Member State where more than a tenth of respondents think that job applicants ought to demonstrate a willingness to work abroad. The most significant change that has taken place over the last two years on this item comes in Austria, where 5% now think that a willingness to work abroad should be emphasised, down from 10% in
104 QA6 In your opinion, which two assets should one emphasize in order to easily find a job today? Professional experience Level of one s qualifications Ability to adapt Computer skills Language skills Willingness to work abroad Other (SPONTANEOUS) None (SPONTANEOUS) Don't know EU27 54% 51% 35% 19% 17% 5% 2% 1% 1% BE 52% 53% 32% 16% 31% 3% 2% 0% 0% BG 54% 52% 19% 23% 28% 7% 3% 1% 2% CZ 57% 53% 35% 20% 23% 2% 1% 0% 0% 42% 56% 53% 26% 16% 4% 0% 0% 0% DE 45% 65% 35% 27% 15% 4% 1% 1% 0% EE 46% 47% 25% 16% 43% 6% 3% 0% 1% IE 42% 60% 38% 22% 9% 11% 2% 1% 2% EL 56% 49% 21% 23% 20% 8% 7% 1% 0% ES 63% 56% 23% 7% 18% 6% 1% 1% 1% FR 69% 38% 54% 12% 10% 7% 1% 1% 0% IT 48% 43% 32% 25% 19% 9% 2% 2% 1% CY 50% 58% 22% 32% 21% 4% 7% 1% 0% LV 55% 40% 31% 12% 34% 6% 6% 1% 1% LT 62% 57% 23% 13% 18% 3% 2% 2% 2% LU 48% 63% 33% 8% 31% 4% 3% 0% 0% HU 58% 41% 29% 17% 29% 6% 3% 1% 2% MT 37% 69% 21% 33% 10% 5% 1% 1% 1% NL 54% 69% 38% 19% 11% 3% 3% 0% 0% AT 57% 48% 32% 29% 18% 5% 3% 2% 0% PL 50% 49% 20% 13% 34% 5% 1% 2% 2% PT 66% 47% 26% 12% 6% 4% 6% 2% 4% RO 61% 62% 23% 15% 9% 5% 2% 1% 3% SI 54% 42% 36% 13% 26% 9% 4% 1% 1% SK 56% 37% 32% 24% 33% 4% 2% 1% 1% FI 56% 51% 44% 21% 21% 1% 2% 0% 0% SE 43% 59% 60% 17% 14% 1% 2% 0% 0% UK 54% 47% 42% 27% 11% 3% 1% 0% 2% Highest percentage per country Highest percentage per item Lowest percentage per country Lowest percentage per item 103
105 The socio-demographic data show that: Young respondents are the most likely to want to emphasise qualification levels (58%, compared with 48-52% of people in the three older age groups) and language skills (25% do this, as opposed to 15-17% of people in the three older age groups). By contrast, and year-olds are the most likely to mention professional experience (59-60% do so, compared with 49-50% of year-olds and people aged 55 and over). Respondents who are still studying or who completed their education later in life are more likely emphasise qualification levels: 62% of the students and 55% of those who left education aged 20 or over mention this, compared with 49% of those who left at and 47% of those who left at 15 or under. People who left education aged 20 or over also emphasise the ability to adapt: 37% of those who left education aged 20 or over mention adaptability, compared with 36% of those who left at and 31% of those who left at 15 or under. Unemployed people (44%), manual workers (47%) and self-employed people (48%) are less inclined to emphasise qualification levels than students (62%) and managers (58%). But manual workers (63%), unemployed people (61%) and self-employed people (59%) are the most inclined to emphasise professional experience. Manual workers (41%) also prize the ability to adapt more than the other groups. While 54% of people who almost never have trouble paying their bills think that job applicants should emphasise the level of their qualifications, this falls to 45-46% of people who have difficulty paying bills sometimes or most of the time. 104
106 QA6 In your opinion, which two assets should one emphasize in order to easily find a job today? (MAX. 2 ANSWERS) Professional experience Level of one s qualifications Ability to adapt Computer skills Language skills Willingness to work abroad Other None (SPONTANEOUS) (SPONTANEOUS) EU27 54% 51% 35% 19% 17% 5% 2% 1% 1% Sex Male 56% 50% 35% 18% 16% 6% 2% 1% 1% Female 53% 52% 34% 21% 18% 5% 2% 1% 1% Age % 58% 28% 20% 25% 6% 1% 1% 0% % 48% 36% 17% 16% 5% 2% 1% 1% % 50% 38% 18% 15% 5% 2% 1% 1% % 52% 33% 22% 17% 5% 2% 1% 2% Education (End of) 15-54% 47% 31% 21% 13% 6% 2% 2% 2% % 49% 36% 20% 16% 5% 2% 1% 1% % 55% 37% 17% 18% 5% 2% 1% 0% Still studying 43% 62% 26% 22% 30% 7% 0% 0% 0% Respondent occupation scale Self-employed 59% 48% 39% 15% 17% 7% 3% 1% 1% Managers 57% 58% 37% 18% 16% 4% 1% 0% 0% Other white collars 57% 50% 36% 23% 18% 4% 1% 0% 0% Manual workers 63% 47% 41% 15% 13% 4% 2% 0% 1% House persons 48% 52% 30% 23% 20% 7% 2% 2% 1% Unemployed 61% 44% 32% 17% 15% 7% 3% 2% 2% Retired 49% 52% 32% 23% 17% 5% 2% 2% 2% Students 43% 62% 26% 22% 30% 7% 0% 0% 0% Difficulties paying bills Most of the time 53% 45% 34% 17% 16% 7% 4% 2% 2% From time to time 57% 46% 34% 19% 17% 6% 2% 1% 1% Almost never 54% 54% 35% 20% 18% 5% 1% 1% 1% 105
 of Europeans have participated in training courses over the past 12 months 41,")
107 7. TRAINING 7.1 Participation in training - Nearly one European in four has recently participated in training - Almost a quarter (23%) of Europeans have participated in training courses over the past 12 months 41, marginally more than the 22% who had done so in the 2009 survey. Three quarters (76%) have not participated in training over the past 12 months. In six Member States at least a third of respondents say they have participated in training. Sweden, where 56% have done so, is the only EU country where a majority of respondents have participated in training over the past 12 months; the Netherlands (48%) and Finland (41%) also have relatively high numbers of people who have recently taken part in training courses. At the other end of the scale, however, in three countries 10% of respondents or less say they have taken part in training over the past year: Greece, where only 6% have done so, Bulgaria (7%) and Italy (10%). Trend analysis shows that in nine EU countries more respondents have participated in training over the last 12 months than in In some cases the increases have been quite substantial, notably in the Netherlands (48%, +10 points) and Belgium (31%, +10). Though the proportion of respondents who have taken training courses dropped in 12 Member States, the fall was only marginal in most cases, with the biggest decline recorded in Austria (20%, -4). 41 QA20: During the last 12 months, have you participated in any training courses? Yes; no; don t know. 106
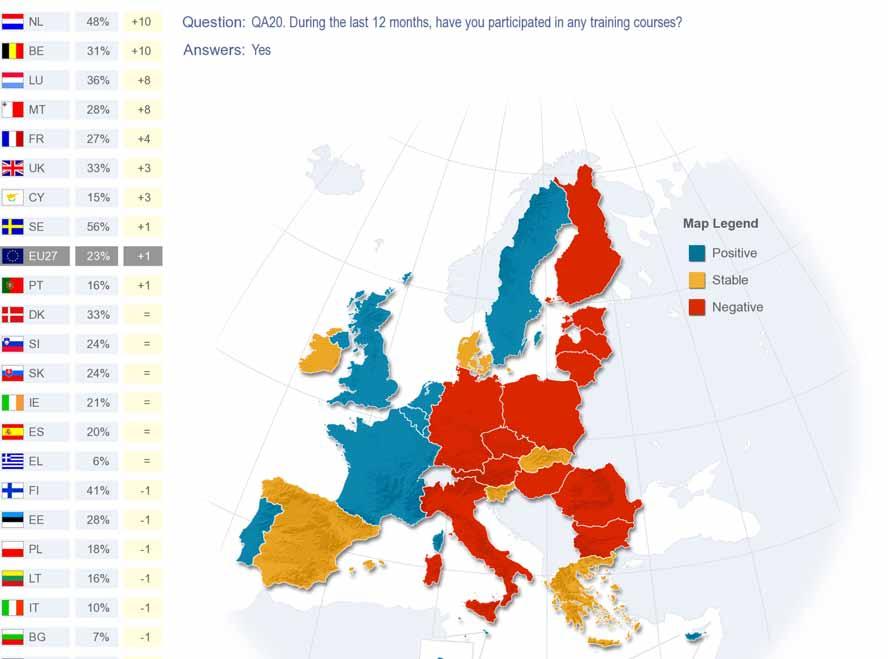

108 107
109 The socio-demographic data show that: Men are slightly more likely than women to have participated in training over the last 12 months, by a margin of 24% to 21%. Respondents in the age group (32%) and the age group (31%) are the most likely to have participated in a training course. 26% of year-olds and just 9% of the 55+ group say they have done this. Respondents who spent more time in education are more likely to have participated in training: 37% of those who left education aged 20 or over say they have done so, compared with 21% who left school aged and just 7% of those who left at 15 or under. While more than half of managers say they have recently participated in training (55%), this proportion falls to around a third for other white collar workers (33%) and manual workers (31%). Unsurprisingly, just 4% of retired people, and 7% of house persons have taken part in training. QA20 During the last 12 months, have you participated in any training courses? Yes No EU27 23% 76% 1% Sex Male 24% 75% 1% Female 21% 78% 1% Age % 72% 2% % 67% 1% % 69% % 90% 1% Education (End of) 15-7% 92% 1% % 78% 1% % 62% 1% Still studying 24% 74% 2% Respondent occupation scale Self-employed 27% 73% - Managers 55% 44% 1% Other white collars 33% 66% 1% Manual workers 31% 68% 1% House persons 7% 92% 1% Unemployed 19% 81% - Retired 4% 95% 1% Students 24% 74% 2% 108
 in this group say that their current employer financed their training, down from 58% in 2009.")
110 - A majority (55%) of individuals who participated in training were funded by their employer - The respondents who had participated in training in the last 12 months were then asked who funded this training 42. A majority (55%) in this group say that their current employer financed their training, down from 58% in A fifth (21%) of respondents say they funded their own training (no change on 2009), while a similar number (20%) say the national government or a public organisation funded their training, up from 17% in % say their training was EU-funded (up 4% compared with 2009). The current employer is the first answer given in 21 countries, led by the Czech Republic (73%), France (66%) and Slovakia (65%). 39% say that their training was paid for by the national government in Greece, as do 38% in Spain and 36% in Ireland. This is the most common answer given in these three Member States. Self-funding is the most common in Malta (38%), Romania (36%), and Bulgaria (35%), where it is also the first answer given. It is also a common answer in Belgium, 35%. Base: Those who participated in a training course in the last 12 months =23% of the total sample While relatively few respondents report that the EU funded their training in most countries, this is in fact quite commonplace in some Member States, including Lithuania, where 29% of people had their training funded from this source, Latvia (25%), Poland (25%), Estonia (17%), Bulgaria (14%), Greece (12%), Cyprus (11%), Portugal (11%), Italy (10%) and Malta (10%). Furthermore, several countries have seen large increases in the proportion of people receiving EU funding since 2009: Lithuania (+24 points), Latvia (+17), Bulgaria (+12), and Romania (+7). However, this proportion has dipped in some countries, such as Spain (8%, -4 points) and Portugal (11%, -3). 42 QA21: Who funded this training? Was it? (MULTIPLE ANSWERS POSSIBLE) The EU; The (NATIONALITY) Government and\ or a public organisation within (OUR COUNTRY); your current employer; yourself; other (SPONTANEOUS); don t know. 109

111 Base: Those who participated in a training course in the last 12 months =23% of the total sample 110
112 The socio-demographic data show that: Men are more likely to receive funding from their current employer (60%, as opposed to 50% of women), while more women fund themselves (25%, compared with 18% of men). Younger respondents are the most likely to receive national government funding and to fund themselves, while those in the and age groups are the most likely to be funded by their employer. Respondents who left education aged 20 or over are the most likely to fund their own training: 24% have done this, compared with 16% of people who left at 19 or under. Those who left school at 15 or under are the most likely to be funded by their national government. Unemployed respondents are the most likely to receive EU-funded training: 10% have done so, compared with 3% of manual workers. Unemployed respondents are also the most likely to be given funding by their national government. - Nearly one in five have attended employer-funded training - 70% of respondents say that they have not attended any training courses (including any outside working hours) or received any other on-the-job training in the last two years 43,. Close to one in five (18%) say that they have attended a training course funded by their employer. Just 7% say they attended state or publicly funded training, while 6% say they were self-funded. Overall, 29% of Europeans have attended a training course in the last two years. Respondents living in the EU15 countries are more likely to have attended a training course: 31% have done so within the last two years, as opposed to 21% in the NMS12. Respondents in non-euro countries are also slightly more likely to have attended training than those in the euro-zone, by a margin of 30% to 28%. At least a fifth of respondents have attended training funded by their employer in 13 EU countries, led by Sweden (39%), the Netherlands (37%) and Denmark (33%). 43 QA28: In the last two years, have you attended any training courses (including any outside working hours) or received any other on the job training? (MULTIPLE ANSWERS POSSIBLE) Yes, funded by your employer; yes, funded by state/public funding; yes; self-funded; no; don t know. 111
113 At the other end of the scale, just 3% of respondents in Bulgaria and 4% in Greece have attended employer-funded training. In six countries, at least 10% of respondents have attended state or publicly funded training: Finland (14%), Spain (11%), Denmark (11%), Ireland (10%), Luxembourg (10%) and Sweden (10%). But the number attending self-funded training within the last two years exceeds 10% in only one country: the Netherlands (12%). Overall, around half of the respondents have attended such training courses in the last two years in Sweden (52%), the Netherlands (50%) and Finland (48%). This proportion is lowest in Bulgaria (8%) and Greece (10%). QA28 In the last two years, have you attended any training courses (including any outside working hours) or received any other on the job training? No Yes, funded by your employer Yes, funded by state\ public funding Yes, self-funded Don't know Total 'Yes' EU27 70% 18% 7% 6% 1% 29% BE 67% 19% 7% 9% 1% 32% BG 91% 3% 2% 3% 1% 8% CZ 72% 20% 3% 5% 1% 27% 54% 33% 11% 6% 0% 45% DE 69% 20% 6% 6% 1% 30% EE 59% 24% 9% 9% 2% 38% IE 71% 12% 10% 7% 1% 28% EL 89% 4% 4% 2% 2% 10% ES 74% 10% 11% 6% 1% 25% FR 67% 24% 9% 2% 1% 33% IT 80% 8% 6% 6% 1% 19% CY 84% 10% 5% 2% 0% 16% LV 67% 14% 9% 10% 1% 32% LT 77% 10% 8% 5% 2% 21% LU 62% 22% 10% 7% 2% 36% HU 74% 12% 7% 7% 1% 25% MT 74% 12% 8% 9% 0% 26% NL 49% 37% 4% 12% 1% 50% AT 66% 20% 8% 8% 1% 34% PL 75% 13% 5% 3% 4% 20% PT 82% 7% 6% 4% 1% 17% RO 83% 7% 3% 5% 2% 15% SI 70% 20% 5% 7% 0% 30% SK 67% 21% 6% 7% 1% 32% FI 50% 30% 14% 9% 2% 48% SE 48% 39% 10% 9% 0% 52% UK 58% 28% 9% 6% 1% 41% Highest percentage per country Lowest percentage per country Highest percentage per item Lowest percentage per item 112
114 Unsurprisingly, the socio-demographic pattern is the same as for question QA20 (participation in any training courses the last 12 months): the categories that have participated training courses the most are: Men. Respondents aged and Individuals who spent longer in education. Managers. 113

115 7.2 The need for training to retain current employment - Three in ten Europeans currently working think that they should take a training course to help them keep their job - Almost two-thirds (64%) of Europeans currently at work feel that their education and training to date have been sufficient to enable to keep their job 44. This constitutes a slight increase on the 62% who thought this in % of respondents think they should take a training course and will do so down from the 19% who said this two years earlier. And 13% say that they should take a training course but cannot currently do so, the same as in the 2009 survey. Taking these two results together, 30% of respondents feel that they should participate in training to help safeguard their job. The countries where the most people believe that their education and training to date have been sufficient to enable them to keep their jobs are Slovakia (82%), Cyprus (81%) and Slovenia (80%). This view is least widely held in Austria (50%), Spain (52%) and Malta (52%). There have been significant evolutions on this question over the last two years. More people are now satisfied with their existing level of education and training in Portugal (79%, +26 points), Slovenia (80%, +10) and Romania (69%, +9). Yet fewer respondents feel this way than in 2009 in Sweden (54%, -22), Greece (72%, - 10) and Estonia (60%, -8). Base: those currently working =49% of the total sample The Member States where most respondents say that they should take a training course and will do so are Sweden (37%), Austria (33%) and Malta (33%). The countries where the fewest people give this answer are Portugal (6%), Greece (7%) and Romania (8%). Several countries have seen large rises in the numbers intending to take a course, notably Sweden (37%, +19 points), Luxembourg (26%, +11) and Estonia (24%, +10). But other countries saw falls of a similar magnitude: Portugal (6%, -18) and Poland (10%, -12). Respondents are most likely to say that they would like to take a training course but cannot currently do so in Hungary (28%), Spain (18%) and France (18%), and least likely in Finland (4%), Slovenia (5%) and the Netherlands (5%). The largest upward swings since 2009 came in Greece (16%, +6), Bulgaria (10%, +5) and Poland (16%, +5), while there were sizeable falls in Malta (13%, -8) and Portugal (8%, -8). 44 QA22: Thinking about yourself, do you think that in order for you to keep your job...? Your education and training to date are sufficient; you should take a training course but you cannot currently do so; you should take a training course and you will do so; don t know. 114
116 The socio-demographic analysis shows that: The older people get, the more likely they are to say that their education and training is sufficient. While 69% of the 55+ group say this, the level drops successively to 66% of year-olds, 62% of year-olds and 54% of year-olds. People in the latter group are the most likely to say that they should take a training course and will do so. Respondents who spent longer in education are the most likely to say that they should take a training course and will do so: 20% of those who left education aged 20 or over say this, compared with 16% who left aged an 12% of those who left aged 15 and under. While 24% of managers say that they should take a training course and will do so, this falls to 15-16% of self-employed people, other white collar workers and manual workers. 7.3 The need for training to find employment - Over half of all respondents who are not in work but are not retired acknowledge that they would benefit from additional training - Respondents who previously said that they are not currently working and who are not retired were asked whether their education and training to date are sufficient for them to find a job soon 45. Over a third of this group (36%) say spontaneously they are not looking for work despite not currently being in work, the same proportion as during the 2009 survey. Nearly a quarter (23%) say their education and training to date are sufficient (compared with 20% in 2009), while 19% say they should take a training course and will do so (down slightly from the 21% who said this in 2009). A further 16% say they should take a training course but cannot currently do so (17% said this previously). Excluding respondents who are not looking for work, 36% say their education and training to date are sufficient, 29% say that they should take a training course and will do so, and 25% say that they should take a training course but cannot currently do so. This makes for 54% who acknowledge that they could benefit from further training. The remaining 10% don t know. 45 QA23: Thinking about yourself, do you think that in order to find a job soon? Your education and training to date are sufficient; you should take a training course and you will do so; you should take a training course byt you cannot currently do so; you are not looking for a job (SPONTANEOUS); don t know. 115
, the UK (36%), Bulgaria (30%) and Greece (30%).")
117 Base: Those who are not working, but not retired, and did not answer spontaneously that they were not looking for a job =16% of the total sample Focusing again on the respondents who did not say that they were not looking for a job, the highest proportions of people say that their education and training to date are sufficient in the Netherlands (42%), the UK (36%), Bulgaria (30%) and Greece (30%). The lowest scores were recorded in Italy (11%), Luxembourg (15%) and Malta (15%). Since 2009 these figures have risen in the UK (36%, +15 points), Greece (30%, +12) and Romania (23%, +9), while substantial falls occurred in Lithuania (21%, -11), Estonia (21%, -9) and Finland (19%, -8). The Member States with the largest numbers of respondents saying that they should take a training course and will do so are Denmark (36%), Finland (36%) and France (34%); the fewest people give this answer in Greece (9%) and Romania (9%). The most significant evolution since 2009 took place in Luxembourg (24%, +15), followed by Belgium (26%, +11), Cyprus (21%, +8) and Lithuania (21%, +8). The largest falls occurred in Spain (14%, -12) and Slovenia (11%, -8). Respondents are most likely to say that they should take a training course but cannot currently do so in Hungary (40%), Latvia (30%) and Lithuania (27%). But this response is relatively rare in Luxembourg (6%), Malta (7%) and Sweden (8%). The most significant increases since 2009 occurred in Denmark (17%, +8) and Greece (16%, +7), with the sharpest falls in Malta (7%, -10) and Italy (12%, -6). 116
118 QA23T Thinking about yourself, do you think that in order to find a job soon? Your education and training to date are sufficient - Sept-Oct May-June 2009 You should take a training course and you will do so - Sept-Oct May-June 2009 You should take a training course but you cannot currently do so - Sept-Oct May-June 2009 Don't know - Sept-Oct May-June 2009 EU27 36% +5 29% -4 25% -1 10% = BE 38% -6 39% % -7 1% = BG 36% +4 25% +4 24% +4 15% -12 CZ 51% +3 20% +3 28% -1 1% -5 30% -4 47% +4 22% +10 1% -10 DE 41% +3 26% -3 24% -1 9% +1 EE 28% -8 37% +3 30% +6 5% -1 IE 31% +1 22% -7 14% -1 33% +7 EL 52% +9 16% % +6 5% +3 ES 31% -2 23% % +6 18% +15 FR 23% -7 51% +7 21% -1 5% +1 IT 26% % +2 28% -8 10% -6 CY 43% +6 36% % -2 5% -15 LV 30% -3 32% +6 37% = 1% -3 LT 27% % % +4 11% +1 LU 31% -8 50% % -6 6% -12 HU 21% -4 21% -8 52% +9 6% +3 MT 37% % -1 17% % +9 NL 57% -4 24% +7 16% +1 3% -4 AT 32% +2 44% +3 19% -5 5% = PL 35% +5 29% -1 26% -2 10% -2 PT 41% +9 24% -5 25% -3 10% -1 RO 30% % -1 27% +2 30% -12 SI 53% % -7 20% -4 5% +1 SK 42% -4 20% +3 30% +14 8% -13 FI 29% -7 55% +7 13% +5 3% -5 SE 44% % +2 11% = 2% -12 UK 46% % -7 20% -7 3% -1 Base: Those who are not working, but not retired, and did not answer spontaneously that they were not looking for a job =16% of the total sample 117
119 The socio-demographic data show that: Men are more likely to say that their education and training to date are sufficient: 39% do so, compared with 34% of women. They are also more likely to say they should take a training course and will do so, by a margin of 32% to 27%. However, 29% of women say they should take a training course but cannot, as opposed to 19% of men. Respondents in the and the are the most likely to say that they should take a training course but cannot. And people aged are the most likely to say they should take a training course and will do so. While 50% of people who finished their education aged 20 or over say their education and training are sufficient, this falls to 30-33% of people who left school aged 19 or under. By contrast, people who left school at 15 or under are the most likely to say that they should take a training course but cannot, while those who left at are the most likely to say they should take a training course and will do so. Among the occupational groups who are not in work, house persons are the most likely to say that they should take a training course but cannot, while students are the most likely to say they should take a training course and will do so. Respondents who almost never have difficulty paying their bills are the most likely to say both that their education and training to date are sufficient and that they should take a training course and will do so, while those who have difficulty paying their bills most of the time are the most likely to say that they should take a training course but cannot. People who are confident of having a job in two years time are the most likely to say both that their education and training to date are sufficient and that they should take a training course and will do so, while those who are not confident about their employment prospects are the most likely to say that they should take a training course but cannot. 118
120 QA23T Thinking about yourself, do you think that in order to find a job soon? Your education and training to date are sufficient You should take a training course and you will do so You should take a training course but you cannot currently do so EU27 36% 29% 25% 10% Sex Male 39% 32% 19% 10% Female 34% 27% 29% 10% Age % 40% 18% 8% % 25% 31% 7% % 24% 27% 14% % 10% 26% 19% Education (End of) 15-30% 15% 37% 18% % 27% 31% 9% % 23% 20% 7% Still studying 36% 42% 14% 8% Respondent occupation scale Self-employed Managers Other white collars Manual workers House persons 35% 21% 33% 11% Unemployed 37% 24% 28% 11% Retired Students 36% 42% 14% 8% Confident of having a job in 2 years Confident 42% 18% 34% 6% Not confident 30% 32% 26% 12% Base: Those who are not working, but not retired, and did not answer spontaneously that they were not looking for a job =16% of the total sample 119

121 - Most people who have taken a training course think the experience would help them to find a job in the future - All respondents who have participated in a training course or received any other on-thejob training in the last two years were asked whether their latest experience would help them to find a job in the future 46. Nearly two-thirds (63%) say that the training they received would help them to find a job, with 27% saying yes, definitely and 36% yes, probably. Just one-third (33%) say that the training they received would not help them, with 19% saying no, probably not and 14% saying no, definitely not. Respondents who live in non-euro countries are more likely to feel that the training they received would help them to find another job: 68% think this, compared with just 60% in the euro-zone. In 16 Member States, at least twothirds of respondents think that the training they received would help them to get a job in the future, most strikingly in the Czech Republic (76%, 32% definitely), Latvia (74%, 36% definitely), Malta (74%, 53% definitely) and Romania (74%, 33% definitely). At the other end of the scale, relatively few respondents in France (54%, 26% definitely) and Sweden (56%, 27% definitely) feel that their training experience would be helpful in finding a job. Base: Those who have attended any training course =29% of the total sample 46 QA29: If you were looking for a job, would the last training course you have received help you to find a job in the future? Yes, definitely; yes, probably; no, probably not; no, definitely not; don t know. 120


122 However, despite these variations, an absolute majority of respondents in all Member States think that the last training they have received would help them to find a job. Base: Those who have attended any training course =29% of the total sample The socio-demographic data show that: Age influences perceptions of the value of the latest training received. Younger respondents are more likely to feel that their training would help them to find a job: 73% of year-olds think this, compared with 67% of year-olds, 61% of year-olds and 50% of over-55s. 68% of self-employed people, 65% of managers, 64% of manual workers and 60% of unemployed people think that the training they received would help them to find a job. 121


123 7.4 Perceived obstacles to training - Affordability remains the main barrier to training - All the respondents who say that they would like to participate in training but cannot currently do so were asked to identify the main barriers to their taking part 47. Over a third (38%) of the people in this group say that they cannot afford to take a training course, up slightly on the 37% who said this in The next most common explanation given is that the respondent does not have time because of family responsibilities: 22% say this, fewer than the 24% who gave this reason in 2009 (which was in turn down from 26% in 2006). By contrast, the numbers saying that training conflicts with their work schedule has gone up from 18% to 20%, as have the numbers saying that their employer would not support them (19%, up from 17%), that they do not know about any training offers (16%, up from 15%), that there is no training offered close enough to where they are (14%, up from 12%), and that they do not have the necessary experience or qualifications (10%, up from 9%). Just 9% say they cannot take part for personal reasons (no change), 8% say that their age prevents them (no change), 6% are uncomfortable with the idea of going back to something that is like a school (- 1%), and 4% cite their health or mental condition (no change). Basis: Those who said they should take a training course but cannot currently do so =11% of the total sample 47 QA24: From the following list, what are the main reasons preventing you from taking part in a training course? (MULTIPLE ANSWERS POSSIBLE) You do not have the necessary experience or qualifications; you cannot afford it; your current employer would not support you; training conflicts with your work schedule; you do not have time because of family responsibilities; there is no training offered close enough to where you are; you do not know about any training offers; you are not comfortable with the idea of going back to something that is like school; your age prevents you from doing it; your health or mental condition prevents you from doing it; you cannot participate for other personal reasons; other (SPONTANEOUS); don t know. 122
124 Warning: due to the low base, the analysis of the national results and the sociodemographic results of this question should be conducted with caution. We will describe trends, without giving figures. A country-by-country analysis seems to demonstrate that in a large majority of Member States, affordability is the greatest problem. The only exceptions are Belgium, Luxembourg, Malta, and Finland (where you do not have time because of family responsibilities is cited first); and the Czech Republic and Italy ( your current employer would not support you ). A gender pattern emerges from the socio-demographic data: Women are more likely than men to say that they cannot afford to take part in training and that they have no time because of family responsibilities, whereas men are more likely to say that their current employer would not support them and that training conflicts with their work schedule. 123
125 8. TRAINEESHIP AND CAREER GUIDANCE 8.1 Participation in traineeship - A third of respondents have completed at least one traineeship - All European respondents except those who said they were currently students were asked whether they had completed one or more traineeships either during or immediately after completing their education 48. Almost two-thirds (63%) say that they have not completed any training programmes. However, a third (34%) have completed at least one traineeship, with 16% having finished one, 8% having finished two, and 10% having completed three or more. Basis: all respondents except students =91% of the total sample Respondents from the NMS12 countries are slightly more likely to have taken part in training than their EU15 counterparts, by a margin of 38% to 34%. However, EU15 respondents are more likely to have participated in multiple training courses: while 22% of NMS12 respondents and just 15% of EU15 respondents say they have taken one training course, more EU15 respondents say they have taken two courses or more. Similarly, while respondents in non-euro countries are more likely to have taken part in one training course than people in the euro-zone by a margin of 23% to 13%, euro-zone respondents are more likely to have taken two or more courses. 48 QA25a: I would like you to think about traineeships. Did you complete one or more traineeships either during or immediately after you completed your education? (IF NECESSARY: By traineeship, we mean training for a particular job or profession) (DO NOT READ OUT) Yes, one; yes, two; yes, three or more; no; still in traineeship (SPONTANEOUS); don t know. 124
, Finland (56%), Lithuania (55%), Sweden (53%) and Denmark (51%).")

.")
, Luxembourg (13% two, 26% three or more), France (11% two, 27% three or more), Estonia (15% two, 22%")
126 In six countries an absolute majority of respondents say they have completed at least one traineeship: Estonia (57%), Luxembourg (54%), Finland (56%), Lithuania (55%), Sweden (53%) and Denmark (51%). Conversely, in the remaining 21 Member States, a majority answer that they have not completed any traineeships either during or immediately after completing their education. Very high numbers of people say they have not completed any training courses in Portugal (83%), Italy (82%) and the Czech Republic (81%). In five countries, over a third of respondents say that they have completed two or more training courses: Finland (16% two, 23% three or more), Luxembourg (13% two, 26% three or more), France (11% two, 27% three or more), Estonia (15% two, 22% three or more) and Sweden (13% two, 23% three or more). The rate of completion of a single traineeship is highest in Slovenia (42%), Denmark (35%) and Hungary (30%). Basis: all respondents except students =91% of the total sample 125
127 The socio-demographic data show that: Men (37%) are more likely than women (32%) to have completed a traineeship. Younger respondents are more likely to have completed a traineeship: 43% of people in the and age groups have done so, compared with 38% of those in the group and 24% in the 55-and-over group. Length of time spent in education produces very wide variations: 53% of respondents who left education aged 20 or over have completed a traineeship, but this falls to 34% among those who left aged and again to 13% among those who left aged 15 or under. While 56% of managers have completed a traineeship, only 20% of house persons and 34% of unemployed people have done so. 42% of respondents who are currently working have taken a traineeship, as opposed to just 25% of those who are not currently working. 46% of respondents who are not really concerned about losing their jobs have completed a traineeship; but this declines to 38% of those who are worried about their job prospects. Similarly, 46% of respondents who are confident of having a job in two years time say they have completed at least one traineeship, whereas only 31% of people who are not confident about their future employment have done the same. 126
128 QA25a I would like you to think about traineeships. Did you complete one or more traineeships either during or immediately after you completed your education? Yes, one Yes, two Yes, three or more No Still in traineeship (SPONTANEOUS) Total 'Yes' EU27 16% 8% 10% 63% 1% 2% 34% Sex Male 18% 8% 11% 60% 1% 2% 37% Female 15% 7% 10% 65% 1% 2% 32% Age % 9% 12% 54% 1% 2% 43% % 10% 12% 56% - 1% 43% % 9% 11% 60% 1% 1% 38% % 5% 8% 72% 2% 2% 24% Education (End of) 15-8% 2% 3% 84% 1% 2% 13% % 8% 9% 63% 1% 2% 34% % 12% 19% 45% 1% 1% 53% Still studying Respondent occupation scale Self-employed 19% 8% 12% 59% - 2% 39% Managers 23% 14% 19% 43% - 1% 56% Other white collars 19% 10% 9% 60% - 2% 38% Manual workers 18% 9% 12% 59% 1% 1% 39% House persons 11% 4% 5% 75% 2% 3% 20% Unemployed 19% 7% 8% 63% 1% 2% 34% Retired 11% 5% 8% 72% 2% 2% 24% Students Currently working Yes 19% 10% 13% 56% - 2% 42% No 13% 5% 7% 71% 2% 2% 25% Concerned about losing job Concerned 19% 9% 10% 60% - 2% 38% Moderately 21% 10% 11% 57% - 1% 42% Not really or not at all conc 19% 11% 16% 53% - 1% 46% Employment situation in 2 years Optimistic 19% 9% 9% 61% 1% 1% 37% Pessimistic 16% 7% 11% 63% 1% 2% 34% Confident of having a job in 2 years Confident 21% 11% 14% 53% - 1% 46% Not confident 16% 7% 8% 66% 1% 2% 31% Basis: all respondents except students =91% of the total sample 127
129 - Over a quarter of the respondents say their last traineeship lasted over six months - Respondents who said they had completed at least one traineeship were asked how long their last traineeship took 49. Over a quarter (26%) say their course lasted over six months. For 21% the traineeship lasted 3-6 months, with 18% spending 1-2 months in training. Close to a quarter of respondents said that it lasted 1-4 weeks, and only 6% say the traineeship lasted less than a week. There is a marked difference between euro-zone and noneuro countries on this question. While 42% of people outside the euro-zone say that their traineeship lasted for longer than six months, only 16% of people inside the euro-zone say this. By contrast, 39% of respondents in the euro-zone say their traineeship lasted less than one month (31% for 1-4 weeks, 8% less than a week) as compared to just 18% in non-euro countries (14% for 1-4 weeks, 4% less than a week). Basis: those who completed a traineeship =31% of the total sample In spite of an EU average of 26%, in four Member States a majority of respondents say that their last traineeship lasted over six months: the UK (80%), Denmark (64%), Ireland (56%) and Malta (54%). Longer than six months is the most common answer in nine countries, though very few people give this response in Slovakia (3%), Lithuania (6%), Austria (7%) and Estonia (7%). 3 to 6 months is the most common answer in seven countries, with 60% of respondents in Slovenia saying that their last traineeship lasted this long, followed by 39% in Spain and 37% in Greece. 1 to 2 months is the commonest answer in five countries, led by Estonia (35%), Austria (34%) and Lithuania (33%). 49 QA26 How long was the last traineeship you completed? Less than a week; 1-4 weeks; 1-2 months; 3-6 months; longer than six months; don t remember (SPONTANEOUS); don t know. 128
130 1 to 4 weeks is the most common answer in seven EU countries, led by Slovakia (46%), Germany (44%) and Austria (34%). While relatively few respondents overall say that their last traineeship lasted for less than a week, 23% say this in the Czech Republic, as do 15% in France and 14% in Cyprus. QA26 How long was the last traineeship you completed? B Less than a week 1-4 weeks 1-2 months 3-6 months Longer than six months Don t remember (SPONTA- NEOUS) Don't know EU27 6% 24% 18% 21% 26% 4% 1% BE 9% A 29% 19% 25% 16% 2% 0% BG 2% 20% 25% 24% 16% 12% 1% CZ 23% 28% 17% 15% 11% 6% 0% 0% 5% 7% 20% 64% 3% 1% DE 3% 44% 17% 21% 12% 3% 0% EE 7% 26% 35% 19% 7% 4% 2% IE 5% 8% 7% 18% 56% 4% 2% EL 3% 16% 9% 37% 31% 4% 0% ES 5% 11% 23% 39% 16% 5% 1% FR 15% 33% 19% 17% 15% 1% 0% IT 10% 31% 28% 12% 11% 8% 0% CY 14% 17% 11% 21% 34% 3% 0% LV 8% 18% 28% 31% 11% 3% 1% LT 3% 23% 33% 28% 6% 5% 2% LU 12% 22% 18% 20% 25% 3% 0% HU 3% 13% 22% 21% 37% 3% 1% MT 6% 15% 6% 14% 54% 5% 0% NL 13% 12% 12% 33% 28% 2% 0% AT 6% 34% 34% 14% 7% 4% 1% PL 7% 21% 17% 16% 25% 12% 2% PT 5% 9% 13% 27% 37% 9% 0% RO 2% 15% 15% 28% 25% 10% 5% SI 1% 3% 5% 60% 29% 2% 0% SK 13% 46% 13% 13% 3% 12% 0% FI 1% 13% 23% 36% 25% 2% 0% SE 1% 20% 35% 26% 14% 3% 1% UK 1% 2% 4% 12% 80% 1% 0% Highest percentage per country Highest percentage per item Lowest percentage per country Lowest percentage per item Basis: those who completed a traineeship =31%of the total sample 129
131 According to the socio-demographic data: Men (28%) are more likely than women (23%) to have completed a traineeship that lasted longer than six months, with women slightly more likely to have completed shorter training programmes. Older respondents are the mostly likely to have spent over six months on their last traineeship, while year-olds are the most likely to have participated in 1-4 week programmes. Interestingly, individuals who left school at 15 or under (34%) are more likely to have completed traineeships that lasted longer than six months, while those who left education at 20 or over are the most likely to have completed 1-2 and 3-6 month programmes. Retired people (35%) and unemployed people (28%) are more likely to have completed traineeships that lasted longer than six months than white collar workers (18%), managers (23%) and manual workers (24%). House persons (34%) are the most likely to have finished a 1-4 week traineeship. 130

 say the traineeship entailed an agreed set of objectives, while for 16% it involved a formal definition of their rights and responsibilities, and for 15% it involved a reference")
132 - Traineeship led to a formal certification by the employer for more than four in ten respondents - Among respondents who completed a traineeship, 44% say that they led to the formal certification by the employer of the knowledge, skills and competences they gained during the traineeship 50. A third (32%) say the traineeship involved a formal (written) agreement between them and the employer, while 30% say some form of salary or remuneration was involved. One in five (21%) say the traineeship entailed an agreed set of objectives, while for 16% it involved a formal definition of their rights and responsibilities, and for 15% it involved a reference letter. Basis: those who completed a traineeship =31% of the total sample Respondents from the EU15 countries are more likely to say that their traineeship involved all but one of the aspects under discussion (the exception being a formal definition of their rights and responsibilities). 17% say they their training involved a reference letter, compared with 6% in the NMS12; 33% obtained a formal (written) agreement between them and their employer, as opposed to 28% in the NMS12; and for 31% some form of salary or remuneration was involved (25% in the NMS12). The pattern is similar in euro-zone and non-euro countries, with the people in the non-euro countries more likely to say that their traineeship involved all six aspects under consideration. For example, 35% of respondents outside the euro-zone say they were given some form of salary or remuneration, as opposed to 27% of those in the eurozone; and 20% were given a formal definition of their rights and responsibilities, compared with 15% of their euro-zone counterparts. 50 QA27: Did this traineeship involve any of the following? (MULTIPLE ANSWERS POSSIBLE). A formal (written) agreement between you and the employer; an agreed set of objectives; a formal certification by the employer of the knowledge, skills and competences you gained during the traineeship; some form of salary or remuneration; a formal definition of your rights and responsibilities; a reference letter; other (SPONTANEOUS); none (SPONTANEOUS); don t know. 131
133 In eight Member States, at least 50% of respondents say their traineeship involved formal certification by the employer of their knowledge, skills and competences, with a particularly high proportion of people giving this answer in Denmark (69%), Finland (58%) and Malta (56%). Conversely, relatively few say there was formal certification by the employer in Estonia (26%) and Lithuania (30%). Despite this relatively low result, this is the item with the highest score in Lithuania, highlighting the wide differences between individual Member States: while no item receives more than 30% in Lithuania, or more than 32% in Cyprus and 33% in Slovakia, in Denmark no answer receives a score below 33%. In three countries, the traineeship involved a formal (written) agreement between you and your employer for at least half of the respondents: Slovenia (71%), Austria (52%), and Latvia (50%). It also involved such an agreement for high proportions of respondents in the Netherlands (48%) and Portugal (38%). The traineeship involved some form of salary or remuneration in fewer than half of cases in all countries. However, it did so for 42% of respondents in Sweden, 39% in Estonia and 32% in Cyprus. Conversely, this was the case for less than 20% of respondents who completed a traineeship in Lithuania (19%), Bulgaria and Belgium (both 18%) and Italy (13%). Relatively large numbers of respondents say that there was an agreed set of objectives in Finland (38%) and the UK (36%), while 36% in Slovenia and 33% in Denmark say there was a formal definition of their rights and responsibilities. In Denmark 49% of respondents say their traineeship involved a reference letter, as do 33% of those in Sweden. 132
134 QA27 Did this traineeship involve any of the following? A formal certification by the employer of the knowledge, skills and competences you gained during the traineeship A formal (written) agreement between you and the employer Some form of salary or remuneration An agreed set of objectives A formal definition of your rights and responsibilities A reference letter Other None (SPONTANE- (SPONTANE- OUS) OUS) Don't know EU27 44% 32% 30% 21% 16% 15% 2% 14% 2% BE 34% 27% 18% 24% 12% 11% 3% 19% 0% BG 42% 19% 18% 6% 9% 6% 4% 17% 4% CZ 50% 28% 33% 17% 18% 11% 0% 9% 0% 69% 59% 59% 33% 33% 49% 1% 3% 1% DE 49% 36% 31% 21% 19% 22% 1% 18% 1% EE 26% 27% 39% 27% 16% 15% 1% 12% 6% IE 51% 23% 24% 22% 16% 23% 6% 12% 2% EL 37% 19% 33% 11% 12% 12% 0% 18% 0% ES 49% 25% 21% 16% 10% 14% 2% 13% 2% FR 37% 24% 22% 11% 11% 5% 3% 21% 1% IT 42% 23% 13% 30% 10% 12% 2% 5% 0% CY 31% 10% 32% 20% 13% 15% 2% 20% 1% LV 31% 50% 35% 22% 19% 14% 1% 10% 2% LT 30% 21% 19% 23% 6% 9% 6% 13% 2% LU 44% 34% 34% 19% 14% 12% 4% 14% 1% HU 47% 33% 33% 15% 13% 6% 1% 12% 1% MT 56% 33% 26% 7% 22% 11% 2% 9% 2% NL 34% 48% 42% 31% 16% 14% 1% 9% 0% AT 43% 52% 46% 26% 25% 30% 2% 5% 1% PL 40% 30% 20% 14% 19% 3% 1% 18% 7% PT 30% 38% 21% 23% 14% 8% 3% 13% 1% RO 51% 20% 27% 14% 20% 8% 4% 11% 4% SI 51% 71% 65% 27% 36% 16% 3% 2% 0% SK 33% 22% 28% 23% 12% 14% 3% 9% 3% FI 58% 42% 49% 38% 22% 21% 1% 8% 0% SE 41% 32% 42% 34% 20% 33% 3% 12% 1% UK 53% 40% 50% 36% 23% 24% 1% 9% 4% Highest percentage per country Highest percentage per item Lowest percentage per country Lowest percentage per item Basis: those who completed a traineeship =31%of the total sample 133
135 Analysis of the socio-demographic data shows that: Men are slightly more likely to say that their traineeship involved all of the items under discussion, with the exception of a reference letter. Respondents who left education at 20 or over are more likely to have received formal certification by the employer of their knowledge, skills and competences. Managers are the most likely to say that their traineeships involved all of the items under discussion here, with the exception of a reference letter. Individuals who have trouble paying their bills most of the time are the least likely to say that their traineeships involved all of these items. Respondents who are not really concerned about losing their jobs are the most likely to say that their traineeships involved all six of the elements under consideration. 134
136 8.2 Assessments of the value of traineeships in finding a job - Nearly half of those who completed a traineeship say it helped them to find a job - Respondents who said they had completed a traineeship were asked to say whether the experience was helpful when it came to finding employment, and 44% of this group say that it had helped them to get a permanent job 51. However, a quarter (26%) says that it did not help them to find a job. A further 17% say that it helped them to find a temporary job, while 9% say it led to another traineeship. Basis: those who completed a traineeship =31% of the total sample Respondents in the NMS12 are more likely than those in the EU15 to say that a traineeship helped them to find a permanent job, by a margin of 52% to 42%. The gap between euro-zone and non-euro countries is even wider: 60% of respondents outside the euro-zone say that a traineeship helped them to get a permanent job, but this falls to just 35% of people who live in the euro-zone. Accordingly, in several non-euro countries a high proportion of respondents say that a traineeship helped them to get a permanent job, led by the UK (77%) and the Czech Republic (64%). By contrast, in some euro-zone countries relatively few people say that a traineeship helped them to get a job: Germany (28%), Spain (28%) and Austria (29%). The countries where the highest proportions of people say that their traineeship helped them to find a temporary job are Austria (30%), Italy (28%) and Spain (27%). In Austria, 16% also say that their traineeship led to another traineeship, as do 15% in Cyprus, Italy and the Netherlands. 51 QA25b: Thinking about the traineeship(s) you have completed, which of the following statements best corresponds to your situation? It led you to another traineeship; it helped you to find a temporary job; it helped you to get a permanent job; it did not help you to find a job; don t know. 135
, France (37%),")


137 At least 30% of respondents say their training experience did not help them to get a job in six Member States: Germany (37%), France (37%), Belgium (31%), Spain (30%), Lithuania (30%) and Luxembourg (30%). Basis: those who completed a traineeship =31% of the total sample On this question, there are substantial differences between socio-demographic categories. The analysis reveals that: The older the respondent, the more likely they are say that their training experience helped them to get a permanent job: 57% of people in the 55+ age group say this, but this declines progressively down to just 25% in the group. Among the youngest group, 38% said that it did not help them to find a job. 136
138 While 57% of retired people and 49% of managers say that their traineeship helped them to get a permanent job, only 24% of unemployed people agree. 42% of the latter group say that the traineeship did not help them to find a permanent job (compared with the EU average of 26%). However, more than a fifth of unemployed respondents say that it helped them to find a temporary job (22%, compared with the EU average of 17%). Respondents who almost never have difficulty paying their bills are the most likely to say that their traineeship helped them to get a permanent job (46% compared to 37% of those who have difficulty most of the time). While 45% of respondents who are not really concerned or only moderately concerned about losing their job say that their traineeship helped them to get a permanent job, this falls to 39% among those who are worried about their employment prospects. QA25b Thinking about the traineeship(s) you have completed, which of the following statements best corresponds to your situation? It helped you to get a permanent job It helped you to find a temporary job It led you to another traineeship It did not help you to find a job EU27 44% 17% 9% 26% 4% Sex Male 45% 16% 10% 25% 4% Female 43% 17% 9% 27% 4% Age % 24% 11% 38% 2% % 21% 9% 30% 3% % 17% 8% 26% 5% % 10% 10% 19% 4% Respondent occupation scale Self-employed 43% 19% 10% 23% 5% Managers 49% 14% 6% 26% 5% Other white collars 38% 21% 11% 27% 3% Manual workers 42% 19% 9% 27% 3% House persons 38% 18% 6% 31% 7% Unemployed 24% 22% 10% 42% 2% Retired 57% 10% 10% 18% 5% Students Difficulties paying bills Most of the time 37% 19% 8% 34% 2% From time to time 42% 21% 9% 26% 2% Almost never 46% 15% 9% 26% 4% Concerned about losing job Concerned 39% 24% 9% 26% 2% Moderately 45% 19% 10% 22% 4% Not really or not at all concerned 45% 14% 8% 28% 5% Basis: those who completed a traineeship =31% of the total sample 137
139 - A majority of those who did not complete a traineeship found a job within three months of finishing their education - While many people who completed traineeships clearly found the experience to be advantageous, it is also clear that many people who did not take a traineeship do not feel that they have suffered professionally as a result. Respondents who did not complete a traineeship during or after their education were asked to describe their situation after their education ended 52. A majority (54%) say that they found a permanent job within three months, while 20% say they did not find a permanent job within that timeframe. One in five (21%) say spontaneously that they were not looking for a job. Basis: those who did not complete a traineeship =57% of the total sample If we exclude the respondents who say spontaneously that they were not looking for a job after they completed their education, we find that 68% found a permanent job within three months, while 25% did not. Again excluding the responses of those who were not looking for a job, we find that in all but three Member States a majority of people who did not participate in traineeship after they completed their education say that they found a permanent job within three months, most notably in Denmark (83%), France (83%) and Sweden (82%). However, relatively few respondents say that they found a permanent job within three months in Romania (45%), Spain (48%), and Greece (49%). 52 QA25c You said that you didn t complete a traineeship during or after you completed your education. Which of the following best describes your situation after you completed your education? (DO NOT READ OUT) You found a permanent job within 3 months; you did not find a permanent job within 3 months; you were not looking for a job (SPONTANEOUS); don t know. 138
.")


140 Fairly high proportions of people say that they did not find a permanent job within three months in Spain (46%) and Greece (46%). Basis: those who did not complete a traineeship, and did not answer that they were not looking for a job =45% of the total sample The socio-demographic data show that: Men are more slightly likely than women to have found a permanent job within three months of leaving education, by a margin of 70% to 67%. Unsurprisingly, older respondents are more likely to have found a permanent job within three months of completing their education. 79% of people aged over 55 say they did this, but this gradually falls to 69% of year-olds, 56% of year-olds and 54% of year-olds. 139
141 There are minor differences reflecting the respondents level of education: twothirds (66%) of respondents who spent longer in education say that they found a permanent job within three months, compared with 70% of those who left school before the age of 20. Managers (74%), self-employed people (69%) and manual workers (68%) are the most likely to say that they found a permanent job within three months, while unemployed people (49%) are the most likely to say that they did not find a job. While 75% of respondents who almost never have trouble paying their bills say that they got a job within three months, only 60% of those who have trouble from time to time and 52% of those who have difficulties most of the time. 8.3 Assessments of career guidance and information on future skills - Only a third of respondents say they received careers guidance that helped them acquire skills they needed for the job they wanted - All respondents were asked which of a series of statements best described the career guidance they received at school 53. Over a third (36%) say spontaneously that they did not receive any career guidance at school, while a third (33%) say that it helped them to acquire the skills they needed for the type of job they wanted. A quarter (25%) of respondents say that the careers advice they were given did not help them acquire the skills needed for the type of job they wanted. On this question, we will analyse the results on the whole sample without excluding those who said spontaneously that they did not receive any career guidance at school. Indeed, it is interesting to analyse in which country and among which categories this spontaneous answer was the most widespread. 53 QA30: Which of the following statements best describes the career guidance you received at school? It helped you acquire the skills needed for the type of job you wanted; it did not help you acquire the skills needed for the type of job you wanted; you did not receive any career guidance at school (SPONTANEOUS); don t know. 140
142 Respondents in the EU15 are more likely to have a negative impression of careers guidance: 37% say spontaneously they did not receive any career guidance at school, compared with 29% of NMS12 respondents, and 27% say it did not help them acquire the skills they needed, compared with 19% of NMS12 respondents. By contrast, 43% of respondents in the NMS12 say that careers guidance helped them to acquire the skills they needed, as opposed to 31% of EU15 respondents. A comparison of the euro-zone and non-euro countries shows that far more people in the euro-zone say spontaneously they did not receive any careers guidance at school, by a margin of 41% to 26%. However, more respondents outside the euro-zone say both that careers guidance helped them to acquire the skills they needed (by a margin of 36% to 32%) and that it did not help them do this (by a margin of 32% to 21%). In five Member States, at least half of the respondents say that they did not receive any careers guidance: Greece (55%), Portugal (54%), Estonia (53%), Cyprus (52%), and Hungary (50%). In four Member States, 50% or more of respondents say that careers guidance helped them to acquire the skills they needed: the Czech Republic (51%), Slovenia (50%), Slovakia (50%), and France (50%). The countries where the fewest people give this positive assessment of careers guidance are Greece (20%) and Germany (21%). A relatively very high proportion of respondents (52%) say that careers guidance did not help them acquire the skills they needed in the UK, followed by Denmark (33%), Sweden (32%) and Finland (32%). 141
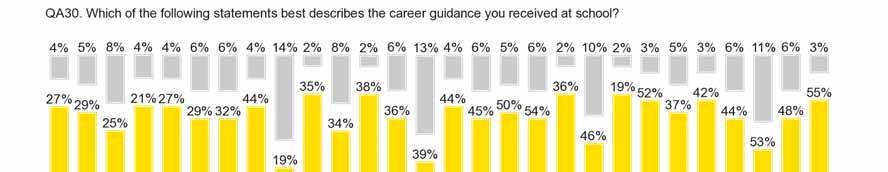
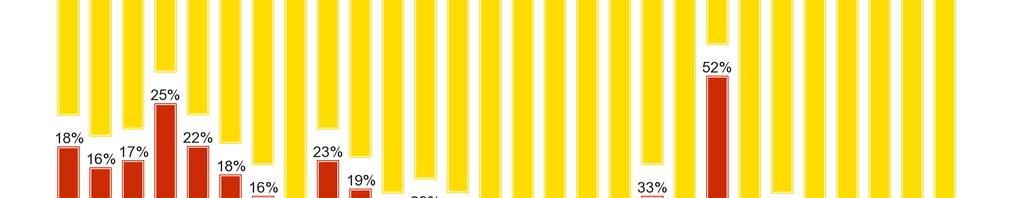
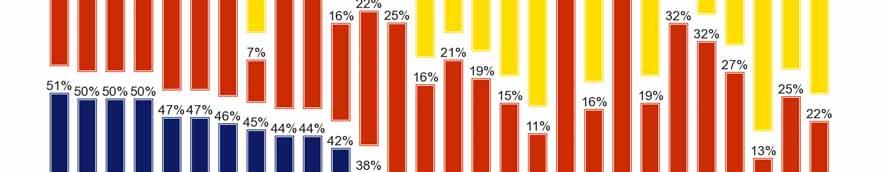

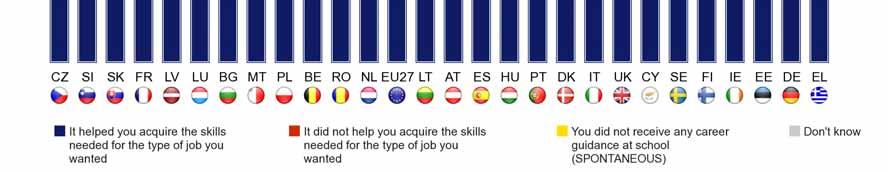
143 142
144 According to the socio-demographic data: Female respondents are more likely to say that they received no careers guidance, by a margin of 38% to 33%, while male respondents are slightly more likely to say both that their careers guidance helped and did not help them to acquire the necessary skills. Older respondents are the most likely to say that they received no careers guidance, and the least likely to say that careers advice either helped them or did not help them. Respondents who spent longer in education are more likely to say that careers guidance helped them: 47% of those who left aged 20 or over say this, compared with 35% who left aged and just 13% who left at 15 or under. Those who left at 15 or under are the most likely by some margin to say that they received no careers advice (62%). While 44% of managers and 41% of other white collar workers say that careers guidance helped them, only 19% of house persons and 28% of unemployed people agree. 40% of people who are currently working say that careers guidance helped them, but only 26% of those who are not working think this. 40% of those who are confident of having a job in two years time believe that their careers guidance helped them to acquire the skills they needed, as opposed to only 31% of those who are not confident of their future employment prospects. 143
145 QA30 Which of the following statements best describes the career guidance you received at school? It helped you acquire the skills needed for the type of job you wanted It did not help you acquire the skills needed for the type of job you wanted You did not receive any career guidance at school (SPONTANEOUS) EU27 33% 25% 36% 6% Sex Male 35% 26% 33% 6% Female 32% 24% 38% 6% Age % 26% 26% 11% % 32% 24% 5% % 29% 32% 4% % 18% 50% 6% Education (End of) 15-13% 19% 62% 6% % 28% 32% 5% % 26% 23% 4% Still studying 34% 23% 28% 15% Respondent occupation scale Self-employed 39% 24% 31% 6% Managers 44% 31% 22% 3% Other white collars 41% 28% 26% 5% Manual workers 38% 30% 28% 4% House persons 19% 23% 50% 8% Unemployed 28% 31% 36% 5% Retired 25% 18% 51% 6% Students 34% 23% 28% 15% Currently working Yes 40% 29% 27% 4% No 26% 22% 44% 8% Confident of having a job in 2 years Confident 40% 31% 24% 5% Not confident 31% 28% 35% 6% 144
146 - Most people think it would be useful to be given information about the likely requirements of the future job market - All respondents were asked how useful it would be to them personally to receive information about what skills were likely to be needed in the future job market 54, first for deciding what jobs to apply for in the future, and secondly for deciding what training courses to attend. The results are almost identical for both questions. A majority (58%) of respondents think it would be useful to receive information about future skills requirements to help them decide what training courses to attend: 26% say it would be very useful and 32% say it would be fairly useful. Just 15% say this would not be useful, 9% that it would not be very useful and 6% that it would not be at all useful. 57% say that information about future skills requirements would be useful in helping them to decide what jobs to apply for in the future, with 25% saying it would be very useful and 32% saying it would be fairly useful. Only 16% say this would not be useful, 10% that it would not be very useful and 6% that it would not be at all useful. In all Member States with one exception the Netherlands a majority of respondents believe that receiving information would be useful in helping them decide what jobs to apply for in the future. The countries where the highest proportions agree with this statement are Spain (80%), Slovakia (77%) and Slovenia (69%). But in the Netherlands, only 44% of respondents think this kind of information would be useful, and relatively few people in France (50%) and Luxembourg (51%) agree. In the Netherlands 28% say that this kind of information is not useful. The highest proportions of respondents say that this does not apply to them in Portugal (37%) and Malta (34%). 54 QA31: How useful or not would it be to you personally to receive information about what skills are likely to be needed in the future job market 1. for deciding what jobs to apply for in the future? 2. for deciding what training courses to attend? Very useful; fairly useful; not very useful; not at all useful; not concerned\ Not applicable (SPONTANEOUS); don t know. 145
147 QA31 How useful or not would it be to you personally to receive information about what skills are likely to be needed in the future job market, for? - Total 'Useful' Deciding what training courses to attend Deciding what jobs to apply for in the future EU27 58% 57% BE 53% 54% BG 56% 62% CZ 64% 68% 58% 56% DE 58% 56% EE 65% 64% IE 62% 61% EL 59% 60% ES 82% 80% FR 51% 50% IT 58% 58% CY 64% 64% LV 67% 68% LT 55% 58% LU 55% 51% HU 59% 60% MT 55% 53% NL 46% 44% AT 60% 58% PL 56% 55% PT 47% 49% RO 56% 59% SI 68% 69% SK 72% 77% FI 51% 53% SE 58% 52% UK 53% 52% Highest percentage per country Highest percentage per item Lowest percentage per country Lowest percentage per item 146
148 The national results are very similar on the question of whether information about future skills requirements would be useful when deciding what training courses to attend. Spain (82%) again has the highest proportion people who think this would be useful, followed as before by Slovakia (72%) and Slovenia (68%). The Netherlands (46%) and Portugal (47%) have the fewest respondents who think this kind of information would be useful to them. The Netherlands (26%) again has the most people saying it would not be useful, with Lithuania (24%) as before registering the most respondents saying this does not apply to them, followed this time by Finland (33%). A socio-demographic analysis reveals very little difference between responses for the two items. It also shows that: Younger respondents are more likely to find the information useful for both purposes, with respondents progressively finding the information less useful the older they get. Respondents who spent more time in education are more likely to find the information useful for both purposes. People who live in larger households would find the information more useful for both purposes than those who live alone or with just one other person. Unemployed people would find this information more useful for both purposes than all other occupational groups. People who have difficulty paying their bills almost all the time or sometimes are more likely to find the information useful than those who almost never have difficulty paying their bills. The greater an individual s concern about losing his or her job, the more likely they are to be interested in this information. 147
149 QA31 How useful or not would it be to you personally to receive information about what skills are likely to be needed in the future job market, for? '- Total 'Useful' Deciding what training courses to attend Deciding what jobs to apply for in the future EU27 58% 57% Sex Male 60% 59% Female 57% 56% Age % 81% % 74% % 63% % 32% Education (End of) 15-40% 41% % 58% % 61% Still studying 83% 85% Household composition 1 44% 45% 2 49% 47% 3 69% 68% 4+ 70% 70% Respondent occupation scale Self-employed 64% 60% Managers 68% 63% Other white collars 72% 72% Manual workers 70% 68% House persons 55% 53% Unemployed 73% 75% Retired 25% 26% Students 83% 85% Difficulties paying bills Most of the time 64% 64% From time to time 64% 64% Almost never 55% 54% Concerned about losing job Concerned 74% 73% Moderately 70% 69% Not really or not at all concerned 66% 62% 148

, a fund to help victims of globalisation, and secondly whether they had ever")
150 9. PERCEPTIONS OF EU EMPLOYMENT AND SOCIAL POLICIES 9.1 Familiarity with the European Social Fund and European Globalisation Adjustment Fund - Awareness of the European Social Fund has risen since mid In this final section respondents were asked about their awareness of the EU and its activities in the areas of employment and social policy. They were asked first whether they had ever heard of, or read about, the European Globalisation Adjustment Fund (EGF), a fund to help victims of globalisation, and secondly whether they had ever heard of, or read about, the European Social Fund (ESF) 55. The results show that overall awareness of the ESF is higher than for the EGF. While 45% of respondents say they have heard of the ESF, with 11% saying they know what it is and 34% saying they have heard of it but don t really know what it is, only 29% have heard of the EGF, with 6% saying they know what it is and 23% saying they have heard of it but don t really know what it is. 53% of people say they have never heard of the ESF, whereas 68% have never heard of the EGF. Awareness of the ESF has grown since June 2010, when 40% of respondents said they had heard of it (trend analysis is not possible for the EGF). There is a considerable difference between the level of awareness of the two funds in the euro-zone and outside it. While 33% of people in the euro-zone have heard of the EGF and 49% have heard of the ESF, only 22% of people outside the euro-zone have heard of the EGF and only 38% have heard of the ESF. 55 QA3: Have you ever heard or read about 1. The European Globalisation Fund (EGF) that is a fund to help victims of globalisation. 2. The European Social Fund (ESF)? Yes, and you know what they are; yes, but you don t really know what they are; no, you have never heard or read about it; don t know. 149
, Luxembourg (11%), Austria and Cyprus (both 10%).")

, Luxembourg (19%), Poland and Italy")
151 Over a third of respondents say they have heard of the EGF in seven Member States, led by Finland (49%), Slovakia (43%) and Italy (42%). In four countries, 10% or more have both heard of it and know what it is: Italy (12%), Luxembourg (11%), Austria and Cyprus (both 10%). Relatively few respondents have heard of it in Denmark (12%) and the UK (14%). By contrast, in all but two Member States at least a third of respondents have heard of the ESF, and in some cases quite high proportions have done so, notably in Slovakia (67%), Portugal (64%) and Latvia (60%). The proportion of respondents who say they know what the ESF is reaches or exceeds 15% in Portugal (21%), Luxembourg (19%), Poland and Italy (both 17%), Slovakia (16%), Cyprus, Spain and Greece (15%). Awareness is again relatively low in Denmark (19%), however, as well as in Sweden (23%). 150
, Finland (55%, +13 points),")
, Lithuania (44%, -6 points), Malta (49%, -3 points) and Spain (53%, -3 points).")
152 Since mid , awareness of the ESF has risen in 20 countries, remained stable in three, and fallen in four. In six Member States, there have been double-digit rises in the proportions of people saying that they have heard of the European Social Fund: Slovakia (67%, +14 points), Finland (55%, +13 points), Germany (45%, +12 points), Romania (39%, +12 points), Bulgaria (41%, +11 points) and Estonia (52%, +11 points). However, falls were registered in Belgium (34%, -8 points), Lithuania (44%, -6 points), Malta (49%, -3 points) and Spain (53%, -3 points). Spain also saw a relatively large fall in the number of people saying they have both heard of the ESF and know what it is (15%, -10 points). But in many countries a rise in the number of respondents saying that they have heard of the ESF but don t really know what it is was accompanied by a fall in the number who have never heard of it. 56 Special Eurobarometer 350: The European Social Fund. June
153 Socio-demographic analysis shows that: Men are marginally more likely than women to say that they have heard of the EGF, by 31% to 27%, and also the ESF, by 48% to 43%. Respondents in the age bracket are more likely to have heard of both funds than those in the other three age groups. Respondents who left education at 20 or over are more likely to have heard of both funds than those who left school at a younger age. They are also more likely to say that they know what the two funds are. While 40% of managers have heard of the EGF and 61% have heard of the ESF, only 20% of unemployed people have heard of the EGF, and 40% of the ESF. Individuals who almost never have trouble paying their bills demonstrate a higher level of awareness of both funds than those who have financial difficulties sometimes or most of the time. 152
154 QA3 Have you ever heard or read about? The European Social Fund (ESF) The European Globalisation Adjustment Fund (EGF) that is a fund to help victims of globalisation Yes, and you know what they are Yes, but you don t really know what they are No, you have never heard or read about it Total 'Yes' Yes, and you know what they are Yes, but you don t really know what they are No, you have never heard or read about it Total 'Yes' EU27 11% 34% 53% 2% 45% 6% 23% 68% 3% 29% Sex Male 12% 36% 50% 2% 48% 8% 23% 66% 3% 31% Female 10% 33% 55% 2% 43% 5% 22% 70% 3% 27% Age % 30% 60% 2% 38% 4% 20% 73% 3% 24% % 36% 50% 2% 48% 7% 22% 69% 2% 29% % 37% 48% 2% 50% 9% 24% 65% 2% 33% % 33% 55% 2% 43% 6% 23% 68% 3% 29% Education (End of) 15-6% 29% 62% 3% 35% 4% 18% 75% 3% 22% % 35% 54% 2% 44% 6% 22% 69% 3% 28% % 38% 43% 1% 56% 11% 26% 61% 2% 37% Still studying 10% 32% 56% 2% 42% 5% 22% 70% 3% 27% Respondent occupation scale Self-employed 20% 38% 40% 2% 58% 12% 26% 59% 3% 38% Managers 18% 43% 38% 1% 61% 11% 29% 59% 1% 40% Other white collars 15% 38% 45% 2% 53% 9% 26% 63% 2% 35% Manual workers 9% 34% 55% 2% 43% 5% 22% 70% 3% 27% House persons 8% 28% 61% 3% 36% 3% 20% 74% 3% 23% Unemployed 9% 31% 59% 1% 40% 4% 16% 78% 2% 20% Retired 8% 32% 58% 2% 40% 5% 22% 70% 3% 27% Students 10% 32% 56% 2% 42% 5% 22% 70% 3% 27% Difficulties paying bills Most of the time 9% 30% 58% 3% 39% 4% 19% 74% 3% 23% From time to time 9% 34% 54% 3% 43% 6% 22% 69% 3% 28% Almost never 12% 35% 51% 2% 47% 7% 23% 68% 2% 30% 153
, and second social policy (e.g. fighting poverty and social exclusion, helping to modernise social protection systems).")
155 9.2 Impact of the EU on employment and social policy - A majority of Europeans think that the EU s employment and social policies have a positive impact - All Europeans were asked to say whether they thought the EU has a positive or negative impact in two important areas of public policy 57, first employment policy (e.g. helping people in finding a job), and second social policy (e.g. fighting poverty and social exclusion, helping to modernise social protection systems). There is very little difference in opinion regarding these two policy areas. A majority (52%) think that the EU has a positive impact on employment policy, with 14% saying it has a very positive impact and 38% that it has a fairly positive impact; while a similar majority (51%) think that the EU has a positive impact on social policy with 13% saying it has a very positive impact and 38% a fairly positive impact. Just under a third (32%) think the EU has a negative impact on employment policy, with 24% saying it has a fairly negative impact and 8% a very negative impact; and just over a third (34%) think the EU has a negative impact on social policy, with 25% saying it has a fairly negative impact and 9% a very negative impact. Respondents in the NMS12 countries are more likely to view the EU in a positive light here than those in the EU15: while 61% think the EU has a positive impact on employment policy and 58% think it has a positive impact on social policy, these figures fall to just 51% and 49% in the EU15. There are no such differences between responses in the euro-zone and non-euro countries, however. 57 QA17 Please tell me to what extent you think the EU has, overall, a positive or negative impact in the following areas in (OUR COUNTRY). 1. Employment policy (e.g. helping people in finding a job). 2. Social policy (e.g. fighting poverty and social exclusion, helping to modernise social protection systems) Very positive impact; fairly positive impact; fairly negative impact; very negative impact; don t know. 154
156 On employment policy a majority of respondents in 17 Member States think that the EU has a positive impact. The level of approval is highest in Slovakia (74%), Estonia (71%) and Poland (68%), and lowest in France (30%), Portugal (35%) and Spain (41%). Greece registers the highest proportion of respondents who think the EU has a very positive impact (24%), while Cyprus has the most who think it has a very negative impact (22%). 155
 and Estonia (66%), this time followed by Austria (62%).")
157 On social policy, a majority of respondents in 17 Member States again think that the EU has a positive impact. These are the same 17 countries, except that Cyprus replaces Greece. The level of approval is again highest in Slovakia (71%) and Estonia (66%), this time followed by Austria (62%). As in the case of employment policy, approval is lowest in France (32%), followed this time by Sweden (37%), Denmark (38%) and Portugal (38%). Greece again registers the highest proportion of respondents who think the EU has a very positive impact (23%), while also having the most who think its impact is very negative (26%). 156
158 The socio-demographic data show that: Men are slightly more likely than women to think that the EU has a positive impact on both employment policy (by a margin of 54% to 52%) and social policy (by a margin of 53% to 49%). Approval of the EU s impact on employment and social policies diminishes gradually with the respondents' age, with the age group the most likely to think this impact is positive, and the 55+ the least likely. Approval is highest among respondents who spent longer in education, and lowest among those who left at 15 or under. Approval of the EU s impact on these policies is relatively high among selfemployed people, managers and other white collar workers, and relatively low among retired and unemployed people and manual workers. People who almost never have difficulty paying their bills are more likely to think that the EU has a positive impact on these policies than those who almost always have financial difficulties. Similarly, those who place themselves at the top of the social scale are more positive about the EU s policy impact. While 64% of people who are optimistic about the employment situation in two years time think that the EU has a positive impact on employment policy, this declines to only 49% of those who are pessimistic. The results are very similar for social policy (62% to 48%). 157
159 QA17 Please tell me to what extent you think the EU has, overall, a positive or negative impact in the following areas in (OUR COUNTRY). Social policy (e.g. fighting poverty and social exclusion, helping to modernise social protection systems) Employment policy (e.g. helping people in finding a job) Total Positive impact' Total 'Negative impact' Total Positive impact' Total 'Negative impact' EU27 51% 34% 15% 52% 32% 16% Sex Male 53% 35% 12% 54% 33% 13% Female 49% 33% 18% 52% 30% 18% Age % 24% 17% 61% 23% 16% % 33% 14% 55% 31% 14% % 38% 13% 51% 35% 14% % 36% 17% 49% 33% 18% Education (End of) 15-45% 37% 18% 46% 37% 17% % 35% 15% 52% 33% 15% % 34% 12% 56% 30% 14% Still studying 63% 21% 16% 65% 19% 16% Respondent occupation scale Self-employed 55% 32% 13% 58% 29% 13% Managers 54% 34% 12% 56% 30% 14% Other white collars 55% 33% 12% 57% 30% 13% Manual workers 49% 37% 14% 49% 37% 14% House persons 47% 34% 19% 51% 30% 19% Unemployed 49% 36% 15% 48% 37% 15% Retired 47% 35% 18% 49% 33% 18% Students 63% 21% 16% 65% 19% 16% Difficulties paying bills Most of the time 44% 39% 17% 46% 38% 16% From time to time 51% 34% 15% 53% 32% 15% Almost never 52% 33% 15% 54% 31% 15% Self-positioning on the staircase Low (1-4) 44% 38% 18% 47% 36% 17% Medium (5-6) 51% 34% 15% 52% 33% 15% High (7-10) 56% 31% 13% 58% 28% 14% Employment situation in 2 years Optimistic 62% 25% 13% 64% 23% 13% Pessimistic 48% 38% 14% 49% 36% 15% 158
160 - A majority think that the EU has a positive impact on eight of 10 policy areas - Respondents were then asked to give their opinion of the impact of the EU in 10 specific policy areas 58. Overall, results range from 70% to 48% positive impact, demonstrating that European public opinion generally sees the impact of the EU as positive. The EU is thought have the most positive impact on making it easier for people to work in different EU Member States (70%), followed by improving access to education and training (67%). 59% of respondents believe that the EU has a positive impact on making it easier for people to start their own business, while 58% think it has a positive impact on setting minimum standards for working conditions throughout the EU. Majorities also think the impact is positive in terms of exchanging best practices in employment policies among EU Member States (56%), creating new job opportunities and fighting unemployment (55%), fighting against social exclusion and poverty (55%), and promoting dialogue between employers and trade unions (50%). However just under half the respondents think that the EU s impact is positive in coordinating the reform of the national social protection systems (49%) and reducing regional differences in unemployment (48%). 58 QA18: More specifically, please tell me to what extent you think the EU has a positive or negative impact on each of the following employment and social policies. Very positive impact; fairly positive impact; fairly negative impact; very negative impact; don t know. 159


161 Respondents to the 2009 survey were asked about eight out of these 10 issues (the exceptions being making it easier for people to work in different EU Member States and making it easier for people to start their own business ), making trend analysis possible for these criteria. One item was slightly modified: Reducing regional disparities in unemployment becomes reducing regional differences in unemployment in the current survey. On all counts there has been a substantial fall in the number of people who think that the EU has a positive impact. In 2009, 78-62% said the EU had a positive impact on the eight issues; now, the range is 67-48%. The fall is greatest in respect of creating new job opportunities and fighting unemployment (-17 points), and least for exchanging best practices in employment policies among EU Member States (-10 points). 160
162 On all ten issues, there is a marked distinction between the overall opinion of EU15 and NMS12 respondents (though not between euro-zone and non-euro area respondents), with the NMS12 taking a more positive view in all cases. The widest variations emerge on the question of creating new job opportunities and fighting unemployment, where 67% in the NMS12, but only 52% in the EU15, say the EU s impact is positive; and on the issue of reducing regional differences in unemployment, where 58% of respondents in the NMS12 believe that the EU has a positive impact, falling to only 45% in the EU15. Several Member States consistently register a high proportion of respondents who consider that the EU has a positive impact on these policies. Slovakia has the most people who think the EU s impact is positive on five out of these 10 measures, as well as above-average numbers for the others. Estonia, Malta and the Netherlands also consistently have relatively very high numbers of respondents who say the EU has a positive impact. At the other end of the scale, Portugal has the lowest proportion of respondents who think the EU s impact is positive on five out of the 10 measures, as well as below-average numbers for the remaining five. France, Spain and the UK also have a consistently low number of respondents who believe that the EU has a positive impact. A trend analysis shows that in most countries, on most questions, fewer people now think the EU has a positive impact. In Spain, Greece, Portugal and Cyprus especially, public perceptions of the EU s ability to make a positive impact have deteriorated dramatically. Only in Slovenia, Slovakia, Latvia and Hungary has the public s view of the EU s ability to make a positive impact held up, or increased, on certain issues: Setting minimum standards for working conditions throughout the EU: fewer people think the EU has a positive impact than in 2009, except in Slovenia (+1 point). The change was largest in Spain (-26 points), Portugal (-21 points), Greece (-20 points) and Italy (-20 points). Creating new job opportunities and fighting unemployment: fewer people think the EU has a positive impact in all Member States. The largest falls occurred in Spain (- 40 points), Cyprus (-31 points), Greece (-29 points), Portugal (-25 points) and France (- 20 points). 161
, Greece (-26 points), Cyprus (-24 points) and Lithuania (-20 points).")
163 Reducing regional differences in unemployment: fewer respondents think the EU has a positive impact in all Member States. The falls were largest in Spain (-36 points), Greece (-26 points), Cyprus (-24 points) and Lithuania (-20 points). Exchanging best practices in employment policies among EU Member States: more people think the EU has a positive impact in Slovenia (+6 points) and Slovakia (+3 points), while opinion is stable in Hungary and Latvia. In the other 23 Member States, fewer respondents think the EU has a positive impact than did so in 2009, most notably in Spain (-31 points), Greece (-19 points) and Portugal (-16 points). Improving access to education and training: more people think the EU has a positive impact in Latvia (+4 points), Bulgaria (+2 points), Slovenia (+2 points) and Slovakia (+2 points). In the other 23 Member States, fewer respondents think the EU has a positive impact than did so in 2009, in particular in Spain (-29 points), Greece (-20 points), Portugal (-17 points) and Denmark (-16 points). 162
164 Promoting dialogue between employers and trade unions: opinion has remained stable in Hungary, but has fallen in all other countries. The largest falls were registered in Spain (-36 points), Greece (-30 points) and Cyprus (-23 points). Fighting against social exclusion and poverty: fewer respondents think the EU has a positive impact in all Member States. The falls were largest in Spain (-35 points), Greece (-30 points), Cyprus (-21 points), France and Portugal (-19 points). Coordinating the reform of national social protection systems: fewer respondents think the EU has a positive impact in all Member States. The falls were largest in Spain (- 33 points), Greece (-32 points), Cyprus (-21 points). 163
165 Improving access to education and training - Sept-Oct May-June 2009 Setting minimum standards for working conditions throughout the EU QA18 More specifically, please tell me to what extent you think the EU has a positive or negative impact on each of the following employment and social policies. Total 'Positive impact' - Sept-Oct May-June 2009 Exchanging best practices in employment policies among EU Member States - Sept-Oct May-June 2009 Fighting against social exclusion and poverty - Sept-Oct May-June 2009 Creating new job opportunities and fighting unemployment - Sept-Oct May-June 2009 Promoting dialogue between employers and trade unions - Sept-Oct May-June 2009 Coordinating the reform of the national systems of social protection (pensions, healthcare, etc.) - Sept-Oct May-June 2009 Reducing regional differences in unemployment EU27 67% % % % % % % % -15 BE 79% -6 67% -7 69% -1 63% -9 66% % % -9 58% -8 BG 77% +2 69% -4 67% -4 63% -9 68% -6 61% -4 57% % -11 CZ 79% -7 60% -8 66% -7 58% % % -8 51% % % % -4 60% -6 56% -8 51% % % -8 44% -10 DE 77% -5 67% -6 65% -7 65% % % -7 53% % -14 EE 84% -2 64% -2 73% -3 69% -8 74% -8 67% % -9 65% -6 IE 72% -5 69% -5 57% -7 56% % % % % -13 EL 62% % % % % % % % -26 ES 58% % % % % % % % -36 FR 55% % % % % % % % -14 IT 69% % % -9 64% % % % % -16 CY 85% % % % % % % % -24 LV 79% +4 54% -6 59% = 46% % % % -9 39% -15 LT 66% % -8 58% -5 59% % % % % -20 LU 73% -3 53% -2 59% -1 55% -4 50% -9 42% % -7 37% -7 HU 72% -4 64% -1 63% = 59% -5 62% -6 61% = 54% -6 56% -8 MT 87% -7 65% -9 53% -7 74% -9 74% % % % -6 NL 83% -2 65% -2 76% -4 72% -8 72% -8 65% % -1 61% -4 AT 73% % -4 70% -1 62% % -9 59% % -3 61% -6 PL 75% -7 63% % -7 60% -9 67% % % % -12 PT 54% % % % % % % % -19 RO 71% -7 68% -6 59% % % -8 58% % % -10 SI 77% +2 65% +1 64% +6 56% -3 59% -5 52% -7 55% -3 53% -4 SK 86% +2 74% -1 75% +3 70% -4 81% -4 66% -2 65% -6 71% -6 FI 80% -4 67% -3 68% -5 61% -9 65% -9 62% -6 56% % -12 SE 68% -6 54% -4 65% -4 47% % % % % -12 UK 53% % -6 44% -5 45% -9 42% % % -8 37% -8 - Sept-Oct May-June
166 The socio-demographic analysis confirms the pattern identified previously for general assesments of the impact of the EU on employment and social policies. It shows that: Men are slightly more likely than women to think that the EU has a positive impact on all 10 items, by a margin of between 2 and 5 points. Younger respondents are the most likely to think that the EU has a positive impact. Those who spent longer in education consistently say that the EU has a positive impact on these policies. People who live in large towns are the most likely to think that the EU has a positive impact. Managers, other white collar workers and self-employed people generally have the most positive opinion of the EU s influence, while house persons, unemployed people and retired respondents tend to have the least positive view. People who almost never have difficulty paying their bills consistently believe that the EU has a more positive impact than people who have financial difficulties sometimes or most of the time. Respondents who are optimistic about the employment situation in two years time are more likely to feel that the EU has a positive impact than people who are pessimistic about the employment situation. 165
167 QA18 More specifically, please tell me to what extent you think the EU has a positive or negative impact on each of the following employment and social policies. '-Total 'Positive impact' Making it easier for people to work in different EU Member States Improving access to education and training Making it easier for people to start their own business Setting minimum standards for working conditions throughout the EU Exchanging best practices in employment policies among EU Member States Fighting against social exclusion and poverty Creating new job opportunities and fighting unemployment Promoting dialogue between employers and trade unions Coordinating the reform of the national systems of social protection (pensions, healthcare, etc.) Reducing regional differences in unemployment EU27 70% 67% 59% 58% 56% 55% 55% 50% 49% 48% Sex Male 73% 69% 61% 60% 59% 57% 57% 51% 50% 49% Female 68% 65% 57% 55% 54% 53% 54% 49% 47% 47% Age % 74% 65% 62% 59% 61% 60% 54% 53% 54% % 69% 61% 62% 61% 57% 57% 52% 52% 50% % 67% 60% 58% 57% 53% 56% 49% 47% 47% % 63% 56% 53% 52% 52% 52% 48% 46% 46% Education (End of) 15-61% 58% 52% 47% 46% 49% 49% 46% 44% 41% % 66% 58% 57% 55% 53% 55% 50% 49% 48% % 73% 65% 64% 65% 59% 59% 51% 51% 52% Still studying 78% 77% 68% 67% 64% 65% 64% 55% 55% 57% Subjective urbanisation Rural village 69% 65% 58% 55% 54% 52% 54% 48% 47% 46% Small/ Mid-size town 70% 68% 59% 56% 57% 55% 55% 51% 49% 49% Large town 73% 70% 63% 63% 60% 58% 58% 53% 51% 51% Respondent occupation scale Self-employed 78% 71% 67% 62% 61% 60% 60% 54% 54% 52% Managers 79% 72% 61% 66% 66% 59% 58% 50% 49% 51% Other white collars 73% 70% 63% 61% 60% 57% 59% 53% 51% 51% Manual workers 69% 67% 59% 58% 56% 53% 55% 51% 48% 47% House persons 63% 63% 55% 47% 46% 52% 55% 47% 47% 45% Unemployed 69% 66% 55% 54% 54% 52% 50% 50% 48% 44% Retired 66% 62% 55% 52% 50% 51% 52% 47% 46% 46% Students 78% 77% 68% 67% 64% 65% 64% 55% 55% 57% Difficulties paying bills Most of the time 62% 59% 52% 49% 48% 47% 48% 45% 43% 41% From time to time 66% 65% 58% 56% 54% 54% 55% 50% 48% 49% Almost never 74% 69% 61% 60% 59% 57% 57% 50% 50% 49% Employment situation in 2 years Optimistic 77% 75% 70% 67% 67% 66% 66% 59% 59% 57% Pessimistic 69% 65% 56% 55% 54% 52% 53% 47% 45% 45% 166
168 CONCLUSION Europe is going through difficult times, with massive pressures on its economies. With the EU again facing grave economic challenges after signs of a recovery in 2010, it is unsurprising that Europeans are still concerned about the possible implications of the ongoing economic turmoil on their own prospects and those of the people close to them. But the widespread gloom about society as a whole and about the likelihood that the economic crisis well end quickly has not translated into a crisis of confidence when it comes to the way in which most respondents view their own prospects. More people in 2011 are confident that they will keep their job than in 2009, two-thirds remain confident that they will have a job in two years time, and over 60% say that they would be likely to find another job relatively quickly in the event of redundancy. Citizens are most acutely worried about their jobs in Spain (72%), in Greece (63%) and in Lithuania (61%). When asked how they would respond to redundancy, overall 35% of respondents currently working say they would consider starting their own business. Administrative procedures are not widely seen as an obstacle to starting a business; 74% of people who are interested in doing so say they would know how to go about it from an administrative standpoint. Several groups in society, such as people with a disability and young people just leaving education, are generally acknowledged to face additional barriers to starting their own business. A very large majority of Europeans think that the economic crisis has had a negative impact on fairness and social justice, most respondents arguing that the burden is not being equally shared across the whole of society, and that the poorest in society are suffering the most. Furthermore, close to nine respondents in ten believe that poverty has increased over the last three years (more than thought so in mid-2010). In Greece and Spain there is a near-unanimous sense that poverty has increased, though in Latvia substantially fewer people think poverty has risen than thought so in Generally, European citizens do not believe that enough is being done to fight poverty nationally, though the differences between countries are again very wide. Europeans generally consider that the impact of the EU on employment and social policies in their country is beneficial: 52% say it has a positive impact on employment policy and 51% on social policy (the most positive country is Slovakia with 74% and 71%). These figures rise considerably when addressing specific issues. 70% think the EU plays a positive role in making it easier for people to work in different EU Member States, 67% in improving access to education and training, 59% in making easier for people to start their own business, and 58% in setting minimum standards for working conditions throughout the EU. For tackling social and employment challenges, there is widespread support people for the concept of flexicurity and measures such as regular training to improve job prospects. However half of the respondents disagree that many people retire too early. 167
169 Beneath the EU-wide average lie great differences between Member States. Confidence and optimism are far higher in some Member States than in others. Faith in the EU s ability to make a positive impact clearly fell in those countries which were worst hit by the crisis - notably Spain, Greece and Portugal. In Spain, the most extreme example, the proportion of respondents saying that the EU is having a positive impact on the creation of new job opportunities and fighting unemployment is much lower than in 2009 (44%, - 40 points). There is a general appetite for more and better information about the future job market: 57-58% of respondents would like to receive information about future skills requirements that would help them to take decisions about the kind of job to apply for in the future and about the training courses they might attend. More than a third of the respondents spontaneously report that they received no career guidance at school. Such guidance can be effective, as 33% believe that it helped them to acquire the skills they needed for the type of job they wanted. There is also a majority view that personal experience and qualification levels are the most important assets to be emphasised by job seekers when searching for work. While close to a quarter of Europeans have participated in a training course over the past 12 months, the numbers of people taking such courses varies considerably from country to country, from the 56% who participated in training during the last year in Sweden to the 6% who did so in Greece. But training generally appears to be useful: two-thirds of people who have attended a training course within the last two years believe that the experience would be helpful should they need to find a new job, although only 30% of people in work think they ought to take a training course to help them keep their job. Affordability remains the biggest barrier to participation in training. A third of respondents (34%) say they completed a traineeship during or immediately after their education, though the extent to which people take traineeships varies greatly from one Member State to another. Of all those who took a traineeship, 44% say it helped them to find a permanent job, while just over a quarter say that it did not. In terms of EU funds, the survey results make it clear that in delivering its social and employment policies, the EU must focus on effectively targeting its ESF (European Social Fund) and EGF (European Globalisation Adjustment Fund) to bring fresh hope in countries with stubbornly high levels of unemployment. Almost half of Europeans (45%) are aware of the European Social Fund (ESF) (+5% since mid-2010). The ESF is best known in Slovakia (67%), Portugal (64%) and Latvia (60%) and least known in Denmark (19%). Overall, more Europeans are familiar with the ESF than was the case two years ago. Recognition of EGF at EU level is somewhat lower (29%). Overall, the survey results show that European citizens welcome the EU s efforts to tackle the problems facing Europe now and in the imminent future. 168
170 ANNEXES
171 TECHNICAL SPECIFICATIONS
172 Employment and Social Policy (ESP) TECHNICAL SPECIFICATIONS Between the 24th of September and the 9th of October 2011, TNS Opinion & Social, a consortium created between TNS plc and TNS opinion, carried out the wave of the EUROBAROMETER, on request of the EUROPEAN COMMISSION, Directorate-General for Communication, Research and Speechwriting. The SPECIAL EUROBAROMETER 377 is part of wave and covers the population of the respective nationalities of the European Union Member States, resident in each of the Member States and aged 15 years and over. The basic sample design applied in all states is a multi-stage, random (probability) one. In each country, a number of sampling points was drawn with probability proportional to population size (for a total coverage of the country) and to population density. In order to do so, the sampling points were drawn systematically from each of the "administrative regional units", after stratification by individual unit and type of area. They thus represent the whole territory of the countries surveyed according to the EUROSTAT NUTS II (or equivalent) and according to the distribution of the resident population of the respective nationalities in terms of metropolitan, urban and rural areas. In each of the selected sampling points, a starting address was drawn, at random. Further addresses (every Nth address) were selected by standard "random route" procedures, from the initial address. In each household, the respondent was drawn, at random (following the "closest birthday rule"). All interviews were conducted face-to-face in people's homes and in the appropriate national language. As far as the data capture is concerned, CAPI (Computer Assisted Personal Interview) was used in those countries where this technique was available.


173 ABBREVIA -TIONS COUNTRIES INSTITUTES N INTERV IEWS FIELDWORK DATES POPULATION 15+ BE Belgium TNS Dimarso /09/ /10/ BG Bulgaria TNS BBSS /09/ /10/ CZ Czech Rep. TNS Aisa /09/ /10/ Denmark TNS Gallup /09/ /10/ DE Germany TNS Infratest /09/ /10/ EE Estonia Emor /09/ /10/ IE Ireland Ipsos MRBI /09/ /10/ EL Greece TNS ICAP /09/ /10/ ES Spain TNS Demoscopia /09/ /10/ FR France TNS Sofres /09/ /10/ IT Italy TNS Infratest /09/ /10/ CY Rep. of Cyprus Synovate /09/ /10/ LV Latvia TNS Latvia /09/ /10/ LT Lithuania TNS Gallup Lithuania /09/ /10/ LU Luxembourg TNS ILReS /09/ /10/ HU Hungary TNS Hoffmann Kft /09/ /10/ MT Malta MISCO /09/ /10/ NL Netherlands TNS NIPO /09/ /10/ Österreichisches Gallup- 24/09/2011 AT Austria Institut /10/ PL Poland TNS OBOP /09/ /10/ PT Portugal TNS EUROTESTE /09/ /10/ RO Romania TNS CSOP /09/ /10/ SI Slovenia RM PLUS /09/ /10/ SK Slovakia TNS Slovakia /09/ /10/ FI Finland TNS Gallup Oy /09/ /10/ SE Sweden TNS GALLUP /09/ /10/ UK United Kingdom TNS UK /09/ /10/ TOTAL EU /09/ /10/ For each country a comparison between the sample and the universe was carried out. The Universe description was derived from Eurostat population data or from national statistics offices. For all countries surveyed, a national weighting procedure, using marginal and intercellular weighting, was carried out based on this Universe description. In all countries, gender, age, region and size of locality were introduced in the iteration procedure. For international weighting (i.e. EU averages), TNS Opinion & Social applies the official population figures as provided by EUROSTAT or national statistic offices. The total population figures for input in this post-weighting procedure are listed above. Readers are reminded that survey results are estimations, the accuracy of which, everything being equal, rests upon the sample size and upon the observed percentage. With samples of about 1,000 interviews, the real percentages vary within the following confidence limits: Observed percentages 10% or 90% 20% or 80% 30% or 70% 40% or 60% 50% Confidence limits ± 1.9 points ± 2.5 points ± 2.7 points ± 3.0 points ± 3.1 points
174 QUESTIONNAIRE
175 QA1 And thinking about the current economic crisis and its potential impact on the job-market, how would you rate your concern, if at all, about each of the following? Please use a scale from 1 to 5 where '1' means that you are "no at all concerned", and '5' that you are "very concerned". (SHOW CARD WITH SCALE ONE ANSWER PER LINE) (READ OUT) 1 Not at all conc erne d Very conc erne d 6 7 Not appli cabl e (SP ONT ANE OUS ) 1 (ASK ONLY IF "CURRENTLY WORK", CODE TO 18 IN D15a) You losing your job (M) 2 Your partner (spouse, etc.) losing their job Your children losing their job QB2 TREND SLIGHTLY MODIFIED QA2 Please tell me to what extent you agree or disagree with the following statement: In two years, the crisis will be over and the employment situation in (OUR COUNTRY) will be better than today. (READ OUT ONE ANSWER ONLY) Totally agree Tend to agree Tend to disagree Totally disagree NEW Questionnaire762 1/16 7/11/2011
176 QA3 Have you ever heard or read about? (SHOW CARD WITH SCALE ONE ANSWER PER LINE) (READ OUT) Yes, and you are very familiar with it Yes, but you are not very familiar with it No, you have never heard or read about it (M) 1 2 The European Globalisation Adjustment Fund (EGF) that is a fund to help victims of globalisation The European Social Fund (ESF) QB4 TREND MODIFIED QA4 How many times have you changed employer in your working life so far? (DO NOT COUNT VACATION JOBS WHILE IN FULL-TIME EDUCATION) (IF "" CODE '99' - IF "NEVER HAD ANY PAID WORK" CODE '98') QD4 times QA5 For how long have you been working for your current employer or last employer if you are not currently working? (IF "" CODE '99' IF "NEVER HAD ANY PAID WORK" CODE '98' IF "LESS THAN 1 YEAR" CODE 00 ) QD5 years QA6 In your opinion, which two assets should one emphasize in order to easily find a job today? (SHOW CARD READ OUT MAX. 2 ANSWERS) Level of one s qualifications Professional experience Language skills Computer skills Ability to adapt Willingness to work abroad Other (SPONTANEOUS) None (SPONTANEOUS) (M) 1, 2, 3, 4, 5, 6, 7, 8, 9, QD6 Questionnaire762 2/16 7/11/2011
177 ASK QA7 IF "CURRENTLY WORK", CODE 5 TO 18 IN D15a OTHERS GO TO QA8 QA7 How confident would you say you are in your ability to keep your job in the coming months? Are you? (READ OUT ONE ANSWER ONLY) Very confident Fairly confident Not very confident Not at all confident QA40 ASK ALL QA8 Would you say that you are very confident, fairly confident, not very confident or not at all confident in having a job in 2 years time? (ONE ANSWER ONLY) Very confident Fairly confident Not very confident Not at all confident Not looking for a job in 2 years (SPONTANEOUS) QD8 ASK QA9 TO QA12 IF "CURRENTLY WORK", CODE 5 TO 18 IN D15a OTHERS GO TO QA13 QA9 If you were to be laid-off, how would you rate on a scale of 1 to 10, the likelihood of you finding a job in the next six months? '1' means that it "would be not at all likely" and '10' means that it "would be very likely". (READ OUT) 1 Not at all likely 10 Very likely QD14 Questionnaire762 3/16 7/11/2011
178 QA10 If you were to be laid-off, how would you find a job? (SHOW CARD READ OUT MAX. 2 ANSWERS) (M) By applying for the same kind of job, in the same location, but for another employer By applying for the same kind of job but in a different location By applying for a completely different kind of job in the same location By applying for a completely different kind of job in another location By starting your own business without employees (N) By starting your own business with employees (N) Other (SPONTANEOUS) 1, 2, 3, 4, 5, 6, 7, 8, QD15 TREND MODIFIED ASK QA11 IF "WOULD NOT START OWN BUSINESS", NO CODE 5 AND 6 IN QA10 OTHERS GO TO QA12 QA11 Would you consider starting your own business if you were to lose your job? (READ OUT ONE ANSWER ONLY) Yes, definitely Yes, probably No, probably not No, definitely not NEW ASK QA12 IF "WOULD START OWN BUSINESS", CODE 5 OR 6 IN QA10 OR CODE 1 OR 2 IN QA11 OTHERS GO TO QA13 QA12 Would you know how to start a new business in terms of administrative procedures? (READ OUT ONE ANSWER ONLY) Yes, definitely Yes, probably No, probably not No, definitely not NEW Questionnaire762 4/16 7/11/2011
179 ASK ALL QA13 Please tell me to what extent do you agree or disagree that it is more difficult for the following types of people than for others to start their own business. (SHOW CARD WITH SCALE ONE ANSWER PER LINE) (READ OUT ROTATE) Totally agree Tend to agree Tend to disagree Totally disagree A young person leaving full time education A person over 50 years old A woman A person with a disability A person from a different country living in (OUR COUNTRY) A person from an ethnic minority NEW ASK QA14 IF "CURRENTLY WORK", CODE 5 TO 18 IN D15a - OTHERS GO TO QA15 QA14 If you were to be laid-off, how much do you think the unemployment insurance and the welfare system in (OUR COUNTRY) will compensate you for the loss of income during the first six months as a percentage of your current income? (SHOW CARD READ OUT ONE ANSWER ONLY) 91 to 100% of your current income 71 to 90% of your current income 51 to 70% of your current income 31 to 50% of your current income 30% or less of your current income QD16 Questionnaire762 5/16 7/11/2011
180 ASK ALL QA15 Please tell me, for each of the following statements, to what extent you agree or disagree with it. (SHOW CARD WITH SCALE ONE ANSWER PER LINE) (READ OUT) Totally agree Tend to agree Tend to disagree Totally disagree Life-time jobs with the same employer are a thing of the past Work contracts should become more flexible to encourage job creation In (OUR COUNTRY) many people retire too early Regular training improves one s job opportunities Being able to change easily from one job to another is a useful asset to help people find a job nowadays QD18 Questionnaire762 6/16 7/11/2011
181 QA16 For each of the following measures, how effective or not do you think they are in getting more people into work or staying at work longer in their life? (M) (SHOW CARD WITH SCALE ONE ANSWER PER LINE) (READ OUT) Very effective Fairly effective Not very effective Not at all effective Increasing availability of child care facilities (N) Increasing affordability of child care facilities (N) Increasing the difference in income between working and non-working people Making it easier for people to work abroad (N) Supporting people who want to start their own business Making it easier for people to move from undeclared work into regular jobs (e.g. through taxation, labour market regulation) (N) Regular training for people at work Making traineeships a compulsory part of higher education (N) QD19 TREND MODIFIED QA17 Please tell me to what extent you think the EU has, overall, a positive or negative impact in the following areas in (OUR COUNTRY). (SHOW CARD WITH SCALE ONE ANSWER PER LINE) (READ OUT) Very positive impact Fairly positive impact Fairly negative impact Very negative impact 1 2 NEW Employment policy (e.g. helping people in finding a job) Social policy (e.g. fighting poverty and social exclusion, helping to modernise social protection systems) Questionnaire762 7/16 7/11/2011
182 QA18 More specifically, please tell me to what extent you think the EU has a positive or negative impact on each of the following employment and social policies. (M) (SHOW CARD WITH SCALE ONE ANSWER PER LINE) (READ OUT) Very positive impact Fairly positive impact Fairly negative impact Very negative impact Setting minimum standards for working conditions throughout the EU Creating new job opportunities and fighting unemployment Reducing regional differences in unemployment (M) Exchanging best practices in employment policies among EU Member States (M) Improving access to education and training Promoting dialogue between employers and trade unions Fighting against social exclusion and poverty Coordinating the reform of the national systems of social protection (pensions, healthcare, etc.) Making it easier for people to work in different EU Member States (N) Making it easier for people to start their own business (N) QD20 TREND MODIFIED Questionnaire762 8/16 7/11/2011
183 QA19 In your opinion, which of the two following measures is the more effective way of tackling the issue of undeclared work in (OUR COUNTRY)? (IF NECESSARY: Undeclared work is any paid activities that are lawful but not declared to the public authorities. This allows employers and employees to increase their earnings or reduce their costs by evading taxation. It also means that employees have no employment right or protection.) (READ OUT ONE ANSWER ONLY) Punish those responsible (e.g. fines, prison) Make it easier to work lawfully through incentives (e.g. reduction of bureaucracy and administration costs) NEW QA20 During the last 12 months, have you participated in any training courses? (ONE ANSWER ONLY) Yes No QD9 ASK QA21 IF "HAS PARTICIPATED IN A TRAINING DURING THE LAST 12 MONTHS", CODE 1 IN QA20 - OTHERS GO TO QA22 QA21 Who funded this training? Was it? (READ OUT MULTIPLE ANSWERS POSSIBLE) The European Union The (NATIONALITY) Government and\ or a public organisation within (OUR COUNTRY) Your current employer Yourself Other (SPONTANEOUS) (M) 1, 2, 3, 4, 5, 6, QD10 TREND MODIFIED Questionnaire762 9/16 7/11/2011
184 ASK QA22 IF "CURRENTLY WORKING", CODE 5 TO 18 IN D15a OTHERS GO TO QA23 QA22 Thinking about yourself, do you think that in order for you to keep your job...? (READ OUT - ONE ANSWER ONLY) Your education and training to date are sufficient (M) You should take a training course but you cannot currently do so (M) You should take a training course and you will do so (M) QD11 TREND MODIFIED ASK QA23 IF NON-ACTIVE BUT NOT RETIRED, CODE 1 TO 3 IN D15a OTHERS GO TO QA24 QA23 Thinking about yourself, do you think that in order to find a job soon? (READ OUT ONE ANSWER ONLY) Your education and training to date are sufficient (M) You should take a training course but you cannot currently do so (M) You should take a training course and you will do so (M) You are not looking for a job (SPONTANEOUS) QD12 TREND MODIFIED ASK QA24 IF "CANNOT PARTICIPATE IN A TRAINING", CODE 2 IN QA22 OR QA23 OTHERS GO TO QA25a QA24 From the following list, what are the main reasons preventing you from taking part in a training course? (SHOW CARD READ OUT MULTIPLE ANSWERS POSSIBLE) (M) You do not have the necessary experience or qualifications You cannot afford it Your current employer would not support you (M) Training conflicts with your work schedule You do not have time because of family responsibilities There is no training offered close enough to where you are You do not know about any training offers You are not comfortable with the idea of going back to something that is like school Your age prevents you from doing it Your health or mental condition prevents you from doing it (M) You cannot participate for other personal reasons Other (SPONTANEOUS) 1, 2, 3, 4, 5, 6, 7, 8, 9, 10, 11, 12, 13, QD13 TREND MODIFIED Questionnaire762 10/16 7/11/2011
185 ASK QA25a TO QA27 TO ALL EXCEPT STUDENTS, NO CODE 2 IN D15a OTHERS GO TO QA28 QA25a I would like you to think about traineeships. Did you complete one or more traineeships either during or immediately after you completed your education? (IF NECESSARY: By traineeship, we mean training for a particular job or profession) (DO NOT READ OUT ONE ANSWER ONLY) Yes, one Yes, two Yes, three or more No Still in traineeship (SPONTANEOUS) NEW ASK QA25b IF "COMPLETED TRAINEESHIP ", CODE 1 TO 3 IN QA25a OTHERS GO TO QA25c QA25b Thinking about the traineeship(s) you have completed, which of the following statements best corresponds to your situation? (READ OUT ONE ANSWER ONLY) It led you to another traineeship It helped you to find a temporary job It helped you to get a permanent job It did not help you to find a job NEW ASK QA25c IF "DIDN T COMPLETE TRAINEESHIP ", CODE 4 IN QA25a OTHERS GO TO QA26 QA25c You said that you didn t complete a traineeship during or after you completed your education. Which of the following best describes your situation after you completed your education? (SHOW CARD DO NOT READ OUT ONE ANSWER ONLY) You found a permanent job within 3 months You did not find a permanent job within 3 months You were not looking for a job (SPONTANEOUS) NEW Questionnaire762 11/16 7/11/2011
186 ASK QA26 AND QA27 IF "COMPLETED TRAINEESHIP ", CODE 1 TO 3 IN QA25a OTHERS GO TO QA28 QA26 How long was the last traineeship you completed? (READ OUT ONE ANSWER ONLY) Less than a week 1-4 weeks 1-2 months 3-6 months Longer than six months Don t remember (SPONTANEOUS) NEW QA27 Did this traineeship involve any of the following? (SHOW CARD READ OUT MULTIPLE ANSWERS POSSIBLE) A formal (written) agreement between you and the employer An agreed set of objectives A formal certification by the employer of the knowledge, skills and competences you gained during the traineeship Some form of salary or remuneration A formal definition of your rights and responsibilities A reference letter Other (SPONTANEOUS) None (SPONTANEOUS) 1, 2, 3, 4, 5, 6, 7, 8, 9, NEW ASK ALL QA28 In the last two years, have you attended any training courses (including any outside working hours) or received any other on the job training? (SHOW CARD READ OUT MULTIPLE ANSWERS POSSIBLE) Yes, funded by your employer Yes, funded by state\ public funding Yes, self-funded No 1, 2, 3, 4, 5, NEW Questionnaire762 12/16 7/11/2011
187 ASK QA29 IF "HAS ATTENDED ANY TRAINING COURSE", CODE 1 TO 3 IN QA28 OTHERS GO TO QA30 QA29 If you were looking for a job, would the last training course you have received help you to find a job in the future? (ONE ANSWER ONLY) Yes, definitely Yes, probably No, probably not No, definitely not NEW ASK ALL QA30 Which of the following statements best describes the career guidance you received at school? (READ OUT ONE ANSWER ONLY) It helped you acquire the skills needed for the type of job you wanted It did not help you acquire the skills needed for the type of job you wanted You did not receive any career guidance at school (SPONTANEOUS) NEW QA31 How useful or not would it be to you personally to receive information about what skills are likely to be needed in the future job market, for? (SHOW CARD WITH SCALE ONE ANSWER PER LINE) (READ OUT) Very usef ul Fairl y usef ul Not very usef ul Not at all usef ul Not conc erne d\ Not appli cabl e (SP ONT ANE OUS ) 1 Deciding what jobs to apply for in the future Deciding what training courses to attend NEW Questionnaire762 13/16 7/11/2011
188 The next questions are about the economic crisis and the subsequent public spending cuts and other austerity measures which have been implemented in many Member States. QA32 First of all, to what extent do you agree or disagree with the following statement: The economic crisis has had a negative impact on the fairness and social justice in (OUR COUNTRY)? (READ OUT ONE ANSWER ONLY) Totally agree Tend to agree Tend to disagree Totally disagree NEW QA33 Which of the following statements best describes how you feel the burden of public spending cuts and other austerity measures has affected people in (OUR COUNTRY)? (READ OUT ONE ANSWER ONLY) It has affected everyone equally It has affected some people more than others NEW ASK QA34 IF "HAS AFFECTED SOME PEOPLE MORE THAN OTHERS", CODE 2 IN QA33 OTHERS GO TO QA35 QA34 Who do you think have been affected the most by public spending cuts and other austerity measures in (OUR COUNTRY)? (SHOW CARD READ OUT MAX. 3 ANSWERS) The poorest The most well off The elderly Children Young adults Large families Single parents Low skilled\ manual workers Unemployed people People in precarious work Women Immigrants Other (SPONTANEOUS) 1, 2, 3, 4, 5, 6, 7, 8, 9, 10, 11, 12, 13, 14, NEW Questionnaire762 14/16 7/11/2011
189 ASK ALL QA35 Generally speaking, would you say that poverty has strongly increased, somewhat increased, somewhat decreased or strongly decreased in the last three years in (OUR COUNTRY)? (ONE ANSWER ONLY) Strongly increased Somewhat increased Somewhat decreased Strongly decreased Stayed about the same (SPONTANEOUS) QA7.2 QA36 Do you think that enough is being done to fight poverty in (OUR COUNTRY)? (READ OUT ONE ANSWER ONLY) Yes, definitely Yes, to some extent No, not really No, definitely not NEW QA37 Have you personally ever experienced in your life any of the following situations? (SHOW CARD READ OUT MULTIPLE ANSWERS POSSIBLE) Being homeless or having to "sleep rough" Having to stay with friends, relatives or other people because you didn't have anywhere else to live Having to stay in emergency or temporary accommodation (e.g. a shelter, refuge or temporary hostel) Having to stay in an insecure accommodation where you had no legal rights (e. g. squatting) None (SPONTANEOUS) 1, 2, 3, 4, 5, 6, NEW Questionnaire762 15/16 7/11/2011
190 ASK QA38 IF "HAS EXPERIENCED ONE OF THESE SITUATIONS", CODE 1 TO 4 IN QA37 OTHERS GO TO QB1 QA38 When you experienced this, what was the main reason for the situation? Would you say it was? (SHOW CARD READ OUT ONE ANSWER ONLY) Financial reasons Job loss Family reasons Health problems Personal choice Other (SPONTANEOUS) NEW Questionnaire762 16/16 7/11/2011
191 TABLES
192 Special Eurobarometer 377 QA1.1 Et en pensant à l actuelle crise économique et à son impact potentiel sur le marché de l emploi, quelle note donneriezvous à l'inquiétude que vous ressentez personnellement à propos de chacune des situations suivantes. Vous perdez votre emploi QA1.1 And thinking about the current economic crisis and its potential impact on the job-market, how would you rate your concern, if at all, about each of the following? You losing your job QA1.1 Wie würden Sie Ihre persönliche Beunruhigung angesichts der folgenden Situationen einschätzen, wenn Sie an die aktuelle Wirtschaftskrise und ihre potentiellen Auswirkungen auf den Arbeitsmarkt denken? Sie Ihren Arbeitsplatz verlieren 1 Aucune inquiétude Une grande inquiétude Pas applicable (SPONTANE) NSP Ni inquiétude, ni pas d'inquiétude Total 'Inquiétude' 1 Not at all concerned Very concerned Not applicable (SPONTANE- OUS) Neither concerned nor not concerned Total 'Concerned' 1 Überhaupt nicht beunruhigt Stark beunruhigt Trifft nicht zu (SPONTAN) WN Weder beunruhigt noch nicht beunruhigt Gesamt 'Beunruhigt' % EU 27 BE BG CZ DE EE IE EL ES FR IT CY LV LT LU HU MT NL AT PL PT RO SI SK FI SE UK
193 Special Eurobarometer 377 QA1m.1 Et en pensant à l actuelle crise économique et à son impact potentiel sur le marché de l emploi, quelle note donneriez-vous à l'inquiétude que vous ressentez personnellement à propos de chacune des situations suivantes. Vous perdez votre emploi QA1m.1 And thinking about the current economic crisis and its potential impact on the job-market, how would you rate your concern, if at all, about each of the following? You losing your job QA1m.1 Wie würden Sie Ihre persönliche Beunruhigung angesichts der folgenden Situationen einschätzen, wenn Sie an die aktuelle Wirtschaftskrise und ihre potentiellen Auswirkungen auf den Arbeitsmarkt denken? Sie Ihren Arbeitsplatz verlieren 1 Aucune inquiétude Une grande inquiétude Pas applicable (SPONTANE) NSP 1 Not at all concerned Very concerned Not applicable (SPONTA- NEOUS) 1 Überhaupt nicht beunruhigt Stark Trifft nicht zu 4 WN beunruhigt (SPONTAN) % EU 27 BE BG CZ DE EE IE EL ES FR IT CY LV LT LU HU MT NL AT PL PT RO SI SK FI SE UK
194 Special Eurobarometer 377 QA1R.1 Et en pensant à l actuelle crise économique et à son impact potentiel sur le marché de l emploi, quelle note donneriez-vous à l'inquiétude que vous ressentez personnellement à propos de chacune des situations suivantes. Vous perdez votre emploi QA1R.1 And thinking about the current economic crisis and its potential impact on the job-market, how would you rate your concern, if at all, about each of the following? You losing your job QA1R.1 Wie würden Sie Ihre persönliche Beunruhigung angesichts der folgenden Situationen einschätzen, wenn Sie an die aktuelle Wirtschaftskrise und ihre potentiellen Auswirkungen auf den Arbeitsmarkt denken? Sie Ihren Arbeitsplatz verlieren % EU 27 BE BG CZ DE EE IE EL ES FR IT CY LV LT LU HU MT NL AT PL PT RO SI SK FI SE UK 1 Aucune inquiétude 1 Not at all concerned 1 Überhaupt nicht beunruhigt Une grande inquiétude 5 Very concerned 5 Stark beunruhigt NSP WN Total 'Pas d'inquiétude' Total 'Not concerned' Gesamt 'Nicht beunruhigt' Ni inquiétude, ni pas d'inquiétude Neither concerned nor not concerned Weder beunruhigt noch nicht beunruhigt Total 'Inquiétude' Total 'Concerned' Gesamt 'Beunruhigt'
195 Special Eurobarometer 377 QA1.2 Et en pensant à l actuelle crise économique et à son impact potentiel sur le marché de l emploi, quelle note donneriez-vous à l'inquiétude que vous ressentez personnellement à propos de chacune des situations suivantes. Votre partenaire (époux/ épouse, etc.) perd son emploi QA1.2 And thinking about the current economic crisis and its potential impact on the job-market, how would you rate your concern, if at all, about each of the following? Your partner (spouse, etc.) losing their job QA1.2 Wie würden Sie Ihre persönliche Beunruhigung angesichts der folgenden Situationen einschätzen, wenn Sie an die aktuelle Wirtschaftskrise und ihre potentiellen Auswirkungen auf den Arbeitsmarkt denken? Ihr Partner (Ehegatte, usw.) den Arbeitsplatz verliert 1 Aucune inquiétude Une grande inquiétude Pas applicable (SPONTANE) NSP 1 Not at all concerned 2 5 Very Not applicable 3 4 concerned (SPONTANEOUS) 1 Überhaupt nicht beunruhigt Stark beunruhigt Trifft nicht zu (SPONTAN) WN % EU BE BG CZ DE EE IE EL ES FR IT CY LV LT LU HU MT NL AT PL PT RO SI SK FI SE UK
196 Special Eurobarometer 377 QA1.2 Et en pensant à l actuelle crise économique et à son impact potentiel sur le marché de l emploi, quelle note donneriezvous à l'inquiétude que vous ressentez personnellement à propos de chacune des situations suivantes. Votre partenaire (époux/ épouse, etc.) perd son emploi QA1.2 And thinking about the current economic crisis and its potential impact on the job-market, how would you rate your concern, if at all, about each of the following? Your partner (spouse, etc.) losing their job QA1.2 Wie würden Sie Ihre persönliche Beunruhigung angesichts der folgenden Situationen einschätzen, wenn Sie an die aktuelle Wirtschaftskrise und ihre potentiellen Auswirkungen auf den Arbeitsmarkt denken? Ihr Partner (Ehegatte, usw.) den Arbeitsplatz verliert Total 'Pas d'inquiétude' Total 'Not concerned' Gesamt 'Nicht beunruhigt' Ni inquiétude, ni pas d'inquiétude Neither concerned nor not concerned Weder beunruhigt noch nicht beunruhigt Total 'Inquiétude' Total 'Concerned' Gesamt 'Beunruhigt' % EU BE BG CZ DE EE IE EL ES FR IT CY LV LT LU HU MT NL AT PL PT RO SI SK FI SE UK
197 Special Eurobarometer 377 QA1m.2 Et en pensant à l actuelle crise économique et à son impact potentiel sur le marché de l emploi, quelle note donneriez-vous à l'inquiétude que vous ressentez personnellement à propos de chacune des situations suivantes. Votre partenaire (époux\ épouse, etc.) perd son emploi QA1m.2 And thinking about the current economic crisis and its potential impact on the job-market, how would you rate your concern, if at all, about each of the following? Your partner (spouse, etc.) losing their job QA1m.2 Wie würden Sie Ihre persönliche Beunruhigung angesichts der folgenden Situationen einschätzen, wenn Sie an die aktuelle Wirtschaftskrise und ihre potentiellen Auswirkungen auf den Arbeitsmarkt denken? Ihr Partner (Ehegatte, usw.) den Arbeitsplatz verliert 1 Aucune inquiétude Une grande inquiétude Pas applicable (SPONTANE) NSP % 1 Not at all concerned 1 Überhaupt nicht beunruhigt 2 5 Very Not applicable 3 4 concerned (SPONTANEOUS) 5 Stark Trifft nicht zu WN beunruhigt (SPONTAN) EU BE BG CZ DE EE IE EL ES FR IT CY LV LT LU HU MT NL AT PL PT RO SI SK FI SE UK
198 Special Eurobarometer 377 QA1R.2 Et en pensant à l actuelle crise économique et à son impact potentiel sur le marché de l emploi, quelle note donneriezvous à l'inquiétude que vous ressentez personnellement à propos de chacune des situations suivantes. Votre partenaire (époux\ épouse, etc.) perd son emploi QA1R.2 And thinking about the current economic crisis and its potential impact on the job-market, how would you rate your concern, if at all, about each of the following? Your partner (spouse, etc.) losing their job QA1R.2 Wie würden Sie Ihre persönliche Beunruhigung angesichts der folgenden Situationen einschätzen, wenn Sie an die aktuelle Wirtschaftskrise und ihre potentiellen Auswirkungen auf den Arbeitsmarkt denken? Ihr Partner (Ehegatte, usw.) den Arbeitsplatz verliert 1 Aucune inquiétude Une grande inquiétude NSP 1 Not at all concerned Very concerned 1 Überhaupt nicht beunruhigt Stark beunruhigt WN % EU BE BG CZ DE EE IE EL ES FR IT CY LV LT LU HU MT NL AT PL PT RO SI SK FI SE UK
199 Special Eurobarometer 377 QA1R.2 Et en pensant à l actuelle crise économique et à son impact potentiel sur le marché de l emploi, quelle note donneriez-vous à l'inquiétude que vous ressentez personnellement à propos de chacune des situations suivantes. Votre partenaire (époux\ épouse, etc.) perd son emploi QA1R.2 And thinking about the current economic crisis and its potential impact on the job-market, how would you rate your concern, if at all, about each of the following? Your partner (spouse, etc.) losing their job QA1R.2 Wie würden Sie Ihre persönliche Beunruhigung angesichts der folgenden Situationen einschätzen, wenn Sie an die aktuelle Wirtschaftskrise und ihre potentiellen Auswirkungen auf den Arbeitsmarkt denken? Ihr Partner (Ehegatte, usw.) den Arbeitsplatz verliert Total 'Pas d'inquiétude' Total 'Not concerned' Gesamt 'Nicht beunruhigt' Ni inquiétude, ni pas d'inquiétude Neither concerned nor not concerned Weder beunruhigt noch nicht beunruhigt Total 'Inquiétude' Total 'Concerned' Gesamt 'Beunruhigt' % EU BE BG CZ DE EE IE EL ES FR IT CY LV LT LU HU MT NL AT PL PT RO SI SK FI SE UK
200 Special Eurobarometer 377 QA1.3 Et en pensant à l actuelle crise économique et à son impact potentiel sur le marché de l emploi, quelle note donneriez-vous à l'inquiétude que vous ressentez personnellement à propos de chacune des situations suivantes. Vos enfants perdent leur emploi QA1.3 And thinking about the current economic crisis and its potential impact on the job-market, how would you rate your concern, if at all, about each of the following? Your children losing their job QA1.3 Wie würden Sie Ihre persönliche Beunruhigung angesichts der folgenden Situationen einschätzen, wenn Sie an die aktuelle Wirtschaftskrise und ihre potentiellen Auswirkungen auf den Arbeitsmarkt denken? Ihre Kinder ihren Arbeitsplatz verlieren 1 Aucune inquiétude Une grande inquiétude Pas applicable (SPONTA- NE) NSP 1 Not at all concerned 2 Not applicable 5 Very 3 4 (SPONTA- concerned NEOUS) % 1 Überhaupt nicht beunruhigt 2 3 EU BE BG CZ DE EE IE EL ES FR IT CY LV LT LU HU MT NL AT PL PT RO SI SK FI SE UK Stark beunruhigt Trifft nicht zu (SPONTAN) WN 9
201 Special Eurobarometer 377 QA1.3 Et en pensant à l actuelle crise économique et à son impact potentiel sur le marché de l emploi, quelle note donneriez-vous à l'inquiétude que vous ressentez personnellement à propos de chacune des situations suivantes. Vos enfants perdent leur emploi QA1.3 And thinking about the current economic crisis and its potential impact on the job-market, how would you rate your concern, if at all, about each of the following? Your children losing their job QA1.3 Wie würden Sie Ihre persönliche Beunruhigung angesichts der folgenden Situationen einschätzen, wenn Sie an die aktuelle Wirtschaftskrise und ihre potentiellen Auswirkungen auf den Arbeitsmarkt denken? Ihre Kinder ihren Arbeitsplatz verlieren Total 'Pas d'inquiétude' Ni inquiétude, ni pas d'inquiétude Total 'Inquiétude' Total 'Not concerned' Neither concerned nor not concerned Total 'Concerned' Gesamt 'Nicht beunruhigt' Weder beunruhigt noch nicht beunruhigt Gesamt 'Beunruhigt' % EU BE BG CZ DE EE IE EL ES FR IT CY LV LT LU HU MT NL AT PL PT RO SI SK FI SE UK
202 Special Eurobarometer 377 QA1m.3 Et en pensant à l actuelle crise économique et à son impact potentiel sur le marché de l emploi, quelle note donneriez-vous à l'inquiétude que vous ressentez personnellement à propos de chacune des situations suivantes. Vos enfants perdent leur emploi QA1m.3 And thinking about the current economic crisis and its potential impact on the job-market, how would you rate your concern, if at all, about each of the following? Your children losing their job QA1m.3 Wie würden Sie Ihre persönliche Beunruhigung angesichts der folgenden Situationen einschätzen, wenn Sie an die aktuelle Wirtschaftskrise und ihre potentiellen Auswirkungen auf den Arbeitsmarkt denken? Ihre Kinder ihren Arbeitsplatz verlieren 1 Aucune inquiétude Une grande inquiétude Pas applicable (SPONTANE) NSP 1 Not at all concerned 2 Not applicable 5 Very 3 4 (SPONTA- concerned NEOUS) % 1 Überhaupt nicht beunruhigt 5 Stark Trifft nicht zu WN beunruhigt (SPONTAN) EU BE BG CZ DE EE IE EL ES FR IT CY LV LT LU HU MT NL AT PL PT RO SI SK FI SE UK
203 Special Eurobarometer 377 QA1R.3 Et en pensant à l actuelle crise économique et à son impact potentiel sur le marché de l emploi, quelle note donneriez-vous à l'inquiétude que vous ressentez personnellement à propos de chacune des situations suivantes. Vos enfants perdent leur emploi QA1R.3 And thinking about the current economic crisis and its potential impact on the job-market, how would you rate your concern, if at all, about each of the following? Your children losing their job QA1R.3 Wie würden Sie Ihre persönliche Beunruhigung angesichts der folgenden Situationen einschätzen, wenn Sie an die aktuelle Wirtschaftskrise und ihre potentiellen Auswirkungen auf den Arbeitsmarkt denken? Ihre Kinder ihren Arbeitsplatz verlieren 1 Aucune inquiétude Une grande inquiétude NSP % 1 Not at all concerned 1 Überhaupt nicht beunruhigt Very concerned 5 Stark beunruhigt EU BE BG CZ DE EE IE EL ES FR IT CY LV LT LU HU MT NL AT PL PT RO SI SK FI SE UK WN 12
204 Special Eurobarometer 377 QA1R.3 Et en pensant à l actuelle crise économique et à son impact potentiel sur le marché de l emploi, quelle note donneriezvous à l'inquiétude que vous ressentez personnellement à propos de chacune des situations suivantes. Vos enfants perdent leur emploi QA1R.3 And thinking about the current economic crisis and its potential impact on the job-market, how would you rate your concern, if at all, about each of the following? Your children losing their job QA1R.3 Wie würden Sie Ihre persönliche Beunruhigung angesichts der folgenden Situationen einschätzen, wenn Sie an die aktuelle Wirtschaftskrise und ihre potentiellen Auswirkungen auf den Arbeitsmarkt denken? Ihre Kinder ihren Arbeitsplatz verlieren Total 'Pas d'inquiétude' Total 'Not concerned' Gesamt 'Nicht beunruhigt' Ni inquiétude, ni pas d'inquiétude Neither concerned nor not concerned Weder beunruhigt noch nicht beunruhigt Total 'Inquiétude' Total 'Concerned' Gesamt 'Beunruhigt' % EU BE BG CZ DE EE IE EL ES FR IT CY LV LT LU HU MT NL AT PL PT RO SI SK FI SE UK
205 Special Eurobarometer 377 QA2 Veuillez me dire dans quelle mesure vous êtes d accord ou pas d accord avec la proposition suivante : dans deux ans, la crise sera terminée et la situation de l emploi en (NOTRE PAYS) sera meilleure qu aujourd hui. QA2 Please tell me to what extent you agree or disagree with the following statement: In two years, the crisis will be over and the employment situation in (OUR COUNTRY) will be better than today. QA2 Bitte sagen Sie mir, inwieweit Sie der folgenden Aussage zustimmen oder nicht zustimmen: Die Krise wird in zwei Jahren überwunden sein und die Lage auf dem Arbeitsmarkt in (UNSER LAND) wird besser sein als heute. Tout à fait d accord Plutôt d accord Plutôt pas d accord Pas du tout d accord NSP Total 'D'accord' Total 'Pas d'accord' Totally agree Tend to agree Tend to disagree Totally disagree Total 'Agree' Total 'Disagree' % EU 27 BE BG CZ DE EE IE EL ES FR IT CY LV LT LU HU MT NL AT PL PT RO SI SK FI SE UK Stimme voll und ganz zu Stimme eher zu Stimme eher nicht zu Stimme überhaupt nicht zu WN Gesamt 'Stimme zu' Gesamt 'Stimme nicht zu'
206 Special Eurobarometer 377 QA3.1 Avez-vous déjà entendu parler ou lu quelque chose au sujet? Du Fonds européen d ajustement à la mondialisation (FEM) qui est un fond destiné à aider les victimes de la mondialisation QA3.1 Have you ever heard or read about? The European Globalisation Adjustment Fund (EGF) that is a fund to help victims of globalisation QA3.1 Haben Sie schon einmal etwas gehört oder gelesen über...? den Europäischen Fonds für die Anpassung an die Globalisierung (EGF), einem Fonds, der den Opfern der Globalisierung hilft Oui, et vous savez ce que c est Oui, mais vous ne savez pas vraiment ce que c est Non, vous n en avez jamais entendu parler ou lu quelque chose à ce sujet NSP Total 'Oui' Yes, and you know what they are Yes, but you don t really know what they are No, you have never heard or read about it Total 'Yes' Ja, und Sie wissen, worum es sich dabei handelt Ja, aber Sie wissen nicht genau, worum es sich dabei handelt Nein, Sie haben noch nie davon gehört oder etwas darüber gelesen WN Gesamt 'Ja' % EU 27 BE BG CZ DE EE IE EL ES FR IT CY LV LT LU HU MT NL AT PL PT RO SI SK FI SE UK
207 Special Eurobarometer 377 QA3.2 Avez-vous déjà entendu parler ou lu quelque chose au sujet? Du Fonds social européen (FSE) QA3.2 Have you ever heard or read about? The European Social Fund (ESF) QA3.2 Haben Sie schon einmal etwas gehört oder gelesen über...? den Europäischen Sozialfonds (ESF) Oui, et vous savez ce que c est Oui, mais vous ne savez pas vraiment ce que c est Non, vous n en avez jamais entendu parler ou lu quelque chose à ce sujet NSP Total 'Oui' Yes, and you know what they are Yes, but you don t really know what they are No, you have never heard or read about it Total 'Yes' Ja, und Sie wissen, worum es sich dabei handelt Ja, aber Sie wissen nicht genau, worum es sich dabei handelt Nein, Sie haben noch nie davon gehört oder etwas darüber gelesen WN Gesamt 'Ja' % EU BE BG CZ DE EE IE EL ES FR IT CY LV LT LU HU MT NL AT PL PT RO SI SK FI SE UK
208 Special Eurobarometer 377 QA4 Combien de fois avez-vous changé d employeur dans votre vie active? QA4 How many times have you changed employer in your working life so far? QA4 Wie oft haben Sie in Ihrem Arbeitsleben bis jetzt den Arbeitgeber gewechselt? N'a jamais eu de travail rémunéré N'a jamais changé d'employeur 1 à 5 fois 6 à 10 fois Plus de 10 fois NSP Never had any paid work Never changed of employer 1 to 5 times 6 to 10 times More than 10 times Nie eine bezahlte Arbeit Nie geändert von Arbeitgeber 1 bis 5 mal 6 bis 10 mal Mehr als 10 mal WN % EU BE BG CZ DE EE IE EL ES FR IT CY LV LT LU HU MT NL AT PL PT RO SI SK FI SE UK
209 Special Eurobarometer 377 QA4T Combien de fois avez-vous changé d employeur dans votre vie active? QA4T How many times have you changed employer in your working life so far? QA4T Wie oft haben Sie in Ihrem Arbeitsleben bis jetzt den Arbeitgeber gewechselt? N'a jamais changé d'employeur 1 à 5 fois 6 à 10 fois Plus de 10 fois NSP Never changed of employer 1 to 5 times 6 to 10 times More than 10 times % EU 27 BE BG CZ DE EE IE EL ES FR IT CY LV LT LU HU MT NL AT PL PT RO SI SK FI SE UK Nie geändert von Arbeitgeber 1 bis 5 mal 6 bis 10 mal Mehr als 10 mal WN
210 Special Eurobarometer 377 QA5 Depuis quand travaillez-vous pour votre employeur actuel, ou combien de temps avez-vous travaillé pour votre dernier employeur si vous êtes actuellement sans emploi? QA5 For how long have you been working for your current employer or last employer if you are not currently working? QA5 Wie lange arbeiten Sie schon für Ihren derzeitigen Arbeitgeber oder - falls Sie gegenwärtig nicht arbeiten - wie lange haben Sie für Ihren letzten Arbeitgeber gearbeitet? N'a jamais eu de travail rémunéré Moins d'un an 1 à 5 ans 6 à 10 ans 11 à 20 ans Plus de 20 ans NSP Never had any paid work Less than one year 1 to 5 years 6 to 10 years 11 to 20 years More than 20 years % Nie eine bezahlte Arbeit Weniger als ein Jahr 1 à 5 ans 6 à 10 ans 11 à 20 ans Plus de 20 ans EU BE BG CZ DE EE IE EL ES FR IT CY LV LT LU HU MT NL AT PL PT RO SI SK FI SE UK WN 19
211 Special Eurobarometer 377 QA5T Depuis quand travaillez-vous pour votre employeur actuel, ou combien de temps avez-vous travaillé pour votre dernier employeur si vous êtes actuellement sans emploi? QA5T For how long have you been working for your current employer or last employer if you are not currently working? QA5T Wie lange arbeiten Sie schon für Ihren derzeitigen Arbeitgeber oder - falls Sie gegenwärtig nicht arbeiten - wie lange haben Sie für Ihren letzten Arbeitgeber gearbeitet? Moins d'un an 1 à 5 ans 6 à 10 ans 11 à 20 ans Plus de 20 ans NSP Less than one year 1 to 5 years 6 to 10 years 11 to 20 years More than 20 years Weniger als ein Jahr 1 à 5 ans 6 à 10 ans 11 à 20 ans Plus de 20 ans WN % EU 27 BE BG CZ DE EE IE EL ES FR IT CY LV LT LU HU MT NL AT PL PT RO SI SK FI SE UK
212 Special Eurobarometer 377 QA6 A votre avis, quels sont les deux atouts que l on doit mettre en avant pour trouver un emploi facilement aujourd hui? (MAX. 2 REPONSES) QA6 In your opinion, which two assets should one emphasize in order to easily find a job today? (MAX. 2 ANSWERS) QA6 Auf welche beiden Fähigkeiten sollte man Ihrer Meinung nach besonderen Wert legen, damit man heutzutage leichter einen Arbeitsplatz findet? (MAX. 2 NENNUNGEN) Son niveau de diplôme L expérience professionnelle Les connaissances linguistiques Les connaissances informatiques La capacité à s adapter Level of one s qualifications Professional experience Language skills Computer skills Ability to adapt Qualität des schulischen bzw. beruflichen Abschlusses Berufliche Erfahrung Anpassungsfähigkeit Fremdsprachenkenntnisse Computerkenntnisse % EU BE BG CZ DE EE IE EL ES FR IT CY LV LT LU HU MT NL AT PL PT RO SI SK FI SE UK
213 Special Eurobarometer 377 QA6 A votre avis, quels sont les deux atouts que l on doit mettre en avant pour trouver un emploi facilement aujourd hui? (MAX. 2 REPONSES) QA6 In your opinion, which two assets should one emphasize in order to easily find a job today? (MAX. 2 ANSWERS) QA6 Auf welche beiden Fähigkeiten sollte man Ihrer Meinung nach besonderen Wert legen, damit man heutzutage leichter einen Arbeitsplatz findet? (MAX. 2 NENNUNGEN) La disposition à aller travailler à l étranger Autre (SPONTANE) Aucun (SPONTANE) NSP Willingness to work abroad Other (SPONTANEOUS) None (SPONTANEOUS) Bereitschaft im Ausland zu arbeiten Sonstiges (SPONTAN) Keine davon (SPONTAN) WN % EU BE BG CZ DE EE IE EL ES FR IT CY LV LT LU HU MT NL AT PL PT RO SI SK FI SE UK
214 Special Eurobarometer 377 QA7 Dans quelle mesure êtes-vous confiant(e) ou pas de pouvoir garder votre emploi dans les mois à venir? Etes-vous? QA7 How confident would you say you are in your ability to keep your job in the coming months? Are you? QA7 Wie zuversichtlich sind Sie, dass Sie Ihren Job in den nächsten Monaten behalten werden? Würden Sie sagen? Très confiant(e) Plutôt confiant(e) Plutôt pas confiant(e) Pas du tout confiant(e) NSP Total 'Confiant(e)' Total 'Pas confiant(e)' Very confident Fairly confident Not very confident Not at all confident Total 'Confident' Total 'Not confident' % Sehr zuversichtlich 74.1 Eher zuversichtlich 74.1 Eher nicht zuversicht-lich oder 74.1 Überhaupt nicht zuversichtlich Gesamt 'Vertraulich' 74.1 EU BE BG CZ DE EE IE EL ES FR IT CY LV LT LU HU MT NL AT PL PT RO SI SK FI SE UK WN Gesamt 'Nicht vertraulich'
215 Special Eurobarometer 377 QA8 Diriez-vous que vous êtes très confiant(e), plutôt confiant(e), plutôt pas confiant(e) ou pas du tout confiant(e) d avoir un emploi dans 2 ans? QA8 Would you say that you are very confident, fairly confident, not very confident or not at all confident in having a job in 2 years time? QA8 Würden Sie sagen, Sie sind sehr zuversichtlich, ziemlich zuversichtlich, nicht sehr zuversichtlich oder überhaupt nicht zuversichtlich, dass Sie in zwei Jahren einen Arbeitsplatz haben werden? Très confiant(e) Very confident Plutôt confiant(e) Fairly confident Plutôt pas confiant(e) Not very confident Pas du tout confiant(e) Not at all confident Ne pense pas chercher d emploi dans 2 ans (SPONTANE) Not looking for a job in 2 years (SPONTA- NEOUS) NSP Total 'Confiant(e)' Total 'Confident' Total 'Pas confiant(e)' Total 'Not confident' Sehr zuversichtlich Ziemlich zuversichtlich Nicht sehr zuversichtlich Überhaupt nicht zuversichtlich Suche in zwei Jahren keine Arbeit (SPONTAN) WN Gesamt 'Vertraulich' Gesamt 'Nicht vertraulich' % EU BE BG CZ DE EE IE EL ES FR IT CY LV LT LU HU MT NL AT PL PT RO SI SK FI SE UK
216 Special Eurobarometer 377 QA8T Diriez-vous que vous êtes très confiant(e), plutôt confiant(e), plutôt pas confiant(e) ou pas du tout confiant(e) d avoir un emploi dans 2 ans? QA8T Would you say that you are very confident, fairly confident, not very confident or not at all confident in having a job in 2 years time? QA8T Würden Sie sagen, Sie sind sehr zuversichtlich, ziemlich zuversichtlich, nicht sehr zuversichtlich oder überhaupt nicht zuversichtlich, dass Sie in zwei Jahren einen Arbeitsplatz haben werden? Très confiant(e) Plutôt confiant(e) Plutôt pas confiant(e) Pas du tout confiant(e) NSP Total 'Confiant(e)' Total 'Pas confiant(e)' Very confident Fairly confident Not very confident Not at all confident Total 'Confident' Total 'Not confident' % EU 27 BE BG CZ DE EE IE EL ES FR IT CY LV LT LU HU MT NL AT PL PT RO SI SK FI SE UK Sehr zuversichtlich Ziemlich zuversichtlich Nicht sehr zuversichtlich Überhaupt nicht zuversichtlich WN Gesamt 'Vertraulich' Gesamt 'Nicht vertraulich'
217 Special Eurobarometer 377 QA9 Si vous deviez être licencié(e), à combien évaluez-vous sur une échelle de 1 à 10 vos chances de retrouver un travail dans les six prochains mois? QA9 If you were to be laid-off, how would you rate on a scale of 1 to 10, the likelihood of you finding a job in the next six months? QA9 Angenommen, Sie würden entlassen werden, wie würden Sie auf einer Skala von 1 bis 10 die Wahrscheinlichkeit einschätzen, dass Sie innerhalb der nächsten 6 Monate einen neuen Arbeitsplatz finden? 1 Très improbable Not at all likely 1 Überhaupt nicht wahrscheinlich % EU BE BG CZ DE EE IE EL ES FR IT CY LV LT LU HU MT NL AT PL PT RO SI SK FI SE UK
218 Special Eurobarometer 377 QA9 Si vous deviez être licencié(e), à combien évaluez-vous sur une échelle de 1 à 10 vos chances de retrouver un travail dans les six prochains mois? QA9 If you were to be laid-off, how would you rate on a scale of 1 to 10, the likelihood of you finding a job in the next six months? QA9 Angenommen, Sie würden entlassen werden, wie würden Sie auf einer Skala von 1 bis 10 die Wahrscheinlichkeit einschätzen, dass Sie innerhalb der nächsten 6 Monate einen neuen Arbeitsplatz finden? 8 10 Très 9 NSP Improbable Probable Très probable probable 10 Very likely Not likely Likely Very likely % Sehr wahrscheinlich WN EU Nicht wahrscheinlich Wahrscheinlich Sehr wahrscheinlich BE BG CZ DE EE IE EL ES FR IT CY LV LT LU HU MT NL AT PL PT RO SI SK FI SE UK
219 Special Eurobarometer 377 QA10 Si vous deviez être licencié(e), comment trouveriez-vous un emploi? (MAX. 2 REPONSES) QA10 If you were to be laid-off, how would you find a job? (MAX. 2 ANSWERS) QA10 Angenommen, Sie würden entlassen werden: Wie würden Sie dann einen neuen Arbeitsplatz finden? (MAX. 2 NENNUNGEN) En postulant pour le même type d emploi, dans la même localité, mais pour un autre employeur En postulant pour le même type d emploi, mais dans une autre localité En postulant pour un type d emploi complètement différent dans la même localité En postulant pour un type d emploi complètement différent dans une autre localité By applying for the same kind of job, in the same location, but for another employer By applying for the same kind of job but in a different location By applying for a completely different kind of job in the same location By applying for a completely different kind of job in another location % EU 27 BE BG CZ DE EE IE EL ES FR IT CY LV LT LU HU MT NL AT PL PT RO SI SK FI SE UK Indem Sie sich am selben Ort für eine ähnliche Arbeit bewerben, aber bei einem anderen Arbeitgeber Indem Sie sich für eine ähnliche Arbeit bewerben, aber an einem anderen Ort Indem Sie sich am selben Ort für eine völlig andere Arbeit bewerben Indem Sie sich an einem anderen Ort für eine völlig andere Arbeit bewerben
220 Special Eurobarometer 377 QA10 Si vous deviez être licencié(e), comment trouveriez-vous un emploi? (MAX. 2 REPONSES) QA10 If you were to be laid-off, how would you find a job? (MAX. 2 ANSWERS) QA10 Angenommen, Sie würden entlassen werden: Wie würden Sie dann einen neuen Arbeitsplatz finden? (MAX. 2 NENNUNGEN) En démarrant votre propre entreprise, sans employés En démarrant votre propre entreprise, avec des employés Autre (SPONTANE) NSP By starting your own business without employees By starting your own business with employees Other (SPONTANEOUS) Indem Sie sich selbstständig machen Indem Sie sich mit eigenen Mitarbeitern selbständig machen Sonstiges (SPONTAN) WN % EU 27 BE BG CZ DE EE IE EL ES FR IT CY LV LT LU HU MT NL AT PL PT RO SI SK FI SE UK
221 Special Eurobarometer 377 QA11 Envisageriez-vous de démarrer votre propre entreprise si vous deviez perdre votre emploi? QA11 Would you consider starting your own business if you were to lose your job? QA11 Würden Sie in Erwägung ziehen, sich selbstständig zu machen, falls Sie Ihren Arbeitsplatz verlieren würden? Oui, certainement Oui, probablement Non, probablement pas Non, certainement pas NSP Total 'Oui' Total 'Non' Yes, definitely Yes, probably No, probably not No, definitely not Total 'Yes' Total 'No' % EU 27 BE BG CZ DE EE IE EL ES FR IT CY LV LT LU HU MT NL AT PL PT RO SI SK FI SE UK Ja, auf jeden Fall Ja, wahrscheinlich Nein, wahrscheinlich nicht Nein, auf keinen Fall WN Gesamt 'Ja' Gesamt 'Nein'
222 Special Eurobarometer 377 QA12 Sauriez-vous comment démarrer votre propre entreprise en termes de procédures administratives? QA12 Would you know how to start a new business in terms of administrative procedures? QA12 Würden Sie wissen, was in verwaltungstechnischer Hinsicht zu tun ist, um sich selbstständig zu machen? Oui, certainement Oui, probablement Non, probablement pas Non, certainement pas NSP Total 'Oui' Total 'Non' Yes, definitely Yes, probably No, probably not No, definitely not Total 'Yes' Total 'No' % EU 27 BE BG CZ DE EE IE EL ES FR IT CY LV LT LU HU MT NL AT PL PT RO SI SK FI SE UK Ja, auf jeden Fall Ja, wahrscheinlich Nein, wahrscheinlich nicht Nein, auf keinen Fall WN Gesamt 'Ja' Gesamt 'Nein'
223 Special Eurobarometer 377 QA13.1 Pouvez-vous me dire dans quelle mesure vous êtes d accord ou pas d accord avec le fait qu il est plus difficile pour les types de personnes suivants que pour d autres de démarrer leur propre entreprise. Un jeune qui vient de terminer ses études à temps complet QA13.1 Please tell me to what extent do you agree or disagree that it is more difficult for the following types of people than for others to start their own business. A young person leaving full time education QA13.1 Bitte sagen Sie mir, inwieweit Sie der Aussage zustimmen oder nicht zustimmen, dass es für die folgenden Personengruppen schwieriger als für andere ist, sich selbstständig zu machen. Ein junger Mensch, der gerade Schule, Ausbildung oder Studium beendet hat Tout à fait d accord Plutôt d accord Plutôt pas d accord Pas du tout d accord NSP Total 'D'accord' Total 'Pas d'accord' % EU 27 BE BG CZ DE EE IE EL ES FR IT CY LV LT LU HU MT NL AT PL PT RO SI SK FI SE UK Totally agree Stimme voll und ganz zu Tend to agree Stimme eher zu Tend to disagree Stimme eher nicht zu Totally disagree Stimme überhaupt nicht zu Total 'Agree' Gesamt 'Stimme zu' Total 'Disagree' Gesamt 'Stimme nicht zu' WN 32
224 Special Eurobarometer 377 QA13.2 Pouvez-vous me dire dans quelle mesure vous êtes d accord ou pas d accord avec le fait qu il est plus difficile pour les types de personnes suivants que pour d autres de démarrer leur propre entreprise. Une personne de plus de 50 ans QA13.2 Please tell me to what extent do you agree or disagree that it is more difficult for the following types of people than for others to start their own business. A person over 50 years old QA13.2 Bitte sagen Sie mir, inwieweit Sie der Aussage zustimmen oder nicht zustimmen, dass es für die folgenden Personengruppen schwieriger als für andere ist, sich selbstständig zu machen. Eine Person über 50 Jahre Tout à fait d accord Plutôt d accord Plutôt pas d accord Pas du tout d accord NSP Total 'D'accord' Total 'Pas d'accord' Totally agree Tend to agree Tend to disagree Totally disagree Total 'Agree' Total 'Disagree' Stimme voll und ganz zu Stimme eher zu Stimme eher nicht zu Stimme überhaupt nicht zu WN Gesamt 'Stimme zu' Gesamt 'Stimme nicht zu' % EU 27 BE BG CZ DE EE IE EL ES FR IT CY LV LT LU HU MT NL AT PL PT RO SI SK FI SE UK
225 Special Eurobarometer 377 QA13.3 Pouvez-vous me dire dans quelle mesure vous êtes d accord ou pas d accord avec le fait qu il est plus difficile pour les types de personnes suivants que pour d autres de démarrer leur propre entreprise. Une femme QA13.3 Please tell me to what extent do you agree or disagree that it is more difficult for the following types of people than for others to start their own business. A woman QA13.3 Bitte sagen Sie mir, inwieweit Sie der Aussage zustimmen oder nicht zustimmen, dass es für die folgenden Personengruppen schwieriger als für andere ist, sich selbstständig zu machen. Eine Frau Tout à fait d accord Plutôt d accord Plutôt pas d accord Pas du tout d accord NSP Total 'D'accord' Total 'Pas d'accord' Totally agree Tend to agree Tend to disagree Totally disagree Total 'Agree' Total 'Disagree' % EU 27 BE BG CZ DE EE IE EL ES FR IT CY LV LT LU HU MT NL AT PL PT RO SI SK FI SE UK Stimme voll und ganz zu Stimme eher zu Stimme eher nicht zu Stimme überhaupt nicht zu Gesamt 'Stimme zu' Gesamt 'Stimme nicht zu' WN 34
226 Special Eurobarometer 377 QA13.4 Pouvez-vous me dire dans quelle mesure vous êtes d accord ou pas d accord avec le fait qu il est plus difficile pour les types de personnes suivants que pour d autres de démarrer leur propre entreprise. Une personne handicapée QA13.4 Please tell me to what extent do you agree or disagree that it is more difficult for the following types of people than for others to start their own business. A disabled person QA13.4 Bitte sagen Sie mir, inwieweit Sie der Aussage zustimmen oder nicht zustimmen, dass es für die folgenden Personengruppen schwieriger als für andere ist, sich selbstständig zu machen. Eine behinderte Person Tout à fait d accord Plutôt d accord Plutôt pas d accord Pas du tout d accord NSP Total 'D'accord' Total 'Pas d'accord' Totally agree Tend to agree Tend to disagree Totally disagree Total 'Agree' Total 'Disagree' % EU 27 BE BG CZ DE EE IE EL ES FR IT CY LV LT LU HU MT NL AT PL PT RO SI SK FI SE UK Stimme voll und ganz zu Stimme eher zu Stimme eher nicht zu Stimme überhaupt nicht zu Gesamt 'Stimme zu' Gesamt 'Stimme nicht zu' WN 35
227 Special Eurobarometer 377 QA13.5 Pouvez-vous me dire dans quelle mesure vous êtes d accord ou pas d accord avec le fait qu il est plus difficile pour les types de personnes suivants que pour d autres de démarrer leur propre entreprise. Une personne d un autre pays, vivant en (NOTRE PAYS) QA13.5 Please tell me to what extent do you agree or disagree that it is more difficult for the following types of people than for others to start their own business. A person from a different country living in (OUR COUNTRY) QA13.5 Bitte sagen Sie mir, inwieweit Sie der Aussage zustimmen oder nicht zustimmen, dass es für die folgenden Personengruppen schwieriger als für andere ist, sich selbstständig zu machen. Eine Person, die in (UNSER LAND) lebt, aber aus einem anderen Land stammt Tout à fait d accord Plutôt d accord Plutôt pas d accord Pas du tout d accord NSP Total 'D'accord' Total 'Pas d'accord' Totally agree Tend to agree Tend to disagree Totally disagree Total 'Agree' Total 'Disagree' % EU 27 BE BG CZ DE EE IE EL ES FR IT CY LV LT LU HU MT NL AT PL PT RO SI SK FI SE UK Stimme voll und ganz zu Stimme eher zu Stimme eher nicht zu Stimme überhaupt nicht zu Gesamt 'Stimme zu' Gesamt 'Stimme nicht zu' WN 36
228 Special Eurobarometer 377 QA13.6 Pouvez-vous me dire dans quelle mesure vous êtes d accord ou pas d accord avec le fait qu il est plus difficile pour les types de personnes suivants que pour d autres de démarrer leur propre entreprise. Une personne d une minorité ethnique QA13.6 Please tell me to what extent do you agree or disagree that it is more difficult for the following types of people than for others to start their own business. A person from an ethnic minority QA13.6 Bitte sagen Sie mir, inwieweit Sie der Aussage zustimmen oder nicht zustimmen, dass es für die folgenden Personengruppen schwieriger als für andere ist, sich selbstständig zu machen. Eine Person, die einer ethnischen Minderheit angehört Tout à fait d accord Plutôt d accord Plutôt pas d accord Pas du tout d accord NSP Total 'D'accord' Total 'Pas d'accord' Totally agree Tend to agree Tend to disagree Totally disagree Total 'Agree' Total 'Disagree' % EU 27 BE BG CZ DE EE IE EL ES FR IT CY LV LT LU HU MT NL AT PL PT RO SI SK FI SE UK Stimme voll und ganz zu Stimme eher zu Stimme eher nicht zu Stimme überhaupt nicht zu Gesamt 'Stimme zu' Gesamt 'Stimme nicht zu' WN 37
229 Special Eurobarometer 377 QA14 Si vous deviez être licencié(e), combien pensez-vous que l assurance chômage et la sécurité sociale en (NOTRE PAYS) vous compenseraient pour la perte de vos revenus durant les six premiers mois, en pourcentage de vos revenus actuels? QA14 If you were to be laid-off, how much do you think the unemployment insurance and the welfare system in (OUR COUNTRY) will compensate you for the loss of income during the first six months as a percentage of your current income? QA14 Angenommen, Sie würden entlassen werden: Wie viel Geld würden Sie dann Ihrer Meinung nach von der Arbeitslosenversicherung und dem H717 Sozialsystem in den ersten sechs Monaten als Ausgleich für den Verlust Ihres Einkommens erhalten? Wären dies 91 à 100% de votre revenu actuel 71 à 90% de votre revenu actuel 51 à 70% de votre revenu actuel 31 à 50% de votre revenu actuel 30% ou moins de votre revenu actuel NSP 91 to 100% of your current income 71 to 90% of your current income 51 to 70% of your current income 31 to 50% of your current income 30% or less of your current income % % Ihres derzeitigen Einkommens 71-90% Ihres derzeitigen Einkommens 51-70% Ihres derzeitigen Einkommens 31-50% Ihres derzeitigen Einkommens 30% Ihres derzeitigen Einkommens oder weniger EU BE BG CZ DE EE IE EL ES FR IT CY LV LT LU HU MT NL AT PL PT RO SI SK FI SE UK WN 38
230 Special Eurobarometer 377 QA15.1 Dites-moi dans quelle mesure vous êtes d accord ou pas d accord avec chacune des propositions suivantes. Les emplois à vie chez le même employeur sont de l histoire ancienne QA15.1 Please tell me, for each of the following statements, to what extent you agree or disagree with it. Life-time jobs with the same employer are a thing of the past QA15.1 Bitte sagen Sie mir für jede der folgenden Aussagen, inwieweit Sie ihr zustimmen oder nicht. Lebenslange Arbeitsstellen bei demselben Arbeitgeber gehören der Vergangenheit an Tout à fait d accord Plutôt d accord Plutôt pas d accord Pas du tout d accord NSP Total 'D'accord' Total 'Pas d'accord' Totally agree Tend to agree Tend to disagree Totally disagree Total 'Agree' Total 'Disagree' % Stimme voll und ganz zu Stimme eher zu Stimme eher nicht zu Stimme überhaupt nicht zu Gesamt 'Stimme nicht zu' EU BE BG CZ DE EE IE EL ES FR IT CY LV LT LU HU MT NL AT PL PT RO SI SK FI SE UK WN Gesamt 'Stimme zu' 39
231 Special Eurobarometer 377 QA15.2 Dites-moi dans quelle mesure vous êtes d accord ou pas d accord avec chacune des propositions suivantes. Les contrats de travail devraient être plus flexibles pour encourager la creation d emplois QA15.2 Please tell me, for each of the following statements, to what extent you agree or disagree with it. Work contracts should become more flexible to encourage job creation QA15.2 Bitte sagen Sie mir für jede der folgenden Aussagen, inwieweit Sie ihr zustimmen oder nicht. Arbeitsverträge sollten flexibler werden, um die Schaffung von Arbeitsplätzen zu erleichtern Tout à fait d accord Plutôt d accord Plutôt pas d accord Pas du tout d accord NSP Total 'D'accord' Total 'Pas d'accord' Totally agree Tend to agree Tend to disagree Totally disagree Total 'Agree' Total 'Disagree' % Stimme voll und ganz zu Stimme eher zu Stimme eher nicht zu Stimme überhaupt nicht zu Gesamt 'Stimme nicht zu' EU BE BG CZ DE EE IE EL ES FR IT CY LV LT LU HU MT NL AT PL PT RO SI SK FI SE UK WN Gesamt 'Stimme zu' 40
232 Special Eurobarometer 377 QA15.3 Dites-moi dans quelle mesure vous êtes d accord ou pas d accord avec chacune des propositions suivantes. En (NOTRE PAYS) beaucoup de personnes prennent leur retraite trop tôt QA15.3 Please tell me, for each of the following statements, to what extent you agree or disagree with it. In (OUR COUNTRY) many people retire too early QA15.3 Bitte sagen Sie mir für jede der folgenden Aussagen, inwieweit Sie ihr zustimmen oder nicht. In (UNSER LAND) gehen viele Menschen zu früh in den Ruhestand Tout à fait d accord Plutôt d accord Plutôt pas d accord Pas du tout d accord NSP Total 'D'accord' Total 'Pas d'accord' Totally agree Tend to agree Tend to disagree Totally disagree Total 'Agree' Total 'Disagree' % Stimme voll und ganz zu Stimme eher zu Stimme eher nicht zu Stimme überhaupt nicht zu Gesamt 'Stimme nicht zu' EU BE BG CZ DE EE IE EL ES FR IT CY LV LT LU HU MT NL AT PL PT RO SI SK FI SE UK WN Gesamt 'Stimme zu' 41
233 Special Eurobarometer 377 QA15.4 Dites-moi dans quelle mesure vous êtes d accord ou pas d accord avec chacune des propositions suivantes. Une formation continue améliore vos opportunités d emploi QA15.4 Please tell me, for each of the following statements, to what extent you agree or disagree with it. Regular training improves one s job opportunities QA15.4 Bitte sagen Sie mir für jede der folgenden Aussagen, inwieweit Sie ihr zustimmen oder nicht. Regelmäßige Fortbildung verbessert die beruflichen Chancen Tout à fait d accord Plutôt d accord Plutôt pas d accord Pas du tout d accord NSP Total 'D'accord' Total 'Pas d'accord' Totally agree Tend to agree Tend to disagree Totally disagree Total 'Agree' Total 'Disagree' % Stimme voll und ganz zu Stimme eher zu Stimme eher nicht zu Stimme überhaupt nicht zu Gesamt 'Stimme nicht zu' EU BE BG CZ DE EE IE EL ES FR IT CY LV LT LU HU MT NL AT PL PT RO SI SK FI SE UK WN Gesamt 'Stimme zu' 42
234 Special Eurobarometer 377 QA15.5 Dites-moi dans quelle mesure vous êtes d accord ou pas d accord avec chacune des propositions suivantes. Avoir les capacités de changer facilement d emploi est un atout utile pour trouver un emploi de nos jours QA15.5 Please tell me, for each of the following statements, to what extent you agree or disagree with it. Being able to change easily from one job to another is a useful asset to help people find a job nowadays QA15.5 Bitte sagen Sie mir für jede der folgenden Aussagen, inwieweit Sie ihr zustimmen oder nicht. Die Fähigkeit, leicht von einem Job zum anderen wechseln zu können, ist heutzutage ein Vorteil bei der Arbeitssuche Tout à fait d accord Plutôt d accord Plutôt pas d accord Pas du tout d accord NSP Total 'D'accord' Total 'Pas d'accord' Totally agree Tend to agree Tend to disagree Totally disagree Total 'Agree' Total 'Disagree' % Stimme voll und ganz zu Stimme eher zu Stimme eher nicht zu Stimme überhaupt nicht zu Gesamt 'Stimme nicht zu' EU BE BG CZ DE EE IE EL ES FR IT CY LV LT LU HU MT NL AT PL PT RO SI SK FI SE UK WN Gesamt 'Stimme zu' 43
235 Special Eurobarometer 377 QA16.1 Pour chacune des propositions suivantes, dites-moi dans quelle mesure vous pensez qu elle est efficace ou non pour mettre plus de personnes au travail ou leur permettre de rester plus longtemps au travail dans leur vie. Augmenter la disponibilité de structures de garde pour enfants QA16.1 For each of the following measures, how effective or not do you think they are in getting more people into work or staying at work longer in their life? Increasing availability of child care facilities QA16.1 Sagen Sie mir bitte für jede der folgenden Maßnahmen, wie effektiv sie Ihrer Meinung nach ist, wenn es darum geht, dass mehr Menschen Arbeit bekommen und länger arbeiten können Das Angebot an Kinderbetreuungseinrichtungen ausbauen Très efficace Plutôt efficace Plutôt pas efficace Pas du tout efficace NSP Total 'Efficace' Total 'Pas efficace' Very effective Fairly effective Not very effective Not at all effective Total 'Effective' Total 'Not effective' % EU 27 BE BG CZ DE EE IE EL ES FR IT CY LV LT LU HU MT NL AT PL PT RO SI SK FI SE UK Sehr wirksam Ziemlich wirksam Nicht sehr wirksam Überhaupt nicht wirksam Gesamt 'Effektiv' Gesamt 'Nicht effektiv' WN 44
236 Special Eurobarometer 377 QA16.2 Pour chacune des propositions suivantes, dites-moi dans quelle mesure vous pensez qu elle est efficace ou non pour mettre plus de personnes au travail ou leur permettre de rester plus longtemps au travail dans leur vie. Rendre le coût des structures de garde pour enfants plus abordables QA16.2 For each of the following measures, how effective or not do you think they are in getting more people into work or staying at work longer in their life? Increasing affordability of child care facilities QA16.2 Sagen Sie mir bitte für jede der folgenden Maßnahmen, wie effektiv sie Ihrer Meinung nach ist, wenn es darum geht, dass mehr Menschen Arbeit bekommen und länger arbeiten können Die Bezahlbarkeit von Kinderbetreuungseinrichtungen verbessern Très efficace Plutôt efficace Plutôt pas efficace Pas du tout efficace NSP Total 'Efficace' Total 'Pas efficace' Very effective Fairly effective Not very effective Not at all effective Total 'Effective' Total 'Not effective' % EU 27 BE BG CZ DE EE IE EL ES FR IT CY LV LT LU HU MT NL AT PL PT RO SI SK FI SE UK Sehr wirksam Ziemlich wirksam Nicht sehr wirksam Überhaupt nicht wirksam Gesamt 'Effektiv' Gesamt 'Nicht effektiv' WN 45
237 Special Eurobarometer 377 QA16.3 Pour chacune des propositions suivantes, dites-moi dans quelle mesure vous pensez qu elle est efficace ou non pour mettre plus de personnes au travail ou leur permettre de rester plus longtemps au travail dans leur vie. Accentuer la différence de revenus entre les personnes actives et non-actives QA16.3 For each of the following measures, how effective or not do you think they are in getting more people into work or staying at work longer in their life? Increasing the difference in income between working and non-working people QA16.3 Sagen Sie mir bitte für jede der folgenden Maßnahmen, wie effektiv sie Ihrer Meinung nach ist, wenn es darum geht, dass mehr Menschen Arbeit bekommen und länger arbeiten können Den Unterschied im Einkommen zwischen arbeitenden und nicht arbeitenden Menschen erhöhen Très efficace Plutôt efficace Plutôt pas efficace Pas du tout efficace NSP Total 'Efficace' Total 'Pas efficace' Very effective Fairly effective Not very effective Not at all effective Total 'Effective' Total 'Not effective' % Sehr wirksam Ziemlich wirksam Nicht sehr wirksam Überhaupt nicht wirksam Gesamt 'Nicht effektiv' EU BE BG CZ DE EE IE EL ES FR IT CY LV LT LU HU MT NL AT PL PT RO SI SK FI SE UK WN Gesamt 'Effektiv' 46
238 Special Eurobarometer 377 QA16.4 Pour chacune des propositions suivantes, dites-moi dans quelle mesure vous pensez qu elle est efficace ou non pour mettre plus de personnes au travail ou leur permettre de rester plus longtemps au travail dans leur vie. Rendre plus facile le fait de pouvoir travailler à l étranger QA16.4 For each of the following measures, how effective or not do you think they are in getting more people into work or staying at work longer in their life? Making it easier for people to work abroad QA16.4 Sagen Sie mir bitte für jede der folgenden Maßnahmen, wie effektiv sie Ihrer Meinung nach ist, wenn es darum geht, dass mehr Menschen Arbeit bekommen und länger arbeiten können Es für Menschen einfacher machen, im Ausland zu arbeiten Très efficace Plutôt efficace Plutôt pas efficace Pas du tout efficace NSP Total 'Efficace' Total 'Pas efficace' Very effective Fairly effective Not very effective Not at all effective Total 'Effective' Total 'Not effective' % EU 27 BE BG CZ DE EE IE EL ES FR IT CY LV LT LU HU MT NL AT PL PT RO SI SK FI SE UK Sehr wirksam Ziemlich wirksam Nicht sehr wirksam Überhaupt nicht wirksam Gesamt 'Effektiv' Gesamt 'Nicht effektiv' WN 47
239 Special Eurobarometer 377 QA16.5 Pour chacune des propositions suivantes, dites-moi dans quelle mesure vous pensez qu elle est efficace ou non pour mettre plus de personnes au travail ou leur permettre de rester plus longtemps au travail dans leur vie. L aide aux personnes désireuses de lancer leur propre entreprise QA16.5 For each of the following measures, how effective or not do you think they are in getting more people into work or staying at work longer in their life? Supporting people who want to start their own business QA16.5 Sagen Sie mir bitte für jede der folgenden Maßnahmen, wie effektiv sie Ihrer Meinung nach ist, wenn es darum geht, dass mehr Menschen Arbeit bekommen und länger arbeiten können Menschen unterstützen, die sich selbstständig machen wollen Très efficace Plutôt efficace Plutôt pas efficace Pas du tout efficace NSP Total 'Efficace' Total 'Pas efficace' Very effective Fairly effective Not very effective Not at all effective Total 'Effective' Total 'Not effective' Sehr wirksam Ziemlich wirksam Nicht sehr wirksam Überhaupt nicht wirksam WN Gesamt 'Effektiv' Gesamt 'Nicht effektiv' % EU BE BG CZ DE EE IE EL ES FR IT CY LV LT LU HU MT NL AT PL PT RO SI SK FI SE UK
240 Special Eurobarometer 377 QA16.6 Pour chacune des propositions suivantes, dites-moi dans quelle mesure vous pensez qu elle est efficace ou non pour mettre plus de personnes au travail ou leur permettre de rester plus longtemps au travail dans leur vie. Faciliter la possibilité de passer d un travail non déclaré à un travail déclaré (par ex. par le biais de la fiscalité, de la régulation du marché du travail) QA16.6 For each of the following measures, how effective or not do you think they are in getting more people into work or staying at work longer in their life? Making it easier for people to move from undeclared work into regular jobs (e.g. through taxation, labour market regulation) QA16.6 Sagen Sie mir bitte für jede der folgenden Maßnahmen, wie effektiv sie Ihrer Meinung nach ist, wenn es darum geht, dass mehr Menschen Arbeit bekommen und länger arbeiten können Es für Menschen einfacher machen, aus einer nicht angemeldeten Erwerbstätigkeit in die reguläre Beschäftigung zu wechseln (z.b. durch Steuerregelungen, Arbeitsmarktregulierung) Très efficace Plutôt efficace Plutôt pas efficace Pas du tout efficace NSP Total 'Efficace' Total 'Pas efficace' Very effective Fairly effective Not very effective Not at all effective Total 'Effective' Total 'Not effective' % EU 27 BE BG CZ DE EE IE EL ES FR IT CY LV LT LU HU MT NL AT PL PT RO SI SK FI SE UK Sehr wirksam Ziemlich wirksam Nicht sehr wirksam Überhaupt nicht wirksam Gesamt 'Effektiv' Gesamt 'Nicht effektiv' WN 49
241 Special Eurobarometer 377 QA16.7 Pour chacune des propositions suivantes, dites-moi dans quelle mesure vous pensez qu elle est efficace ou non pour mettre plus de personnes au travail ou leur permettre de rester plus longtemps au travail dans leur vie. La formation continue des personnes au travail QA16.7 For each of the following measures, how effective or not do you think they are in getting more people into work or staying at work longer in their life? Regular training for people at work QA16.7 Sagen Sie mir bitte für jede der folgenden Maßnahmen, wie effektiv sie Ihrer Meinung nach ist, wenn es darum geht, dass mehr Menschen Arbeit bekommen und länger arbeiten können Regelmäßige Fortbildung am Arbeitsplatz Très efficace Plutôt efficace Plutôt pas efficace Pas du tout efficace NSP Total 'Efficace' Total 'Pas efficace' Very effective Fairly effective Not very effective Not at all effective Total 'Effective' Total 'Not effective' Sehr wirksam Ziemlich wirksam Nicht sehr wirksam Überhaupt nicht wirksam WN Gesamt 'Effektiv' Gesamt 'Nicht effektiv' % EU BE BG CZ DE EE IE EL ES FR IT CY LV LT LU HU MT NL AT PL PT RO SI SK FI SE UK
242 Special Eurobarometer 377 QA16.8 Pour chacune des propositions suivantes, dites-moi dans quelle mesure vous pensez qu elle est efficace ou non pour mettre plus de personnes au travail ou leur permettre de rester plus longtemps au travail dans leur vie. Faire des stages une étape obligatoire de l enseignement supérieur QA16.8 For each of the following measures, how effective or not do you think they are in getting more people into work or staying at work longer in their life? Making traineeships a compulsory part of higher education QA16.8 Sagen Sie mir bitte für jede der folgenden Maßnahmen, wie effektiv sie Ihrer Meinung nach ist, wenn es darum geht, dass mehr Menschen Arbeit bekommen und länger arbeiten können Praktika zu einem pflichtmäßigen Bestandteil der Hochschulausbildung machen Très efficace Plutôt efficace Plutôt pas efficace Pas du tout efficace NSP Total 'Efficace' Total 'Pas efficace' Very effective Fairly effective Not very effective Not at all effective Total 'Effective' Total 'Not effective' % EU 27 BE BG CZ DE EE IE EL ES FR IT CY LV LT LU HU MT NL AT PL PT RO SI SK FI SE UK Sehr wirksam Ziemlich wirksam Nicht sehr wirksam Überhaupt nicht wirksam Gesamt 'Effektiv' Gesamt 'Nicht effektiv' WN 51
243 Special Eurobarometer 377 QA17.1 Pourriez-vous me dire dans quelle mesure vous pensez que, dans l ensemble, l UE a un impact positif ou négatif dans les domaines suivants en (NOTRE PAYS). La politique de l emploi (p. ex. aider les gens à trouver un emploi) QA17.1 Please tell me to what extent you think the EU has, overall, a positive or negative impact in the following areas in (OUR COUNTRY). Employment policy (e.g. helping people in finding a job) QA17.1 Bitte sagen Sie mir, inwieweit die EU insgesamt gesehen Ihrer Meinung nach positive oder negative Auswirkungen auf die folgenden Bereiche in (UNSER LAND) hat. Arbeitsmarktpolitik (z.b. die Unterstützung bei der Arbeitsplatzsuche) Un impact très positif Un impact plutôt positif Un impact plutôt négatif Un impact très négatif NSP Total 'Impact positif' Total 'Impact négatif' Very positive impact Fairly positive impact Fairly negative impact Very negative impact Total Positive Impact' Total 'Negative impact' % EU 27 BE BG CZ DE EE IE EL ES FR IT CY LV LT LU HU MT NL AT PL PT RO SI SK FI SE UK Sehr positive Auswirkungen Ziemlich positive Auswirkungen Ziemlich negative Auswirkungen Sehr negative Auswirkungen Gesamt Gesamt 'Positive 'Negative Auswirkungen' Auswirkungen' WN 52
244 Special Eurobarometer 377 QA17.2 Pourriez-vous me dire dans quelle mesure vous pensez que, dans l ensemble, l UE a un impact positif ou négatif dans les domaines suivants en (NOTRE PAYS). La politique sociale (p. ex. lutter contre la pauvreté et l exclusion sociale, aider à moderniser les systèmes de protection sociale) QA17.2 Please tell me to what extent you think the EU has, overall, a positive or negative impact in the following areas in (OUR COUNTRY). Social policy (e.g. fighting poverty and social exclusion, helping to modernise social protection systems) QA17.2 Bitte sagen Sie mir, inwieweit die EU insgesamt gesehen Ihrer Meinung nach positive oder negative Auswirkungen auf die folgenden Bereiche in (UNSER LAND) hat. Sozialpolitik (z.b. die Bekämpfung von Armut und sozialer Ausgrenzung, Unterstützung bei der Modernisierung der sozialen Sicherungssysteme) Un impact très positif Un impact plutôt positif Un impact plutôt négatif Un impact très négatif NSP Total 'Impact positif' Total 'Impact négatif' Very positive impact Fairly positive impact Fairly negative impact Very negative impact Total Positive Impact' Total 'Negative impact' Sehr positive Auswirkungen Ziemlich positive Auswirkungen Ziemlich negative Auswirkungen Sehr negative Auswirkungen WN Gesamt Gesamt 'Positive 'Negative Auswirkungen' Auswirkungen' % EU 27 BE BG CZ DE EE IE EL ES FR IT CY LV LT LU HU MT NL AT PL PT RO SI SK FI SE UK
245 Special Eurobarometer 377 QA18.1 Plus précisément, dites-moi dans quelle mesure vous pensez que l UE a un impact positif ou négatif sur chacune des politiques sociales et de l emploi suivantes. La fixation de standards minimum pour les conditions de travail à travers l UE QA18.1 More specifically, please tell me to what extent you think the EU has a positive or negative impact on each of the following employment and social policies. Setting minimum standards for working conditions throughout the EU QA18.1 Bitte sagen Sie mir für jeden der folgenden Bereiche der Beschäftigungs- und Sozialpolitik, inwieweit die EU Ihrer Meinung nach darauf positiven oder negativen Einfluss hat. Das Setzen von Mindeststandards für Arbeitsbedingungen überall in der EU Un impact très positif Un impact plutôt positif Un impact plutôt négatif Un impact très négatif NSP Total 'Impact positif' Total 'Impact négatif' Very positive impact Fairly positive impact Fairly negative impact Very negative impact Total 'Positive impact' Total 'Negative impact' Sehr positive Auswirkungen Ziemlich positive Auswirkungen Ziemlich negative Auswirkungen Sehr negative Auswirkungen WN Gesamt Gesamt 'Positive 'Negative Auswirkungen' Auswirkungen' % EU BE BG CZ DE EE IE EL ES FR IT CY LV LT LU HU MT NL AT PL PT RO SI SK FI SE UK
246 Special Eurobarometer 377 QA18.2 Plus précisément, dites-moi dans quelle mesure vous pensez que l UE a un impact positif ou négatif sur chacune des politiques sociales et de l emploi suivantes. La création de nouvelles opportunités d emploi et la lutte contre le chômage QA18.2 More specifically, please tell me to what extent you think the EU has a positive or negative impact on each of the following employment and social policies. Creating new job opportunities and fighting unemployment QA18.2 Bitte sagen Sie mir für jeden der folgenden Bereiche der Beschäftigungs- und Sozialpolitik, inwieweit die EU Ihrer Meinung nach darauf positiven oder negativen Einfluss hat. Neue Arbeitsplätze schaffen und Arbeitslosigkeit bekämpfen Un impact très positif Un impact plutôt positif Un impact plutôt négatif Un impact très négatif NSP Total 'Impact positif' Total 'Impact négatif' Very positive impact Fairly positive impact Fairly negative impact Very negative impact Total 'Positive impact' Total 'Negative impact' % Sehr positive Auswirkungen Ziemlich positive Auswirkungen Ziemlich negative Auswirkungen Sehr negative Auswirkungen EU Gesamt Gesamt 'Positive 'Negative Auswirkungen' Auswirkungen' BE BG CZ DE EE IE EL ES FR IT CY LV LT LU HU MT NL AT PL PT RO SI SK FI SE UK WN 55
247 Special Eurobarometer 377 QA18.3 Plus précisément, dites-moi dans quelle mesure vous pensez que l UE a un impact positif ou négatif sur chacune des politiques sociales et de l emploi suivantes. La réduction des différences régionales en termes de chômage QA18.3 More specifically, please tell me to what extent you think the EU has a positive or negative impact on each of the following employment and social policies. Reducing regional differences in unemployment QA18.3 Bitte sagen Sie mir für jeden der folgenden Bereiche der Beschäftigungs- und Sozialpolitik, inwieweit die EU Ihrer Meinung nach darauf positiven oder negativen Einfluss hat. Regionale Ungleichheiten bei der Arbeitslosigkeit verringern Un impact très positif Un impact plutôt positif Un impact plutôt négatif Un impact très négatif NSP Total 'Impact positif' Total 'Impact négatif' Very positive impact Fairly positive impact Fairly negative impact Very negative impact Total 'Positive impact' Total 'Negative impact' % Sehr positive Auswirkungen Ziemlich positive Auswirkungen Ziemlich negative Auswirkungen Sehr negative Auswirkungen EU Gesamt Gesamt 'Positive 'Negative Auswirkungen' Auswirkungen' BE BG CZ DE EE IE EL ES FR IT CY LV LT LU HU MT NL AT PL PT RO SI SK FI SE UK WN 56
248 Special Eurobarometer 377 QA18.4 Plus précisément, dites-moi dans quelle mesure vous pensez que l UE a un impact positif ou négatif sur chacune des politiques sociales et de l emploi suivantes. Les échanges sur les meilleures pratiques parmi les Etats membres de l UE QA18.4 More specifically, please tell me to what extent you think the EU has a positive or negative impact on each of the following employment and social policies. Exchanging best practices in employment policies among EU Member States QA18.4 Bitte sagen Sie mir für jeden der folgenden Bereiche der Beschäftigungs- und Sozialpolitik, inwieweit die EU Ihrer Meinung nach darauf positiven oder negativen Einfluss hat. Austausch von erfolgreichen Maßnahmen in der Beschäftigungspolitik zwischen den EU-Mitgliedsländern Un impact très positif Un impact plutôt positif Un impact plutôt négatif Un impact très négatif NSP Total 'Impact positif' Total 'Impact négatif' Very positive impact Fairly positive impact Fairly negative impact Very negative impact Total 'Positive impact' Total 'Negative impact' % Sehr positive Auswirkungen Ziemlich positive Auswirkungen Ziemlich negative Auswirkungen Sehr negative Auswirkungen Gesamt Gesamt 'Positive 'Negative Auswirkungen' Auswirkungen' EU BE BG CZ DE EE IE EL ES FR IT CY LV LT LU HU MT NL AT PL PT RO SI SK FI SE UK WN 57
249 Special Eurobarometer 377 QA18.5 Plus précisément, dites-moi dans quelle mesure vous pensez que l UE a un impact positif ou négatif sur chacune des politiques sociales et de l emploi suivantes. L amélioration de l accès à l éducation et la formation QA18.5 More specifically, please tell me to what extent you think the EU has a positive or negative impact on each of the following employment and social policies. Improving access to education and training QA18.5 Bitte sagen Sie mir für jeden der folgenden Bereiche der Beschäftigungs- und Sozialpolitik, inwieweit die EU Ihrer Meinung nach darauf positiven oder negativen Einfluss hat. Den Zugang zu Aus- und Fortbildung verbessern Un impact très positif Un impact plutôt positif Un impact plutôt négatif Un impact très négatif NSP Total 'Impact positif' Total 'Impact négatif' Very positive impact Fairly positive impact Fairly negative impact Very negative impact Total 'Positive impact' Total 'Negative impact' Sehr positive Auswirkungen Ziemlich positive Auswirkungen Ziemlich negative Auswirkungen Sehr negative Auswirkungen WN Gesamt Gesamt 'Positive 'Negative Auswirkungen' Auswirkungen' % EU BE BG CZ DE EE IE EL ES FR IT CY LV LT LU HU MT NL AT PL PT RO SI SK FI SE UK
250 Special Eurobarometer 377 QA18.6 Plus précisément, dites-moi dans quelle mesure vous pensez que l UE a un impact positif ou négatif sur chacune des politiques sociales et de l emploi suivantes. La promotion du dialogue entre employeurs et syndicats QA18.6 More specifically, please tell me to what extent you think the EU has a positive or negative impact on each of the following employment and social policies. Promoting dialogue between employers and trade unions QA18.6 Bitte sagen Sie mir für jeden der folgenden Bereiche der Beschäftigungs- und Sozialpolitik, inwieweit die EU Ihrer Meinung nach darauf positiven oder negativen Einfluss hat. Den Dialog zwischen Arbeitgebern und Gewerkschaften fördern Un impact très positif Un impact plutôt positif Un impact plutôt négatif Un impact très négatif NSP Total 'Impact positif' Total 'Impact négatif' % Very positive impact Sehr positive Auswirkungen Fairly positive impact Ziemlich positive Auswirkungen Fairly negative impact Ziemlich negative Auswirkungen Very negative impact Sehr negative Auswirkungen EU Total 'Negative impact' Gesamt Gesamt 'Positive 'Negative Auswirkungen' Auswirkungen' BE BG CZ DE EE IE EL ES FR IT CY LV LT LU HU MT NL AT PL PT RO SI SK FI SE UK WN Total 'Positive impact' 59
251 Special Eurobarometer 377 QA18.7 Plus précisément, dites-moi dans quelle mesure vous pensez que l UE a un impact positif ou négatif sur chacune des politiques sociales et de l emploi suivantes. La lutte contre l exclusion sociale et la pauvreté QA18.7 More specifically, please tell me to what extent you think the EU has a positive or negative impact on each of the following employment and social policies. Fighting against social exclusion and poverty QA18.7 Bitte sagen Sie mir für jeden der folgenden Bereiche der Beschäftigungs- und Sozialpolitik, inwieweit die EU Ihrer Meinung nach darauf positiven oder negativen Einfluss hat. Soziale Ausgrenzung und Armut bekämpfen Un impact très positif Un impact plutôt positif Un impact plutôt négatif Un impact très négatif NSP Total 'Impact positif' Total 'Impact négatif' Very positive impact Fairly positive impact Fairly negative impact Very negative impact Total 'Positive impact' Total 'Negative impact' % Sehr positive Auswirkungen Ziemlich positive Auswirkungen Ziemlich negative Auswirkungen Sehr negative Auswirkungen EU Gesamt Gesamt 'Positive 'Negative Auswirkungen' Auswirkungen' BE BG CZ DE EE IE EL ES FR IT CY LV LT LU HU MT NL AT PL PT RO SI SK FI SE UK WN 60
252 Special Eurobarometer 377 QA18.8 Plus précisément, dites-moi dans quelle mesure vous pensez que l UE a un impact positif ou négatif sur chacune des politiques sociales et de l emploi suivantes. La coordination de la réforme des systemes nationaux de protection sociale (pensions, soins de santé, etc.) QA18.8 More specifically, please tell me to what extent you think the EU has a positive or negative impact on each of the following employment and social policies. Coordinating the reform of the national systems of social protection (pensions, healthcare, etc.) QA18.8 Bitte sagen Sie mir für jeden der folgenden Bereiche der Beschäftigungs- und Sozialpolitik, inwieweit die EU Ihrer Meinung nach darauf positiven oder negativen Einfluss hat. Die Reformierung der nationalen sozialen Sicherungssysteme koordinieren (Renten, Krankenversicherung etc.) Un impact très positif Un impact plutôt positif Un impact plutôt négatif Un impact très négatif NSP Total 'Impact positif' Total 'Impact négatif' Very positive impact Fairly positive impact Fairly negative impact Very negative impact Total 'Positive impact' Total 'Negative impact' Sehr positive Auswirkungen Ziemlich positive Auswirkungen Ziemlich negative Auswirkungen Sehr negative Auswirkungen WN Gesamt 'Positive Auswirkungen' Gesamt 'Negative Auswirkungen' % EU BE BG CZ DE EE IE EL ES FR IT CY LV LT LU HU MT NL AT PL PT RO SI SK FI SE UK
253 Special Eurobarometer 377 QA18.9 Plus précisément, dites-moi dans quelle mesure vous pensez que l UE a un impact positif ou négatif sur chacune des politiques sociales et de l emploi suivantes. Rendre plus facile le fait de pouvoir travailler dans différents Etats membres de l UE QA18.9 More specifically, please tell me to what extent you think the EU has a positive or negative impact on each of the following employment and social policies. Making it easier for people to work in different EU Member States QA18.9 Bitte sagen Sie mir für jeden der folgenden Bereiche der Beschäftigungs- und Sozialpolitik, inwieweit die EU Ihrer Meinung nach darauf positiven oder negativen Einfluss hat. Es Menschen erleichtern, in anderen EU-Mitgliedstaaten zu arbeiten Un impact très positif Un impact plutôt positif Un impact plutôt négatif Un impact très négatif NSP Total 'Impact positif' Total 'Impact négatif' % EU 27 BE BG CZ DE EE IE EL ES FR IT CY LV LT LU HU MT NL AT PL PT RO SI SK FI SE UK Very positive impact Sehr positive Auswirkungen Fairly positive impact Ziemlich positive Auswirkungen Fairly negative impact Ziemlich negative Auswirkungen Very negative impact Sehr negative Auswirkungen Total 'Positive impact' Total 'Negative impact' Gesamt Gesamt 'Positive 'Negative Auswirkungen' Auswirkungen' WN
254 Special Eurobarometer 377 QA18.10 Plus précisément, dites-moi dans quelle mesure vous pensez que l UE a un impact positif ou négatif sur chacune des politiques sociales et de l emploi suivantes. Faciliter le processus de création de sa propre entreprise QA18.10 More specifically, please tell me to what extent you think the EU has a positive or negative impact on each of the following employment and social policies. Making it easier for people to start their own business QA18.10 Bitte sagen Sie mir für jeden der folgenden Bereiche der Beschäftigungs- und Sozialpolitik, inwieweit die EU Ihrer Meinung nach darauf positiven oder negativen Einfluss hat. Es Menschen erleichtern, sich selbstständig zu machen Un impact très positif Un impact plutôt positif Un impact plutôt négatif Un impact très négatif NSP Total 'Impact positif' Total 'Impact négatif' % EU 27 BE BG CZ DE EE IE EL ES FR IT CY LV LT LU HU MT NL AT PL PT RO SI SK FI SE UK Very positive impact Sehr positive Auswirkungen Fairly positive impact Ziemlich positive Auswirkungen Fairly negative impact Ziemlich negative Auswirkungen Very negative impact Sehr negative Auswirkungen Total 'Positive impact' Total 'Negative impact' Gesamt Gesamt 'Positive 'Negative Auswirkungen' Auswirkungen' WN
255 Special Eurobarometer 377 QA19 Selon vous, laquelle des deux mesures suivantes est la plus efficace pour combattre la question du travail nondéclaré en (NOTRE PAYS)? QA19 In your opinion, which of the two following measures is the more effective way of tackling the issue of undeclared work in (OUR COUNTRY)? QA19 Welche der zwei folgenden Maßnahmen ist Ihrer Meinung nach die wirksamere, um das Problem der nicht angemeldeten Erwerbstätigkeit in (UNSER LAND) zu bewältigen? Faciliter le travail légal par des Punir les personnes mesures d encouragement (par responsables (p. ex. des ex. réduire la bureaucratie et les amendes, des peines de prison) frais administratifs) NSP Punish those responsible (e.g. fines, prison) Make it easier to work lawfully through incentives (e.g. reduction of bureaucracy and administration costs) Die Verantwortlichen bestrafen (z.b. Geld- oder Haftstrafen) Die legale Beschäftigung durch Anreize erleichtern (z.b. durch den Abbau von Bürokratie und Verwaltungskosten) WN % EU 27 BE BG CZ DE EE IE EL ES FR IT CY LV LT LU HU MT NL AT PL PT RO SI SK FI SE UK
256 Special Eurobarometer 377 QA20 Au cours des 12 derniers mois, avez-vous suivi une quelconque formation? QA20 During the last 12 months, have you participated in any training courses? QA20 Haben Sie in den letzten 12 Monaten an irgendwelchen Fortbildungskursen teilgenommen? Oui Non NSP Yes No Ja Nein WN % EU BE BG CZ DE EE IE EL ES FR IT CY LV LT LU HU MT NL AT PL PT RO SI SK FI SE UK
257 Special Eurobarometer 377 QA21 Qui a financé cette formation? Etait-ce...? (PLUSIEURS REPONSES POSSIBLES) QA21 Who funded this training? Was it? (MULTIPLE ANSWERS POSSIBLE) QA21 Wer hat diese Fortbildung bezahlt? War es... (MEHRFACHNENNUNGEN MÖGLICH) L UE Le Governement (NATIONALITE) et/ ou un organisme public en (NOTRE PAYS) Votre employeur actuel Vous-même Autre (SPONTANE) NSP The EU The (NATIONALITY) Government and/ or a public organisation within (OUR COUNTRY) Your current employer Yourself Other (SPONTA- NEOUS) Die EU Die (STAATSANGEHÖRIGKEIT) Regierung und/ oder eine öffentliche Organisation in (UNSER LAND) Ihr derzeitiger Arbeitgeber Sie selbst Sonstiges (SPONTAN) WN % EU BE BG CZ DE EE IE EL ES FR IT CY LV LT LU HU MT NL AT PL PT RO SI SK FI SE UK
258 Special Eurobarometer 377 QA22 En ce qui vous concerne, croyez-vous que pour conserver votre emploi? QA22 Thinking about yourself, do you think that in order for you to keep your job...? QA22 Wenn Sie an sich selbst denken: Um Ihren Arbeitsplatz zu behalten, glauben Sie da, dass? La formation et les diplômes que vous avez déjà acquis sont suffisants Vous devriez suivre une formation mais vous ne pouvez pas le faire actuellement Vous devriez suivre une formation et vous allez le faire NSP Your education and training to date are sufficient You should take a training course but you cannot currently do so You should take a training course and you will do so % Ihre bisherige Schulausbildung und berufliche Ausbildung ausreichend ist Sie sich speziell weiterbilden sollten, dies aber gegenwärtig nicht tun können Sie sich speziell weiter bilden sollten und dies auch vorhaben EU BE BG CZ DE EE IE EL ES FR IT CY LV LT LU HU MT NL AT PL PT RO SI SK FI SE UK WN 67
259 Special Eurobarometer 377 QA23 En ce qui vous concerne, croyez-vous que pour trouver un emploi prochainement? QA23 Thinking about yourself, do you think that in order to find a job soon? QA23 Wenn Sie an sich selbst denken: Um bald einen Arbeitsplatz zu finden, glauben Sie da, dass? La formation et les diplômes que vous avez déjà acquis sont suffisants Vous devriez suivre une formation mais vous ne pouvez pas le faire actuellement Vous devriez suivre une formation et vous allez le faire Vous n'êtes pas à la recherche d'un emploi (SPONTANE) NSP Your education and training to date are sufficient You should take a training course but you cannot currently do so You should take a training course and you will do so You are not looking for a job (SPONTANEOUS) % Ihre bisherige Schulausbildung und berufliche Ausbildung ausreichend ist Sie sich speziell weiterbilden sollten, dies aber gegenwärtig nicht tun können Sie sich speziell weiterbilden sollten und dies auch vorhaben Ich bin nicht auf Jobsuche (SPONTAN) EU BE BG CZ DE EE IE EL ES FR IT CY LV LT LU HU MT NL AT PL PT RO SI SK FI SE UK WN 68
260 Special Eurobarometer 377 QA23T En ce qui vous concerne, croyez-vous que pour trouver un emploi prochainement? QA23T Thinking about yourself, do you think that in order to find a job soon? QA23T Wenn Sie an sich selbst denken: Um bald einen Arbeitsplatz zu finden, glauben Sie da, dass? La formation et les diplômes que vous avez déjà acquis sont suffisants Vous devriez suivre une formation mais vous ne pouvez pas le faire actuellement Vous devriez suivre une formation et vous allez le faire NSP Your education and training to date are sufficient You should take a training course but you cannot currently do so You should take a training course and you will do so % EU 27 BE BG CZ DE EE IE EL ES FR IT CY LV LT LU HU MT NL AT PL PT RO SI SK FI SE UK Ihre bisherige Schulausbildung und berufliche Ausbildung ausreichend ist Sie sich speziell weiterbilden sollten, dies aber gegenwärtig nicht tun können Sie sich speziell weiterbilden sollten und dies auch vorhaben WN
261 Special Eurobarometer 377 QA24 Quelles sont les principales raisons, parmi les suivantes, qui vous empêcheraient de suivre une formation? (PLUSIEURS REPONSES POSSIBLES) QA24 From the following list, what are the main reasons preventing you from taking part in a training course? (MULTIPLE ANSWERS POSSIBLE) QA24 Welche der Gründe auf dieser Liste halten Sie hauptsächlich davon ab, an Fortbildungskursen teilzunehmen? (MEHRFACHNENNUNGEN MÖGLICH) Vous ne possédez pas l expérience ou les qualifications nécessaires Vous ne pouvez pas vous le permettre financièrement Votre employeur actuel ne vous soutiendrait pas La formation ne convient pas à votre horaire de travail Vous n avez pas le temps en raison de vos responsabilités familiales Il n'y pas d'offres de formation suffisamment proches de chez vous You do not have the necessary experience or qualifications You cannot afford it Your current employer would not support you Training conflicts with your work schedule You do not have time because of family responsibilities There is no training offered close enough to where you are Sie haben nicht die nötige Erfahrung oder Qualifikation Sie können es sich nicht leisten Ihr derzeitiger Arbeitgeber wird Sie dabei nicht unterstützen Die Fortbildung passt nicht zu Ihren Arbeitszeiten Sie haben wegen familiärer Verpflichtungen keine Zeit Es gibt keine Fortbildungsange bote in Ihrer Nähe % EU BE BG CZ DE EE IE EL ES FR IT CY LV LT LU HU MT NL AT PL PT RO SI SK FI SE UK
262 Special Eurobarometer 377 QA24 Quelles sont les principales raisons, parmi les suivantes, qui vous empêcheraient de suivre une formation? (PLUSIEURS REPONSES POSSIBLES) QA24 From the following list, what are the main reasons preventing you from taking part in a training course? (MULTIPLE ANSWERS POSSIBLE) QA24 Welche der Gründe auf dieser Liste halten Sie hauptsächlich davon ab, an Fortbildungskursen teilzunehmen? (MEHRFACHNENNUNGEN MÖGLICH) Vous n'avez connaissance d aucune offre de formation You do not know about any training offers Vous n êtes pas à l aise avec l idée de retourner vers quelque chose qui ressemble à l école You are not comfortable with the idea of going back to something that is like school Votre âge vous empêche de le faire Your age prevents you from doing it Votre santé ou votre état mental vous empêche de le faire Your health or mental condition prevents you from doing it Vous ne pouvez pas suivre une formation pour d autres raisons personnelles You cannot participate for other personal reasons Autre (SPONTA- NE) Other (SPONTA- NEOUS) NSP % Sie kennen keine Fortbildungsang ebote Sie fühlen sich nicht wohl bei dem Gedanken, wieder etwas zu besuchen, das wie Schule ist Ihr Alter hält Sie davon ab Ihr Gesundheitszus tand hält Sie davon ab Sie können aus anderen persönlichen Gründen nicht teilnehmen Sonstiges (SPONTAN) EU BE BG CZ DE EE IE EL ES FR IT CY LV LT LU HU MT NL AT PL PT RO SI SK FI SE UK WN 71
263 Special Eurobarometer 377 QA25a Je voudrais maintenant que vous pensiez aux stages. Avez-vous suivi un ou plusieurs stages pendant, ou juste après vos études? QA25a I would like you to think about traineeships. Did you complete one or more traineeships either during or immediately after you completed your education? QA25a Bitte denken Sie jetzt einmal an Praktika. Haben Sie während oder direkt nach Ihrer Schulzeit oder Ihrem Studium ein oder mehrere Praktika absolviert? Oui, un Oui, deux Oui, trois ou plus Non Est toujours en stage (SPONTANE) NSP Total 'Oui' % EU 27 BE BG CZ DE EE IE EL ES FR IT CY LV LT LU HU MT NL AT PL PT RO SI SK FI SE UK Yes, one Ja, eines Yes, two Ja, zwei Yes, three or more Ja, drei oder mehr No Nein Still in traineeship (SPONTANEO US) Bin derzeit noch in einem Praktikum (SPONTAN) WN Total 'Yes' Gesamt 'Ja'
264 Special Eurobarometer 377 QA25aT Je voudrais maintenant que vous pensiez aux stages. Avez-vous suivi un ou plusieurs stages pendant, ou juste après vos études? QA25aT I would like you to think about traineeships. Did you complete one or more traineeships either during or immediately after you completed your education? QA25aT Bitte denken Sie jetzt einmal an Praktika. Haben Sie während oder direkt nach Ihrer Schulzeit oder Ihrem Studium ein oder mehrere Praktika absolviert? Oui, un Oui, deux Oui, trois ou plus Non NSP Total 'Oui' Yes, one Yes, two Yes, three or more No Total 'Yes' % EU 27 BE BG CZ DE EE IE EL ES FR IT CY LV LT LU HU MT NL AT PL PT RO SI SK FI SE UK Ja, eines Ja, zwei Ja, drei oder mehr Nein Gesamt 'Ja' WN 73
265 Special Eurobarometer 377 QA25b En pensant au(x) stage(s) que vous avez suivi(s), laquelle des affirmations suivantes correspond le mieux à votre situation? QA25b Thinking about the traineeship(s) you have completed, which of the following statements best corresponds to your situation? QA25b Wenn Sie nun an das Praktikum bzw. die Praktika denken, die Sie absolviert haben, welche der folgenden Aussagen trifft da am besten auf Ihre Situation zu? Cela vous a mené à un autre stage Cela vous a aidé à trouver un emploi temporaire Cela vous a aidé à trouver un emploi permanent Cela ne vous a pas aidé à trouver un emploi NSP It led you to another traineeship It helped you to find a temporary job It helped you to get a permanent job It did not help you to find a job % EU 27 BE BG CZ DE EE IE EL ES FR IT CY LV LT LU HU MT NL AT PL PT RO SI SK FI SE UK Es hat zu einem weiteren Praktikum geführt Es hat Ihnen geholfen, eine befristete Anstellung zu finden Es hat Ihnen geholfen, eine unbefristete Anstellung zu finden Es hat Ihnen nicht geholfen, eine Anstellung zu finden WN
266 Special Eurobarometer 377 QA25c Vous avez dit ne pas avoir suivi de stage pendant ou juste après vos études. Laquelle des situations suivantes correspond le mieux à votre situation lorsque vous avez terminé vos études? QA25c You said that you didn t complete a traineeship during or after you completed your education. Which of the following best describes your situation after you completed your education? QA25c Sie haben angegeben, dass Sie während oder nach Ihrer Schulzeit bzw. Ihrem Studium kein Praktikum absolviert haben. Welche der folgenden Aussagen beschreibt am besten Ihre Situation nach Ihrer Schulzeit bzw. Ihrem Studium? Vous avez trouvé un emploi dans les 3 mois Vous n avez pas trouvé un emploi dans les 3 mois Vous ne cherchiez pas d emploi (SPONTANE) NSP % EU 27 BE BG CZ DE EE IE EL ES FR IT CY LV LT LU HU MT NL AT PL PT RO SI SK FI SE UK You found a permanent job within 3 months Sie haben innerhalb von 3 Monaten eine unbefristete Anstellung gefunden You did not find a permanent job within 3 months Sie haben keine unbefristete Anstellung innerhalb von 3 Monaten gefunden You were not looking for a job (SPONTANEOUS) Sie haben nicht nach einer Anstellung gesucht (SPONTAN) WN
267 Special Eurobarometer 377 QA25cT Vous avez dit ne pas avoir suivi de stage pendant ou juste après vos études. Laquelle des situations suivantes correspond le mieux à votre situation lorsque vous avez terminé vos études? QA25cT You said that you didn t complete a traineeship during or after you completed your education. Which of the following best describes your situation after you completed your education? QA25cT Sie haben angegeben, dass Sie während oder nach Ihrer Schulzeit bzw. Ihrem Studium kein Praktikum absolviert haben. Welche der folgenden Aussagen beschreibt am besten Ihre Situation nach Ihrer Schulzeit bzw. Ihrem Studium? Vous avez trouvé un emploi dans les 3 mois Vous n avez pas trouvé un emploi dans les 3 mois NSP You found a permanent job within 3 months You did not find a permanent job within 3 months % EU 27 BE BG CZ DE EE IE EL ES FR IT CY LV LT LU HU MT NL AT PL PT RO SI SK FI SE UK Sie haben innerhalb von 3 Monaten eine unbefristete Anstellung gefunden Sie haben keine unbefristete Anstellung innerhalb von 3 Monaten gefunden WN
268 Special Eurobarometer 377 QA26 Combien de temps a duré le dernier stage que vous avez suivi? QA26 How long was the last traineeship you completed? QA26 Wie lange hat das letzte Praktikum gedauert, das Sie absolviert haben? % EU 27 BE BG CZ DE EE IE EL ES FR IT CY LV LT LU HU MT NL AT PL PT RO SI SK FI SE UK Moins d une semaine Less than a week Weniger als eine Woche 1 à 4 semaines 1-4 weeks 1 bis 4 Wochen 1 à 2 mois 1-2 months 1 bis 2 Monate 3 à 6 mois 3-6 months 3 bis 6 Monate Plus de 6 mois Longer than six months Länger als sechs Monate Ne se souvient pas (SPONTANE) Don't remember (SPONTA- NEOUS) Kann mich nicht erinnern (SPONTAN) NSP WN 77
269 Special Eurobarometer 377 QA27 Est-ce que ce stage a impliqué une des choses suivantes? (PLUSIEURS REPONSES POSSIBLES) QA27 Did this traineeship involve any of the following? (MULTIPLE ANSWERS POSSIBLE) QA27 Gab es bei Ihrem Praktikum eines oder mehrere der folgenden Dinge? (MEHRFACHNENNUNGEN MÖGLICH) Un accord (écrit) formel entre vous et l employeur Un accord sur une série d objectifs Une certification formelle par l employeur des connaissances, aptitudes et compétences que vous avez obtenues pendant le stage Une forme de salaire ou de rémunération A formal (written) agreement between you and the employer An agreed set of objectives A formal certification by the employer of the knowledge, skills and competences you gained during the traineeship Some form of salary or remuneration % EU 27 BE BG CZ DE EE IE EL ES FR IT CY LV LT LU HU MT NL AT PL PT RO SI SK FI SE UK Eine förmliche (schriftliche) Vereinbarung zwischen Ihnen und dem Arbeitgeber Fest vereinbarte Ziele Eine offizielle Bescheinigung des Arbeitgebers über Kenntnisse, Fähigkeiten und Kompetenzen, die Sie während des Praktikums erworben haben Irgendeine Form von Gehalt oder Vergütung
270 Special Eurobarometer 377 QA27 Est-ce que ce stage a impliqué une des choses suivantes? (PLUSIEURS REPONSES POSSIBLES) QA27 Did this traineeship involve any of the following? (MULTIPLE ANSWERS POSSIBLE) QA27 Gab es bei Ihrem Praktikum eines oder mehrere der folgenden Dinge? (MEHRFACHNENNUNGEN MÖGLICH) Une définition formelle de vos droits et responsabilités Une lettre de recommandation Autre (SPONTANE) Aucun (SPONTANE) NSP A formal definition of your rights and responsibilities A reference letter Other (SPONTANEOUS) None (SPONTANEOUS) % EU 27 BE BG CZ DE EE IE EL ES FR IT CY LV LT LU HU MT NL AT PL PT RO SI SK FI SE UK Eine förmliche Festlegung Ihrer Rechte und Pflichten Ein Empfehlungsschre iben Sonstige (SPONTAN) Nichts davon (SPONTAN) WN
271 Special Eurobarometer 377 QA28 Au cours des deux dernières années, avez-vous suivi une formation (y compris en dehors des heures de travail) ou reçu une autre formation en cours d emploi? (PLUSIEURS REPONSES POSSIBLES) QA28 In the last two years, have you attended any training courses (including any outside working hours) or received any other on the job training? (MULTIPLE ANSWERS POSSIBLE) QA28 Haben Sie in den letzen zwei Jahren an einer Fortbildungsmaßnahme teilgenommen (auch außerhalb Ihrer regulären Arbeitszeit) oder eine betriebliche Fortbildung erhalten? (MEHRFACHNENNUNGEN MÖGLICH) % EU 27 BE BG CZ DE EE IE EL ES FR IT CY LV LT LU HU MT NL AT PL PT RO SI SK FI SE UK Oui, payée par votre employeur Yes, funded by your employer Ja, und diese wurde von Ihrem Arbeitgeber bezahlt Oui, payée par des fonds publics\ d état Yes, funded by state\ public funding Ja, und diese wurde vom Staat/aus öffentlichen Mitteln bezahlt Oui, payée par vous Yes, self-funded Ja, und Sie haben diese selbst bezahlt Non No Nein NSP WN Total 'Oui' Total 'Yes' Gesamt 'Ja'
272 Special Eurobarometer 377 QA29 Si vous étiez à la recherche d un emploi, est-ce que la dernière formation que vous avez suivie vous aiderait à trouver un emploi dans le futur? QA29 If you were looking for a job, would the last training course you have received help you to find a job in the future? QA29 Angenommen, Sie wären auf Arbeitssuche, würde die letzte Fortbildung, die Sie erhalten haben, Ihnen helfen, einen neuen Job zu finden? % EU 27 BE BG CZ DE EE IE EL ES FR IT CY LV LT LU HU MT NL AT PL PT RO SI SK FI SE UK Oui, certainement Yes, definitely Ja, auf jeden Fall Oui, probablement Yes, probably Ja, wahrscheinlich Non, probablement pas No, probably not Nein, wahrscheinlich nicht Non, certainement pas No, definitely not Nein, auf keinen Fall NSP WN Total 'Oui' Total 'Yes' Gesamt 'Ja' Total 'Non' Total 'No' Gesamt 'Nein'
273 Special Eurobarometer 377 QA30 Laquelle des propositions suivantes décrit le mieux l orientation professionnelle que vous avez reçue à l école? QA30 Which of the following statements best describes the career guidance you received at school? QA30 Welche der folgenden Aussagen beschreibt am besten die Berufsberatung, die Sie in der Schule erhalten haben? Cela vous a permis d acquérir les aptitudes nécessaires pour le type d emploi que vous désiriez Cela ne vous a pas permis d acquérir les aptitudes nécessaires pour le type d emploi que vous désiriez Vous n avez reçu aucune orientation professionnelle à l école (SPONTANE) NSP It helped you acquire the skills needed for the type of job you wanted It did not help you acquire the skills needed for the type of job you wanted You did not receive any career guidance at school (SPONTANEOUS) % EU 27 BE BG CZ DE EE IE EL ES FR IT CY LV LT LU HU MT NL AT PL PT RO SI SK FI SE UK Sie hat Ihnen geholfen, die erforderlichen Fähigkeiten für den von Ihnen angestrebten Beruf zu erwerben Sie hat Ihnen nicht geholfen, die erforderlichen Fähigkeiten für den von Ihnen angestrebten Beruf zu erwerben Sie haben in der Schule keine Berufsberatung erhalten (SPONTAN) WN 82
274 Special Eurobarometer 377 QA31.1 Dans quelle mesure vous serait-il personnellement utile ou non de recevoir de l information à propos des aptitudes qui seront probablement nécessaires sur le futur marché du travail, pour? Décider du type d emplois auxquels postuler dans le futur QA31.1 How useful or not would it be to you personally to receive information about what skills are likely to be needed in the future job market, for? Deciding what jobs to apply for in the future QA31.1 Wie nützlich oder nicht nützlich wäre es für Sie persönlich, Informationen darüber zu erhalten, welche Fähigkeiten auf dem künftigen Arbeitsmarkt wahrscheinlich benötigt werden, um? zu entscheiden, für welche Jobs Sie sich in der Zukunft bewerben Très utile Assez utile Pas très utile Pas du tout utile Non concerné \ Ne s applique pas (SPONTANE) NSP Total 'Utile' Total 'Pas utile' Very useful Fairly useful Not very useful Not at all useful Not concerned\ Not applicable (SPONTANEOUS) Total 'Useful' Total 'Not useful' Sehr nützlich Ziemlich nützlich Nicht sehr nützlich Überhaupt nicht nützlich Nicht davon betroffen/trifft nicht zu (SPONTAN) WN Gesamt 'Nützlich' Gesamt 'Nicht nützlich' % EU 27 BE BG CZ DE EE IE EL ES FR IT CY LV LT LU HU MT NL AT PL PT RO SI SK FI SE UK
275 Special Eurobarometer 377 QA31.2 Dans quelle mesure vous serait-il personnellement utile ou non de recevoir de l information à propos des aptitudes qui seront probablement nécessaires sur le futur marché du travail, pour? Décider du type de formation à suivre QA31.2 How useful or not would it be to you personally to receive information about what skills are likely to be needed in the future job market, for? Deciding what training courses to attend QA31.2 Wie nützlich oder nicht nützlich wäre es für Sie persönlich, Informationen darüber zu erhalten, welche Fähigkeiten auf dem künftigen Arbeitsmarkt wahrscheinlich benötigt werden, um? Zu entscheiden, an welchen Fortbildungen Sie teilnehmen Très utile Assez utile Pas très utile Pas du tout utile Non concerné / Ne s applique pas (SPONTANE) NSP Total 'Utile' Total 'Pas utile' Very useful Fairly useful Not very useful Not at all useful Not concerned/ Not applicable (SPONTANEOUS) Total 'Useful' Total 'Not useful' Sehr nützlich Ziemlich nützlich Nicht sehr nützlich Überhaupt nicht nützlich Nicht davon betroffen/ Trifft nicht zu (SPONTAN) WN Gesamt 'Nützlich' Gesamt 'Nicht nützlich' % EU 27 BE BG CZ DE EE IE EL ES FR IT CY LV LT LU HU MT NL AT PL PT RO SI SK FI SE UK
276 Special Eurobarometer 377 QA32 Tout d abord, dans quelle mesure êtes-vous d accord ou pas d accord avec l affirmation suivante : la crise économique a eu un effet négatif sur l équité et la justice sociale en (NOTRE PAYS). QA32 First of all, to what extent do you agree or disagree with the following statement: The economic crisis has had a negative impact on the fairness and social justice in (OUR COUNTRY)? QA32 Bitte sagen Sie mir zunächst, inwieweit Sie der folgenden Aussage zustimmen oder nicht zustimmen: Die Wirtschaftskrise hatte negative Auswirkungen auf die Fairness und die soziale Gerechtigkeit in (UNSER LAND). Tout à fait d accord Plutôt d accord Plutôt pas d accord Pas du tout d accord NSP Total 'D'accord' Total 'Pas d'accord' Totally agree Tend to agree Tend to disagree Totally disagree Total 'Agree' Total 'Disagree' % EU 27 BE BG CZ DE EE IE EL ES FR IT CY LV LT LU HU MT NL AT PL PT RO SI SK FI SE UK Stimme voll und ganz zu Stimme eher zu Stimme eher nicht zu Stimme überhaupt nicht zu WN Gesamt 'Stimme zu' Gesamt 'Stimme nicht zu'
277 Special Eurobarometer 377 QA33 Laquelle des affirmations suivantes décrit le mieux la manière dont, selon vous, les effets de la baisse des dépenses publiques et des autres mesures d austérité ont affecté les gens en (NOTRE PAYS)? QA33 Which of the following statements best describes how you feel the burden of public spending cuts and other austerity measures has affected people in (OUR COUNTRY)? QA33 Welche der folgenden Aussagen beschreibt am besten, inwieweit die Menschen in (UNSER LAND) Ihrer Meinung nach von den Kürzungen der öffentlichen Ausgaben und von anderen Sparmaßnahmen betroffen sind? Cela a affecté tout le monde de la même façon Cela a affecté certaines personnes plus que d autres NSP It has affected everyone equally It has affected some people more than others Es sind alle gleichermaßen betroffen Einige Menschen sind davon stärker betroffen als andere WN % EU 27 BE BG CZ DE EE IE EL ES FR IT CY LV LT LU HU MT NL AT PL PT RO SI SK FI SE UK
278 Special Eurobarometer 377 QA34 Qui, selon vous, a été le plus affecté par la baisse des dépenses publiques et autres mesures d austérité en (NOTRE PAYS)? (MAX. 3 REPONSES) QA34 Who do you think have been affected the most by public spending cuts and other austerity measures in (OUR COUNTRY)? (MAX. 3 ANSWERS) QA34 Wer wurde Ihrer Meinung nach am stärksten von den Kürzungen der öffentlichen Ausgaben und von anderen Sparmaßnahmen in (UNSER LAND) betroffen? (MAX. 3 ANTWORTEN) Les plus pauvres Les plus aisés Les plus âgés Children Les jeunes adultes Les familles nombreuses Les parents célibataires The poorest The most well off The elderly Children Young adults Large families Single parents % EU 27 BE BG CZ DE EE IE EL ES FR IT CY LV LT LU HU MT NL AT PL PT RO SI SK FI SE UK Die Ärmsten Die Reichsten Ältere Kinder Heranwachsende Große bzw. kinderreiche Familien Alleinerziehend en Eltern
279 Special Eurobarometer 377 QA34 Qui, selon vous, a été le plus affecté par la baisse des dépenses publiques et autres mesures d austérité en (NOTRE PAYS)? (MAX. 3 REPONSES) QA34 Who do you think have been affected the most by public spending cuts and other austerity measures in (OUR COUNTRY)? (MAX. 3 ANSWERS) QA34 Wer wurde Ihrer Meinung nach am stärksten von den Kürzungen der öffentlichen Ausgaben und von anderen Sparmaßnahmen in (UNSER LAND) betroffen? (MAX. 3 ANTWORTEN) Les moins qualifiés/ ouvriers Les personnes sans emploi Les personnes ayant un emploi précaire Les femmes Les immigrants Autre (SPONTA- NE) NSP % EU 27 BE BG CZ DE EE IE EL ES FR IT CY LV LT LU HU MT Low skilled/ manual workers Gering qualifizierte Personen/Arbei ter Unemployed people Arbeitslosen People in precarious work Personen in prekären Beschäftigungsverhältni ssen (Personen, die sich in befristeten Arbeitsverhältnissen mit geringem Lohn befinden) 27 7 Women Frauen Immigrants Einwanderern Other (SPONTA- NEOUS) Sonstige (SPONTAN) NL AT PL PT RO SI SK FI SE UK WN 88
280 Special Eurobarometer 377 QA35 En général, diriez-vous que la pauvreté a fortement augmenté, plutôt augmenté, plutôt diminué ou fortement diminué au cours des trois dernières années en (NOTRE PAYS)? QA35 Generally speaking, would you say that poverty has strongly increased, somewhat increased, somewhat decreased or strongly decreased in the last three years in (OUR COUNTRY)? QA35 Würden Sie ganz allgemein gesprochen sagen, dass die Armut in (UNSER LAND) in den letzten drei Jahren stark zugenommen, etwas zugenommen, etwas abgenommen oder stark abgenommen hat? Fortement augmenté Plutôt augmenté Plutôt diminué Fortement diminué Est restée à peu près la même (SPONTANE) NSP Total 'Augmenté' Total 'Diminué' Strongly increased Somewhat increased Somewhat decreased Strongly decreased Stayed about the same (SPONTA- NEOUS) Total 'Increased' Total 'Decreased Stark zugenommen Etwas zugenommen Etwas abgenommen Stark abgenommen Ist in etwa gleich geblieben (SPONTAN) WN Gesamt 'Zugenommen' Gesamt 'Abgenommen' % EU BE BG CZ DE EE IE EL ES FR IT CY LV LT LU HU MT NL AT PL PT RO SI SK FI SE UK
281 Special Eurobarometer 377 QA36 Pensez-vous que suffisamment d efforts sont faits pour lutter contre la pauvreté en (NOTRE PAYS)? QA36 Do you think that enough is being done to fight poverty in (OUR COUNTRY)? QA36 Sind Sie der Meinung, dass genügend getan wird, um die Armut in (UNSER LAND) zu bekämpfen? Oui, certainement Oui, dans une certaine mesure Non, pas vraiment Non, pas du tout NSP Total 'Oui' Total 'Non' Yes, definitely Yes, to some extent No, not really No, not at all Total 'Yes' Total 'No' Ja, auf jeden Fall Ja, teilweise Nein, eher nicht Nein, gar keine WN Gesamt 'Ja' Gesamt 'Nein' % EU 27 BE BG CZ DE EE IE EL ES FR IT CY LV LT LU HU MT NL AT PL PT RO SI SK FI SE UK
282 Special Eurobarometer 377 QA37 Avez-vous personnellement déjà vécu l une des situations suivantes dans votre vie? (PLUSIEURS REPONSES POSSIBLES) QA37 Have you personally ever experienced in your life any of the following situations? (MULTIPLE ANSWERS POSSIBLE) QA37 Haben Sie in Ihrem Leben jemals persönlich eine der folgenden Situationen erlebt? (MEHRFACHNENNUNGEN MÖGLICH) Être sans domicile ou devoir dormir dehors Devoir rester chez des amis, des connaissances ou d autres personnes car vous n aviez pas d autre endroit où vivre Devoir rester dans un endroit de fortune ou temporaire (p. ex. un centre pour les sans abris, un refuge ou un hôtel) Being homeless or having to "sleep rough" Having to stay with friends, relatives or other people because you didn't have anywhere else to live Having to stay in emergency or temporary accommodation (e.g. a shelter, refuge or temporary hostel) % EU 27 BE BG CZ DE EE IE EL ES FR IT CY LV LT LU HU MT NL AT PL PT RO SI SK FI SE UK Sie waren obdachlos oder mussten auf der Straße leben Sie mussten bei Freunden, Verwandten oder anderen Personen wohnen, weil Sie nirgendwo anders wohnen konnten Sie mussten in einer Notunterkunft oder provisorischen Unterbringung wohnen (z.b. in einem Unterschlupf oder einer Obdachlosenherberge)
283 Special Eurobarometer 377 QA37 Avez-vous personnellement déjà vécu l une des situations suivantes dans votre vie? (PLUSIEURS REPONSES POSSIBLES) QA37 Have you personally ever experienced in your life any of the following situations? (MULTIPLE ANSWERS POSSIBLE) QA37 Haben Sie in Ihrem Leben jemals persönlich eine der folgenden Situationen erlebt? (MEHRFACHNENNUNGEN MÖGLICH) Devoir rester dans un endroit précaire où vous n aviez aucun droit (p. ex. un squat) Aucun (SPONTANE) NSP Having to stay in an insecure accommodation where you had no legal rights (e. g. squatting) None (SPONTANEOUS) Sie mussten in einer unsicheren Unterkunft leben, in der Sie keine gesetzmäßigen Rechte hatten (z.b. in einem besetzten Haus) Nichts davon (SPONTAN) WN % EU 27 BE BG CZ DE EE IE EL ES FR IT CY LV LT LU HU MT NL AT PL PT RO SI SK FI SE UK

284 Special Eurobarometer 377 QA38 Quelle était la raison principale de cette situation? Diriez-vous que c était? QA38 When you experienced this, what was the main reason for the situation? Would you say it was? QA38 Was war der Hauptgrund dafür, dass Sie sich in dieser Situation befanden? Würden Sie sagen, die Hauptursache dafür war/waren...? Raisons financières La perte d un emploi Des raisons familiales Des problèmes de santé Un choix personnel Autre (SPONTANE) NSP Financial reasons Job loss Family considerations Health problems Personal choice Other (SPONTA- NEOUS) Finanzielle Gründe der Verlust des Arbeitsplatzes familiäre Gründe gesundheitliche Probleme Ihre persönliche Entscheidung Sonstige (SPONTAN) WN % EU 27 BE BG CZ DE EE IE EL ES FR IT CY LV LT LU HU MT NL AT PL PT RO SI SK FI SE UK
Flash Eurobarometer 398 WORKING CONDITIONS REPORT
 Flash Eurobarometer WORKING CONDITIONS REPORT Fieldwork: April 2014 Publication: April 2014 This survey has been requested by the European Commission, Directorate-General for Employment, Social Affairs
PUBLIC PERCEPTIONS OF VAT
 Special Eurobarometer 424 PUBLIC PERCEPTIONS OF VAT REPORT Fieldwork: October 2014 Publication: March 2015 This survey has been requested by the European Commission, Directorate-General for Taxations and
Flash Eurobarometer 470. Report. Work-life balance
 Work-life balance Survey requested by the European Commission, Directorate-General for Justice and Consumers and co-ordinated by the Directorate-General for Communication This document does not represent
Special Eurobarometer 418 SOCIAL CLIMATE REPORT
 Special Eurobarometer 418 SOCIAL CLIMATE REPORT Fieldwork: June 2014 Publication: November 2014 This survey has been requested by the European Commission, Directorate-General for Employment, Social Affairs
SOLIDARITY THAT SPANS THE GLOBE: EUROPEANS AND DEVELOPMENT AID
 Special Eurobarometer 392 SOLIDARITY THAT SPANS THE GLOBE: EUROPEANS AND DEVELOPMENT AID REPORT Fieldwork: June 2012 Publication: October 2012 This survey has been requested by Directorate-General Development
European Employment and Social Policy
 Special Eurobarometer European Commission European Employment and Social Policy Report Fieldwork : May 2009 June 2009 Publication: September 2009 Special Eurobarometer 316 / Wave 71.2 TNS Opinion & Social
Flash Eurobarometer 408 EUROPEAN YOUTH REPORT
 Flash Eurobarometer EUROPEAN YOUTH REPORT Fieldwork: December 2014 Publication: April 2015 This survey has been requested by the European Commission, Directorate-General for Education and Culture and co-ordinated
Flash Eurobarometer 458. The euro area
 The euro area Survey requested by the European Commission, Directorate-General for Economic and Financial Affairs and co-ordinated by the Directorate-General for Communication This document does not represent
Fieldwork November - December 2009 Publication June 2010
 Special Eurobarometer 337 European Commission Geographical and labour market mobility Report Fieldwork November - December 2009 Publication June 2010 Special Eurobarometer 337 / Wave TNS Opinion & Social
Flash Eurobarometer 441. Report. European SMEs and the Circular Economy
 European SMEs and the Circular Economy Survey requested by the European Commission, Directorate-General Environment and co-ordinated by the Directorate-General for Communication This document does not
Flash Eurobarometer 458. Report. The euro area
 The euro area Survey requested by the European Commission, Directorate-General for Economic and Financial Affairs and co-ordinated by the Directorate-General for Communication This document does not represent
Flash Eurobarometer 386 THE EURO AREA REPORT
 Eurobarometer THE EURO AREA REPORT Fieldwork: October 2013 Publication: November 2013 This survey has been requested by the European Commission, Directorate-General for Economic and Financial Affairs and
October 2010 Euro area unemployment rate at 10.1% EU27 at 9.6%
 STAT//180 30 November 20 October 20 Euro area unemployment rate at.1% EU27 at 9.6% The euro area 1 (EA16) seasonally-adjusted 2 unemployment rate 3 was.1% in October 20, compared with.0% in September 4.
Europeans knowledge of economic indicators
 Special Eurobarometer 323 European Commission Europeans knowledge of economic indicators Fieldwork: August - September 2009 Publication: January 2010 Special Eurobarometer 323 / Wave 72.1 TNS Opinion &
January 2010 Euro area unemployment rate at 9.9% EU27 at 9.5%
 STAT//29 1 March 20 January 20 Euro area unemployment rate at 9.9% EU27 at 9.5% The euro area 1 (EA16) seasonally-adjusted 2 unemployment rate 3 was 9.9% in January 20, the same as in December 2009 4.
Fieldwork February March 2008 Publication June 2008
 Special Eurobarometer 297 European Commission Attitudes towards radioactive waste Fieldwork February March 2008 Publication June 2008 Report Special Eurobarometer 297 / Wave 69.1 TNS Opinion & Social This
Fieldwork February March 2008 Publication October 2008
 Special Eurobarometer 298 European Commission Consumer protection in the internal market Fieldwork February March 2008 Publication October 2008 Report Special Eurobarometer 298 / Wave 69.1 TNS Opinion
Special Eurobarometer 459. Report. Climate change
 Climate change Survey requested by the European Commission, Directorate-General for Climate Action and co-ordinated by the Directorate- General for Communication This document does not represent the point
Active Ageing. Fieldwork: September November Publication: January 2012
 Special Eurobarometer 378 Active Ageing SUMMARY Special Eurobarometer 378 / Wave EB76.2 TNS opinion & social Fieldwork: September November 2011 Publication: January 2012 This survey has been requested
Flash Eurobarometer N o 189a EU communication and the citizens. Analytical Report. Fieldwork: April 2008 Report: May 2008
 Gallup Flash Eurobarometer N o 189a EU communication and the citizens Flash Eurobarometer European Commission Expectations of European citizens regarding the social reality in 20 years time Analytical
Parlemeter - November 2012 European Parliament Eurobarometer (EB/EP 78.2)
") Directorate-General for Communication Public Opinion Monitoring Unit Parlemeter - November European Parliament Eurobarometer (EB/EP 78.2) ANALYTICAL SYNTHESIS Brussels, 14 February 2013. Coverage: Population:
Directorate-General for Communication Public Opinion Monitoring Unit Parlemeter - November European Parliament Eurobarometer (EB/EP 78.2) ANALYTICAL SYNTHESIS Brussels, 14 February 2013. Coverage: Population:
Social Protection and Social Inclusion in Europe Key facts and figures
 MEMO/08/625 Brussels, 16 October 2008 Social Protection and Social Inclusion in Europe Key facts and figures What is the report and what are the main highlights? The European Commission today published
Two years to go to the 2014 European elections European Parliament Eurobarometer (EB/EP 77.4)
") Directorate-General for Communication PUBLIC OPINION MONITORING UNIT Brussels, 23 October 2012. Two years to go to the 2014 European elections European Parliament Eurobarometer (EB/EP 77.4) FOCUS ON THE
Directorate-General for Communication PUBLIC OPINION MONITORING UNIT Brussels, 23 October 2012. Two years to go to the 2014 European elections European Parliament Eurobarometer (EB/EP 77.4) FOCUS ON THE
Securing sustainable and adequate social protection in the EU
 Securing sustainable and adequate social protection in the EU Session on Social Protection & Security IFA 12th Global Conference on Ageing 11 June 2014, HICC Hyderabad India Dr Lieve Fransen European Commission
DATA SET ON INVESTMENT FUNDS (IVF) Naming Conventions
 Naming Conventions") DIRECTORATE GENERAL STATISTICS LAST UPDATE: 10 APRIL 2013 DIVISION MONETARY & FINANCIAL STATISTICS ECB-UNRESTRICTED DATA SET ON INVESTMENT FUNDS (IVF) Naming Conventions The series keys related to Investment
DIRECTORATE GENERAL STATISTICS LAST UPDATE: 10 APRIL 2013 DIVISION MONETARY & FINANCIAL STATISTICS ECB-UNRESTRICTED DATA SET ON INVESTMENT FUNDS (IVF) Naming Conventions The series keys related to Investment
Standard Eurobarometer
 Standard Eurobarometer 67 / Spring 2007 Standard Eurobarometer European Commission SPECIAL EUROBAROMETER EUROPEANS KNOWELEDGE ON ECONOMICAL INDICATORS 1 1 This preliminary analysis is done by Antonis PAPACOSTAS
Growth, competitiveness and jobs: priorities for the European Semester 2013 Presentation of J.M. Barroso,
 Growth, competitiveness and jobs: priorities for the European Semester 213 Presentation of J.M. Barroso, President of the European Commission, to the European Council of 14-1 March 213 Economic recovery
Europeans attitudes towards the issue of sustainable consumption and production. Analytical report
 Flash Eurobarometer 256 The Gallup Organisation Analytical Report Flash EB N o 251 Public attitudes and perceptions in the euro area Flash Eurobarometer European Commission Europeans attitudes towards
Gender pension gap economic perspective
 Gender pension gap economic perspective Agnieszka Chłoń-Domińczak Institute of Statistics and Demography SGH Part of this research was supported by European Commission 7th Framework Programme project "Employment
New Europeans. Fieldwork : March 2010 April 2010 Publication: April 2011
 Special Eurobarometer European Commission New Europeans Report Fieldwork : March 2010 April 2010 Publication: April 2011 Special Eurobarometer 346 / Wave TNS Opinion & Social This survey was requested
Themes Income and wages in Europe Wages, productivity and the wage share Working poverty and minimum wage The gender pay gap
 5. W A G E D E V E L O P M E N T S At the ETUC Congress in Seville in 27, wage developments in Europe were among the most debated issues. One of the key problems highlighted in this respect was the need
I. EUROPEANS AND THE TAX ON FINANCIAL TRANSACTION (TFT)...10 IV. THE REACTIONS OF THE MEMBER STATES TO THE CRISIS...19
...10 IV. THE REACTIONS OF THE MEMBER STATES TO THE CRISIS...19") Directorate General for Communication Directorate C - Relations with Citizens PUBLIC OPINION MONITORING UNIT Brussels, 22 June 2011 EUROPEANS AND THE CRISIS European Parliament Eurobarometer ( Parlemeter
Directorate General for Communication Directorate C - Relations with Citizens PUBLIC OPINION MONITORING UNIT Brussels, 22 June 2011 EUROPEANS AND THE CRISIS European Parliament Eurobarometer ( Parlemeter
Development Aid in times of economic turmoil
 Special Eurobarometer European Commission Development Aid in times of economic turmoil Fieldwork: May 2009 June 2009 Publication: October 2009 Special Eurobarometer 318 / Wave 71.2 TNS Opinion & Social
No work in sight? The role of governments and social partners in fostering labour market inclusion of young people
 No work in sight? The role of governments and social partners in fostering labour market inclusion of young people Joint seminar of the European Parliament and EU agencies 30 June 2011 1. Young workers
EUROBAROMETER 71. Fieldwork: June - July 2009 Publication: January 2010
 EUROBAROMETER 66 Standard Eurobarometer Report European Commission EUROBAROMETER 71 Future of Europe Fieldwork: June - July 2009 Publication: January 2010 Standard Eurobarometer 71/ Spring 2009 - TNS Opinion
Attitudes of Europeans Towards Tourism REPORT
 Flash Eurobarometer Attitudes of Europeans Towards Tourism REPORT Fieldwork: January 22 Publication: March 22 This survey has been requested by the Directorate-General Enterprise and co-ordinated by Directorate-
Eurofound in-house paper: Part-time work in Europe Companies and workers perspective
 Eurofound in-house paper: Part-time work in Europe Companies and workers perspective Presented by: Eszter Sandor Research Officer, Surveys and Trends 26/03/2010 1 Objectives Examine the patterns of part-time
Europeans attitudes towards climate change. Report. Special Eurobarometer 300. Fieldwork March April 2008 Publication September 2008
 Special Eurobarometer 300 EUROPEAN PARLIAMENT European Commission Europeans attitudes towards climate change Fieldwork March April 2008 Publication September 2008 Report Special Eurobarometer 300 / Wave
ENTREPRENEURSHIP IN THE EU AND BEYOND
 Flash Eurobarometer 354 ENTREPRENEURSHIP IN THE EU AND BEYOND COUNTRY REPORT SPAIN Fieldwork: June 2012 This survey has been requested by the European Commission, Directorate-General Enterprise and Industry
Introduction of the euro in the new member states
 EOS Gallup Europe Introduction of the euro in the new member states - Report p. 1 Introduction of the euro in the new member states Conducted by EOS Gallup Europe upon the request of the European Commission.
Vocational Training. Fieldwork October-November 2004 Publication August 2005
 Special Eurobarometer European Commission Vocational Training Fieldwork October-November 2004 Publication August 2005 Special Eurobarometer 216 / Wave 62..1 TNS Opinion & Social This survey was requested
Standard Eurobarometer 83 Spring 2015 THE EU BUDGET REPORT
 Standard Eurobarometer 83 Spring 2015 THE EU BUDGET REPORT Fieldwork: May 2015 This survey has been requested and co-ordinated by the European Commission, Directorate-General for Communication. http://ec.europa.eu/public_opinion/index_en.htm
Employment of older workers Research Note no. 5/2015
 Research Note no. 5/2015 E. Őzdemir, T. Ward M. Fuchs, S. Ilinca, O. Lelkes, R. Rodrigues, E. Zolyomi February - 2016 EUROPEAN COMMISSION Directorate-General for Employment, Social Affairs and Inclusion
PROGRESS TOWARDS THE LISBON OBJECTIVES 2010 IN EDUCATION AND TRAINING
 PROGRESS TOWARDS THE LISBON OBJECTIVES IN EDUCATION AND TRAINING In 7, reaching the benchmarks for continues to pose a serious challenge for education and training systems in Europe, except for the goal
Taxation trends in the European Union EU27 tax ratio at 39.8% of GDP in 2007 Steady decline in top personal and corporate income tax rates since 2000
 DG TAXUD STAT/09/92 22 June 2009 Taxation trends in the European Union EU27 tax ratio at 39.8% of GDP in 2007 Steady decline in top personal and corporate income tax rates since 2000 The overall tax-to-gdp
Eco-label Flower week 2006
 Special Eurobarometer European Commission Eco-label Flower week 2006 Fieldwork: November-December 2006 Publication: January 2007 Special Eurobarometer 275 / Wave 66.3 TNS Opinion & Social This survey was
0pinions on organised, cross-border crime and corruption
 Special Eurobarometer European Commission 0pinions on organised, cross-border crime and corruption Fieldwork: November - December 2005 Publication: March 2006 Special Eurobarometer 245 / Wave 64.3 TNS
COVER NOTE The Employment Committee Permanent Representatives Committee (Part I) / Council EPSCO Employment Performance Monitor - Endorsement
 / Council EPSCO Employment Performance Monitor - Endorsement") COUNCIL OF THE EUROPEAN UNION Brussels, 15 June 2011 10666/1/11 REV 1 SOC 442 ECOFIN 288 EDUC 107 COVER NOTE from: to: Subject: The Employment Committee Permanent Representatives Committee (Part I) / Council
COUNCIL OF THE EUROPEAN UNION Brussels, 15 June 2011 10666/1/11 REV 1 SOC 442 ECOFIN 288 EDUC 107 COVER NOTE from: to: Subject: The Employment Committee Permanent Representatives Committee (Part I) / Council
Overview of Eurofound surveys
 Overview of Eurofound surveys Dublin 21 st October 2010 Maija Lyly-Yrjänäinen Eurofound data European Working Conditions Survey 91, 95, 00, 05, 10 European Quality of Life Survey 03, 07, 09, 10 (EB), 11
Taylor & Francis Open Access Survey Open Access Mandates
 Taylor & Francis Open Access Survey Open Access Mandates Annex C European Union November 2014 November 2014 0 The results presented in this report are based on research carried out on behalf of Taylor
Social climate. Fieldwork May-June 2009 Publication January 2010
 Special Eurobarometer European Commission Social climate Full report Fieldwork May-June 2009 Publication January 2010 Special Eurobarometer 315 / Wave - European Opinion Research Group EEIG This survey
of the European Commission. Communication. This document of the authors. Standard Eurobarometer 75 / Spring 2011 TNS opinion & social
 Standard Eurobarometer European Commission EUROBAROMETER 75 SPRING 2011 Europeans and the European Union budget REPORT Standard Eurobarometer 75 / Spring 2011 TNS opinion & social Fieldwork: May 2011 Publication:
NOTE ON EU27 CHILD POVERTY RATES
 NOTE ON EU7 CHILD POVERTY RATES Research note prepared for Child Poverty Action Group Authors: H. Xavier Jara and Chrysa Leventi Institute for Social and Economic Research (ISER) University of Essex The
Special Eurobarometer 465. Gender Equality 2017
 Summary Gender Equality 01 Gender Pay Gap Survey requested by the European Commission, Directorate-General for Justice and Consumers and co-ordinated by the Directorate-General for Communication This document
PROGRESS TOWARDS THE LISBON OBJECTIVES 2010 IN EDUCATION AND TRAINING
 PROGRESS TOWARDS THE LISBON OBJECTIVES IN EDUCATION AND TRAINING In, reaching the benchmarks for continues to pose a serious challenge for education and training systems in Europe, except for the goal
The 2009 European elections
 Special Eurobarometer 299 EUROPEAN PARLIAMENT European Commission The 2009 European elections Fieldwork: March May 2008 Publication: September 2008 Report Special Eurobarometer 299/ Wave 69.2 TNS opinion
Safer Internet. Fieldwork Dec Jan 2006 Publication May 2006
 Special Eurobarometer European Commission Safer Internet Fieldwork Dec 2005 - Jan 2006 Publication May 2006 Special Eurobarometer 250 / Wave 64.4 TNS Opinion & Social This survey was requested by Directorate
Fieldwork: October 2006 Report: December 2006
 Flash Eurobarometer European Commission Business attitudes towards cross-border sales and consumer protection Summary Fieldwork: October 2006 Report: December 2006 Flash Eurobarometer 186 The Gallup Organization
Two years to go to the 2014 European elections European Parliament Eurobarometer (EB/PE 77.4)
") Directorate-General for Communication Public Opinion Monitoring Unit Two years to go to the 2014 European elections European Parliament Eurobarometer (EB/PE 77.4) Brussels, 6 February 2013 FOCUS REPORT
Directorate-General for Communication Public Opinion Monitoring Unit Two years to go to the 2014 European elections European Parliament Eurobarometer (EB/PE 77.4) Brussels, 6 February 2013 FOCUS REPORT
Europeans and the Common Agricultural Policy
 Special Eurobarometer European Commission Europeans and the Common Agricultural Policy Fieldwork October - November 2005 Publication January 2006 Special Eurobarometer 242 / Wave 64.2 - TNS Opinion & Social
January 2009 Euro area external trade deficit 10.5 bn euro 26.3 bn euro deficit for EU27
 STAT/09/40 23 March 2009 January 2009 Euro area external trade deficit 10.5 26.3 deficit for EU27 The first estimate for the euro area 1 (EA16) trade balance with the rest of the world in January 2009
Investment in Germany and the EU
 Investment in Germany and the EU Pedro de Lima Head of the Economics Studies Division Economics Department Berlin 19/12/2016 11/01/2017 1 Slow recovery of investment, with strong heterogeneity Overall
HOW RECESSION REFLECTS IN THE LABOUR MARKET INDICATORS
 REPUBLIC OF SLOVENIA HOW RECESSION REFLECTS IN THE LABOUR MARKET INDICATORS Matej Divjak, Irena Svetin, Darjan Petek, Miran Žavbi, Nuška Brnot ??? What is recession?? Why in Europe???? Why in Slovenia?
Report on the distribution of direct payments to agricultural producers (financial year 2016)
") Report on the distribution of direct payments to agricultural producers (financial year 2016) Every year, the Commission publishes the distribution of direct payments to farmers by Member State. Figures
Report on the distribution of direct payments to agricultural producers (financial year 2016) Every year, the Commission publishes the distribution of direct payments to farmers by Member State. Figures
Investment in France and the EU
 Investment in and the EU Natacha Valla March 2017 22/02/2017 1 Change relative to 2008Q1 % of GDP Slow recovery of investment, and with strong heterogeneity Overall Europe s recovery in investment is slow,
May 2009 Euro area external trade surplus 1.9 bn euro 6.8 bn euro deficit for EU27
 STAT/09/106 17 July 2009 May 2009 Euro area external trade surplus 1.9 6.8 deficit for EU27 The first estimate for the euro area 1 (EA16) trade balance with the rest of the world in May 2009 gave a 1.9
The EFTA Statistical Office: EEA - the figures and their use
 The EFTA Statistical Office: EEA - the figures and their use EEA Seminar Brussels, 13 September 2012 1 Statistics Comparable, impartial and reliable statistical data are a prerequisite for a democratic
November 5, Very preliminary work in progress
 November 5, 2007 Very preliminary work in progress The forecasting horizon of inflationary expectations and perceptions in the EU Is it really 2 months? Lars Jonung and Staffan Lindén, DG ECFIN, Brussels.
STAT/14/ October 2014
 STAT/14/158-21 October 2014 Provision of deficit and debt data for 2013 - second notification Euro area and EU28 government deficit at 2.9% and 3.2% of GDP respectively Government debt at 90.9% and 85.4%
European Commission Directorate-General "Employment, Social Affairs and Equal Opportunities" Unit E1 - Social and Demographic Analysis
 Research note no. 1 Housing and Social Inclusion By Erhan Őzdemir and Terry Ward ABSTRACT Housing costs account for a large part of household expenditure across the EU.Since everyone needs a house, the
Transition from Work to Retirement in EU25
 EUROPEAN CENTRE EUROPÄISCHES ZENTRUM CENTRE EUROPÉEN 1 Asghar Zaidi is Director Research at the European Centre for Social Welfare Policy and Research, Vienna; Michael Fuchs is Researcher at the European
The Trend Reversal of the Private Credit Market in the EU
 The Trend Reversal of the Private Credit Market in the EU Key Findings of the ECRI Statistical Package 2016 Roberto Musmeci*, September 2016 The ECRI Statistical Package 2016, Lending to Households and
Fiscal competitiveness issues in Romania
 Fiscal competitiveness issues in Romania Ionut Dumitru President of the Fiscal Council, Chief Economist Raiffeisen Bank* October 2014 World Bank Doing Business Report Ranking (out of 189 countries) Ease
in focus Statistics T he em ploym ent of senior s in t he Eur opean Union Contents POPULATION AND SOCIAL CONDITIONS 15/2006 Labour market
 T he em ploym ent of senior s in t he Eur opean Union Statistics in focus OULATION AND SOCIAL CONDITIONS 15/2006 Labour market Authors Christel ALIAGA Fabrice ROMANS Contents In 2005, in the EU-25, 22.2
August 2008 Euro area external trade deficit 9.3 bn euro 27.2 bn euro deficit for EU27
 STAT/08/143 17 October 2008 August 2008 Euro area external trade deficit 9.3 27.2 deficit for EU27 The first estimate for the euro area 1 (EA15) trade balance with the rest of the world in August 2008
Investment in Ireland and the EU
 Investment in and the EU Debora Revoltella Director Economics Department Dublin April 10, 2017 20/04/2017 1 Real investment: IE v EU country groupings Real investment (2008 = 100) 180 160 140 120 100 80
Swedish Fiscal Policy. Martin Flodén, Laura Hartman, Erik Höglin, Eva Oscarsson and Helena Svaleryd Meeting with IMF 3 June 2010
 Swedish Fiscal Policy Martin Flodén, Laura Hartman, Erik Höglin, Eva Oscarsson and Helena Svaleryd Meeting with IMF 3 June 21 The S2 indicator Ireland Greece Luxembourg United Slovenia Spain Lithuania
COMMISSION DECISION of 23 April 2012 on the second set of common safety targets as regards the rail system (notified under document C(2012) 2084)
 2084)") 27.4.2012 Official Journal of the European Union L 115/27 COMMISSION DECISION of 23 April 2012 on the second set of common safety targets as regards the rail system (notified under document C(2012) 2084)
27.4.2012 Official Journal of the European Union L 115/27 COMMISSION DECISION of 23 April 2012 on the second set of common safety targets as regards the rail system (notified under document C(2012) 2084)
Scenario for the European Insurance and Occupational Pensions Authority s EU-wide insurance stress test in 2016
 17 March 2016 ECB-PUBLIC Scenario for the European Insurance and Occupational Pensions Authority s EU-wide insurance stress test in 2016 Introduction In accordance with its mandate, the European Insurance
in focus Statistics Contents Labour Mar k et Lat est Tr ends 1st quar t er 2006 dat a Em ploym ent r at e in t he EU: t r end st ill up
 Labour Mar k et Lat est Tr ends 1st quar t er 2006 dat a Em ploym ent r at e in t he EU: t r end st ill up Statistics in focus This publication belongs to a quarterly series presenting the European Union
Air Passengers Rights
 Special Eurobarometer European Commission Air Passengers Rights Report Fieldwork: May June 2009 Publication: December 2009 Special Eurobarometer 319 / Wave 71.2 TNS Opinion & Social This survey was requested
Investment and Investment Finance. the EU and the Polish story. Debora Revoltella
 Investment and Investment Finance the EU and the Polish story Debora Revoltella Director - Economics Department EIB Warsaw 27 February 2017 Narodowy Bank Polski European Investment Bank Contents We look
Increasing the fiscal sustainability of health care systems in the European Union to ensure access to high quality health services for all
 Increasing the fiscal sustainability of health care systems in the European Union to ensure access to high quality health services for all EPC Santander, 6 September 2013 Christoph Schwierz Sustainability
COUNCIL OF THE EUROPEAN UNION. Brussels, 13 June /1/13 REV 1 SOC 409 ECOFIN 444 EDUC 190
 COUNCIL OF THE EUROPEAN UNION Brussels, 13 June 2013 10373/1/13 REV 1 SOC 409 ECOFIN 444 EDUC 190 COVER NOTE from: to: Subject: The Employment Committee Permanent Representatives Committee (Part I) / Council
EUROSTAT SUPPLEMENTARY TABLE FOR REPORTING GOVERNMENT INTERVENTIONS TO SUPPORT FINANCIAL INSTITUTIONS
 EUROPEAN COMMISSION EUROSTAT Directorate D: Government Finance Statistics (GFS) and Quality Unit D1: Excessive deficit procedure and methodology Unit D2: Excessive deficit procedure (EDP) 1 Unit D3: Excessive
H Marie Skłodowska-Curie Actions (MSCA)
") H2020 Key facts and figures (2014-2020) Number of IE researchers funded by MSCA: EU budget awarded to IE organisations (EUR million): Number of IE organisations in MSCA: 253 116,04 116 In detail, the number
H2020 Key facts and figures (2014-2020) Number of IE researchers funded by MSCA: EU budget awarded to IE organisations (EUR million): Number of IE organisations in MSCA: 253 116,04 116 In detail, the number
EUROPEAN SEMESTER THEMATIC FACTSHEET SOCIAL INCLUSION
 EUROPEAN SEMESTER THEMATIC FACTSHEET SOCIAL INCLUSION 1. INTRODUCTION Fighting poverty or social exclusion is a key political priority for the European Commission. Since 2010, this has been mainstreamed
Health and food. Fieldwork November December 2005 Publication November 2006
 Special Eurobarometer European Commission Health and food Fieldwork November December 2005 Publication November 2006 Special Eurobarometer 246 / Wave 64.3 TNS Opinion & Social This survey was requested
H Marie Skłodowska-Curie Actions (MSCA)
") H2020 Key facts and figures (2014-2020) Number of BE researchers funded by MSCA: EU budget awarded to BE organisations (EUR million): Number of BE organisations in MSCA: 274 161,04 227 In detail, the number
H2020 Key facts and figures (2014-2020) Number of BE researchers funded by MSCA: EU budget awarded to BE organisations (EUR million): Number of BE organisations in MSCA: 274 161,04 227 In detail, the number
Fiscal sustainability challenges in Romania
 Preliminary Draft For discussion only Fiscal sustainability challenges in Romania Bucharest, May 10, 2011 Ionut Dumitru Anca Paliu Agenda 1. Main fiscal sustainability challenges 2. Tax collection issues
Country Health Profiles
 State of Health in the EU Country Health Profiles Brussels, November 2017 1 The Country Health Profiles 1. Highlights 2. Health status 3. Risk Factors 4. Health System (description) 5. Performance of Health
Entrepreneurship in the EU and beyond. Analytical report
 Flash Eurobarometer The Gallup Organization Flash Eurobarometer European Commission Entrepreneurship in the EU and beyond A survey in the EU, EFTA countries, Croatia, Turkey, the US, Japan, South Korea
COMMISSION STAFF WORKING DOCUMENT Accompanying the document. Report form the Commission to the Council and the European Parliament
 EUROPEAN COMMISSION Brussels, 4.5.2018 SWD(2018) 246 final PART 5/9 COMMISSION STAFF WORKING DOCUMENT Accompanying the document Report form the Commission to the Council and the European Parliament on
Long-term unemployment: Council Recommendation frequently asked questions
 EUROPEAN COMMISSION MEMO Brussels, 15 February 2016 Long-term unemployment: Council Recommendation frequently asked questions Why a focus on long-term unemployment? The number of long-term unemployed persons
H Marie Skłodowska-Curie Actions (MSCA)
") H2020 Key facts and figures (2014-2020) Number of NL researchers funded by MSCA: EU budget awarded to NL organisations (EUR million): Number of NL organisations in MSCA: 427 268.91 351 In detail, the number
H2020 Key facts and figures (2014-2020) Number of NL researchers funded by MSCA: EU budget awarded to NL organisations (EUR million): Number of NL organisations in MSCA: 427 268.91 351 In detail, the number
The Skillsnet project on Medium-term forecasts of occupational skill needs in Europe: Replacement demand and cohort change analysis
 The Skillsnet project on Medium-term forecasts of occupational skill needs in Europe: Replacement demand and cohort change analysis Paper presented at the Workshop on Medium-term forecast of occupational
State of play of CAP measure Setting up of Young Farmers in the European Union
 State of play of CAP measure Setting up of Young Farmers in the European Union Michael Gregory EN RD Contact Point Seminar CEJA 20 th September 2010 Measure 112 rationale: Measure 112 - Setting up of young
H Marie Skłodowska-Curie Actions (MSCA)
") H2020 Key facts and figures (2014-2020) Number of FR researchers funded by MSCA: EU budget awarded to FR organisations (EUR million): Number of FR organisations in MSCA: 1 072 311.72 479 In detail, the
H2020 Key facts and figures (2014-2020) Number of FR researchers funded by MSCA: EU budget awarded to FR organisations (EUR million): Number of FR organisations in MSCA: 1 072 311.72 479 In detail, the
In 2009 a 6.5 % rise in per capita social protection expenditure matched a 6.1 % drop in EU-27 GDP
 Population and social conditions Authors: Giuseppe MOSSUTI, Gemma ASERO Statistics in focus 14/2012 In 2009 a 6.5 % rise in per capita social protection expenditure matched a 6.1 % drop in EU-27 GDP Expenditure
2 ENERGY EFFICIENCY 2030 targets: time for action
 ENERGY EFFICIENCY 2030 targets: time for action The Coalition for Energy Savings The Coalition for Energy Savings strives to make energy efficiency and savings the first consideration of energy policies