Special Eurobarometer 418 SOCIAL CLIMATE REPORT
|
|
|
- Cameron Smith
- 5 years ago
- Views:
Transcription


1 Special Eurobarometer 418 SOCIAL CLIMATE REPORT Fieldwork: June 2014 Publication: November 2014 This survey has been requested by the European Commission, Directorate-General for Employment, Social Affairs and Inclusion and co-ordinated by Directorate-General for Communication. This document does not represent the point of view of the European Commission. The interpretations and opinions contained in it are solely those of the authors. Special Eurobarometer 418 / Wave EB81.5 TNS Opinion & Social
2 Project title Special Eurobarometer Social climate Linguistic Version Catalogue Number EN KE EN-N ISBN DOI /54999 European Union, 2014
3 Special Eurobarometer 418 Social climate Conducted by TNS opinion & social at the request of the Directorate-General for Employment, Social Affairs and Inclusion Survey co-ordinated by the Directorate-General for Communication
4 TABLE OF CONTENTS INTRODUCTION... 2 EXECUTIVE SUMMARY... 4 I. SOCIAL CLIMATE INDEX... 8 II. CURRENT SITUATION Personal situation Country Social protection and inclusion III. EXPECTATIONS FOR THE NEXT 12 MONTHS Personal situation Country Social protection and inclusion IV. CHANGES IN THE LAST 5 YEARS Personal situation Country Social protection and inclusion GENERAL CONCLUSIONS ANNEXES Technical specifications Questionnaire Tables 1
5 INTRODUCTION This report presents the results of the sixth in a series of Eurobarometer surveys undertaken with the overall objective of providing an up-to-date picture of European citizens perceptions of the current social climate. It examines their views on 15 separate aspects relating to personal circumstances, the national picture and social protection and inclusion. How do Europeans judge the present situation, how does it compare with five years ago and what are their expectations over the next 12 months will things improve, worsen or remain the same? The first in this series of surveys was conducted in June , eight months after the financial and economic crisis within Europe began. By June 2010, when the second wave of the survey was conducted 2, whilst there were signs of improvement in some Member States, the overall position was still one of economic difficulty. Twelve months later, when the third wave was conducted in June , there had been further improvement in the situation with an increase in EU27 Gross Domestic Product (GDP) and a fall in unemployment. However, by the end of 2011, the European debt crisis had worsened, with Greece, Italy, Ireland, Spain and Portugal receiving a financial bail-out. By June 2012, when the fourth wave of the survey was conducted 4, there were signs of a possible recovery, with first quarter GDP stabilizing after negative growth in the fourth quarter of Since June 2013 (when the last survey was conducted), and to set the context for this latest wave of research, signs of an economic recovery have continued although it is still modest. That said, the economic situation and the recovery within the EU remain fragile and large disparities continue across Member States underpinned by structural challenges, financing costs and public finances sustainability. The latest wave of the Social Climate survey was carried out by TNS opinion & social network in the 28 Member States of the European Union between the 14 th and 27 th June It evaluates Europeans current perceptions of their own situation and that of their country. Some respondents from different social and demographic groups were interviewed face-to-face at home on behalf of Directorate-General for Employment, Social Affairs & Inclusion. The methodology used is that of Eurobarometer surveys as carried out by the DG for Communication ( Strategy, Corporate Communication Actions and Eurobarometer Unit) 5.. A technical note on the manner in which interviews were conducted by the Institutes within the TNS opinion & social network is appended as an annex to this report. Also included are the interview methods and confidence intervals The results tables are included in the annex. 2
6 The findings of the survey have been analysed firstly at EU level and secondly by country. At an EU level the results are based on the 28 Member States. Some of the results have also been compared with the five previous waves of the survey conducted in 2013, 2012, 2011, 2010 and , and some have been compared with the previous wave of research in Where appropriate a range of socio-demographic variables respondents age, terminal education age, occupation and ability to pay household bills - have been used to provide further analysis. Note: In this report, countries are referred to by their official abbreviation. The abbreviations used in this report correspond to: ABBREVIATIONS BE Belgium LT Lithuania BG Bulgaria LU Luxembourg CZ Czech Republic HU Hungary DK Denmark MT Malta DE Germany NL The Netherlands EE Estonia AT Austria IE Ireland PL Poland EL Greece PT Portugal ES Spain RO Romania FR France SI Slovenia HR Croatia SK Slovakia IT Italy FI Finland CY Republic of Cyprus*** SE Sweden LV Latvia UK The United Kingdom EU28 EU15 NMS13 EURO AREA European Union 28 Member States BE, IT, FR, DE, LU, NL, DK, UK, IE, PT, ES, EL, AT, SE, FI* BG, CZ, EE, HR, CY, LT, LV, MT, HU, PL, RO, SI, SK** BE, FR, IT, LU, DE, AT, ES, PT, IE, NL, FI, EL, EE, SI, CY, MT, SK, LV * EU15 refers to the 15 countries forming the European Union before the enlargements of 2004, 2007 and 2013 ** The NMS13 are the 13 new Member States which joined the European Union during the 2004, 2007 and 2013 enlargements *** Cyprus as a whole is one of the 28 European Union Member States. However, the acquis communautaire has been suspended in the part of the country which is not controlled by the government of the Republic of Cyprus. For practical reasons, only the interviews carried out in the part of the country controlled by the government of the Republic of Cyprus are included in the CY category and in the EU28 average. * * * * * We wish to thank the people throughout Europe who have given their time to take part in this survey. Without their active participation, this study would not have been possible. 7 At an EU level previous waves of the survey are based on 27 Member States. Croatia joined the EU on the 1 st July 2013, after fieldwork for the 2013 survey was conducted. 3
7 EXECUTIVE SUMMARY Europeans are divided in their overall perception of the current situation. The EU social climate index, which takes into account views on personal circumstances, the national picture and social protection and inclusion, is -1 in It is slightly lower than the 2013 index (-0.9), and is the lowest index recorded in the series. At a national level the social climate index ranges from a high of 3.1 (in Malta) to a low of -5.3 (in Greece). The most positive perceptions are found in the Benelux and Nordic countries, along with Malta, Austria and Germany. The Member States with a positive index are Malta (3.1), Denmark (2.9), Luxembourg and the Netherlands (both 2.2), Austria (1.8), Sweden (1.7), Germany (1.6), Finland (1.3), Belgium (0.6), the UK and Estonia (both 0.1). With the exception of Estonia, these Member States have formed the top ten in the overall social climate index in each of the six years of the survey 8. Estonia has ranked in the top ten in three of the six surveys: 2010, 2011 and Only four of these eleven Member States show an improvement in the social climate index since 2013: Malta (up 2.1 points), Estonia (up 0.6 points), the Netherlands (up 0.3 points) and Denmark (up 0.1). The largest decline in the social climate index can be observed in Sweden (down 0.6 points) followed by Belgium (down 0.5), Luxembourg (down 0.4), Austria, Germany and the UK (all down by 0.3 points), and Finland (down 0.2). Compared with the 2009 indices, six of these eleven Member States show an improvement, with the most notable in Malta (up 3.3 points), followed by Germany (up 1.3), Estonia (up 0.5), Austria (up 0.2) and Denmark and the UK (both up 0.1 point). The largest decline in the index can be seen in Belgium and in the Netherlands (both down 0.4 points) followed by Luxembourg, Sweden and Finland (all down 0.1 point). The least positive perceptions can be seen in southern and eastern Member States. Greece is the lowest ranked Member State with an index of -5.3, followed by Bulgaria (-3.6), Romania and Cyprus (both -3.4), Croatia (-3.3), Italy (-3), Portugal (-2.6), Hungary (-2.3), Spain (-2.2) and Slovakia (-2.1). Greece has been the lowest ranked Member State on this overall measure in five of the six years, the exception being 2010, when it ranked ahead of Romania. 8 Including countries ranked equal tenth in any survey year 4
8 The social climate index has dropped in three of these ten Member States since 2013, with the most marked decline in Bulgaria (down 0.3 points), and followed by Slovakia and Italy (both down 0.1). The index in Cyprus remains unchanged, with the largest improvement in the social climate index in Portugal (up 0.8 points) followed by Romania (up 0.6), Spain (up 0.5), Croatia (up 0.2) and Hungary and Greece (both up 0.1 points). Compared with the 2009 indices only one Member State has improved - Hungary (up 1.4). The only other Member States with a positive shift in their social climate index since 2013 are Ireland up 0.4 points (to -0.9); Lithuania up 0.2 points (to -1.4); Poland up 0.2 points (to -1.8); and Slovenia up 0.1 point (to -1.9). Respondents who say that they almost always struggle to pay their household bills have an overall social climate index of -4.1, compared with an index of -2.2 for those who struggle from time to time and a positive index of 0.2 for those who almost never have difficulty paying their household bills. The index for those who struggle to pay bills from time to time (down 0.2 points) and for those who almost never have difficulty paying their bills (down 0.1 point) has slightly worsened since The indices for these two groups are now at their lowest level in the series. Respondents who are unemployed have a lower overall social climate index (-3.3) than all other occupational groups, while those in managerial jobs have the highest index (0.6). Managers are the only occupational group with a positive score. Europeans hold more positive perceptions about their personal situation than they do about national indicators. In terms of their personal situation, they are most positive about the area in which they live (4.3) and their life in general (2.5), and somewhat less positive about their personal job situation (1.2) and the financial situation of their household (0.8). In terms of their perceptions of measures associated with social protection and inclusion, Europeans have a positive index on the healthcare system (1) and are divided in their opinions about the relations between people from different cultural and religious backgrounds or nationalities (0). They are less satisfied with unemployment benefits (-1.4) and the pension system (-1.7), and even less so about the way inequalities and poverty are addressed in their country (-3). Europeans are least positive about national indicators, notably those that most immediately affect their own economic situation: the employment situation (-4.1), the affordability of housing (-3.3), the cost of living (-2.9), their national economy (-2.6), and the affordability of energy (-2.5). They are somewhat less negative about the way in which public administration runs (-1.7). The indices for eight of the 15 measures have declined from their 2013 levels by between 0.1 and 0.6 points, with two remaining the same and five increasing by between 0.1 and 0.9 points. 5
9 The five measures where indices have improved are: the economy up 0.9 points; local area up 0.4 points; the cost of living and unemployment benefits both up 0.2 points; and the national employment situation up 0.1 point. The indices for personal job situation and energy affordability remain unchanged. On the remaining eight measures, the most notable drops in opinion can be seen for the way in which poverty and inequalities are addressed (down 0.6 points); life in general and the affordability of housing (both down 0.4 points); and relations between people from different cultural or religious backgrounds or nationalities (down 0.3). The majority of Europeans expect no change to their personal situation in the next 12 months in relation to their local area (75%), their life in general (59%), and their job situation (60%) and household finances (61%). Those who expect change are a little more likely to think things will improve than that they will get worse. In relation to the six national indicators, the only measure where a majority of Europeans expect no change in the next 12 months is in the way public administration is run (59%). Across all six indicators those who expect change are more likely to think things will become worse rather than improve: slightly more likely in relation to the national economy and employment situation, and much more likely in relation to the cost of living, housing affordability and energy affordability. On four out of the five social protection and inclusion indicators, the majority of Europeans expect the situation to remain unchanged in the next 12 months: the national healthcare system (57%), relations between people from different cultural or religious backgrounds or nationalities (56%), the way inequalities and poverty are addressed (53%) and unemployment benefits (51%). Just under half of Europeans expect no change to pension system (49%). Across all five measures those who expect change are much more likely to think things will worsen than improve. Europeans hold a more optimistic outlook than they did in 2013 with a positive shift in the net balance of opinion 9 across each of the 15 indicators, most marked in relation to their expectations with regard to the economy and national employment situation, followed by the cost of living, pension system and unemployment benefits. 9 The difference between the proportion who say things will improve and the proportion who say they will get worse 6
10 On the measures relating to respondents personal circumstances, Europeans are most likely to think that their situation is similar to five years ago in terms of the area in which they live (60%) and their personal job situation (47%). In terms of the household financial situation and life in general opinion is more evenly divided between those who think the situation is unchanged and those who think it has got worse: 42% vs. 38% on household financial situation and 40% vs. 33% on general life. Where respondents do perceive things to have changed they are more likely to say that they have got worse than that they have improved in relation to: household finances (38% vs. 17%); personal job situation (26% vs. 17%) and general life (33% vs. 26%). Opinion is evenly divided on changes in the local area (18% vs. 19%). Europeans widely perceive the national situation to have deteriorated when compared with five years ago across five of the six national indicators, with most thinking the situation is worse in terms of the cost of living (74%), the affordability of energy (63%) and of housing (62%), the national employment situation (60%) and the national economy (57%). A large minority (38%) think the way public administration is run has got worse. On the five social protection and inclusion indicators, only a minority of Europeans perceive the situation is the same as it was five years ago. The majority of Europeans think that pension system is worse (52%), just under half perceive the situation has become worse in relation to the healthcare system (46%) and the way their country addresses inequalities and poverty (46%) and a slightly smaller proportion (43%) think that unemployment benefits are worse. The only measure where Europeans are more likely to say the situation remains unchanged than it has worsened is relations between people from different cultural or religious backgrounds or nationalities (44% unchanged vs. 37% got worse). Europeans are now somewhat more positive about the current situation relative to five years ago than they were in There has been a positive shift in the net balance of opinion on each of the 15 indicators, albeit in most cases relatively small. The largest positive shifts in opinion are in relation to the economy and the national employment situation. 7
11 I. SOCIAL CLIMATE INDEX This first chapter of the report provides an overview of the current social climate in the EU and how this compares to perceptions held over the last five years. The chapter examines Europeans overall perceptions of the current situation, taking into account their views on personal circumstances, the national picture and areas relating to social protection and inclusion, and summarising these opinions into a single overall score. The overall score is based on the results of two questions. The first of these asks respondents how satisfied they are, on the whole, with the life they lead, with answers given on a four point scale from very satisfied to not at all satisfied 10. The second question asks respondents to judge the current situation in relation to fourteen different areas covering both their personal circumstances and social and economic factors within their country. Responses are invited on a four-point scale ranging from very good to very bad 11. In order to calculate the overall social climate index, each measure is allocated a score between -10 and 10, as shown below: Q1: Satisfaction with the life you lead Q2: Judgement of current situation in 14 areas Very satisfied 10 Very good 10 Fairly satisfied 3.33 Rather good 3.33 Not very satisfied Rather bad Not at all satisfied -10 Very bad -10 Don t know Not scored Don t know Not scored The overall social climate index for each respondent is then calculated as the mean of the scores for each of the 15 measures (one at Q1 and fourteen at Q2). The following table shows the social climate index for the EU as a whole, and for each of the 28 Member States for the latest wave (SP418), for each of the 27 Member States and Croatia for the previous wave (SP408), and for the 27 Member States for the first four waves: SP315 (2009), SP349 (2010), SP370 (2011) and SP391 (2012). 10 Q1 On the whole, are you very satisfied, fairly satisfied, not very satisfied or not at all satisfied with the life you lead? (READ OUT) Very satisfied, Fairly satisfied, Not very satisfied, Not at all satisfied, Don t know 11 Q2 How would you judge the current situation in each of the following? (SHOW CARD WITH SCALE ONE ANSWER PER LINE) (READ OUT) The area you live in, the healthcare system in (OUR COUNTRY), The pension system in (OUR COUNTRY), Unemployment benefits in (OUR COUNTRY), The cost of living in (OUR COUNTRY), Relations in (OUR COUNTRY) between people from different cultural or religious backgrounds or nationalities, The way inequalities and poverty are addressed in (OUR COUNTRY), How affordable energy is in (OUR COUNTRY), How affordable housing is in (OUR COUNTRY), The way public administration runs in (OUR COUNTRY), The situation of the (NATIONALITY) economy, Your personal job situation, The financial situation of your household, The employment situation in (OUR COUNTRY)? Very good, Rather good, Rather bad, Very bad, Don t know 8
12 315 (2009) OVERALL SOCIAL CLIMATE INDEX (Evaluation of the current situation) 349 (2010) 370 (2011) 391 (2012) 408 (2013) 418 (2014) EU MT DK LU NL AT SE DE FI BE UK EE CZ IE FR LT LV PL SI SK ES HU PT IT HR CY RO BG EL The overall social climate index for the EU28 is stands at -1 in 2014 which indicates that Europeans are divided in their assessments of the current situation. This represents a small decline from a score of -0.9 in 2013, and is the lowest index recorded in the series. 9
13 That said, the 2014 index is only somewhat lower than the highest index (-0.6) recorded in As in previous years the index varies considerably between countries. The highest indices are found in the Nordic and Benelux countries, along with Malta, Austria and Germany. Malta has the highest index (3.1), followed Denmark (2.9), Luxembourg and the Netherlands (both 2.2), Austria (1.8), Sweden (1.7), Germany (1.6), Finland (1.3) and Belgium (0.6). The UK and Estonia are the only other Member States with a positive index, although it is only marginally so in both: UK (0.1); and Estonia (0.1). With the exception of Estonia, these Member States have formed the top ten in the overall social climate index in each of the six years of the survey 12. Estonia has ranked in the top ten in three of the six surveys: 2010, 2011 and The overall social climate index has declined in seven of these Member States since 2013, and improved in four (Malta, Denmark, the Netherlands and Estonia). The biggest improvement can be observed in Malta (up 2.1 points) and the shift is notably greater than positive shifts in any other Member States. It is the most significant improvement for Malta in the series, with smaller positive shifts between 2009 and 2010, and 2011 and 2012 (up 0.4 points in each case), and between 2012 and 2013 (up 0.9 points). In the 2010 to 2011 period the index in Malta declined by 0.5 points. As a result of this large positive shift in 2014 Malta now holds its highest index to date, and has risen from ranking ninth in 2013 to ranking first in Estonia shows the second biggest improvement (up 0.6 points). Like Malta, it is also its most significant improvement in the series, with a somewhat smaller positive shift between 2009 and 2010 (up 0.4 points), and declines in the following periods, most notable between 2010 and 2011 (down 0.3 points). The improvement in 2014 has resulted in Estonia rising from eleventh in the rankings in 2013 to tenth in the rankings, a position it shares jointly with the UK. This is its highest ranking in the series, and a position it also held in 2010 (jointly with the UK) and in The most notable decline in these eleven Member States since 2013 is witnessed in Sweden (down 0.6 points). It is its most significant decline in the series, with smaller negative shifts between 2010 and 2011 (down 0.1 point) and 2012 and 2013 (down 0.3 points). In the periods between 2009 and 2010, and 2011 and 2012 the index in Sweden improved (up 0.5 points and 0.4 points respectively). The decline since 2013 sees Sweden drop from third in the rankings in 2013 to sixth in 2014, with its worst index (albeit marginally lower than that in 2009) and lowest ranking in the series. 12 Including countries ranked equal tenth in any survey year 10
14 In addition to Sweden, four other top ten Member States have an overall social climate index in 2014 lower than that in The greatest declines can be seen in the Netherlands which, in spite of a small improvement since 2013 (up 0.3 points), shows a drop (down 0.4 points) from 2.6 in 2009 to 2.2 in 2014; and in Belgium, with a decline (down 0.4 points) from 1 to 0.6 respectively. Luxembourg and Finland, like Sweden, show marginal declines (down 0.1 point in each case), with a drop from 2.3 to 2.2 in Luxembourg and 1.4 to 1.3 in Finland. The largest improvement in the top ten Member States since 2009 can be seen in Malta (up 3.3 points), with a notably greater positive shift than in any other Member State, followed by Germany (up 1.3 points) and Estonia (up 0.5 points). The bottom ten i.e. lowest ranked countries on this measure are southern and eastern European countries. Greece is the lowest ranked country with an index of -5.3, followed by Bulgaria (-3.6), Romania and Cyprus (both -3.4), Croatia (-3.3), Italy (-3), Portugal (-2.6), Hungary (-2.3), Spain (-2.2) and Slovakia (-2.1). The overall social climate index has declined in three of these Member States since 2013, improved in six (Spain, Hungary, Portugal, Croatia, Romania and Greece), and remains unchanged in Cyprus. Greece has been the lowest ranked Member State on this overall measure in five of the six survey years, the exception being in 2010, when it was ranked ahead of Romania. The index in Greece has improved marginally since 2013 (up 0.1 point), after a greater increase in 2013 (up 0.4 points) and declines in each of the previous survey years since 2009, with the most marked decline between 2012 and 2011 (down 1.2 points). The recent improvements in the last two survey periods are a reflection perhaps of cautious optimism now about the economy s prospects, although the 2014 index is still lower than the indices between 2009 and Among these lowest ranked countries, Portugal and Spain are the only other southern European countries experiencing particularly difficult economic circumstances 13 which show an improvement in the social climate index since In Portugal it has increased by 0.8 points, from -3.4 in 2013 to -2.6 in 2014, following declines in all but one of the survey periods (2011) since Nevertheless, in ranking terms the improvement has only seen Portugal move up from twenty-fourth position in 2013 (shared jointly with Cyprus) to twenty-second position in 2014, lower than its highest ranking of twenty-first in 2011 and similar to its ranking in In Spain the social climate index has increased by 0.5 points, from -2.7 in 2013 to -2.2 in 2014, following one of the largest declines of any Member State between 2013 and 2012 (down 0.6 points) 14 ; broadly similar declines between 2011 and 2012 (down 0.5 points) and 2010 and 2011 (down 0.7); and a marginal increase between 2009 and 2010 (up 0.1). 13 The countries included here are Spain, Portugal, Italy, Cyprus and Greece 14 The Netherlands showed the largest decline, down 0.9 points and Slovenia showed a similar level of decline to Spain down 0.6 points 11
15 In ranking terms, the recent improvement has only seen Spain move up one position, from twenty-first in 2013 to twentieth in 2014, lower than its sixteenth position in the first three waves of the series 15 and eighteenth position in None of the southern European countries in the bottom ten show an improvement in the social climate index since With the exception of Portugal, all show a deterioration of at least one point, with the greatest decline in Cyprus (down 2.7 points) from -0.7 in 2009 to -3.4 in 2014, followed by Greece (down 1.5 points) from -3.8 to -5.3; Spain, (down 1.2 points) from -1 to -2.2; and Italy (down 1.1 point) from -1.9 to -3. Portugal shows only a small decline (down 0.3 points) from -2.3 in 2009 to -2.6 in Among the eastern and central European Member States in these lowest ranked countries 16, the biggest decline since 2013 is observed in Bulgaria (down 0.3 points) from an index of -3.3 to -3.6 in 2014, following a broadly similar drop between 2012 and 2013 (down 0.4 points), after a consistent pattern of improvement since 2009, albeit marginal since Bulgaria s 2014 index is similar to its baseline index of -3.6, both being the lowest in the series. The largest improvement since 2013 can be seen in Romania (up 0.6 points) from -4 to - 3.4, following a small decline in its index between 2012 and 2013 (down 0.2 points), increases between the 2010 and 2011, and 2011 and 2012 periods (up 0.1 point and 0.6 points respectively), and a decline between the baseline survey and 2010 (down 2.1 points). In ranking terms, Romania has moved up from twenty-seventh position in 2013 to equal twenty-fifth in , lower than its baseline ranking of twenty-third, when it was at its highest position in the series. In addition to Romania, Slovakia is the only other eastern European country in this group showing a deterioration in the social climate index since 2009 (down 0.5 points) from -1.6 to Bulgaria s index, as already noted, shows no change since 2009, with Hungary the only country in the group showing an improvement since 2009, (up 1.4 points) from -3.7 to This is driven by a marked improvement in the social climate index between 2012 and 2013 (up 1.4 points), with only a marginal improvement (up 0.1 points) between 2013 and 2014, a slightly greater improvement between 2009 and 2010 (up 0.3 points), and small declines between the 2010 and 2011, and 2011 and 2012 survey periods (down 0.2 points in each). In ranking terms, Hungary has moved up from a baseline ranking of twenty-sixth to twenty-first position in 2014, lower than its twentieth ranking in 2013, the highest in the series. Among the remaining seven Member States (those not ranked in the top ten or bottom ten ) there has been an improvement in the overall social climate index since 2013 in Ireland, Lithuania, Poland and Slovenia. Most increases are small, with the most notable in Ireland, (up 0.4 points) from -1.3 in 2013 to -0.9 in Ireland and Lithuania show the most notable improvement in their social climate indices since 2009 (Lithuania up 1.1 points and Ireland up 0.9). 15 In 2010 jointly shared with Slovenia, and in 2011 jointly shared with Ireland 16 The countries included here are Slovakia, Hungary, Romania and Bulgaria 17 A position it shares with Cyprus 12

16 The next table shows how the overall social climate index varies by socio-demographic characteristics at the overall EU level, again showing the results for each of the six survey years. 13
17 As has been found in previous surveys in the series, the most notable socio-demographic differences are related to employment status and economic circumstances as measured by people s perceptions of their difficulty in paying bills. There is a strong relationship between how difficult people say they are finding it to pay their household bills and their overall social climate index. Thus those who say that they almost never find it difficult to pay their bills have a positive index in 2014 of 0.2, compared with an index of -2.2 for those who struggle some of the time, and -4.1 for those who almost always have difficulty paying household bills. Perceptions among each of the three groups remain very similar to the views held in There has been a marginal improvement in perceptions among those who struggle most of the time, up 0.1 point from -4.2, its lowest level in the series, but the index remains at its second lowest level, down 1.1 points on the index of -3 in There has been a small deterioration between 2013 and 2014 in perceptions among those who almost never struggle to pay household bills (down 0.1 point), and the index is now at its lowest level in the series, down 0.3 points on the highest score recorded in There has also been a small deterioration between 2013 and 2014 in perceptions among those who struggle to pay household bills from time to time (down 0.2 points). The index for this group is also at its lowest level in the series, down 0.6 points from the highest score of -1.6 recorded in In terms of employment status, the most marked difference is between the perceptions of the unemployed and all other occupational groups. Those who are unemployed have an overall social climate index of -3.3 in 2014, compared with the EU average of -1. There has been a small deterioration between 2013 and 2014 (down 0.2 points), and the index is now at its lowest level in the series, down 0.4 points on the baseline index of -2.9 in House persons have a somewhat lower index (-2.1) than all other groups with the exception of the unemployed. The index for house persons shows a small deterioration on the 2013 index (down 0.2 points) and is the lowest score in the series, 1.2 points below the highest index of -0.9 recorded in Managers have the highest index (0.6, down from 0.8 in 2013). They are the only occupational group with a positive score. Perceptions are broadly similar across the four age groups, although those aged and those aged 55+, both of whom have an index of -0.8 in 2014, are slightly more positive than year olds (-1) and year olds (-1.2). This reflects the findings in earlier surveys where younger people have been the most positive group and those aged 55+ have tended to be slightly more positive than the middle age groups. Among year olds, perceptions are more negative than in 2013, with the social climate index declining from -0.4 to This follows an increase between 2012 and 2013, but otherwise reflects a generally downward trend among young people from the benchmark index of -0.1 in The current index of -0.8 is at its lowest level in the series. There has been a smaller decline in the index for year olds, from -1 in 2013 to -1.2 in Again, the index for this group is now at its lowest level in the series, down 0.4 points from the index of -0.8 in recorded in each of the first three surveys. 14
18 The index of -1 for year olds is unchanged since 2013 and remains at a similar level to the 2009 baseline (-0.9). The slight increase in the index among those aged 55+, from -0.9 in 2013 to -0.8 in 2014, brings it into line with the index for those aged However, the index is still somewhat lower than in 2009 (-0.5). In terms of gender, men (-0.7) have a higher index than women (-1.3), a consistent pattern since The index for men has improved slightly since 2013 (up 0.1 point), although it remains at a somewhat lower level than the highest index of -0.5 recorded in each of the first three surveys. The index for women has declined since 2013 (down 0.3 points) and is now at its lowest level in the series, down 0.5 points on the highest index (also recorded in the first three surveys). In terms of age of leaving full-time education, those still studying have the highest index (-0.1), closely followed by those who left education at the age of 20 or older (-0.2); those who left aged 15 or younger have the lowest index (-2). The index has declined since 2013 among those leaving education aged (down 0.3 points) and, albeit marginally, among those leaving at the age of 20 or older (down 0.1 point). It has also declined among those who are still studying (down 0.3 points), but has improved among those leaving aged 15 or under (up 0.3 points). These shifts in the indices mean that the only groups with a 2014 index that is not its lowest in the series are students and people who left education aged 15 or under. 15
19 II. CURRENT SITUATION Having explored Europeans overall perceptions of the social climate, this chapter of the report looks at the different measures that feed into their overall perception. These are examined in three sections; the first examines four factors related to people s personal situation, the second six (primarily economic) factors related to the national situation in their country and the third five factors related to social protection and social inclusion. 1. PERSONAL SITUATION This section focuses on people s current perceptions of their personal situation in four areas: their life in general; the area in which they live; their personal job situation; and the financial situation of their household. The results are reported as indices following the method outlined in Chapter I. Each of the four aspects of people s personal situation is examined in turn for the EU as a whole, and for each of the 28 Member States for the latest wave, for the EU27 as a whole and for each of the Member States and Croatia for the previous wave, and for the EU27 overall and the 27 Member States across the first four waves. 16
20 The table below summarises people s satisfaction with their life in general. 315 (2009) Your life in general (Evaluation of the current situation) 349 (2010) 370 (2011) 391 (2012) 408 (2013) 418 (2014) EU DK NL SE MT LU FI UK IE AT DE BE SI CY CZ FR PL ES EE SK LT HR LV HU IT RO PT BG EL
21 Europeans overall evaluation of their life in general is positive, although not overwhelmingly so. This has been the pattern in each of the six survey waves. The index of 2.5 in 2014 has decreased by 0.4 points from It is the lowest in the series, and shows a decline of 1 point from the high of 3.5 in The score of 2.5 is, however, the second highest EU level index across the 15 survey measures. As in previous years the index varies considerably between countries. The highest indices are found in the Nordic countries and Benelux states (with the exception of Belgium 18 ), along with Malta, the UK, Ireland, Austria and Germany. Denmark continues to have the highest index (7.9), as it has done for the five previous years, followed by the Netherlands (6.2), Sweden (6), Malta (5.3), and Luxembourg and Finland (both 5). There are only five Member States where the net perception is negative, with Greece recording the lowest index (-2.7), followed by Bulgaria (-2.1), Portugal (-1), Romania (-0.3) and Italy (-0.2). Comparing the results at a national level with those from 2013, nine Member States 19 show a year-on-year improvement in terms of people s satisfaction with their life as a whole, the index remains unchanged in Denmark, the Netherlands and Cyprus, and the remaining sixteen Member States show a decline. The largest increase is noted in Hungary (up 1.1 point), followed by Malta (up 1), Austria and Ireland (both up 0.8) and Romania and Portugal (both up 0.7 points). In ranking terms, Malta shows the greatest improvement of any Member State rising from ninth position in 2013 to fourth position in Hungary and Malta have seen the largest increases of all EU Member States over the whole survey period, both up 1.4 points from 3.9 in 2009 to 5.3 in 2014 in Malta, and from -0.8 to 0.6 respectively in Hungary. The largest declines since 2013 can be seen in Italy (down 1 point), France (down 0.9), Germany (down 0.8), Luxembourg (down 0.7) and Belgium (down 0.6). Across the period, the largest overall declines can be observed in Cyprus and Greece (both down 2.1 points from 4.6 to 2.5 in Cyprus and from -0.6 to -2.7 in Greece), followed by Italy (from 1.6 to -0.2), Portugal (from 0.5 to -1), France (from 3.4 to 2.2) and Belgium (from 4.9 to 3.8). 18 Belgium sits just outside the top ten countries (ranked eleventh) with an index of Malta, Austria, Ireland, Estonia, Slovakia, Hungary, Romania, Portugal and Bulgaria 18
22 The graph below illustrates long term trends in the overall EU index score for satisfaction with life in general. Whilst the results in 2013 suggested possible signs of recovery with a small uplift after the slump in 2012, which saw the index drop from its highest level (3.5) in June to its second lowest level in the series (2.7) 21, this has not continued in The index now stands at 2.5, down 0.4 points on 2013, and at its lowest level in the series, also recorded in January-February 2009 in the depths of the economic crisis. 20 Also recorded in Autumn 2001 and Autumn Also recorded in Autumn 2008 and Spring
23 The next table below shows how people rate the area in which they live. 315 (2009) The area you live in (Evaluation of the current situation) 349 (2010) 370 (2011) 391 (2012) 408 (2013) 418 (2014) EU SE AT LU NL IE MT FI DE DK BE UK FR LT EE ES CZ SI CY PL LV PT SK RO HU HR EL IT BG
24 Europeans overall evaluation of the area in which they live is positive, more so than their satisfaction with life in general, and is the highest EU level index across all of the 15 survey measures. The index of 4.3 has increased by 0.4 points since It is marginally higher than the indices in and just below (by 0.1 point) the high of 4.4 in The highest indices are again found in the Nordic countries and, on this measure, all the Benelux states, along with Austria, Ireland, Malta, Germany and the UK. Respondents in Sweden, as in each of the five earlier waves, have the most positive perceptions of the area they live in, with an index in 2014 of 7.4, followed by Austria (6.7), Luxembourg (6.6), the Netherlands (6.5), Ireland (6.3), Malta (6.2), Finland (5.7), Germany and Denmark (both 5.3), Belgium (5.2) and the UK (5.1). No country has a net negative perception of the area in which people live. Respondents in Bulgaria are the most divided with an index of 0.9. After Bulgaria, the countries that have the least positive perceptions are Italy (2), Greece (2.4), Croatia (2.5), and Hungary and Romania (both 2.9). Comparing the results at a national level with those from previous waves, twenty-three Member States show a year-on-year improvement between 2013 and 2014 in terms of people s perception of the area in which they live; the UK shows no change; and the remaining four 22 show a decline. The biggest improvements are noted in Malta, up 1.9 points, after a smaller increase of 0.6 points in 2013, to a six-year high index of 6.2; in Greece, up 1.8 points, after a smaller increase of 0.6 points in 2013, to a six-year high of 2.4; Austria, up 1.6 points, after a small decline of 0.1 points in 2013, to a six-year high of 6.7; Spain, also up 1.6 points, following a decline of 0.5 points in 2013, to an index of 4.3, again its highest in the series; and Portugal, up 1 point, after a small increase of 0.2 points in 2013, also now holding its highest index in the series standing at 3.6. Austria and Malta show the greatest improvements of all 28 Member States in the 2014 rankings relative to those in 2013, both rising seven places, Austria from ninth to second position and Malta from thirteenth to sixth. Malta and Austria have also seen the largest increases of all EU Member States since 2009 (both up 1.9 points), followed by Lithuania (up 1.1 point), and Latvia and Hungary (both up 1 point). The largest decline since 2013 in people s perceptions of the area they live in is seen in Bulgaria (down 0.7 points), followed by Germany (down 0.4). Across the period, the largest overall declines are observed in Cyprus (from 5 to 3.8) followed by Belgium (from 6.1 to 5.2). 22 Sweden, Germany, Belgium and Bulgaria 21
25 The next table summarises Europeans perceptions of their personal job situation. 315 (2009) Your personal job situation (Evaluation of the current situation) 349 (2010) 370 (2011) 391 (2012) 408 (2013) 418 (2014) EU DK SE FI LU MT AT DE NL UK BE FR EE CZ LV SK IE SI PL LT ES IT PT CY BG HR HU RO EL
26 At the EU level, the overall index of 1.2 for people s personal job situation in 2014 is positive, and remains unchanged from However, both indices are the second lowest in the series, ahead of only the 2012 index of 0.9, and there is a decline of 0.5 points from the high of 1.7 in That said, the EU level index for personal job situation is the third highest among the 15 survey measures. The highest indices are found in the Nordic and Benelux countries, along with Malta, Austria, Germany, and the UK broadly reflecting the pattern seen to date in this section. However, Ireland ranks sixteenth out of the twenty-eight countries on personal job situation, compared with rankings of fifth on local area and equal eighth (along with Austria) on life in general. Respondents in Denmark have the most positive perception of their job situation, with an index of 5.8, followed by Sweden (5.6), Finland (5.3), Luxembourg (4.3), Malta (3.9), Austria (3.8), Germany (3.2), the Netherlands (3), the UK (2.8) and Belgium (2.6). The most negative perceptions of the respondent s personal job situation are seen in southern and eastern European Member States. Greece (-3.6) has the lowest index, followed by Romania (-2.7), Hungary (-2.2), Croatia (-1.5), Bulgaria (-1.3), Cyprus (-1.2), Portugal and Italy (both -1.1) and Spain (-0.4). Comparing the results at a national level with those from previous waves, thirteen Member States 23 show a year-on-year decline between 2013 and 2014 in terms of people s evaluation of their personal job situation; Austria, Latvia and Slovenia show no change; and the remaining twelve show an improvement. The biggest improvements between 2013 and 2014 can be observed in Ireland and Spain (both up 1.4 points) to indices of 0.8 in Ireland (its highest index in the series) and -0.4 in Spain. They are followed by Malta (up 1.1 point), Cyprus (up 0.9), Croatia (up 0.7) and Finland (up 0.6 points). Malta shows the largest improvement in index between 2009 and 2014 (up by 2.1 points), followed by Lithuania (up 1.5), Latvia (up 1.3) and Sweden (up 0.9 points). Malta is now ranked fifth on this measure, up from ninth in 2013 and fourteenth in The largest declines since 2013 in people s perceptions of their job situation can be seen in Estonia (down 1 point), Belgium and the Czech Republic (both down 0.7) and Romania and Luxembourg (both down 0.6 points). Across the period, the largest overall declines in people s evaluation of their personal job situation are seen in Cyprus (down 3.1 points), Greece (down 2.6), Romania (down 2.2), the Netherlands and Portugal (both down 1.3), and Italy (down 0.8 points). In spite of its inclusion in this group, the Netherlands still has the eighth highest index of all 28 countries on this measure. Cyprus shows the greatest drop in ranking, from equal eleventh in 2009 to twenty-third in Sweden, Luxembourg, Germany, the Netherlands, Belgium, France, Estonia, the Czech Republic, Lithuania, Italy, Portugal, Hungary and Romania 23
27 The last of the four measures relating to Europeans personal situation concerns people s perceptions of the current financial situation of their household. 315 (2009) The financial situation of your household (Evaluation of the current situation) 349 (2010) 370 (2011) 391 (2012) 408 (2013) 418 (2014) EU DK SE NL LU FI MT AT DE UK BE EE FR SI IE CZ LT PL LV SK ES IT HR CY HU RO PT BG EL
28 With an EU level index of 0.8, Europeans overall assessment of their household s current financial situation broadly reflects their view of their personal job situation (1.2), and is the fifth highest index among the 15 survey measures. The index has declined by 0.1 point since 2013 and has returned to its lowest level in the series, last recorded in The 2014 index is 0.7 points behind the high observed in The similarity between people s evaluation of their household finances and personal job situation are largely reflected at the individual country level, with the highest indices again found in the Nordic countries and Benelux states, Malta, Austria, Germany and the UK. Respondents in Denmark have the most positive perception of their household s current financial situation, with an index of 5.2, followed by Sweden (4.5), the Netherlands (3.8), Luxembourg (3.7), Finland (3.5), Malta (3.3), Austria (2.8), Germany and the UK (both 2.3) and Belgium (1.9). Nine of these ten Member States have been ranked in the top ten on this measure in each of the six survey years, the exception being Malta, which has risen from fifteenth position in 2009 to sixth in 2014, replacing France, which has dropped to twelfth position. The most negative perceptions of household finances are again seen in southern and eastern European countries. Greece (-3.9) has the lowest index in 2014, followed by Bulgaria (-2.2), Portugal (-1.8), Romania (-1.7), Hungary (-1.5), Cyprus (-1.4) and Croatia (-1.3). Fourteen Member States 24 show a year-on-year improvement between 2013 and 2014 in terms of people s evaluation of their household s financial situation. In most cases the movements tend to be small, with the most notable improvements in Malta (up 1.4 points), Ireland and Cyprus (both up 0.8 points) and Slovenia, Spain and Bulgaria (all up 0.5 points). Malta has seen the largest improvement of any Member State on this measure since 2009, from a baseline of 0.6 in 2009 to 3.3 in 2014 (up 2.7 points). Other notable improvements since 2009 can be observed in Hungary, from -3.2 to -1.5 (up 1.7 points); in Austria, from 1.8 to 2.8 (up 1 point); and in Lithuania, from -0.7 to 0.3 (also up 1 point). The index for the household financial situation has remained the same since 2013 in four Member States: the Netherlands, Lithuania, Latvia and Greece. In the remaining ten countries declines in the index tend to be small, with Belgium showing the greatest drop (down 0.9 points), followed by Sweden (down 0.8). In spite of their inclusion in this group, both countries remain in the top ten Member States with the highest indices on this measure, Sweden dropping in ranking from first in 2013 to second in 2014, and Belgium dropping from sixth to tenth position respectively. 24 Denmark, Finland, Malta, Austria, Estonia, Slovenia, Ireland, Slovakia, Spain, Croatia, Cyprus, Hungary, Romania and Bulgaria 25
29 Across the period, the largest overall declines in people s evaluation of their household s financial situation can be seen in Greece (down 3.1 points), Cyprus (down 1.9), Italy and Portugal (both down 1.4) and Belgium (down 0.9). Cyprus, along with Spain, show the largest drop of all 28 Member States in their rankings now compared with those held in 2009: Spain dropping from equal thirteenth 25 in 2009 to twentieth in 2014; and Cyprus dropping from seventeenth to twenty-third position respectively. This section concludes by providing an overview of the most notable socio-demographic differences on the four measures relating to people s personal situation. As was the case in relation to the overall social climate index, the key factors that differentiate how people feel about their personal situation are their perception of how difficult it is to pay their household bills, their occupational status and, to a somewhat lesser extent, the age at which they left education. As seen in relation to the overall social climate index, there is a strong relationship between how difficult people are finding it to pay their household bills and their perceptions of their personal situation. Those who struggle to pay their bills most of the time have much lower indices than those who almost never struggle to do so on all four measures, with particularly large differences between these two groups in relation to both their household financial and personal job situations. 418 (2014) Your life in general The area you live in Your personal job situation The financial situation of your household EU Difficulties paying bills Most of the time From time to time Almost never Since 2013, there have been some improvements in perceptions, most notably among those who have difficulty paying bills most of the time in relation to the area they live in (up 1.1 point), with smaller improvements among those who struggle with bills from time to time (up 0.3 points) and those who almost never struggle with bills (up 0.4 points). Across the three remaining measures there are no notable improvements in perceptions. The most notable worsening of opinion is among those who struggle to pay their bills from time to time in relation to life in general (down 0.8 points), with a less marked deterioration among those who struggle most of the time (down 0.5 points). Change in index 2014 vs Your life in general The area you live in Your personal job situation The financial situation of your household Difficulties paying bills Most of the time = From time to time Almost never Along with Ireland 26
30 Comparing the 2014 results with those from 2009 shows a deterioration in the perceptions of those who routinely struggle to pay their household bills on all but one measure (local area), with the most notable worsening of opinions in relation to life in general (down 1.8 points), and with perceptions of the local area showing only a small improvement (up 0.2 points). It also shows that those who almost never struggle to pay bills are starting to find things more difficult, with small deteriorations across three indicators and only a small improvement in the fourth - local area (up 0.2 points) - among this group as well. Change in index 2014 vs Your life in general The area you live in Your personal job situation The financial situation of your household Difficulties paying bills Most of the time From time to time -1.1 = Almost never In terms of the respondent s occupational status, the largest differences in the 2014 indices are between the unemployed, who score lowest on all four measures, and managers, who score highest on each measure (with the exception of life in general where students have a slightly higher index of 4.6). Not surprisingly, the difference in perceptions between the two groups is particularly marked in relation to personal job situation and the household financial situation: 418 (2014) Your life in general The area you live in Your personal job situation The financial situation of your household EU Respondent occupation scale Managers Unemployed Since 2013 there has been a worsening in managers perceptions of life in general (down 0.5 points), marginal positive shifts in their opinions on the local area and household financial situation (both up 0.1 point) and no change in perceptions of their job situation. Compared with 2009, managers are slightly more positive about the area in which they live (up 0.2 points) but somewhat more pessimistic about other aspects of their personal situation, most notably their general life (down 0.4 points). The unemployed also show an improvement since 2013 in their opinions about the local area (up 0.3 points). They are marginally more negative about their job situation (down 0.1 point), somewhat more negative about household finances (down 0.3 points) and notably more pessimistic about their life in general (down 1.3 points). Compared with 2009, the unemployed, like managers, hold more positive opinions on their local area (up 0.3 points) and less positive views on each of the other measures. The largest negative shift in opinion since 2009 is on life in general (down 1.4 points) and it is more marked than that seen for managers in relation to this measure. 27
31 In terms of age of leaving education, those who left-time education at 15 or younger, or aged 16-19, are less satisfied with their personal situation than those who continued their education to age 20 or older and students: 418 (2014) Your life in general The area you live in Your personal job situation The financial situation of your household EU Education (End of) Still studying
32 2. COUNTRY Having explored Europeans perceptions of their personal situation, this next section of the chapter looks at their views on the national picture, with a particular focus on economic indicators. Respondents were asked to judge the current situation in relation to six aspects of life in their own country: the cost of living; the affordability of energy; the affordability of housing; the way public administration runs; the economic situation; and the employment situation. As before, the results are reported as indices. Each of the six aspects is examined in turn for the EU as a whole, and for each country, for the latest wave and for the last five waves. 29
33 The table below summarises people s satisfaction with the cost of living in their country. The cost of living in (OUR COUNTRY) (Evaluation of the current situation) 315 (2009) 349 (2010) 370 (2011) 391 (2012) 408 (2013) 418 (2014) EU SE NL DK DE AT MT LU BE UK FI FR ES IE CZ SK LT EE PL HU IT PT SI LV CY RO EL BG HR
34 Europeans net evaluation of the cost of living in their country is somewhat negative, with an index of -2.9 at the EU level. This is the fourth lowest overall index across the 15 survey measures. The 2014 index represents a small improvement on the overall score of -3.1 recorded in 2013, but remains slightly below the highest point in the whole series of -2.7 in There is national variation, with the highest indices again found in the Nordic and Benelux countries, Germany, Austria, Malta and the UK. Having said this, only four countries have a positive index on this measure, and only two Sweden (1.6) and the Netherlands (1.5) have an index of one or higher. Four countries have an index of -6 or lower, with Croatia having the lowest score (-7.1), followed by Bulgaria (-6.6), Greece (-6.5) and Romania (-6.1). Comparing the results at a national level with those from 2013, seventeen Member States 26 show an improvement in terms of people s satisfaction with the cost of living; Slovenia shows no change; and the remainder show a year-on-year decline. The largest improvements are observed in Malta (up 2.6 points), Estonia (up 1.6), Portugal (up 1.3), Spain (up 1.2) and Ireland (up 1.1), followed by Slovakia and Cyprus (both up 0.8 points). Malta also shows the largest improvement of any Member State on this measure since the first wave, from a baseline of -5.6 in 2009 to -1.2 in 2014 (up 4.4 points), followed by Ireland, from -5.6 to -3.8 respectively (up 1.8). The only other Member State showing an improvement in 2014 of at least one point on the baseline index is Hungary - from -6.1 to -4.7 respectively (up 1.4). Where indices on the cost of living have declined since 2013, these declines tend to be relatively small, with the highest in Austria (down 1.1 point), followed by Luxembourg (down 0.9) and Sweden, Belgium and Bulgaria (each down 0.8 points). Across the period, the largest deteriorations on this measure can be seen in Luxembourg (down 2.1 points), Cyprus (down 1.4) and Austria, Finland and Estonia (each down 1.2 points). There have been some notable changes in the relative positions of countries on this measure since 2009: Malta has risen sixteen places from twenty-second equal position in 2009 to sixth in 2014, whilst Ireland (also twenty-second equal in 2009) has risen nine places to thirteenth. In contrast, Slovenia has dropped eight places from fourteenth in 2009 to twenty-second in 2014 and Cyprus, seven places from seventeenth equal positon to twenty-fourth. 26 The Netherlands, Malta, the UK, France, Spain, Ireland, the Czech Republic, Slovakia, Lithuania, Estonia, Poland, Hungary, Portugal, Italy, Cyprus, Romania and Greece 31
35 The next table summarises Europeans perceptions of how affordable energy is in their country. How affordable energy is in (OUR COUNTRY) (Evaluation of the current situation) 315 (2009) 349 (2010) 370 (2011) 391 (2012) 408 (2013) 418 (2014) EU CZ EE LV NL SE AT DK MT LU BG SI FI PL HU SK ES DE FR BE HR IT LT IE UK PT RO EL CY
36 People s perceptions of how affordable energy currently is in their country are slightly better than their views of the overall cost of living, with an index of -2.5 at the EU level, the sixth lowest EU level index among the 15 survey measures. The index remains unchanged on 2013, and is somewhat lower than the baseline index (-2.2) and the highest index in the series recorded in 2010 (-2). There is again a large amount of variation between individual countries, although this variation follows a somewhat different pattern from those seen earlier in the report. This is not unexpected, since energy prices in individual countries will reflect a range of different supply and demand conditions in each country that are not necessarily related to a country s overall economic situation 27. The most positive perceptions of the affordability of energy can be observed in the Czech Republic (4.2), Estonia (3.6) and Latvia (1.9). These Member States have occupied the first three positions on this measure in each of the six survey years. Six other countries have positive indices on this measure in 2014: the Netherlands (1.3), Sweden (0.9), Austria (0.7), Denmark and Malta (both 0.5) and Luxembourg (0.2). It is worth noting in this context that the cost to consumers of gas and electricity in Sweden, Denmark and Austria is high relative to other EU countries 28. There is more similarity with earlier findings in terms of the countries with the most negative perceptions of the affordability of energy. Five countries have an index of -4 or lower on this measure: Cyprus (-6.9), Greece (-6.6), Romania (-5.7) and Portugal (-5.3), joined in this instance by the UK (-4.1). Most Member States show an improvement in terms of people s judgements of the affordability of energy relative to the position in 2013, opinion in Estonia remains unchanged, and six countries 29 show a year-on-year decline. The largest improvements since 2013 are observed in Malta (up 4.1 points), Hungary (up 2 points), Poland and Slovakia (both up 1.1 point), and Austria, Bulgaria and Lithuania (each up 0.9 points). The large positive shifts in Malta and Hungary have resulted in notable improvements in their rankings: Malta rising from nineteenth position in 2013 to equal seventh in 2014; and Hungary rising from equal twentieth to equal twelfth. The largest improvements between 2009 and 2014 on this measure are seen in Bulgaria, Hungary and Malta. The largest increase (5.8 points) can be observed in Bulgaria, although this is largely accounted for by a huge shift in perceptions between 2009 and 2010, when the index moved from -5.9 to , with slight declines in the following years before the increase noted above in In Malta the net increase is 5.4 points, from -4.9 in 2009 to 0.5 in 2014; with the index in Hungary increasing by 4.1 points over the same period, from -5.9 to including the geopolitical situation, import diversification, network costs, environmental protection costs, severe weather conditions and levels of excise and taxation _%28EUR_per_kWh%29_YB14.png 29 Latvia, Denmark, Spain, Germany, Belgium and the UK 30 This may reflect the economic recovery in Bulgaria in 2010, following a rapid economic decline in
37 The shifts in Malta, Bulgaria and Hungary have resulted in big improvements in their rankings, with Malta rising from twenty-fourth position in 2009 to equal seventh in 2014, and Bulgaria and Hungary from twenty-sixth equal in 2009 to tenth and equal twelfth respectively in The largest declines in people s judgements of the affordability of energy relative to the position in 2013 can be observed in Spain (down 2.1 points) from -0.2 to -2.3, and Latvia and the UK (each down 0.8 points) from 2.7 to 1.9 and from -3.3 to -4.1 respectively. The shifts in Spain and the UK have affected their rankings, with Spain dropping from equal eighth position in 2013 to sixteenth in 2014, and the UK dropping from eighteenth to twenty-fourth position. The Member States with the largest deterioration in perceptions of the affordability of energy since 2009 are Spain (down 4 points), followed by Cyprus (down 2.5), Romania (down 1.7), Greece (down 1.6), and Latvia (down 1.3). The shift in Spain has seen it drop twelve places in the rankings, from fourth position in 2009 to sixteenth now. 34
38 The next table below shows respondents perceptions of the affordability of housing in their country. How affordable housing is in (OUR COUNTRY) (Evaluation of the current situation) 315 (2009) 349 (2010) 370 (2011) 391 (2012) 408 (2013) 418 (2014) EU DK EE CZ LV NL SE AT DE BG HU IE FI MT BE HR FR SK IT UK PL PT EL SI ES LT RO LU CY
39 Europeans evaluation of the affordability of housing in their country is somewhat negative, with an index of -3.3 at the EU level. This index has declined since 2013 (down 0.4 points from an index of -2.9), and has returned to its lowest level in the series, also recorded in 2011 and It is the second lowest EU level index among the 15 survey measures. The index varies nationally. As was the case in relation to perceptions of energy costs, there is a less discernible pattern than on previous measures in terms of the countries with the highest and lowest indices on this measure. Only three Member States have a positive index on this measure, with the highest in Denmark (1), followed by Estonia (0.7) and the Czech Republic (0.5). The remainder have a negative index, with two having an index of -5 or lower: Cyprus (-6.5) and Luxembourg (-5.1). A further nine countries have an index of at least -4: Spain, Lithuania and Romania (-4.8 in each), Slovenia (-4.7), Greece (-4.6), Portugal (-4.5), the UK and Poland (both -4.3) and Italy (-4.1). Thirteen of the 28 Member States 31 have seen an improvement since 2013 in perceptions of the affordability of housing, opinion in the Netherlands remains the same, and the remaining countries show a year-on-year decline. The largest improvements since 2013 can be observed in Malta (up 1.1 point), Hungary (up 1) and the Czech Republic, Slovakia and Romania (each up 0.6 points). Between 2009 and 2014 the index on this measure has improved by one point or more in six Member States. The greatest improvement is observed in Bulgaria, with a net increase of 4.7 points, from an index of -6.4 in 2009 to -1.7 in As was the case in relation to the affordability of energy, this relates to a shift in perceptions between 2009 and 2010, when the index moved from -6.4 to The other Member States showing the most marked improvements are: Hungary (up 2.5 points), Malta (up 2), the Czech Republic (up 1.8), Ireland (up 1.5) and Cyprus (up 1 point). Bulgaria and Hungary have risen notably in the country rankings on this measure since 2009, Bulgaria from twentysixth position to equal eighth and Hungary from twenty-second position to tenth. Only five Member States show a decline in satisfaction with housing costs since 2014 of one point or more, with the largest in Germany and Belgium (both down 1.4 points), followed by the UK (down 1.3), and Sweden and Ireland (both down 1.1 point). The largest shifts towards more negative perceptions between 2009 and 2014 are again in Germany (down 2.4 points) and Sweden (down 1.7 points), along with Austria (down 1 point), although all of these countries remain in the top ten in terms of ranking. The most notable drops in ranking on this measure can be observed in Slovenia (from twelfth equal in 2009 to twenty-third in 2014) and Luxembourg (from fifteenth equal to twentyseventh). 31 The Czech Republic, Hungary, Malta, Croatia, Slovakia, Poland, Portugal, Greece, Slovenia, Spain, Lithuania, Romania and Cyprus 36
40 The fourth measure in this section concerns people s views of the way that public administration runs in their country. The way public administration runs in (OUR COUNTRY) (Evaluation of the current situation) 315 (2009) 349 (2010) 370 (2011) 391 (2012) 408 (2013) 418 (2014) EU DE DK MT LU EE FI SE NL AT BE UK CZ LT FR HU SK PL IE LV BG PT ES SI CY RO IT HR EL
41 Europeans overall judgement of the way that public administration runs in their country is slightly negative, but less so than for the five other measures covered in this section, with an index of -1.7 at the EU level. There has been a slight but consistent deterioration in perceptions on this measure over the series, with the index falling by 0.1 each year from a high of -1.2 in As with other measures, there are large differences nationally in perceptions. The pattern tends to follow that seen for most of the measures, with the highest indices found in the Nordic and Benelux countries, Germany, Malta and Austria, with Estonia also having relatively positive views on public administration. Germany, Denmark and Malta have the highest indices (2 in each), followed by Luxembourg (1.9), Estonia (1.7), Finland (1.4), Sweden (1.2), the Netherlands (0.5), Austria (0.2) and Belgium (-0.3). The UK has the next highest index (-1.3) and has lost a position in the top ten which it held for the previous four surveys. Similarly, the most negative perceptions are again found in southern and eastern European countries, reflecting the pattern seen on most measures. Nine countries have an index of -3 or worse on this measure. Greece has the lowest index (-6.3), followed by Croatia (-5.6), Italy (-4.8), Romania (-4), Cyprus and Slovenia (both -3.6), Spain (-3.4), and Portugal and Bulgaria (both -3.3). Twelve Member States 32 show an improvement since 2013 in terms of people s satisfaction with the way that public administration runs in their country, Poland and Latvia show no change, and the remainder show a year-on-year decline. The largest improvement on this measure between 2013 and 2014 is seen in the Netherlands (up 1.7 points), followed by Spain (up 1.1), Malta (up 0.9) and Estonia (up 0.8), whilst the largest improvements between 2009 and 2013 can be noted in Malta (up 3 points), Latvia (up 2.1) and Ireland (up 1.2). Malta s equal first ranking in 2014 compares with rankings of eighth in 2013 and eleventh in Perceptions of the way that public administration runs have worsened since 2013 in fourteen Member States, with the largest declines in Belgium and Austria (both down 1.5 points), Bulgaria (down 1.2), Hungary (down 1) and Romania and Slovakia (both down 0.8 points). Over the six survey years the largest decline can be observed in Slovenia, down 3.9 points from 0.3 in 2009 to -3.6 in 2014, with its ranking declining from ninth to twentythird equal over this period. The indices in Cyprus and Spain have also dropped by two points or more between 2009 and 2014 (both down 2.2 points). 32 Denmark, Malta, Estonia, Finland, the Netherlands, the UK, Lithuania, Portugal, Spain, Cyprus, Slovenia and Greece 38
42 The next table shows Europeans judgement of the economic situation in their country in 2014, and in the five previous survey years. The economic situation in (OUR COUNTRY) (Evaluation of the current situation) 315 (2009) 349 (2010) 370 (2011) 391 (2012) 408 (2013) 418 (2014) EU DE DK MT SE LU AT NL EE BE UK FI LT PL HU CZ LV IE SK FR RO PT IT SI ES BG CY HR EL
43 Europeans perceptions of the current economic situation in their country are somewhat negative overall, but less so than their views on the cost of living. The index of -2.6 at the EU level makes it the fifth lowest rated aspect of life among the 15 measured in the survey. Having said this, perceptions have improved since 2013 (up 0.9 points), and show the greatest improvement of any of the 15 measures since The index of -2.6 is the highest recorded in the series and up 1.5 points from the baseline index of -4.1, and again shows the greatest improvement of all 15 measures between 2009 and The index varies between countries, with the difference between the most positive and most negative ratings (11.5 points) the third highest of the 15 survey measures 33. The highest indices are again found in the Nordic and Benelux countries (with the exception on this measure of Finland), Germany, Malta, Austria, Estonia and the UK. Finland sits just outside the top ten countries, ranked eleventh. Seven countries have a positive index on this measure, with the highest index being found in Germany (3.6), followed by Denmark and Malta (both 2.7), Sweden (2.6), Luxembourg (2.2), Austria (0.6) and the Netherlands (0.1). Nine countries have an index of -5 or lower, with Greece having the most negative perception of their country s current economic situation (-7.9), followed by Croatia (-7.6), Cyprus (-7.4), Bulgaria (-6.8), Spain and Slovenia (both -6.7), Italy (-6), and Portugal and Romania (both -5.4). Comparing the results at a national level with those from 2013, twenty-three Member States show a year-on-year improvement in terms of people s satisfaction with the current economic situation in their country. The largest improvement can be seen in the UK (up 2.7 points), followed by Ireland (up 2.6 points) and Malta (up 2.5 points). A further ten countries have seen their index increase by more than one point between 2013 and 2014: Portugal, the Netherlands, the Czech Republic, Cyprus, Lithuania, Denmark, Estonia, Romania, Hungary and Spain, with the most notable shifts in Portugal (up 1.8 points), the Netherlands and the Czech Republic (up 1.6) and Cyprus (up 1.5). There are some notable improvements in perceptions of the national economic situation at country level across the six years of the survey, with net increases of at least four points recorded in six Member States: Germany has seen a particularly strong improvement in perceptions, with large year-on-year increases in 2010 and 2011 followed by a slight improvement in 2012, a slight worsening in 2013 and a small improvement in The overall net improvement between 2009 and 2014 is 6.8 points. This improvement has seen Germany rise in the ranking on this measure from tenth of the 27 Member States in 2009 to first in 2013 and again in Malta has also seen a large increase between 2009 and 2014 of 6.5 points, with particularly notable improvements between 2012 and This improvement has seen Malta rise in the ranking on this measure from thirteenth position in 2009 to equal second in
44 Like Germany, Latvia has seen a year-on-year improvement, from a low of -8.3 in 2009 (when it was ranked lowest of the 27 Member States) to a high of -3.7 in 2014 (and a ranking of sixteenth), a net gain of 4.6 points. The UK also shows improvement across the series, notably stronger between 2013 and The overall result is a 4.5 point net gain, from an index of -5.5 in 2009 to -1 in 2014, and a rise from twenty-first position to tenth. Estonia has also seen a positive trend each year up until 2012, with a small decline in 2013 (down 0.5 points) followed by a positive shift in The overall result is a 4.2 point net gain, from an index of -4.7 in 2009 to -0.5 in 2014, seeing it move from sixteenth position to eighth. Hungary has seen an increase between 2009 and 2014 of 4 points, improving from -7.3 in 2009 to -3.3 in 2014, with a rise in the ranking on this measure from twenty-sixth to fourteenth position. Only five Member States show a decline in perceptions of the current economic situation between 2013 and 2014, with the largest in Finland (down 2.1 points), followed by Sweden (down 0.7), Croatia and Austria (both down by 0.6 points) and Luxembourg (down 0.5). The declines in Finland, Sweden and Austria are surprising in the context of the other results reported to date. In Finland it reflects the actual economic situation with the country in recession and negative growth in the third and fourth quarters last year and the first quarter in It sees Finland drop in ranking from seventh position in 2013 to eleventh in 2014, moving outside the top ten most positive Member States for the first time in the series. By far the largest deterioration in satisfaction with the current national economic situation between 2009 and 2014 is to be seen in Cyprus where there has been a yearon-year decline in the index up until 2014 (when it increased 1.5 points on 2013). This has resulted in a net drop of 7.8 points, from an index of 0.4 in 2009 to -7.4 in Cyprus, whose banks have a large exposure to Greek debt, has plummeted dramatically in the rankings on this measure from third of 27 Member States in 2009 to become the lowest ranked of any Member State in 2013, before improving slightly to twenty-sixth in Only two other Member States have seen their index drop by more than two points between 2009 and 2014: Slovenia dropping 3.9 points from an index of -2.8 in 2009 to -6.7 in 2014 (with a fall in its ranking from ninth to twenty-third equal); and Finland down 2.1 points from an index of -0.2 in 2009 to -2.3 in 2014 (with a fall in its ranking from fifth to eleventh equal). A further five countries have seen their index drop by at least one point: Greece (down 1.7); Spain (down 1.4); Italy (down 1.2); Bulgaria (down 1.1); and Poland (down 1). 33 The highest difference is in relation to the pension system, followed by the healthcare system 41
45 The last measure examined in this section concerns people s level of satisfaction with the employment situation in their country. The employment situation in (OUR COUNTRY) (Evaluation of the current situation) 315 (2009) 349 (2010) 370 (2011) 391 (2012) 408 (2013) 418 (2014) EU DE MT DK LU AT SE UK EE LT BE NL FI LV PL HU CZ IE PT FR SK IT RO CY BG SI ES EL HR
46 Europeans assess the employment situation in their country more negatively than they do any of the other dimensions they are asked about in the survey, with an index of -4.1 at the EU level. The 2014 index shows a very small increase on the overall score of -4.2 in 2013 (up 0.1 point), and remains only slightly higher than the lowest score of -4.4 recorded in National variation in the index broadly reflects the pattern seen on most measures, with the highest indices found in the Nordic and Benelux countries (with the exception of Finland), Germany, Malta, Austria, the UK and Estonia, joined on this indicator by Lithuania. Finland sits just outside the top ten on this measure, ranked twelfth. The lowest indices are again found in southern and eastern European states, joined on this measure by France. Only three countries have a positive index on this measure, with Germany having the highest index (1.1), followed by Malta (0.8) and Denmark (0.2). Nine countries have an index of lower than -6. Croatia, Greece and Spain have the most negative perceptions of their countries current employment situation, with indices of -8.3, -8.1 and -8 respectively, followed by Slovenia (-7.6); Bulgaria (-7.4); Cyprus (-7); Romania (-6.9); Italy (-6.7) and Slovakia (-6.2). Not surprisingly, there is a relationship between the perceptions of individual countries of the employment situation in their country and the level of unemployment in the country concerned, with higher indices generally found in countries with relatively low levels of unemployment, and vice versa. For example, Germany, Malta and Denmark, which score highest on this measure, have some of the lowest current unemployment rates in the EU28 (although not the lowest); and Croatia, Greece and Spain, which score lowest on this measure, have the highest unemployment rates in the EU There are some exceptions to this rule, most notably in Romania, which has the eighth lowest unemployment rate in the EU28, but ranks twenty-second in terms of its perceptions of the employment situation in the country; and in Slovenia, which has the thirteenth lowest unemployment rate in the EU28, but ranks twenty-fifth on this indicator. Of course, people s perceptions of the employment situation in their country may be influenced by a wider range of factors than simply the rate of unemployment. People s judgements of the employment situation in their country have improved in sixteen Member States 35 since 2014; France and the Czech Republic show no change; and the remainder show a worsening of perceptions. The largest improvements are observed in Ireland (up 1.6 points), Portugal (up 1.5) and the UK (up 1.4). These improvements reflect recent reductions in the unemployment rate 36 in each of these Member States. 34 Based on an analysis of the most recently published Eurostat unemployment statistics: 35 Malta, Denmark, the UK, Estonia, Lithuania, the Netherlands, Latvia, Poland, Hungary, Ireland, Portugal, Romania, Cyprus, Slovenia, Spain and Greece 36 This is based on comparisons of seasonally adjusted unemployment rates in April 2013 versus April In the UK, April 2014 data is not available and comparisons are based on April 2013 versus February
47 Germany, which, as noted earlier, has seen a particularly strong improvement in people s evaluation of its economic situation since 2009, has also seen the largest improvement in perceptions of the employment situation in the country between 2009 and 2014, with a net increase of 5.2 points over this period, although the index has declined very slightly since 2013 (down 0.1 point). The pattern is similar in other countries where improved perceptions of the economic situation since 2009 are reflected in improved perceptions of the employment situation over the same period, namely: Malta (+4.2 points between 2009 and 2014, moving from tenth position to second) Latvia (+3.2, from twenty-seventh to thirteenth) Estonia (+3, from eighteenth equal to eighth) Lithuania (+3, from twenty-first to ninth) the UK (+2.7, from fourteenth to seventh) Ireland (+2, from twenty-sixth to seventeenth) and Hungary (+1.7, from twenty-fourth to fifteenth). The largest deterioration in satisfaction with the current employment situation since 2013 is noted in Finland (down 1.9 points), followed by Belgium and Austria (both down 1.2 points). Whilst all these countries have seen a rise in unemployment over the last year they have not seen the largest relative increases in the rate of unemployment in the past year across the EU 37. The decline in Finland has pushed the country out of a top ten ranking position for the first time in the series (now twelfth). The largest drops in satisfaction with the current employment situation between 2009 and 2014 are to be seen in Cyprus, the Netherlands, Slovenia, Bulgaria and Greece, reflecting a broadly similar pattern observed earlier in relation to judgements of the economic situation more generally, with the exception of the Netherlands. Here opinions on the employment situation are more pessimistic than views on the economy, with the index dropping from 0.8 in 2009 (ranked first) to -2.8 in 2014 (ranked tenth equal). In Cyprus the index has declined from -1.5 in 2009 to -7 in 2014, moving from a ranking of fourth in 2009 to twenty-third in 2014; in Slovenia from -4.1 in 2009 (eleventh equal) to -7.6 in 2014 (twenty-fifth); in Bulgaria from -4.9 (sixteenth equal) in 2009 to -7.4 in 2014 (twenty-fourth); and in Greece from -5.8 (twenty-second) to -8.1 (twentyseventh). An analysis of demographic and socio-economic differences at the EU level in relation to these six country measures reflects the earlier finding that the key factors that differentiate how people feel about the situation in their country are their perception of how difficult it is to pay their household bills, their occupational status and, to a somewhat lesser extent, the age at which they completed their education. 37 Italy, Cyprus, Luxembourg, Malta and the Netherlands have all seen larger increases 44
48 Reflecting the pattern of findings concerning respondents personal situation, those who struggle to pay their bills most of the time have much lower indices than those who almost never struggle to do so on all six measures relating to the national situation. The most marked differences in perceptions between the two groups are in relation to the economic situation and the cost of living: 418 (2014) The cost of living in (OUR COUNTRY) How affordable energy is in (OUR COUNTRY) How affordable housing is in (OUR COUNTRY) The way public administration runs in (OUR COUNTRY) The economic The employment situation in (OUR situation in (OUR COUNTRY) COUNTRY) EU Difficulties paying bills Most of the time From time to time Almost never The most notable shifts in opinions since 2013 are in relation to: the economy, with all groups holding more positive perceptions, the most notable shift among those who almost never struggle to pay household bills (up 1 point) the cost of living, with a positive shift among those struggling to pay bills most of the time (up 0.6 points) and housing affordability, with a worsening of opinion among those who almost never struggle to pay bills (down 0.5 points). Compared with 2009, those who almost always struggle with bills are less positive about the employment situation (down 1 point); the way public administration is run (down 1.6 points); energy affordability (down 0.8 points); and, to a lesser extent, housing affordability (down 0.4 points). Those who almost never struggle with bills now hold more positive opinions on the economy (up 2.2 points) and, to a lesser extent, the employment situation (up 0.8 points). They are more pessimistic about housing affordability (down 0.4 points) and, to a somewhat lesser extent, energy affordability (down 0.3 points). In terms of the respondent s occupational status, the largest differences in the 2014 indices are again between the unemployed, who score lowest on all of the measures, and managers, who generally score highest 38. The difference in perceptions between the two groups is particularly marked in relation to the employment situation and the economic situation: 418 (2014) The cost of living in (OUR COUNTRY) How affordable energy is in (OUR COUNTRY) How affordable housing is in (OUR COUNTRY) The way public administration runs in (OUR COUNTRY) The economic The employment situation in (OUR situation in (OUR COUNTRY) COUNTRY) EU Respondent occupation scale Managers Unemployed Students have a higher index than managers on two indicators: energy affordability (-0.7) and housing affordability (-2.3) 45
49 Since 2013, the most notable improvement in managers perceptions relates to the economic situation (up 0.9 points), with small positive shifts in opinions on energy affordability and the employment situation. The affordability of housing is where opinion has worsened the most (down 0.6 points). Views on living costs are unchanged. Compared with 2009, managers are more positive about the economy (up 2.4 points) and the employment situation (up 0.9 points) and less positive about housing affordability (down 0.6 points) and energy affordability (down 0.3 points). Opinions on the cost of living and the way public administration runs have not changed. The unemployed also show an improvement since 2013 in their opinions on the economic situation, although it is less marked than that seen for managers (up 0.4 points). The only other positive shift of opinion among the unemployed is in relation to the cost of living (up 0.3 points). Compared with 2013, opinion has worsened the most in regards to the way public administration is run (down 0.5 points). When comparing with 2009, the unemployed hold more positive opinions on four indicators, with a worsening of opinion on the way in which public administration is run (down 1 point) and energy affordability (down 0.6 points). The greatest improvement relates to perceptions of the economy (up 0.6 points). In terms of age of leaving education, those who left education at 15 or younger, or aged 16-19, have more negative perceptions of the national situation than those who continued their education beyond the age of 19, and those who are currently studying: 418 (2014) The cost of living in (OUR COUNTRY) How affordable energy is in (OUR COUNTRY) How affordable housing is in (OUR COUNTRY) The way public administration runs in (OUR COUNTRY) The economic The employment situation in (OUR situation in (OUR COUNTRY) COUNTRY) EU Education (End of) Still studying
50 3. SOCIAL PROTECTION AND INCLUSION The final section in this chapter examines Europeans satisfaction with aspects of social protection and inclusion in their country. Respondents are asked to evaluate five specific areas: the healthcare system; the pension system; unemployment benefits; relations between people from different cultural or religious backgrounds, or nationalities; and the way in which inequalities and poverty are addressed. As before, the results are reported as indices. Each of the five aspects of social protection and inclusion is examined in turn for the EU as a whole, and for each of the 27 Member States and Croatia for the latest wave, and for the 27 Member States for the last four waves. 47

51 The following table summarises people s satisfaction with the healthcare system in their country. 48
52 Europeans overall evaluation of the healthcare system in their country is positive, although only slightly, with an overall index of 1. The healthcare system is the fourth highest rated of the 15 measures covered in the survey, behind the area in which people live, their life in general and their job situation. There has been a small decline in the index since 2013 (down 0.2 points) and it is now at its lowest level in the series, although it is only slightly lower than the high of 1.3 seen in 2009 and The index varies considerably nationally, with the difference between the most positive and most negative ratings (11.6 points) the second highest of the 15 measures 39. Fifteen countries have a net positive perception of the healthcare system in their country, with the rank order of countries broadly reflecting the pattern seen in most of the earlier findings, joined on this measure by France. Luxembourg has the highest index (5.5), followed by Austria (5.4), Belgium (5.3), Malta (5) and the Netherlands (4.9). These five Member States are then followed by Denmark (3.7), the UK and France (both 3.4), Finland (2.9), Germany (2.8) and Sweden (2.7). Whilst Sweden holds some of the most positive perceptions of any Member State on its healthcare system, it sits just outside the top ten countries on this measure (ranked eleventh) the only measure reported thus far where Sweden does not hold a position in the top ten. Among the thirteen countries that have a net negative perception of their healthcare system Greece has the lowest index (-6.1), followed by Bulgaria (-4.3), Poland (-3.6), Romania (-3.5), Latvia (-3.1) and Hungary (-2.2). Comparing the results at a national level with those from 2013, eight Member States 40 show a year-on-year improvement in terms of people s satisfaction with the healthcare system in their country, Luxembourg, Finland and Estonia show no change, and the remaining countries show a worsening of opinion on their healthcare system. Improvements are mostly relatively modest, with the largest in Austria and Malta (both up 1.2 points), followed by Portugal (up 0.5), Denmark and France (both up 0.3 points), and Belgium, the Czech Republic and Spain (each up 0.1 point). The largest decline in satisfaction with the healthcare system between 2013 and 2014 can be seen in Bulgaria (-1.7 points), followed by Latvia (-1.5), Cyprus (-1.3), Poland (-1.2), Slovakia (-1.1) and Hungary (-1). Across the period, the greatest improvements in perceptions of the healthcare system can be seen in Malta, up 2.3 points from 2.7 in 2009 to 5 in 2014; Germany, up 1.8 from an index of 1 in 2009 to 2.8 in 2014; and Lithuania, up 1 from an index of -1.1 in 2009 to -0.1 in The largest overall declines are observed in Greece (down 3 points), followed by Spain and Poland (both down 1.9), Cyprus (down 1.5) and Italy, Slovakia and Latvia (each down 1.3). 39 The highest difference is in relation to the pension system 40 Austria, Belgium, Malta, Denmark, France, the Czech Republic, Spain and Portugal 49
53 The second measure in this section concerns people s views of the pension system in their country. 315 (2009) The pension system in (OUR COUNTRY) (Evaluation of the current situation) 349 (2010) 370 (2011) 391 (2012) 408 (2013) 418 (2014) EU LU DK MT NL FI AT BE DE UK FR SE IE ES SI HU EE CY LT CZ IT HR PT SK PL LV RO BG EL
54 Europeans net judgement of the pension system in their country is slightly negative, with an index of -1.7 at the EU level. Apart from a small improvement in the index in 2012, there has been a slight deterioration over the six years of the survey from a high of -1 in The 2014 index is the lowest score in the series, showing a small decline (down 0.2 points) since This measure shows the most national variation of all 15 measures, with a difference of 11.9 points between the most positive and most negative ratings. Differences in the levels of satisfaction with the pension system at country level broadly follow the pattern for most of the measures, with the highest index found in Luxembourg (4.4) followed by Denmark (3.8), Malta (3.3), the Netherlands (3.1), Finland (2.7), Austria (1.7), Belgium (1.1), Germany (0.4) and the UK (0.2). No other country has a positive index. Sweden, as seen in relation to opinions about the healthcare system, sits just outside the ten countries holding the most positive views about the pension system, ranked eleventh with an index of This is only the second measure of the twelve reported so far where Sweden does not hold a position in the top ten most positive Member States. The lowest level of satisfaction with the pension system is found in Greece (-7.5), followed by Bulgaria (-6.3), Romania (-5.5), Latvia (-5.4), Poland (-4.8), Slovakia (-4.3), Portugal (-4.1) and the Czech Republic, Croatia and Italy (-4 in each). Eight Member States 41 show an improvement since 2013 in terms of people s satisfaction with the pension system in their country and, as seen in relation to opinions on the healthcare system, they are mostly relatively modest. The largest improvements are observed in Malta (up 2.2 points), Estonia (up 1.8), Croatia (up 1.6) and Finland (up 1.1). Malta and Finland have also seen the largest improvements of any Member State between 2009 and 2014, with an increase of 2.8 points in Malta from 0.5 in 2009 to 3.3 in 2014, and an increase of 1.6 points in Finland with the index rising from 1.1 to 2.7. The remaining twenty Member States all show a worsening of their opinions on their pension systems since 2013, mostly relatively modest. The largest declines can be seen in Cyprus (down 1.6 points), Sweden (down 1.4), Bulgaria and Slovenia (each down 1.3) and Hungary, Lithuania and the UK (each down 1 point). Over the six survey years the largest deteriorations in indices are witnessed in Cyprus, falling 2.7 points from -0.9 in 2009 to -3.6 in 2014; Estonia and Slovenia, both down 2.5 points from -0.6 to -3.1 and from -0.1 to -2.6 respectively; Lithuania, down 2.4 points, from -1.4 to -3.8; the Czech Republic and Latvia, both down 2.2 points from -1.8 to -4 and from -3.2 to -5.4 respectively; and Greece, down 2.1 points, from -5.4 to Estonia, in spite of showing the second largest improvement of any Member State on opinions about its healthcare system since 2013, has the second largest deterioration (along with Slovenia) over the six survey years. This is because prior to 2014 the index has dropped each year, most notably in 2011 (down 1.9 points on 2010). 41 Denmark, Malta, the Netherlands, Finland, Spain, Estonia, Croatia and Portugal 51
55 The next table summarises how Europeans rate unemployment benefits in their country. Unemployment benefits in (OUR COUNTRY) (Evaluation of the current situation) 315 (2009) 349 (2010) 370 (2011) 391 (2012) 408 (2013) 418 (2014) EU LU AT MT NL FI DK DE BE FR IE UK SI SE LT EE CY ES LV CZ PL IT PT SK HU HR RO BG EL
56 Europeans overall satisfaction with unemployment benefits in their country is at a broadly similar level to their satisfaction with their pension system, with an index of -1.4 at the EU level. The index has increased slightly since 2013, when it was -1.6 and at its lowest level in the series. Differences in perceptions at the national level broadly follow the pattern for most of the measures, with the highest indices found in the Benelux and Nordic countries (with the exception of Sweden), Austria, Malta and Germany, joined on this measure by France and Ireland. The highest index is found in Luxembourg (3.5) which, as already reported, also has the most positive opinion of any Member State in relation to both its healthcare system and pension system. Luxembourg is followed by Austria (3.3), Malta (3.1), the Netherlands (2.9), Finland (2.7), Denmark (2), Germany (1.7), Belgium and France (both 1.2) and Ireland (0.4). The only other country with a positive index on this measure is the UK (0.3). Sweden, which ranks in the top ten most positive countries on each of the measures relating to personal situation and the national picture, again ranks slightly lower on this measure (thirteenth), following the pattern seen earlier in relation to its healthcare and pension systems. The UK, which ranks in the top ten most positive countries on most of the measures already discussed 42 also sits just outside the top ten countries with the most positive perceptions of their unemployment benefits (ranked eleventh). Seventeen Member States have a negative index on this measure, with ten having an index of -4 or lower. These ten are all southern and eastern European countries. Greece has the lowest score (-7.4), followed by Bulgaria (-5.6), Romania (-5.5), Croatia (-5.1), Hungary (-4.8), Slovakia (-4.5), Italy and Portugal (both -4.2), Poland (-4.1) and the Czech Republic (-4). Thirteen Member States 43 show an improvement since 2013 in terms of people s satisfaction with unemployment benefits in their country, although increases tend to be small. Opinion remains unchanged in Cyprus and Italy and has deteriorated in the remaining thirteen Member States although, again, declines in indices on this measure are for the most part small. The greatest improvement since 2013 in perceptions of unemployment benefit provision is seen in Malta (up 2.4 points), followed by Estonia and Finland (both up by 1.2 points) and Spain (up 1.1). They are followed by Portugal (up 0.8 points), Slovenia (up 0.7) and France (up 0.6). Malta and Finland also show the largest improvements since 2009, up 4.1 points from -1 in 2009 to 3.1 in 2014 in Malta, and up 2.2 points, from 0.5 to 2.7 respectively in Finland. The improvement in Malta has seen its ranking on this measure improve from fourteenth in 2009 to third in In addition to Malta and Finland, only two other Member States show an improvement of more than one point over the six year series: Germany (up 1.5 points), from an index of 0.2 in 2009 to an index of 1.7 in 2014; and Luxembourg (up 1.1 point), from 2.4 to The exceptions being energy affordability (ranked 24 th ), housing affordability (ranked 19 th ), and area lived in and the way public administration runs (ranked 11 th in each case) 43 Austria, Malta, the Netherlands, Finland, France, Ireland, Slovenia, Estonia, Spain, Poland, Portugal, Croatia and Romania 53
57 The largest declines in satisfaction with unemployment benefits between 2013 and 2014 are observed in Sweden (down 1.1 point) and Denmark (down 0.9). The greatest declines in satisfaction with unemployment benefits between 2009 and 2014 are in Cyprus (down 2.4 points), Greece (down 2.1), Spain and the Czech Republic (both down 2), Sweden (-1.6), Slovakia (down 1.3) and Slovenia and Romania (both down 1.2 points). 54
58 The report looks next at how satisfied Europeans are with the national situation in terms of relations between people from different cultural or religious backgrounds or nationalities. Relations in (OUR COUNTRY) between people from different cultural or religious backgrounds or nationalities (Evaluation of the current situation) 315 (2009) 349 (2010) 370 (2011) 391 (2012) 408 (2013) 418 (2014) EU LU FI LT EE IE MT LV PT ES NL DE UK SK BG PL DK SI RO AT CY HU SE BE HR IT FR EL CZ
59 Overall, Europeans are divided in their perceptions of the relations between people from different cultural or religious backgrounds or nationalities in their country, with an index of 0 at the EU level. The index has declined slightly since 2013 (down 0.3 points) and is now at its lowest level in the series, compared with a high of 0.4 in There is less national variation on this measure than on any of the other survey measures. As was the case in relation to perceptions of energy costs and housing affordability, there is a less discernible pattern than on most of the 15 indicators in terms of the countries with the highest and lowest indices on this measure. Sixteen countries have a positive score, with the most positive perceptions held in Luxembourg (2.5), Finland (2.2), Lithuania (1.8), Estonia (1.7), Ireland (1.6), Malta (1.5), Latvia (1.3) and Portugal (1.2). Apart from the Czech Republic (-2.5), Greece (-1.5), France (both -1.3) and Italy (-1.1), all countries have an index better than -1. Only six Member States show an improvement in perceptions of relations between people from different cultural or religious backgrounds or nationalities between 2013 and 2014, and all shifts towards more positive opinions are small. The greatest improvements can be observed in Greece (up 0.6 points) and Finland (up 0.5). Opinions in Spain, Hungary and Croatia remain unchanged, and have deteriorated in the remaining nineteen countries although, again, declines in indices are for the most part small. The greatest deterioration since 2013 can be observed in the Czech Republic (down 1.5 points), followed by Austria (down 1.2). No other country shows a decline in its index of at least one point. Malta shows the largest improvement of any Member State since 2009 on this measure (up 1.7 points), improving its ranking from twenty-first in 2009 to sixth in The next greatest improvements are seen in Denmark (up 1 point, moving from twenty-third position to fourteenth), the Netherlands (up 0.7, from nineteenth to ninth) and Finland (up 0.7, ranked second in both years). The largest declines since 2009 can be seen in Romania (down 1.5 points, moving from equal sixth position to eighteenth), the Czech Republic (down 1.5 points, from twenty-sixth to twenty-eighth), Belgium (down 1, from fourteenth to twenty-third) and the UK (down 0.9, from third to twelfth position). 56
60 The last measure examined in this section is Europeans satisfaction with the way in which inequalities and poverty are addressed in their country. The way inequalities and poverty are addressed in (OUR COUNTRY) (Evaluation of the current situation) 315 (2009) 349 (2010) 370 (2011) 391 (2012) 408 (2013) 418 (2014) EU MT LU DK FI NL AT BE DE SE IE UK PL EE CY FR ES IT CZ PT SI SK HU HR LT RO BG LV EL
61 Overall, Europeans have a negative view of the way in which inequalities and poverty are addressed in their country, with an index of -3 at the EU level, a decline on the index of -2.4 in 2013, and the lowest score recorded in the series. Only four Member States have a positive score on this measure: Malta (1.7), Luxembourg (0.3), Denmark (0.2) and Finland (0.1). Eight countries have an index of -4 or lower, with Greece having the lowest index (-6.5), followed by Bulgaria and Latvia (both -5.4), Romania (-5.1), Lithuania (-4.5), Croatia and Hungary (both -4.4) and Slovakia (-4). Only four Member States show an improvement in their evaluation of the way in which inequalities and poverty are addressed relative to The greatest improvement is recorded in Estonia (up 0.9 points), with its ranking improving from twenty-third equal in 2013 to thirteenth in The other three countries where indices have improved since 2013 are Malta (up 0.5), Finland (up 0.3) and Portugal (up 0.1). Malta also shows the largest improvement on this measure since 2009 (up 1.8 points), moving its ranking over the six years from fifth to first. No other Member States show an improvement of at least 1 point since 2009, with the next greatest improvement behind Malta in Hungary (up 0.6 points). The indices in Poland, Spain and Romania remain unchanged since Although the remaining twenty-one Member States show a decline in their index between 2013 and 2014, only five have seen a decline of at least one point. The largest deterioration is observed in the UK and Belgium (both down 1.3 points), followed by Luxembourg, Sweden and the Czech Republic (all down 1.1 point). The UK, Sweden and the Czech Republic also show some of the largest declines of any Member State on this measure since 2009, with their indices dropping by 2.1, 2 and 1.7 points respectively. Cyprus shows the greatest deterioration (down 2.3 points), with Greece and Spain (both down 1.8 points), Slovenia (down 1.7 points), Italy (down 1.5), Romania (down 1.4) and Slovakia (down 1.3) also showing a decline of at least 1 point since The most notable socio-demographic differences in relation to these five measures are again related to difficulty paying household bills, occupational status and age of leaving education. Reflecting earlier findings, those who struggle to pay their bills most of the time have lower indices than those who almost never struggle to do so on all five measures, with the most marked variation between the two groups on satisfaction with the pension system and unemployment benefits: 58
62 418 (2014) The healthcare system in (OUR COUNTRY) The pension system in (OUR COUNTRY) Unemployment benefits in (OUR COUNTRY) Relations in (OUR COUNTRY) between people from different cultural or religious backgrounds or nationalities The way inequalities and poverty are addressed in (OUR COUNTRY) EU Difficulties paying bills Most of the time From time to time Almost never The most notable shifts in opinions since 2013 are in relation to: unemployment benefits, with a positive shift among those who struggle to pay bills most of the time (up 0.8 points) the way inequalities and poverty are addressed, with negative shifts in opinion among all groups, strongest among those who sometimes struggle with their bills (down 0.8 points) relations between people from different cultural or religious backgrounds or nationalities, with the strongest worsening of opinion among those who struggle to pay bills from time to time (down 0.6 points) Compared with 2009, any shifts in opinion are negative. Those who almost always struggle with bills are notably less positive about the pension system (down 1.7 points); the healthcare system (down 1.3 points); and the way inequalities and poverty are addressed (down 1.3 points). Their views on unemployment benefits are unchanged. Those who almost never struggle with bills are more pessimistic about the way in which inequalities and poverty are addressed (down 0.8 points) and, to a lesser extent, about their pension system (down 0.4 points). Those who sometimes struggle with paying bills are less positive than they were in 2009 about the pension system (down 1.2 points); the way inequalities and poverty are addressed (down 1.1 point); unemployment benefits (down 0.8 points); and the healthcare system and relations between relations between people from different cultural or religious backgrounds or nationalities (both down 0.5 points). In terms of occupational status, the largest differences in the 2014 indices are again between the unemployed, who have the least positive perceptions of the occupational groups, and managers, who generally have the most positive views 44 : 44 Students have a higher index than managers on: the healthcare system (2.5), the way inequalities and poverty are addressed (-1.8) and relations between people from different cultural or religious backgrounds or nationalities (1) 59
63 418 (2014) The healthcare system in (OUR COUNTRY) The pension system in (OUR COUNTRY) Unemployment benefits in (OUR COUNTRY) Relations in (OUR COUNTRY) between people from different cultural or religious backgrounds or nationalities The way inequalities and poverty are addressed in (OUR COUNTRY) EU Respondent occupation scale Managers Unemployed Since 2013 the only improvement, albeit small, in managers perceptions relates to unemployment benefits (up 0.2 points). The largest worsening of opinion is on the way inequalities and poverty are addressed (down 1 point), followed by relations between people from different cultural or religious backgrounds or nationalities (down 0.6 points). Views on the healthcare system are unchanged. Compared with 2009, managers are more positive about unemployment benefits (up 0.5 points) and the healthcare system (up 0.4 points) and less positive about the way inequalities and poverty are addressed (down 1 point) and relations between people from different cultural or religious backgrounds or nationalities (down 0.5 points). Perceptions among the unemployed are more negative now than in 2013 on all five social protection and inclusion indicators. They are notably more pessimistic about relations between people from different cultural or religious backgrounds or nationalities (down 0.8 points); the way inequalities and poverty are addressed (down 0.8 points); the healthcare system (down 0.5 points); and pension system (down 0.5 points). Compared with 2009, the indices for the unemployed have deteriorated most notably in relation to the pension system (down 1.2 points), the way inequalities and poverty are addressed (down 0.9 points) and unemployment benefits (down 0.5 points). In terms of age of leaving education, those who left-time education at 15 or younger, or aged 16-19, have more negative perceptions of the national situation than those who continued with their education beyond the age of 19, and those who are still in education: 418 (2014) The healthcare system in (OUR COUNTRY) The pension system in (OUR COUNTRY) Unemployment benefits in (OUR COUNTRY) Relations in (OUR COUNTRY) between people from different cultural or religious backgrounds or nationalities The way inequalities and poverty are addressed in (OUR COUNTRY) EU Education (End of) Still studying

64 III. EXPECTATIONS FOR THE NEXT 12 MONTHS The final two chapters of the report examine whether Europeans think that things will improve, get worse or remain the same in the forthcoming year, and how they perceive the current situation compared with five years ago - is it better, worse or similar? For both chapters the results for the 15 measures used in the survey are analysed at overall EU and Member State levels, with comparisons made between the results of the 2014 wave and those from the 2013 survey only. The results are presented in percentage terms rather than as indices. Comparisons are also made between EU15 and NMS13 Member States and socio-demographic groups on the 2014 results. This chapter begins with an overview of Europeans perceptions of what they think will happen over the course of the next year in terms of their personal situation, before examining perceptions in relation to national issues and concluding with a review of what Europeans think the short-term future holds in relation to aspects of social protection and inclusion. 1. PERSONAL SITUATION On each of the measures relating to respondents personal circumstances, most Europeans expect things to remain unchanged in the next twelve months. Across all four measures, where respondents do perceive things will change, they are more likely to say that they will get better than that they will get worse. 45 Three quarters of Europeans (75%) anticipate no change in their local area, with 16% expecting things to get better and 7% things to get worse. Around three in five (59%) expect no change in their life in general, with just over one in four (27%) anticipating an improvement and one in nine (11%) believing that their life will get worse. 45 Q3 What are your expectations for the next twelve months: will the next twelve months be better, worse or the same, when it comes to.? (ONE ANSWER PER LINE) (READ OUT) Your life in general, The area you live in,.your personal job situation, The financial situation of your household.better, Worse, Same, Don t know NB The statements relating to national situation and social protection and inclusion are also asked in this question 61
65 Similar proportions expect no change in their job situation and household finances (60% and 61% respectively). Those who expect their job situation to change are more likely to expect things will get better (19%) than get worse (10%), with the remainder (11%) unsure how the situation will change. Fewer respondents (4%) are uncertain how their household finances will change, with one in five (20%) thinking that they will improve and one in seven (15%) expecting them to get worse. Europeans are slightly more optimistic than they were in 2013 about how things will change in the short term on each of the measures relating to their personal circumstances. The most notable improvements are in relation to general life and the household financial situation, with increases (+4 percentage points and +3 points respectively) in the proportions expecting things to get better, and somewhat larger corresponding decreases in the proportions thinking things will get worse (general life -5 points; household finances -6 points). This has changed the overall balance of opinion 46 on household finances from being negative in 2013 to positive in The differences between EU15 and NMS13 are that: People in EU15 are more optimistic than those in NMS13 in relation to: o o their job situation (20% thinking it will improve, 9% expecting it to get worse, compared with 17% and 12% respectively in NMS13) their household finances (20% thinking it will improve, 15% expecting it to get worse, compared with 19% and 17% respectively in NMS13) Those in NMS13 are more positive in relation to: o their local area (21% expecting it to improve, 8% thinking it will get worse), compared with 15% and 7% of those in EU15) At a national level, the Member States that tend to have the most consistently positive views in terms of their current personal situation are Sweden, Malta and Estonia, followed by Latvia and the UK. In terms of the balance of opinion on each of the four measures, respondents in Sweden have the most positive outlook of any country on three: life in general, with over two fifths (45%) expecting their life to improve and only 2% thinking it will get worse; job situation (30% and 4% respectively); and household finances (32% vs. 8%). They are less positive than some other Member States about the area in which they live, although they still hold the eighth most positive outlook. 46 i.e. the difference between the proportion of respondents who say things will improve and the proportion who say they will get worse on this measure 62
66 Respondents in Malta have the second most positive views of any Member State on each of the four measures: life in general, with 38% thinking it will improve and only 3% expecting it to get worse; local area (27% and 2% respectively); job situation (26% vs. 3%); and household finances (25% vs. 4%). Estonia has the most positive outlook on the local area, with around three in ten respondents (29%) expecting it to get better and 3% expecting it to get worse; the third most positive views on job situation (28% and 6% respectively) and on household finances (31% vs. 11%). Respondents in Latvia have the third most positive views on the area in which they live, with a quarter (24%) expecting it to improve and 2% thinking it will get worse. They are also among the most positive of the Member States in terms of the household financial situation (ranked fifth), personal job situation (sixth) and life in general (seventh). The UK has the fourth most positive outlook of any country in relation to life in general, with around two in five respondents (42%) thinking it will improve and one in ten (10%) expecting it to get worse; and their personal job situation (26% and 7% respectively); and the sixth most positive in terms of their personal financial situation. In terms of other Member States, respondents in Ireland are particularly optimistic about life in general, behind only Sweden and Malta, with around two in five (38%) expecting their life to get better and 5% thinking it will get worse. Respondents in Greece have by far the most negative outlook in relation to their personal situation, followed by those in Portugal and Italy. Greece has the most negative outlook of any EU Member State on all four measures: They are particularly pessimistic about household finances, with over two fifths (45%) thinking they will get worse and around one in six (16%) expecting them to improve. In relation to job situation, around three in ten (29%) expect things to get worse and one in seven (14%) anticipate improvement In relation to life in general, around one in three (34%) think it will get worse and a fifth (21%) expect it to improve. Greece is the only Member State with a net negative balance of opinion on this measure. In terms of the area where they live, around one in four respondents in Greece (23%) think their area will deteriorate with one in seven (15%) expecting an improvement. Again, it is the only Member State with a net negative balance of opinion on this measure. 63
67 Respondents in Portugal hold the second most pessimistic expectations on three measures: the household financial situation, with a quarter (26%) expecting it to get worse, and 16% expecting an improvement; personal job situation (18% and 14% respectively); and life in general (17% vs. 19%); and the third most negative outlook on local area (9% vs. 12%). Respondents in Italy have the third most negative outlook on their personal job situation, with around one in five (18%) expecting it to get worse and around one in six (16%) thinking it will get better; the third most negative on the area in which they live (11% and 15% respectively); and are among the most negative in terms of their expectations concerning life in general (ranked twenty-fourth equal) and the household financial situation (twenty-third). Moving on to look at shifts in the balance of opinion on these measures between 2013 and 2014, respondents in Cyprus stand out in terms of a notable positive shift in their expectations of how their personal situation will change in the next 12 months, although they still hold the fourth most negative outlook of any Member State in relation to their household finances and the fifth most negative outlook on personal job situation. Cyprus shows the largest improvement of any Member State in terms of the balance of opinion on three indicators: household finances, with 15% of respondents expecting this situation to improve and 21% expecting it to get worse, compared with 4% and 51% respectively in 2013 life in general, with 27% expecting their life to improve, and 14% expecting it to get worse, compared with 12% and 36% respectively in 2013 and personal job situation, with 16% anticipating an improvement, and 16% thinking it will worsen, compared with 4% and 30% respectively in 2013 Portugal and Greece, in spite of having the most negative outlooks of the 28 Member States (as noted earlier) also show some of the most notable positive shifts in expectations on all four measures. In Portugal the shift in balance of opinion is most notable in relation to respondents outlook on life in general (19% expecting it to improve, and 17% expecting it to get worse, compared with 10% and 39% respectively in 2013), followed by their expectations concerning the financial situation in the household (16% expecting it to improve, and 26% anticipating it will get worse, compared with 9% and 44% respectively in 2013). In Greece the shift in balance of opinion is largest in relation to the local area (15% expecting it to improve, and 23% expecting it to get worse, compared with 9% and 37% respectively in 2013); and household financial situation (16% expecting this to improve, and 45% expecting it to get worse, compared with 10% and 59% respectively in 2013). Other Members States which have seen the most notable positive shifts in expectations since 2013 are Ireland and Slovenia. 64
68 In Ireland the balance of opinion has improved most notably in relation to expectations concerning household finances (23% expecting this situation to improve, and 14% expecting it to get worse, compared with 14% and 30% respectively in 2013), and expectations with regard to life in general (38% expecting it to improve, and 5% anticipating it will get worse, compared with 26% and 18% respectively in 2013). In Slovenia, the most positive shift is in relation to expectations concerning the local area (16% expecting it to improve, and 9% expecting it to get worse, compared with 7% and 23% respectively in 2013). On each of the four measures, any negative shifts of opinion since 2013 are small (no more than 6 percentage points). There are some notable socio-demographic differences in relation to how respondents expect their personal situation to change in the next 12 months. Younger people, in particular those aged 15-24, are relatively optimistic and older people (particularly those aged 55+) tend to be more pessimistic. Differences are particularly marked in relation to outlooks on life in general, job situation and household finances. Reflecting the pattern by age, optimism tends to increase in line with terminal education age. The differences by age are also reflected in terms of occupational status with students being more optimistic and those who are retired more pessimistic. Managers are also relatively optimistic, in particular when compared with house persons in relation to expectations concerning life in general and job situation, and the unemployed in relation to local area. Reflecting the findings in Chapter II, those who almost never struggle to pay their household bills are more optimistic, those who struggle to pay bills most of the time are more pessimistic, while those who struggle from time to time have a tendency to sit somewhere in between. 65

69 2. COUNTRY This section covers Europeans perceptions of what they think will happen in the next 12 months in six areas relating to their own country: the cost of living; how affordable energy is; how affordable housing is; the country s economic situation; its employment situation; and the way in which public administration is handled 47. As in 2013, the large majority of Europeans expect either no change in these areas or think things will get worse, with only minorities believing the situation will improve. Most Europeans (59%) expect no change in the way public administration is run, although the balance of opinion is negative, with a fifth (21%) expecting things to get worse and one in eight (12%) thinking it will improve. In relation to the cost of living, energy affordability and the affordability of housing Europeans are fairly evenly divided between those thinking things will get worse and those thinking the situation will stay the same: 44% expect the cost of living to get worse, 41% think it will stay the same, 11% expect it to improve 40% expect energy will become less affordable, 42% expect no change, 12% expect it to become more affordable 47 Q3 What are your expectations for the next twelve months: will the next twelve months be better, worse, or the same, when it comes to.? (ONE ANSWER PER LINE) (READ OUT).. The cost of living, How affordable energy is in (COUNTRY), How affordable housing is in (COUNTRY), The way public administration runs in (OUR COUNTRY), The economic situation in (OUR COUNTRY),.The employment situation in (OUR COUNTRY) Better, Worse, Same, Don t know NB The statements relating to personal situation and social protection and inclusion are also asked in this question 66
70 37% expect housing will become less affordable, 44% expect no change, 12% expect it to become more affordable Europeans are more optimistic about the economic and employment situation, although over two fifths (45% for each indicator) think things will not change in the next 12 months and the balance of opinion remains negative: 23% expect the economic situation will improve, 26% expect it to get worse 21% expect the employment situation will get better, 28% expect it to get worse Europeans opinions have changed since Whilst most still expect either no change or think things will get worse in these areas, Europeans are more optimistic in 2014 than in 2013 across all six measures. The most marked shifts are in relation to the economic situation, the national employment situation and the cost of living: the economic situation: 23% expecting an improvement and 26% expecting it to get worse, compared with 15% and 42% respectively in 2013 the employment situation: 21% expecting improvement, 28% a worsening (vs. 15% and 43%) the cost of living: 11% expecting improvement, 44% a worsening (vs. 8% and 57%) the affordability of energy: 12% expecting improvement, 40% a worsening (vs. 10% and 48%) the affordability of housing: 12% expecting improvement, 37% a worsening (vs. 11% and 43%) the way public administration is run: 12% expecting improvement, 21% a worsening (vs. 9% and 27%) The differences between EU15 and NMS13 are that: People in EU15 are particularly more pessimistic than those in NMS13 in relation to: o energy affordability (11% thinking it will become more affordable, 44% expecting it to become less affordable, compared with 15% and 25% respectively in NMS13) o housing affordability (12% expecting it to improve, 41% believing it will get worse, compared with 13% and 24% respectively in NMS13) and somewhat more pessimistic than those in NMS13 in relation to: o the cost of living (11% expecting it to improve, 45% believing it will get worse, compared with 12% and 40% respectively in NMS13) 67
71 o the way public administration will be run (12% expecting it to improve, 21% thinking it will get worse, compared with 13% and 18% respectively in NMS13) Those in NMS13 hold a somewhat more negative outlook in relation to: o o the economy (18% expecting it to get better, 26% expecting it to get worse, compared with 25% and 26% respectively in EU15) the employment situation (16% expecting it to get better, 27% expecting it to get worse, compared with 23% and 29% respectively in EU15) Analysis of these findings at a national level reveals some consistent patterns of relative optimism and pessimism in the different countries. Those that stand out as being the most optimistic are Malta, Sweden, Denmark and Estonia. In terms of the balance of opinion on each of the six measures 48, respondents in Malta have the most positive outlook of any country on three: the affordability of energy, with 50% thinking it will get better and only 6% expecting it to get worse; the way in which public administration is run (31% and 8% respectively); and the cost of living (26% vs. 22%), where Malta is the only Member State with a net positive balance of opinion on this indicator. Respondents in Malta also have the second most positive outlook on the three remaining measures, even though on one, housing affordability, the net balance of opinion is negative (19% expecting improvement, and 22% anticipating it will become less affordable). The net negative balance of opinion on this indicator is significantly lower than in most other countries. Estonia is the only Member State with a net balance of opinion which is positive in relation to the outlook on housing affordability, with 19% of respondents expecting improvement and 8% anticipating a worsening. It has the second most positive outlook of any Member State in relation to energy affordability (18% and 6% respectively), albeit a much lower net positive balance than in Malta; and the way in which public administration is run (18% vs. 5%); and is among the most positive Member States in terms of its outlook on the economy (ranked seventh) and employment situation (fifth) but has a less optimistic outlook than most on the cost of living (eighteenth). Respondents in Denmark hold the most positive expectations of any Member State in relation to their economy, with half (50%) anticipating an improvement and just 3% expecting the economy will worsen; and the employment situation (52% and 5% respectively); and the second most positive on the cost of living (9% vs. 18%). They have a less optimistic outlook than some other countries in relation to energy and housing affordability (ranked twelfth and tenth equal respectively) and the way in which public administration is run (eleventh). 48 i.e. the difference between the proportion of respondents who say things will improve and the proportion who say they will get worse on a particular measure 68
72 Sweden has the third most positive outlook of any Member State on the employment situation, the cost of living and the way in which public administration is run; the fourth most positive in relation to the economic situation; and the sixth most positive on energy affordability. It has a more pessimistic outlook than most countries on the affordability of housing (ranked eighteenth). The only other Member States with a notable net positive balance of opinion (more than six percentage points) on any of the six national indicators are: The Netherlands, Ireland and the UK in relation to expectations concerning the economy The Netherlands, Ireland, the UK and Latvia on employment Hungary on energy affordability The most pessimistic Member States on these measures are Greece, Austria, Slovenia and Finland. Among the Member States that tend to have more positive views of the current situation (see Chapter II), in addition to Austria, Germany and Luxembourg are the most pessimistic about the future. Greece has the most negative outlook of any Member State on its economy, with more than half (55%) expecting things to get worse and one in six (17%) anticipating an improvement; the employment situation (55% and 17% respectively); and the way public administration is run (46% vs. 16%). It is notably more pessimistic than any other Member State on each of these three indicators. Greece also has a more negative outlook than most countries in relation to the affordability of energy (ranked twentyfourth), the cost of living (twenty-second) and housing affordability (nineteenth). Slovenia has the most negative outlook on the cost of living, with almost six in ten respondents (58%) believing things will get worse and only 4% anticipating an improvement; the second most negative in relation to the way in which public administration is run (28% and 6% respectively); and the third most negative on the economic situation (38% vs. 17%). It also has a more pessimistic outlook than most other Member States on energy affordability (ranked twenty-first equal), housing affordability (twentieth) and the employment situation (twentieth equal). Respondents in Austria hold the most pessimistic expectations in relation to the affordability of housing, with just over half (54%) believing housing will become less affordable and only 8% thinking it will become more affordable; and the third most negative in relation to the cost of living (57% and 9% respectively) and the affordability of energy (53% vs. 12%). Austria is also more pessimistic than most other Member States in relation to its outlook on the employment situation (ranked twenty-second), the way public administration runs (twenty-first equal) and the economic situation (eighteenth). 69
73 Finland (along with the UK) has the third most negative outlook of any Member State on housing affordability, with just over two fifths (45%) thinking it will become less affordable and only 3% anticipating improvement; and the fourth most negative on energy affordability (41% and 3% respectively) and on the way in which public administration is run (18% vs. 4%). It is also more pessimistic than most in terms of its outlook on the economic situation (ranked twenty-fourth), employment situation (twenty-third equal) and living costs (twenty-third). In terms of the other Member States, respondents in Germany are particularly pessimistic about energy affordability, and have the most negative outlook of any country, with two thirds (66%) thinking it will worsen and only 5% thinking the cost will improve. They also have the second most negative expectations in relation to housing affordability (50% and 5% respectively). Respondents in the UK also have a particularly pessimistic outlook on these two measures, with the second most negative outlook on energy affordability (53% vs. 11%), and, as already noted, the third most negative outlook (along with Finland) on housing affordability (54% vs. 12%). Croatia has the second most negative outlook of any EU Member State in relation to the economy, with 42% thinking it will get worse and 14% that it will get better; and the employment situation (44% and 16% respectively). Respondents in the Czech Republic hold the second most pessimistic outlook on the cost of living (54% vs. 5%), and the third most negative in relation to employment (34% vs. 10%). Portugal holds particularly negative expectations in relation to the way in which public administration is run (32% vs. 13%), behind only Greece and Slovenia. On all of the six national measures the balance of opinion has become more positive since 2013 in the large majority of Member States. The most positive shifts in opinion since 2013 on these national indicators can be seen in Cyprus, Portugal, the Netherlands and Slovenia. With the exception of the Netherlands each of these countries also shows some of the most notable positive shifts in opinion in relation to people s outlook on their personal situation (outlined in the previous section of this chapter). The balance of opinion in Cyprus has improved more than in any other country since 2013 on four measures, although the net balance of opinion remains negative on each: the economy, with 23% of respondents expecting it to improve and 29% expecting it to get worse, compared with 4% and 74% respectively in 2013 the cost of living, with 13% expecting it to improve and 35% expecting it to get worse, compared with 5% and 67% respectively in 2013 the affordability of energy, with 15% thinking it will improve and 32% expecting it to worsen, compared with 7% and 60% respectively in 2013 housing affordability, with 16% expecting it to improve and 26% thinking it will worsen, compared with 13% and 48% respectively in
74 Cyprus also shows the second largest improvement of any EU Member State in the balance of opinion on the employment situation (18% expect it to improve, 35% expect it to worsen, compared with 4% and 79% respectively in 2013). It is less optimistic than some other Member States about any change to the way public administration is run (ranked ninth). Portugal shows the largest improvement of any Member State in relation to opinions on the way in which public administration runs, although again the balance of opinion remains negative, with 13% expecting improvement and 32% a worsening, compared with 5% and 48% respectively in It shows the second largest improvement in opinions on the cost of living (15% expecting it to improve and 47% anticipating it will get worse, compared with 4% and 75% respectively in 2013); energy affordability (11% thinking it will become more affordable and 44% expecting it to become less so, compared with 5% and 67% respectively in 2013); and housing affordability (11% expecting it to improve and 41% expecting it to worsen, compared with 6% and 60% respectively in 2013). Portugal also (along with Ireland) shows the third largest improvement in relation to opinions on the economic situation (20% expecting it to improve and 41% expecting it to worsen, compared with 7% and 74% respectively in 2013); and the fourth largest in relation to the employment situation. Respondents in the Netherlands show the strongest improvement of any Member State in their perceptions of the employment situation, with 38% expecting this to improve and 27% expecting a deterioration, compared with 11% and 62% respectively in 2013; and the second largest improvement in their expectations with regard to the economic situation, with 46% thinking it will improve and 17% expecting it to get worse, compared with 17% and 49% respectively in Both measures show a reversal from a net negative balance of opinion in 2013 to a net positive balance in The Netherlands also shows the third largest improvement of any Member State in relation to the way public administration runs, although here the overall balance of opinion remains negative (8% anticipating an improvement and 18% expecting a worsening, compared with 4% and 34% respectively in 2013). Slovenia (along with Greece), has the third largest improvement of any Member State in relation to opinions on energy affordability; the fourth largest in relation to housing affordability (with Spain also ranked fourth on this indicator) and the way in which public administration is run; and the fifth largest in terms of the national economy and employment situation. Across these five measures, the largest improvements in Slovenia are in relation to opinions on the economy (17% expecting it to get better and 38% expecting it to get worse, compared with 6% and 70% respectively in 2013); and the employment situation (17% expecting it to improve and 38% expecting it to get worse, compared with 7% and 70% respectively in 2013). In terms of notable improvements elsewhere in the EU, Ireland, as noted earlier, shows the third largest positive shift in expectations concerning the economic situation - 32% expecting it to get better and 18% expecting it to get worse, compared with 15% and 47% respectively in It also shows the third largest improvement in opinions on the employment situation, with 34% anticipating improvement and 16% a worsening, 71
75 compared with 15% and 43% respectively in Both these indicators show a reversal in Ireland from a net negative balance of opinion in 2013 to a net positive balance in Greece, as noted earlier, has the third largest improvement of any EU country in relation to opinions about energy affordability (along with Slovenia); and housing affordability. Spain shows a particularly marked improvement in opinions about the way public administration runs, second only to Portugal, although the overall net balance remains negative - 11% anticipating an improvement and 22% thinking it will get worse, compared with 7% and 41% respectively in As noted earlier, it also shows the fourth largest improvement in opinions about housing affordability (along with Slovenia). Only a minority of Member States show negative shifts in the balance of opinion on these national indicators and shifts are, for the most part, small. Austria and Finland are the only two Member States where opinion on all six measures has become more negative. Most of the shifts are relatively small, with the most notable in Austria in relation to employment - 38% expecting it to get worse and 16% expecting it to get better, compared with 28% and 19% respectively in 2013; and the cost of living - 57% thinking this will get worse and 9% anticipating it will improve, compared with 47% and 10% respectively in The socio-demographic differences in relation to how respondents expect the national situation to change in the next 12 months generally reflect those found in relation to the respondent s personal situation. However, differences are, for the most part, less pronounced than was the case for most of the personal indicators. In terms of age, younger people (aged 15-24) are slightly more optimistic and older people (those aged 55+, but also, in this case, those aged 40-54) tend to be more pessimistic. Those leaving education aged 20 or older hold notably more positive views than those leaving education aged 15 or under in relation to the economy and employment, but have only slightly more positive views in relation to the cost of living, the way public administration is run, energy affordability and housing affordability. In relation to occupational status, students remain more optimistic than other groups, particularly in their outlooks on the economy, the cost of living, energy affordability and the way public administration is run. Managers are also as optimistic as students in relation to their views of the employment situation, and relatively optimistic in relation to their opinions on the economic situation. The unemployed and retired tend to be the most pessimistic, although managers are equally as pessimistic in relation to their outlook on energy affordability and the most pessimistic of all occupational groups about housing affordability; and house persons are more pessimistic than the retired (but less pessimistic than the unemployed) about the economy and employment. 72
76 On most of the national indicators those who almost never struggle to pay their household bills are more optimistic in their expectations, those who struggle to pay bills most of the time are more pessimistic, while those who struggle from time to time have a tendency to sit somewhere in between. However, in relation to expectations concerning energy affordability and housing affordability those who struggle to pay bills from time to time are no less pessimistic than those who struggle to pay them most of the time. 73

77 3. SOCIAL PROTECTION AND INCLUSION The final section of this chapter examines Europeans expectations as to what will happen to areas of social protection and inclusion over the next year 49. As in 2013, most Europeans expect no change in the five areas of social protection and inclusion or think things will get worse, with small minorities anticipating improvements. When compared with perceptions of the national situation, Europeans are generally more likely to expect things to remain the same and less likely to think they will get worse 50. Just under three in five Europeans (57%) think the healthcare system in their country will remain the same in the next 12 months, with a quarter (26%) thinking it will get worse and 13% that it will get better. In relation to the pension system, half of all Europeans think it will stay the same (49%), around a third (31%) think it will deteriorate, with 12% expecting it to improve. Views on unemployment benefits are broadly similar, with 51% anticipating no change, 27% expecting them to get worse and 11% thinking they will improve. 49 Q3 What are your expectations for the next twelve months: will the next twelve months be better, worse or the same, when it comes to..? (ONE ANSWER PER LINE) (READ OUT).The healthcare system in (OUR COUNTRY), The pension system in (OUR COUNTRY), Unemployment benefits in (OUR COUNTRY), Relations in (OUR COUNTRY) between people from different cultural or religious backgrounds or nationalities, The way inequalities and poverty are addressed in (OUR COUNTRY)? Better. Worse, Same, Don t know NB Measures relating to personal situation and the national picture are also included in this question 50 The exceptions are views on the way public administration is run, where Europeans are much more likely to think things will stay the same than get worse; and views on the pension system, where the balance of opinion between those thinking it will stay the same and those thinking it will worsen is similar to the balance of opinion on the economic situation and the employment situation 74
78 In terms of relations between people from different cultural or religious backgrounds or nationalities, most (56%) think there will be no change, around a quarter (23%) expect such relations to worsen and 14% think they will get better. A small majority (53%) expect the way their country addresses inequality and poverty to remain unchanged, with around a quarter (27%) thinking that this will deteriorate and 13% believing it will improve. The most notable differences compared with 2013 are declines in the proportion of respondents expecting things to worsen across all five social protection and inclusion indicators. Whilst there have been small increases in the proportions expecting things to improve across all five indicators, the shifts away from anticipating things will get worse are largely towards respondents thinking things will stay the same or respondents saying they don t know what will happen in the next 12 months. The most marked decreases in the proportions thinking things will get worse are in the areas of: unemployment benefits, with 27% expecting it to worsen and 11% anticipating improvement, compared with 38% and 8% respectively in 2013 the pension system, with 31% expecting this to get worse and 12% expecting things to improve (compared with 41% and 8%) and the healthcare system, with 26% expecting it to worsen and 13% thinking it will improve (vs. 33% and 11%) The main differences between EU15 and NMS13 are that respondents in EU15 are more pessimistic than those in NMS13 on all five social protection and inclusion indicators, most notably in relation to: relations between people with different cultural and religious backgrounds or nationalities (25% expecting them to get worse, 14% expecting them to improve, compared with 16% and 15% respectively in NMS13) the healthcare system (28% expecting it will get worse, 13% believing it will improve, compared with 20% and 15% respectively in NMS13) the pension system (32% thinking they will get worse, 12% that they will improve, compared with 24% and 12% respectively in NMS13) Analysis of these findings at a national level reveals some consistent patterns of relative optimism and pessimism in the different countries. Across the 28 countries, Malta stands out as being the most optimistic in terms of the balance of opinion on these indicators, followed by Estonia and Sweden. As noted earlier these three Member States are (along with Denmark) the most optimistic in relation to national expectations and (along with the UK and Latvia) the most optimistic in relation to their outlook on the personal situation. Malta, Estonia and Sweden are the only Member States in which there is a positive balance of opinion on each of the five social protection and inclusion measures. 75
79 Malta has notably more positive opinions than any other country on four indicators: the healthcare system, with 44% expecting it to get better and 4% thinking it will get worse the pension system, with 31% expecting it to improve and 4% expecting it to get worse the way the country addresses inequality and poverty, with 36% expecting this to get better and 5% anticipating a worsening and unemployment benefits, with 27% thinking they will improve and 4% thinking they will get worse On the fifth indicator relations between people with different cultural and religious backgrounds or nationalities the positive balance of opinion in Malta is broadly similar to that in Estonia: 25% of respondents in Malta expect them to improve and 8% expect them to worsen, compared with 20% and 5% respectively in Estonia Estonia holds the second most positive outlook of any country on three measures: relations between people with different cultural and religious backgrounds or nationalities (as noted above), the healthcare system, with 22% anticipating improvement and 12% a worsening, and the pension system (20% and 11% respectively); and the third most positive outlook on unemployment benefits and the way the country addresses inequality and poverty. Sweden holds the second most positive outlook of any country on two measures: the way the country addresses inequality and poverty, with 31% of respondents thinking this will improve and 12% expecting a worsening, and unemployment benefits (26% and 10% respectively); the third most positive outlook in relation to its healthcare system and the pension system; and the sixth most positive on relations between people with different cultural and religious backgrounds or nationalities. Most countries have a negative balance of opinion on all or most of the indicators, with the most pessimistic views being found in Greece, the Netherlands and Slovenia. As noted earlier Greece and Slovenia have (along with Austria and Finland) the most pessimistic outlook on the national situation, and Greece also has (along with Portugal and Italy) the most pessimistic outlook on the personal situation. Greece has the most negative outlook of any Member State on three measures: the pension system, with the majority (63%) anticipating a worsening and one in eight (12%) thinking this will improve, unemployment benefits (56% and 12% respectively), and the way in which their country addresses inequality and poverty (48% vs. 13%); and it has the second most pessimistic outlook on its healthcare system (53% vs. 14%). Its views on relations between people with different cultural and religious backgrounds are more pessimistic than those held in most other countries (ranked twenty-third). 76
80 Respondents in the Netherlands hold the most pessimistic outlook on their healthcare system, with just under half of respondents (48%) expecting it to get worse and only 5% anticipating it will improve; and the second most pessimistic in relation to the pension system (46% and 5% respectively), unemployment benefits (46% vs. 4%), and relations between people with different cultural and religious backgrounds (30% vs. 8%). Their expectations in relation to the way their country addresses inequality and poverty are more pessimistic than those in most other Member States (ranked twentyfourth equal). Respondents in Slovenia have the second most pessimistic outlook on the way their country addresses inequality and poverty, with 37% thinking things will get worse and 7% expecting an improvement; and the third most pessimistic outlook on each of the other four measures, most marked in relation to the pension system (39% expecting a worsening and 6% expecting improvement) and unemployment benefits (38% and 5% respectively). In terms of other Member States, respondents in the Czech Republic are more pessimistic than any other about relations between people with different cultural and religious backgrounds, with just over a third (35%) expecting them to worsen, and only 5% thinking they will improve; and the third pessimistic on the way in which their country addresses inequality and poverty (30% and 5% respectively). Moving on to look at shifts in the balance of opinion on these measures between 2013 and 2014, the most notable positive shifts are observed in Cyprus, Portugal and Slovenia - countries which also showed notable positive shifts in opinions in relation to personal circumstances and the national picture. Cyprus has improved more than any other Member State on all five measures, although the overall balance of opinion remains negative on most: 14% expect the pension system to get better, and 25% expect it to get worse, compared with 2% and 62% respectively in % expect unemployment benefits to improve, and 29% expect them to get worse (vs. 2% and 59%) 22% expect the healthcare system to improve, and 20% expect it to worsen (vs. 8% and 38%), with a shift away from a large net negative to a small net positive balance of opinion 15% expect the way in which the country addresses inequality and poverty to improve, 28% think it will worsen (vs. 5% and 49%) 23% expect relations between people with different cultural and religious backgrounds to get better, 11% that they will get worse (vs. 2% and 42%) 77
81 Whilst the overall balance of opinion remains negative across all five measures in Portugal, it shows the second largest improvements of any Member State on three: the healthcare system, with 13% expecting improvement and 25% a worsening, compared with 5% and 48% respectively in 2013; the pension system, with 11% anticipating the system will improve and 38% thinking it will get worse (vs. 5% and 63%); and unemployment benefits, with 11% expecting improvement and 38% a worsening (vs. 5% and 63%). It also, along with Slovenia, shows the second largest improvement in relation to the way in which the country addresses inequalities and poverty, with 14% anticipating it will get better and 32% that it will get worse (vs. 5% and 48%). Similarly, whilst the overall balance of opinion remains negative on all five indicators in Slovenia, in addition to showing the second largest improvement on the way the country addresses inequalities and poverty, it shows the third biggest improvement in opinions about relations between people from different cultural or religious backgrounds or nationalities. The largest shift on these two indicators is on the way inequalities and poverty are addressed, with 7% expecting improvement, 37% a worsening, compared with 4% and 59% respectively in In terms of other Member States, the balance of opinion has improved most notably in: Greece, in the area of relations between people from different cultural or religious backgrounds or nationalities - 14% expecting them to get better, 32% thinking they will worsen, compared with 7% and 45% respectively in 2013 with this shift being the second largest across the EU28. Spain, in relation to the healthcare system - 14% expecting improvement, 27% a worsening (vs. 9% and 44%); and the pension system, with 11% expecting improvement, 30% a worsening (vs. 7% and 52%), with both these shifts being the third largest across the EU28. Ireland, in relation to unemployment benefits - 13% thinking they will improve, 21% anticipating a worsening (vs. 7% and 47%); and the way the country addresses inequalities and poverty - 15% expecting improvement, 15% a worsening (vs. 10% and 29%), with both shifts being the third largest across the EU28, shared with Sweden, in relation to the way the country addresses inequalities and poverty - 31% anticipating improvement, 12% a worsening (vs. 16% and 16%), showing a shift away from the idea that things will be the same to a net positive balance of opinion Any negative shifts in opinion since 2013 are small, with the most notable in: Bulgaria, in relation to the health system, with 22% expecting it to get worse and 9% anticipating improvement, compared with 20% and 16% respectively in 2013; the pension system, with 19% thinking it will get worse and 7% expecting it to improve (vs. 18% and 13%); and unemployment benefits, with 18% expecting these to worsen, 6% thinking they will get better (vs. 17% and 12%) 78
82 Austria, in relation to cultural relations, with 32% thinking they will worsen and 13% anticipating improvement (vs. 24% and 13%); the way inequalities and poverty are addressed, with 33% anticipating a worsening, and 14% an improvement (vs. 23% and 12%); and the pension system, with 37% thinking this will worsen and 9% that it will improve (vs. 29% and 8%) and Finland, in relation to unemployment benefits, with 17% expecting these to worsen and 3% anticipating improvement (vs. 10% and 5%) Austria and Finland are the only two Member States where opinion on all five social protection and inclusion measures has become more negative since 2013, although most of the shifts are relatively small. These are the only Member States where opinion on all six national measures has also become more negative since 2013 (reported in the previous section of this Chapter), although, again, most of the shifts on national indicators are relatively small. The socio-demographic differences in relation to how respondents expect these measures to change over the next year reflect those found in relation to the national situation, with differences, for the most part, being less pronounced than was the case for most of the personal indicators. In terms of age, younger people (aged 15-24) are relatively optimistic and those aged 40+ more pessimistic, although the young are only marginally more positive in relation to expectations concerning the way inequalities and poverty are addressed. In terms of age of leaving education, there is very little variance. Those leaving education aged 20 or older are somewhat more positive in their outlook on the way inequalities and poverty are addressed but only marginally more positive on each of the other measures, with those leaving education aged 15 or younger having slightly more negative expectations in relation to all five indicators. There are also less pronounced differences in relation to occupational status as was the case for measures relating to the national situation. Students remain more optimistic than other groups. There is no consistent pattern in terms of occupations with the most pessimistic views. Respondents who almost never have difficulties paying bills are more positive than those who find it difficult to pay them most of the time. 79

83 IV. CHANGES IN THE LAST 5 YEARS This final chapter examines Europeans perceptions of whether the current situation is better or worse, or unchanged, relative to the situation five years ago for each of the 15 measures 51. The first part of this chapter explores how Europeans perceive their personal situation compared with five years ago. It then examines Europeans perceptions in relation to national issues, before concluding with a review of opinions on areas of social protection and inclusion. 1. PERSONAL SITUATION In each of the four areas relating to their personal situation, Europeans are most likely to report that things have remained about the same compared with five years ago. In relation to their general life situation, job situation and household finances, where Europeans do perceive change, they are more likely to say that things have got worse than that they have got better, and particularly likely to report that their household financial situation has deteriorated in the past five years. Europeans are least likely to perceive change in relation to their local area and, where they do report a change, are evenly divided between those who think their area has improved and those who think it has got worse. The majority of Europeans (60%) think that the area they live in has not changed compared with five years ago, with around one in five (19%) thinking it has got better and a similar proportion (18%) believing that it has become worse. Just under half of Europeans (47%) perceive no change in their personal job situation in recent years, while 17% say that their situation has improved in this respect, compared with around one in four (26%) reporting that it has got worse. One in ten (10%) are unable to offer a view on this measure. Europeans present a more negative view of how 51 Q4 Compared with five years ago, would you say things have improved, got worse or stayed about the same when it comes to.? (ONE ANSWER PER LINE) (READ OUT) Your life in general, The area you live in, Your personal job situation, The financial situation of your household Improved, Got worse, Stayed about the same, Don t know 80
84 the financial situation of their household has changed compared with five years ago. While just over two in five (42%) say that it has not changed, a broadly similar proportion (38%) perceive it to have deteriorated, with 17% thinking it has improved. In terms of their life in general, two in five Europeans (40%) say that things have stayed about the same compared with five years ago, with a third (33%) thinking it has got worse and around a quarter (26%) that it has improved. Europeans are slightly more optimistic than they were in 2013 about how things are now compared with five years ago on each of the measures relating to their personal circumstances. The most notable improvements are in relation to life situation and local area, with small increases (+3 percentage points and +2 points respectively) in the proportions thinking things are better, and slightly larger decreases (-4 points and -5 points respectively) in the proportions thinking that things have got worse. The most notable differences between EU15 and NMS13 are: People in EU15 are more likely than those in NMS13 to think that their personal situation has improved in relation to: o their job situation (18% thinking it has improved, 25% believing it has got worse, compared with 14% and 28% respectively in NMS13) and those in NMS13 are more positive in relation to: o their local area (29% seeing improvement, 17% a worsening), compared with 17% and 19% of those in EU15) Nationally, respondents in Sweden and Malta have the most positive perceptions across all 28 countries of how their personal situation has changed compared with five years ago. Respondents in Denmark and Luxembourg are also relatively positive in their assessment of how their lives have changed. Respondents in Sweden have the most positive views of any of the 28 countries on three of the four measures. It is one of only two countries (the other being Malta) where a majority of respondents (55%) think their life in general has improved, with one in eight (13%) feeling it has got worse. Sweden is also most positive in relation to job situation (42% and 12% respectively) and household finances (45% vs. 22%), and is ranked seventh in terms of views on the local area. Respondents in Malta have the second most positive views of any Member State on three measures: life in general, with 52% thinking it has improved and 13% saying it has got worse; the area in which they live (35% and 8% respectively); and their household financial situation (30% vs. 11%); and the third most positive views in relation to their job situation, 29% thinking it has improved and 11% saying it has got worse. 81
85 Respondents in Denmark hold the second most positive views about their job situation, with 31% saying it has improved and 11% thinking it has got worse; and the third most positive on life in general (48% and 13% respectively) and their household finances (34% vs. 19%). They are somewhat less positive than some other Member States in relation to improvements in their local area (ranked ninth). Respondents in Luxembourg hold the fourth most positive views that things are better than five years ago on all four personal situation measures: life in general, with 38% thinking it has improved and 15% saying it has got worse; the area in which they live (28% and 5% respectively); their job situation (25% vs. 9%); and their household financial situation (25% vs. 12%). Respondents in Estonia hold the most positive perceptions in terms of changes in the last five years in their local area, with 39% thinking it has improved and 12% saying it has worsened. In contrast, perceptions of change are much more negative in Greece than in any other Member State. After Greece, Cyprus has the least positive views, followed by Portugal. Greece has the most negative outlook of any EU Member State on all four measures: They are particularly negative about household finances, with around nine in ten (87%) reporting they have got worse and just 3% thinking they are better Four in five (83%) believe that their life in general has got worse, with only 4% thinking it has improved More than half (56%) think that the area where they live has deteriorated, with only 5% seeing improvement. It is the only country where a majority think that their local area has worsened Around three in five (61%) report that their job situation has got worse, and just 3% think it has improved Respondents in Cyprus are the second most negative in their perceptions of change over the previous five years in relation to: life in general, with 65% seeing a deterioration and 11% thinking their life has improved; their household financial situation (76% and 3% respectively); and personal job situation (53% vs. 4%). Their views about the area in which they live are also more pessimistic than all but four Member States (38% vs. 16%). Respondents in Portugal hold the third most negative views of any Member State in relation to the household financial situation, with 66% thinking it has worsened and only 4% seeing improvement; their life in general (60% and 8% respectively); and their personal job situation (50% vs. 5%). Their perceptions of change in relation to the local area are more negative than all but six Member States (29% vs. 10%). The only other countries where a majority think that their personal situation has worsened in the last five years are: 82
86 Croatia, in relation to life in general and the household financial situation (56% and 60% respectively) Spain, in relation to life in general and the household financial situation (52% and 65% respectively) and Slovenia, also in relation to life in general and the household financial situation (51% and 58% respectively) In terms of shifts in perceptions between 2013 and 2014, the most positive are observed in Hungary and Malta, followed by Poland and Ireland. Hungary has seen the most positive shift of any Member State on three measures: life in general, with 22% thinking things have improved and 31% saying they have got worse, compared with 11% and 47% respectively in 2013; local area, with 26% thinking things have improved and 17% saying they have got worse (vs. 17% and 29%); and personal job situation, with 12% saying it has improved and 28% that it has deteriorated (vs. 9% and 41%). Hungary also shows the second strongest improvement in relation to opinions about household finances - with 15% of respondents saying things have improved and 36% that they have got worse (vs. 11% and 55%). Malta shows the most positive improvement of any Member State in relation to the household financial situation, with 30% thinking it has improved and 11% seeing a worsening (vs. 17% and 25%); the second most positive shift in relation to life in general, with 52% thinking it has improved and 13% that it has worsened (vs. 36% and 22% in 2013); and the third most positive shift (along with Poland) on job situation, with 29% seeing improvement and 11% a deterioration (vs. 22% and 15%). It also shows a shift towards more positive opinions on the local area although this is not as large as in some other countries (ranked seventh equal), with 35% saying it has improved and 8% that it has worsened (vs. 25% and 9%). Poland (along with Malta) shows the third largest improvement in opinions relating to job situation, with 18% seeing an improvement and 23% a worsening (vs. 12% and 28%); local area, where 37% think it has got better and 11% that it has got worse (vs. 26% and 15%); and household finances, where 18% see improvement and 30% a worsening (vs. 14% and 40%). It also shows an improvement in perceptions of life in general although the shift is less marked than in some other countries (ranked seventh equal). Ireland shows the third most positive shift of all 28 Member States in relation to life in general, with 31% saying it has improved and the same proportion that it has worsened (vs. 23% and 47% respectively in 2013); and the fourth largest in relation to views about the local area and job situation. Among the other countries, Denmark shows the second most positive shift of any country in relation to job situation, with 31% saying it has improved and 11% that it has worsened (vs. 25% and 17% respectively in 2013). Spain shows the second most positive shift in opinions about the local area, with 12% seeing improvement and 33% a deterioration (vs. 9% and 46% respectively in 2013). 83
87 On each of the four measures, any negative shifts of opinion between 2013 and 2014 are, for the most part, small. The most notable shifts are witnessed in Finland, where perceptions have deteriorated more than in any other EU Member State in relation to their household s financial situation, with 21% saying it has become worse and 21% that it has got better (vs. 17% and 27% respectively in 2013); and opinions on life in general - 16% thinking it has worsened and 35% that it has improved (vs. 18% and 45%). There are some notable socio-demographic differences in relation to how respondents perceive their current situation compared with five years ago. As was found in Chapter II, there is a strong relationship between how difficult people are finding it to pay their household bills and their perceptions of their personal situation: those who struggle to pay their bills most of the time are much more likely to be pessimistic and think their personal situation has got worse particularly in relation to their household financial situation and their life in general; those who almost never struggle to pay bills are more likely to be optimistic, while those who struggle from time to time have a tendency to sit somewhere in between. In terms of occupation, unsurprisingly, the unemployed have exceptionally negative perceptions of how their personal situation has changed, particularly in relation to job situation, household finances and life in general. Managers and students hold the most positive perceptions, with managers holding particularly positive views about their household financial situation and job situation and students holding slightly more positive opinions than managers about changes in the local area and life in general. Younger people, in particular those aged 15-24, are relatively positive, particularly about their life in general, and older people (aged 40+) tend to be more negative, particularly about life in general and household finances. In terms of age of leaving education, those leaving aged 20 or older have the most positive views, those leaving education aged 15 or younger the most negative perceptions. 84

88 2. COUNTRY This section covers Europeans perceptions of six areas: the cost of living, energy and housing affordability, the national economy and employment situation, and the way public administration is handled 52. The majority of Europeans perceive the national situation to have deteriorated compared with five years ago across five of the six indicators. Opinions are less clear-cut on the way in which public administration is run, with around two in five Europeans thinking it has got worse and almost half thinking it has not changed: Most respondents think the situation is worse than it was five years ago in terms of the cost of living (74%), the affordability of energy (63%) and housing (62%), the employment situation (60%) and the national economy (57%). A large minority (38%) think the way public administration is handled has got worse, while only 6% think it has improved. Europeans opinions have changed since Whilst most still think either that things have got worse or have stayed the same, the proportion of respondents thinking things have worsened has decreased across all six measures, most notably on opinions about the economy and economic situation. These two indicators also show the largest increases in the proportion believing things have improved: in relation to the economy, the proportion thinking it has got worse dropping from 71% in 2013 to 57% in 2014, and the proportion thinking it has got better increasing from 10% to 17%; and in 52 Q4 Compared with five years ago, would you say things have improved, got worse or stayed about the same when it comes to.? (ONE ANSWER PER LINE) (READ OUT) The cost of living, How affordable energy is in (COUNTRY), How affordable housing is in (COUNTRY), The way public administration runs in (OUR COUNTRY), The economic situation in (OUR COUNTRY), The employment situation in (OUR COUNTRY) Improved, Got worse, Stayed about the same, Don t know NB The statements relating to personal situation and social protection and inclusion are also asked in this question 85
89 relation to the employment situation the proportion thinking it has worsened declining from 71% in 2013 to 60% in 2014, with the proportion thinking it has improved increasing from 8% to 14%. Across the remaining four measures, which show smaller declines in the proportions thinking things have worsened, the shifts in opinions are towards thinking things have stayed the same or not knowing if things have changed, with any increase in the proportions thinking things have improved only very small. The most notable differences between EU15 and NMS13 are: People in EU15 are more likely than those in NMS13 to think that the national situation has worsened in relation to: o o energy affordability (69% thinking it has worsened, 4% believing it has improved, compared with 42% and 13% respectively in NMS13) housing affordability (67% thinking it has worsened, 5% that it has improved, compared with 43% and 11% respectively in NMS13) o the way public administration is run (40% thinking it has got worse, 5% that it has improved, compared with 32% and 10% respectively in NMS13) o the cost of living (76% thinking it has got worse, 4% that it has improved, compared with 67% and 5% respectively in NMS13) They are more somewhat more positive than NMS13 in relation to: o the employment situation (16% seeing improvement, 61% a worsening, compared with 7% and 56% respectively in NMS13) Nationally, the countries that stand out as having the most negative views on how the situation has changed are Greece, Spain and Cyprus, followed by Portugal and Slovenia. Respondents in Greece have the most negative views on four of the six measures: the employment situation, which 95% perceive to have deteriorated and only 1% think has got better; the cost of living (92% and 2% respectively); energy affordability (88% vs. 2%) and the way in which public administration runs (76% vs. 6%); and they hold the second most negative opinions about the economy (92% vs. 2%). Respondents in Spain have the most negative views in relation to housing affordability, around eight in ten (81%) perceiving it to have got worse, compared with only 5% thinking it has improved. They hold the second most negative opinions about the way public administration runs has deteriorated (68% and 3% respectively) and are among the five most negative countries in relation to the economy (88% vs. 3%), the employment situation (90% vs. 4%) and the cost of living (86% vs. 3%). 86
90 Respondents in Cyprus have the most negative views in relation to the economy, 95% thinking it has got worse in the last five years, compared with only 1% thinking it has improved; the second most negative opinions about the employment situation (93% vs. 1%) and energy affordability (86% vs. 3%); and the third most negative views, (alongside Slovenia), on the cost of living (89% vs. 3%). Respondents in Portugal have the third most negative views on energy affordability, eight in ten respondents (80%) thinking it has got worse in the last five years, compared with only 1% thinking it has improved; and, along with respondents in Finland, on housing affordability (72% vs. 2%); whilst those in Slovenia have the third most negative views on the economy (88% vs. 2%), the employment situation (88% vs. 1%) and, (as already noted, along with Cyprus), the cost of living (87% vs. 1%). The countries that stand out as having the most positive views on how the national situation has changed in the past five years are Malta, Denmark and Estonia, with Germany also holding particularly positive perceptions in terms of its economy and employment situation. This is consistent with the finding in Chapter II that Germany has seen a particularly strong improvement between 2009 and 2014 in perceptions of its economy and employment situation. Respondents in Malta hold the most positive views of any Member State on four of the six national indicators: the economy, where 49% think things have improved and 14% think they have got worse; energy affordability (43% and 25% respectively); the way the country runs public administration (30% vs.10%); and the cost of living, although only just over one in five (22%) think it has improved, compared with 43% who think it has worsened. Malta holds the second most positive opinions on the employment situation, with 36% perceiving the situation to have improved and 20% seeing it as having got worse; and the fourth most positive perceptions of housing affordability. Respondents in Denmark hold the third most positive opinions about things improving on three measures: the economy, where 46% say it has improved and 25% think it has got worse; employment (38% and 31% respectively); and the cost of living (6% vs. 45%). It holds the fifth most positive opinions in relation to housing affordability. Perceptions of improvements in energy affordability and the way the country runs public administration are not as positive as in some other Member States (ranked ninth on both). Estonia has the most positive opinions on housing affordability, notably better than any other Member State, with 19% thinking housing has become more affordable and 22% thinking it has worsened. It holds the second most positive perceptions on two measures: energy affordability, with 28% thinking it has improved and 13% thinking it is now less affordable; and the way public administration runs in their country (18% and 8% respectively). It holds the fourth most positive opinions on the employment situation and the fifth most positive in relation to the economy. It is far less positive about the cost of living, with only eight Member States holding more negative perceptions. 87
91 Germany (as already noted) holds the most positive opinions of any Member State on improvements to the employment situation, where 44% think it has got better and 18% that it has got worse; and the second most positive views on the economic situation (49% and 16% respectively). It holds more positive perceptions than most other countries in relation to the cost of living (ranked ninth equal) and the way public administration runs (ranked sixth) but is far less positive than most countries about improvements to energy (with only three Member States holding more negative perceptions) and housing affordability (with only five countries holding more negative opinions). In terms of other countries, the most notable findings are that: Sweden has (along with Malta) by far the least negative perceptions in relation to the cost of living, although only one in seven respondents (15%) think it has improved, 37% that it has worsened. Sweden is the only other Member State (in addition to Malta, Germany, Denmark and Estonia, as already noted) with a net positive balance of opinion on the economic situation, with 34% thinking it has improved and 28% seeing a worsening. The Czech Republic holds the second most positive opinions on housing affordability, with 30% seeing improvement and 16% a worsening. Latvia holds the third most positive views on the affordability of housing, with 12% thinking it has improved and 26% believing it has got worse. Hungary has the third most positive opinions in relation to energy affordability, with 35% seeing improvement and 28% a worsening. The only other Member State (apart from, as already noted, Malta and Estonia) showing a net positive balance of opinion on this measure is the Czech Republic. Hungary holds the third most positive opinions on improvements to the cost of living, with 13% thinking things have got better and 52% that they are worse. Luxembourg holds the third most positive opinions on improvements to the way public administration runs although, unlike Malta and Estonia, the balance of opinion is negative 9% seeing improvement and 11% a worsening. The shifts between 2013 and 2014 in perceptions of how the national situation has changed compared with five years ago do not follow as clear a pattern as on other measures, particularly in relation to any negative shifts. Most shifts are towards more positive perceptions of the national situation compared with five years ago, with any shifts towards more negative perceptions generally quite small. 88
92 The main patterns that emerge in terms of positive shifts are that Malta, Hungary and Denmark stand out as showing the most notable improvement (reflecting some of the earlier findings in relation to Malta and Denmark), followed, to a lesser extent, by the UK, Lithuania and Slovakia. Malta shows the most positive shifts of any Member State on two measures: energy affordability, with a much more marked improvement than in any other Member State - 43% think it has got better and 25% that it has got worse, compared with 6% and 68% respectively in 2013; and the cost of living, where 22% think it has got better and 43% that it has got worse (compared with 5% and 66% respectively in 2013). Along with Hungary, Malta also shows the most positive shifts on opinions about housing affordability, with 21% saying this has improved and 38% thinking it has worsened (vs. 8% and 58%); and the second most positive shift in opinions on the way public administration is run, with 30% thinking it has improved, 10% that it has deteriorated (vs. 17% and 14%). As noted above, Hungary - along with Malta - has the most positive shifts of the EU28 countries in relation to opinions on the affordability of housing 18% see an improvement and 37% a worsening, compared with 11% and 63% respectively in Hungary also shows the second most positive shift of any country in relation to energy affordability, with 35% seeing an improvement and 28% a worsening (vs. 16% and 60%); and in relation to living costs 13% seeing improvement and 52% a worsening (vs. 6% and 75%). Denmark shows the largest positive shift in opinions on two measures, with these shifts being exceptionally large compared with those in any other Member State: the economy, where 46% see improvement and 25% a worsening, compared with 13% and 66% respectively in 2013; and the employment situation, where 38% see improvement and 31% a worsening (vs. 8% and 71%). The UK shows the second largest positive shifts in opinions on both the economic situation and employment: 28% seeing improvement in the economy, 45% a worsening, compared with 7% and 77% in 2013; and 24% seeing improvement in the employment situation, 6% a worsening (vs. 45% and 71%). It shows the fourth biggest improvement of any Member State in opinions about living costs with improvements in perceptions of the running of public administration less marked than in some other countries (ranked ninth equal). The UK is far less positive than most countries about improvements to energy (with only four Member States holding more negative perceptions). Lithuania shows the third biggest positive shift of opinions on energy affordability, with 10% seeing improvement and 53% a worsening, compared with 2% and 75% respectively in Lithuania also shows more positive shifts in opinions than most Member States across the other five national measures: the fifth largest improvement in relation to the economy; equal sixth in relation to living costs (along with the Netherlands and Ireland) and the running of public administration (along with Poland); and eighth largest in relation to housing affordability, equal eighth on employment (along with Slovakia). 89
93 Slovakia shows the third largest positive shifts on two measures: living costs, 5% seeing an improvement, 65% a worsening, compared with 3% and 82% respectively in 2013; and on housing affordability, with 8% seeing an improvement and 49% a worsening (vs. 6% and 68% in 2013). Other notable positive shifts are: Nineteen Member States show shifts of more than 10 percentage points in the net positive balance of opinion about their economies, with fifteen showing increases of at least 20 percentage points. In addition to the six countries already discussed the countries which show shifts of 20 percentage points or more are: the Netherlands and Ireland (both up 35 points), the Czech Republic (+32 points), Poland (+29 points), Estonia and Latvia (each +27 points), Bulgaria (+26 points), Romania (+24 points) and Germany (+20 points) Sweden and Ireland, and to a lesser extent Estonia, Latvia and Bulgaria, in terms of opinions on the employment situation: in Sweden, 19% see improvement and 46% a worsening, compared with 8% and 69% respectively in 2013; and in Ireland 15% see improvement, 62% a worsening (vs. 3% and 82%) Poland, Bulgaria, Luxembourg, Romania and Croatia in terms of views about the affordability of energy The Netherlands in relation to the running of public administration. It shows the greatest improvement of any Member State, although the shift is away from thinking things have become worse to believing they have stayed the same, with only a very small increase in the proportion thinking public administration is run better than it was five years ago: 7% see improvement, 31% a worsening and 51% see no change, compared with 5%, 49% and 41% respectively in Finland is the only country where the balance of opinion has worsened since 2013 on the majority of these six measures, although the shifts in opinions are small. Other than this, the most notable negative shift relative to other countries can be seen in Spain in relation to energy affordability, with 4% seeing an improvement and 67% a worsening, compared with 6% and 50% respectively in Latvia is the only other Member State showing a negative shift in opinions on energy affordability. 90
94 Socio-demographic differences on these measures are less marked than in relation to respondents personal situation. Those who struggle to pay their bills most of the time have more negative views than those who almost never struggle to do so, but differences are less pronounced than in relation to their personal situation. The most pronounced differences are in relation to views on the economy and employment situation. In terms of occupation, there are no consistent patterns. The unemployed have somewhat more negative perceptions in relation to most indicators, although they are joined by other occupational groups: the retired, house persons and managers in relation to energy affordability; house persons in relation to housing affordability. House persons hold marginally more negative perceptions than the unemployed in relation to the way public administration is run. Students have somewhat more positive opinions on most indicators, joined by managers in relation to the economy. Managers have the most positive opinions on employment. Those aged are more positive than other age groups and those who left education aged 20 or older have more positive views than those leaving at an earlier age, though not markedly so. 91

95 3. SOCIAL PROTECTION AND INCLUSION The final section of this chapter focuses on Europeans views on the situation now compared with five years ago in relation to social protection and inclusion: the healthcare system, the pension system and unemployment benefits; relations in the country between people from different cultural, religious or national backgrounds; and the way inequalities and poverty are addressed 53. As was the case in 2013, the large majority of Europeans perceive the five areas of social protection and inclusion to have got worse or remained the same compared with five years ago, with few respondents perceiving them to have improved. Just under half of all Europeans (46%) think that the healthcare system in their country has got worse in the last five years. Four in ten (40%) think it has stayed the same and one in ten (10%) think it has improved. Perceptions concerning the way that inequality and poverty are addressed are similar, with almost half (46%) of Europeans thinking things have got worse, around two fifths (39%) believing it has remained unchanged and only 7% thinking things have got better. Perceptions concerning unemployment benefits are broadly similar. A slightly smaller proportion, just over two fifths of respondents (43%), think they have got worse, just over a third (35%) that they have remained the same and only 6% that they have got better. Around one in six respondents (16%) are unable to offer a view on this question. 53 Q4 Compared with five years ago, would you say things have improved, got worse or stayed about the same when it comes to.? (ONE ANSWER PER LINE) (READ OUT) The healthcare system in (OUR COUNTRY), The pension system in (OUR COUNTRY), Unemployment benefits in (OUR COUNTRY), Relations in (OUR COUNTRY) between people from different cultural or religious backgrounds or nationalities, The way inequalities and poverty are addressed in (OUR COUNTRY) Improved, Got worse, Stayed about the same, Don t know NB The statements relating to personal and national situation are also asked in this question 92
96 In relation to the pension system, the balance of opinion is more negative, with just over half of Europeans (52%) believing that it has deteriorated, a third (33%) that it has stayed the same and only 5% that it has got better. In terms of relations between people from different cultural or religious backgrounds or nationalities, the most common view (44%) is that there has been no change, but the overall balance of opinion is negative, with just under two fifths (37%) thinking things have got worse, compared with 11% who think that relations have improved. Whilst the overall picture of Europeans perceptions on these measures remains broadly similar to that presented in 2013 with most respondents still thinking that things have either got worse or have stayed the same the balance of opinion is slightly more positive than in 2013 on all five measures, most notably in relation to unemployment benefits, with 6% in 2014 thinking they have improved and 43% that they have got worse, compared with 5% and 50% respectively in The differences between EU15 and NMS13 are: People in EU15 are more likely than those in NMS13 to think that the situation has worsened in relation to: o o o o relations between people from different cultural, religious or national backgrounds (40% thinking they have worsened, 11% that they have improved, compared with 27% and 12% respectively in NMS13) the pension system (54% thinking it has worsened, 5% that it has improved, compared with 46% and 6% respectively in NMS13) the way the country addresses inequality and poverty (48% thinking it has worsened, 7% believing it has improved, compared with 39% and 7% respectively in NMS13) the healthcare system (46% thinking it has worsened, 9% that it has improved, compared with 42% and 11% respectively in NMS13) Across the EU, Malta stands out as having the most positive perceptions of change on these indicators. It is the only Member State with a net positive balance of opinion across all five social protection and inclusion indicators. Among the remaining twenty seven Member States, Estonia and Luxembourg tend to have the least negative perceptions. Malta has the most positive balance of opinion on all five measures: It has a particularly positive view on its healthcare system with half of respondents (51%) thinking the system has improved, compared with only 10% who say it has got worse. This is a considerably more positive result than for any other country. In relation to the way the country addresses inequalities and poverty, 39% think this has improved, compared with 9% who say it has got worse 93
97 In relation to the pension system, 32% think things have improved, compared with just 4% who think it is now worse In relation to unemployment benefits, 27% think they have improved, and just 4% that they have worsened And in terms of relations between people from different cultural, religious or national backgrounds, 29% think they have improved, compared with 15% who think they have got worse Estonia holds the second most positive perceptions of any country about the situation relative to five years ago in relation to the way in which inequalities and poverty are addressed, with 20% thinking they have improved and 13% thinking they have deteriorated and concerning relations between people with different cultural and religious backgrounds and nationalities (20% and 8% respectively); the third most positive views on the pension system (13% vs. 24%) and unemployment benefits (13% vs. 19%); and the fourth most positive perceptions of an improved healthcare system (21% vs. 28%). Luxembourg has the second most positive views on improvements in the areas of its healthcare system, with 11% seeing improvement and 9% a worsening, the pension system (7% and 13% respectively) and unemployment benefits (9% vs. 14%); the third most positive perceptions about the way inequalities and poverty are addressed (9% vs. 19%); and the fifth most positive views on improved relations between people with different cultural and religious backgrounds and nationalities (12% vs. 14%). By far the most strongly negative views are again found in Greece, followed by Spain, Slovenia and Portugal. Greece has the most negative perceptions on all five measures: Almost all respondents (93%) think that the pension system is worse than five years ago, compared with just 1% thinking it has improved Almost all respondents (90%) think that the healthcare system is worse, compared with only 2% who say it has improved Nearly nine in ten (88%) think that unemployment benefits are worse, compared with only 2% who say they have improved Eight in ten (82%) think that the way inequalities and poverty are tackled has got worse, with just 3% thinking it has improved More than six in ten (64%) think that relations between people with different cultural and religious backgrounds and nationalities have worsened, with only 8% seeing improvement. 94
98 Spain has particularly negative views, second only to Greece, in relation to the pension system (2% thinking they have improved, 76% that they have got worse), unemployment benefits (3% and 76% respectively) and its healthcare system (4% vs. 74%); the third most negative opinions of any Member State about improvements in the way the country addresses inequalities and poverty (5% vs. 66%); and the fifth most negative views (along with Cyprus) about improvements in relations between people with different cultural and religious backgrounds or nationalities (5% vs. 46%). Slovenia has the third most negative perceptions after Greece and Spain on its healthcare system (3% thinking it has improved, 61% that it has got worse); the fourth most negative views on the country improving the way it handles inequalities and poverty (3% and 63% respectively) and on relations between people with different cultural and religious backgrounds or nationalities (3% vs. 49%); and the fifth most negative views on the pension system (1% vs. 68%) and unemployment benefits (2% vs. 61%). Portugal has the second most negative views about improvements in the way inequalities and poverty are addressed (3% thinking this has got better and 68% thinking this has got worse); the third most negative views in relation to unemployment benefits (1% and 72% respectively) and the pension system (2% vs. 73%); and is the fifth most pessimistic Member State about improvement to its healthcare system (5% vs. 59%). It is less negative than some other countries about improvements in relations between people with different cultural and religious backgrounds or nationalities (ranked twentieth). The shifts in perceptions between 2013 and 2014 of how areas relating to social protection and inclusion have changed compared with five years ago do not follow as clear a pattern as on other measures, reflecting the earlier findings in relation to shifts in perceptions of how the national situation compared with five years ago. Most shifts in opinions on how areas of social protection and inclusion have changed compared with five years ago are towards more positive perceptions, although shifts are for the most part relatively small compared with those seen on some other measures. Poland is among the countries with the largest positive shifts across all five measures, whilst Hungary and Ireland are among those with the largest positive shifts on the majority of the measures. The balance of opinion in Poland has improved more than any other Member State in relation to the way the country addresses inequality and poverty, with 9% thinking it has improved and 32% that it has got worse, compared with 5% and 41% respectively in Poland shows the second largest improvement on unemployment benefits, 6% seeing improvement and 34% a worsening (vs. 3% and 45%); the third largest improvement on perceptions of its healthcare system, 10% seeing improvement and 40% a worsening (vs. 5% and 47%) and on relations between people with different cultural and religious backgrounds or nationalities, 16% seeing improvement and 20% a worsening (vs. 12% and 24%); and the fifth largest improvement (along with Ireland) in relation to opinions about its pension system. 95
99 Hungary shows the largest improvement of any Member State in relation to unemployment benefits, where 7% say they have got better and 49% believe they are worse (vs. 5% and 68%); and (along with the Czech Republic) on perceptions of its healthcare system, where 11% believe it has improved and 41% that it has got worse (vs.9% and 52%). It shows the fourth largest improvement (along with the UK, Italy, Denmark and Cyprus) on relations between people with different cultural and religious backgrounds or nationalities. Ireland shows the second largest improvement in relation to the way the country addresses inequalities and poverty, where 12% see improvement and 37% a deterioration (vs. 7% and 43%); the third largest improvement in perceptions of unemployment benefits, where 10% say they have got better and 49% believe they are worse (vs. 6% and 58%); and the fifth largest improvement (as already noted, along with Poland) on opinions about pension benefits. Any negative shifts are, for the most part, small. There are no Member States where the balance of opinion has deteriorated across all five indicators. The only notable negative shift is noted in Cyprus in relation to perceptions of the healthcare system, with 8% thinking it has improved and 63% that it has deteriorated, compared with 11% and 46% respectively in Socio-demographic differences on these measures are broadly similar to those noted in relation to the national situation. Those who struggle to pay their bills most of the time have more negative views than those who almost never struggle to do so. In terms of occupation, students have the least negative perceptions, whilst the unemployed have somewhat more negative perceptions than other groups, joined by house persons on all but one indicator which is, not surprisingly, unemployment benefits. Those aged are more positive than other age groups and those who left education aged 20 or older have slightly more positive views than those leaving at an earlier age. 96
100 GENERAL CONCLUSIONS The Social Climate survey, conducted for DG Employment, Social Affairs & Inclusion for the sixth time, provides an overview of the social climate in the European Union. It measures the nature of the current situation regarding key social concerns of EU citizens, their expectations for the coming twelve months and their evaluations of how things have changed compared with six years ago. The survey explores three broad components of the social climate: Europeans perceptions on different aspects of their personal lives, their opinions of the general situation in their country, and their view of the state of social protection and inclusion. The survey enables analysis of how the public mood varies between the 28 Member States within the EU and between different socio-demographic groups across the EU, and monitors how public opinion and perceptions change over time. The first in this series of surveys was conducted in June 2009, eight months after the financial and economic crisis within Europe began, and the survey has been undertaken each June since then, enabling the passage of EU citizens through the turbulent period that has followed the Autumn 2008 crisis to be charted on an annual basis. The latest wave of the survey, in June 2014, was conducted against a backdrop of continued economic recovery, first seen in the second quarter of There has been GDP growth across the last four consecutive quarters (Q Q1 2014) across Europe as a whole and, albeit to a lesser extent, in the Euro area. That said, the growth in GDP is modest and some Member States are recovering more strongly than others. Whilst unemployment levels have declined in the EU28 since March 2013, high unemployment levels and a youth unemployment crisis remain a serious challenge for some Member States. Europe is in the early stages of economic recovery, but wage growth is low, with many people not seeing increases in their wages or improvements in their living standards. Austerity measures are still in place, and planned for quite some time ahead, and governments continue to spend less on public services. Against this mixed background, the overall 2014 EU social climate, which summarises Europeans views across the three areas of personal circumstance, the national picture and social protection and inclusion, has declined, albeit marginally, from -0.9 in 2013 to -1 in The index is now at a low point in the six year series, with indices of -0.7 recorded in 2009 and 2010, -0.6 in 2011 and -0.8 in Nonetheless, the index, based on a scale from +10 to -10, still presents Europeans as a whole as being divided in their evaluation of the current situation. However, the overall picture masks very substantial differences between the evaluations of citizens in the different Member States, and also between the perceptions of respondents in different socio-demographic groupings. 97
101 At a national level the social climate index ranges from a high of 3.1 (in Malta) to a low of -5.3 (in Greece). Aside from Malta, the most positive perceptions are found in the Benelux and Nordic countries, along with Austria, Germany, the UK and Estonia, and the least positive among southern and eastern Member States. This pattern is generally consistent with the earlier surveys in the series, with the exception that Malta, where the overall index has increased by 2.1 points from 1 in 2013, now heads the league table of EU countries on the overall social climate index, having overtaken eight countries since Malta apart, country-level shifts in the social climate index since 2013 are relatively small. Among the thirteen Member States that show an improvement in their social climate index since 2013, it is notable that the country with the second largest positive shift is Portugal (up by 0.8 points); and that Spain shows the fifth largest improvement (up by 0.5 points) both countries that have faced some of the most difficult economic times but are now starting to show some signs of recovery. Furthermore, among the fourteen Member States showing a decline in their social climate index since 2013, the largest deteriorations can be observed in Sweden and Belgium (both down 0.5 points) both countries with a top ten ranking and among those who have faced less profound challenges to their economies than some southern European Member States. This illustrates that the consequences of an economic climate that continues to remain tough are not just being experienced by those who were hit worst in the economic crisis. In terms of socio-demographics there are also wide disparities between groupings, most notably in relation to how difficult respondents say they are finding it to pay their household bills. Thus, those who say that they almost never find it difficult to pay their bills have a positive index in 2014 of 0.2, compared with an index of -2.2 for those who struggle most of the time, and -4.1 for those who almost always have difficulty paying household bills. Since 2013 there has been a very slight improvement in the index among those who almost always struggle with their bills (up by 0.1 point) but a slight worsening among those who almost never struggle (down by 0.1 point), and those who struggle from time to time (down by 0.2 points). The indices for these two groups are now at their lowest levels in the six year series. Similarly, in terms of employment status, there are marked differences between the perceptions of the unemployed, who have an overall social climate index of -3.3 in 2014, slightly lower than the level of -3.1 in 2013, and those in managerial jobs, who have the highest index (0.6), down from 0.8 in 2013, and who are the only occupational group with a positive score in As in the five previous surveys, Europeans assess their personal situation positively on balance, especially in relation to the area in which they live and their life in general, somewhat less so in terms of their job situation and the financial situation of their household. Perceptions are broadly similar to those recorded in 2013, with a small increase in the index for local area, small decreases in relation to life in general and household financial situation and no change for personal job situation. In contrast, the balance of opinion on most of the social protection and national indicators is negative. In relation to social protection, there is a positive balance of opinion on the healthcare system and a divided view on relations between people from different cultural and religious backgrounds or nationalities, but a negative balance of 98
102 opinion on the three other areas covered by the survey, with Europeans particularly negative about the way in which inequalities and poverty are addressed in their country. With the exception of unemployment benefits (up by 0.2 points), there have been small declines in the index across these measures since 2013, the largest (down by 0.6 points) concerning the way in which inequalities and poverty are addressed. Europeans are particularly critical in their assessment of the six national indicators, all of which attract a negative balance of opinion. Indeed, the indices for five of the six measures (the employment situation, the affordability of housing, the cost of living, the national economy and the affordability of energy) are among the six lowest of the fifteen areas measured in the survey (the other being the way in which inequalities and poverty are addressed), whilst the index for public administration is equal seventh lowest (together with the pension system). That said, there have been some interesting shifts in perceptions of the national situation since In particular Europeans are now more positive about the economic situation (with the index up by 0.9 points). Looking to the future, the majority of Europeans do not expect their personal circumstances to change in the next twelve months. However, those who do expect their personal situation to change are a little more likely to think things will improve than that they will get worse. In this respect Europeans are somewhat more optimistic than they were at the same point in Europeans also expect little change in the areas of social protection and inclusion, although their views are again slightly more optimistic than in Perhaps surprisingly, given that Europeans views on the economy have improved since 2013, many remain pessimistic about what will happen in relation to economic measures in their country in the next twelve months. Around two in five think that the cost of living will increase and similar proportions that energy and housing will become less affordable. However, fewer (around one in four) expect the economy and employment situation to worsen and almost as many expect them to improve. Moreover, Europeans are again more optimistic now than they were in 2013, with declines in the proportions thinking things will get worse across all six national measures, and increases in the proportions thinking things will get better, most notably in relation to the economy, the employment situation and the cost of living. The results on what Europeans expect to happen across the 15 indicators in the next 12 months reveal some interesting findings at Member State level, with some consistent optimism about the future in Malta, Sweden and Estonia and a more positive outlook in Cyprus, Portugal and Slovenia relative to The social climate index for Cyprus remains unchanged since 2013, the first time there has been a halt in its decline since 2009, although it remains at its lowest level in the series. In Portugal the optimism is reflected in an improvement in its social climate index (as already noted, up by 0.8 points). Expectations of the short-term future have not really worsened notably anywhere in Europe Austria and Finland show the most consistently more negative outlook, but shifts in opinion since 2013 are small. 99
103 Overall, the findings in 2014 suggest that, whilst Europeans appear to recognise the economic recovery that is taking place, there is little evidence as yet that they are feeling the benefits of the recovery at a personal or family level. There is also some indication that they are seeing the effects of cutbacks on public service spending on the provision of social protection. In this sense the survey findings do appear to provide an accurate reflection of the macro-economic trends over the period since the last survey in However, there are some signs of optimism albeit somewhat weak signs that economic improvement will continue and that the benefits of this improvement will start to filter through more directly to individuals and their families in Europe in the coming period. 100
104 ANNEXES
105 TECHNICAL SPECIFICATIONS
106 SPECIAL EUROBAROMETER 418 Social climate TECHNICAL SPECIFICATIONS Between the 14 th and the 26 th of June 2014, TNS opinion & social, a consortium created between TNS political & social, TNS UK and TNS opinion, carried out the wave 81.5 of the EUROBAROMETER survey, on request of the EUROPEAN COMMISSION, Directorate-General for Communication, Strategy, Corporate Communication Actions and Eurobarometer unit. The special Eurobarometer survey 418 is part of the wave 81.5 and covers the population of the respective nationalities of the European Union Member States, resident in each of the Member States and aged 15 years and over. The basic sample design applied in all states is a multi-stage, random (probability) one. In each country, a number of sampling points was drawn with probability proportional to population size (for a total coverage of the country) and to population density. In order to do so, the sampling points were drawn systematically from each of the "administrative regional units", after stratification by individual unit and type of area. They thus represent the whole territory of the countries surveyed according to the EUROSTAT NUTS II (or equivalent) and according to the distribution of the resident population of the respective nationalities in terms of metropolitan, urban and rural areas. In each of the selected sampling points, a starting address was drawn, at random. Further addresses (every Nth address) were selected by standard "random route" procedures, from the initial address. In each household, the respondent was drawn, at random (following the "closest birthday rule"). All interviews were conducted face-to-face in people's homes and in the appropriate national language. As far as the data capture is concerned, CAPI (Computer Assisted Personal Interview) was used in those countries where this technique was available. For each country a comparison between the sample and the universe was carried out. The Universe description was derived from Eurostat population data or from national statistics offices. For all countries surveyed, a national weighting procedure, using marginal and intercellular weighting, was carried out based on this Universe description. In all countries, gender, age, region and size of locality were introduced in the iteration procedure. For international weighting (i.e. EU averages), TNS Opinion & Social applies the official population figures as provided by EUROSTAT or national statistic offices. The total population figures for input in this post-weighting procedure are listed below. TS1
107 Readers are reminded that survey results are estimations, the accuracy of which, everything being equal, rests upon the sample size and upon the observed percentage. With samples of about 1,000 interviews, the real percentages vary within the following confidence limits: Statistical Margins due to the sampling process (at the 95% level of confidence) various sample sizes are in rows various observed results are in columns 5% 10% 15% 20% 25% 30% 35% 40% 45% 50% 95% 90% 85% 80% 75% 70% 65% 60% 55% 50% N=50 6,0 8,3 9,9 11,1 12,0 12,7 13,2 13,6 13,8 13,9 N=50 N=500 1,9 2,6 3,1 3,5 3,8 4,0 4,2 4,3 4,4 4,4 N=500 N=1000 1,4 1,9 2,2 2,5 2,7 2,8 3,0 3,0 3,1 3,1 N=1000 N=1500 1,1 1,5 1,8 2,0 2,2 2,3 2,4 2,5 2,5 2,5 N=1500 N=2000 1,0 1,3 1,6 1,8 1,9 2,0 2,1 2,1 2,2 2,2 N=2000 N=3000 0,8 1,1 1,3 1,4 1,5 1,6 1,7 1,8 1,8 1,8 N=3000 N=4000 0,7 0,9 1,1 1,2 1,3 1,4 1,5 1,5 1,5 1,5 N=4000 N=5000 0,6 0,8 1,0 1,1 1,2 1,3 1,3 1,4 1,4 1,4 N=5000 N=6000 0,6 0,8 0,9 1,0 1,1 1,2 1,2 1,2 1,3 1,3 N=6000 N=7000 0,5 0,7 0,8 0,9 1,0 1,1 1,1 1,1 1,2 1,2 N=7000 N=7500 0,5 0,7 0,8 0,9 1,0 1,0 1,1 1,1 1,1 1,1 N=7500 N=8000 0,5 0,7 0,8 0,9 0,9 1,0 1,0 1,1 1,1 1,1 N=8000 N=9000 0,5 0,6 0,7 0,8 0,9 0,9 1,0 1,0 1,0 1,0 N=9000 N= ,4 0,6 0,7 0,8 0,8 0,9 0,9 1,0 1,0 1,0 N=10000 N= ,4 0,6 0,7 0,7 0,8 0,9 0,9 0,9 0,9 0,9 N=11000 N= ,4 0,5 0,6 0,7 0,8 0,8 0,9 0,9 0,9 0,9 N=12000 N= ,4 0,5 0,6 0,7 0,7 0,8 0,8 0,8 0,9 0,9 N=13000 N= ,4 0,5 0,6 0,7 0,7 0,8 0,8 0,8 0,8 0,8 N=14000 N= ,3 0,5 0,6 0,6 0,7 0,7 0,8 0,8 0,8 0,8 N= % 10% 15% 20% 25% 30% 35% 40% 45% 50% 95% 90% 85% 80% 75% 70% 65% 60% 55% 50% TS2
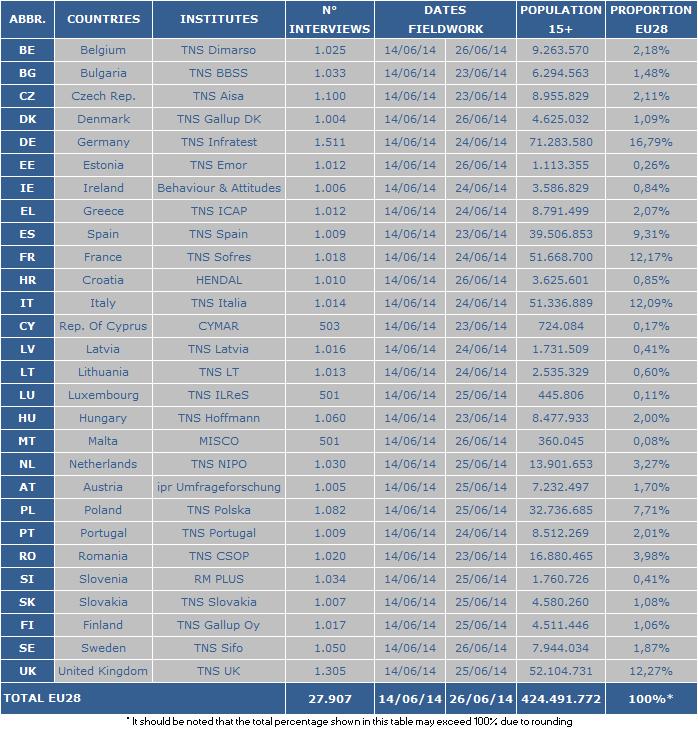
108 TS3
Flash Eurobarometer 398 WORKING CONDITIONS REPORT
 Flash Eurobarometer WORKING CONDITIONS REPORT Fieldwork: April 2014 Publication: April 2014 This survey has been requested by the European Commission, Directorate-General for Employment, Social Affairs
PUBLIC PERCEPTIONS OF VAT
 Special Eurobarometer 424 PUBLIC PERCEPTIONS OF VAT REPORT Fieldwork: October 2014 Publication: March 2015 This survey has been requested by the European Commission, Directorate-General for Taxations and
Flash Eurobarometer 408 EUROPEAN YOUTH REPORT
 Flash Eurobarometer EUROPEAN YOUTH REPORT Fieldwork: December 2014 Publication: April 2015 This survey has been requested by the European Commission, Directorate-General for Education and Culture and co-ordinated
Flash Eurobarometer 458. Report. The euro area
 The euro area Survey requested by the European Commission, Directorate-General for Economic and Financial Affairs and co-ordinated by the Directorate-General for Communication This document does not represent
Flash Eurobarometer 470. Report. Work-life balance
 Work-life balance Survey requested by the European Commission, Directorate-General for Justice and Consumers and co-ordinated by the Directorate-General for Communication This document does not represent
Flash Eurobarometer 441. Report. European SMEs and the Circular Economy
 European SMEs and the Circular Economy Survey requested by the European Commission, Directorate-General Environment and co-ordinated by the Directorate-General for Communication This document does not
Standard Eurobarometer 83 Spring 2015 THE EU BUDGET REPORT
 Standard Eurobarometer 83 Spring 2015 THE EU BUDGET REPORT Fieldwork: May 2015 This survey has been requested and co-ordinated by the European Commission, Directorate-General for Communication. http://ec.europa.eu/public_opinion/index_en.htm
Flash Eurobarometer 458. The euro area
 The euro area Survey requested by the European Commission, Directorate-General for Economic and Financial Affairs and co-ordinated by the Directorate-General for Communication This document does not represent
January 2010 Euro area unemployment rate at 9.9% EU27 at 9.5%
 STAT//29 1 March 20 January 20 Euro area unemployment rate at 9.9% EU27 at 9.5% The euro area 1 (EA16) seasonally-adjusted 2 unemployment rate 3 was 9.9% in January 20, the same as in December 2009 4.
October 2010 Euro area unemployment rate at 10.1% EU27 at 9.6%
 STAT//180 30 November 20 October 20 Euro area unemployment rate at.1% EU27 at 9.6% The euro area 1 (EA16) seasonally-adjusted 2 unemployment rate 3 was.1% in October 20, compared with.0% in September 4.
Special Eurobarometer 459. Report. Climate change
 Climate change Survey requested by the European Commission, Directorate-General for Climate Action and co-ordinated by the Directorate- General for Communication This document does not represent the point
SOLIDARITY THAT SPANS THE GLOBE: EUROPEANS AND DEVELOPMENT AID
 Special Eurobarometer 392 SOLIDARITY THAT SPANS THE GLOBE: EUROPEANS AND DEVELOPMENT AID REPORT Fieldwork: June 2012 Publication: October 2012 This survey has been requested by Directorate-General Development
Social climate. Fieldwork May-June 2009 Publication January 2010
 Special Eurobarometer European Commission Social climate Full report Fieldwork May-June 2009 Publication January 2010 Special Eurobarometer 315 / Wave - European Opinion Research Group EEIG This survey
Flash Eurobarometer N o 189a EU communication and the citizens. Analytical Report. Fieldwork: April 2008 Report: May 2008
 Gallup Flash Eurobarometer N o 189a EU communication and the citizens Flash Eurobarometer European Commission Expectations of European citizens regarding the social reality in 20 years time Analytical
Social Protection and Social Inclusion in Europe Key facts and figures
 MEMO/08/625 Brussels, 16 October 2008 Social Protection and Social Inclusion in Europe Key facts and figures What is the report and what are the main highlights? The European Commission today published
Standard Eurobarometer
 Standard Eurobarometer 67 / Spring 2007 Standard Eurobarometer European Commission SPECIAL EUROBAROMETER EUROPEANS KNOWELEDGE ON ECONOMICAL INDICATORS 1 1 This preliminary analysis is done by Antonis PAPACOSTAS
Flash Eurobarometer 386 THE EURO AREA REPORT
 Eurobarometer THE EURO AREA REPORT Fieldwork: October 2013 Publication: November 2013 This survey has been requested by the European Commission, Directorate-General for Economic and Financial Affairs and
Fieldwork February March 2008 Publication October 2008
 Special Eurobarometer 298 European Commission Consumer protection in the internal market Fieldwork February March 2008 Publication October 2008 Report Special Eurobarometer 298 / Wave 69.1 TNS Opinion
Employment and Social Policy
 Special Eurobarometer 377 European Commission Employment and Social Policy REPORT Special Eurobarometer 377 / Wave TNS opinion & social Fieldwork: September October 2011 Publication: December 2011 This
Two years to go to the 2014 European elections European Parliament Eurobarometer (EB/EP 77.4)
") Directorate-General for Communication PUBLIC OPINION MONITORING UNIT Brussels, 23 October 2012. Two years to go to the 2014 European elections European Parliament Eurobarometer (EB/EP 77.4) FOCUS ON THE
Directorate-General for Communication PUBLIC OPINION MONITORING UNIT Brussels, 23 October 2012. Two years to go to the 2014 European elections European Parliament Eurobarometer (EB/EP 77.4) FOCUS ON THE
Europeans attitudes towards the issue of sustainable consumption and production. Analytical report
 Flash Eurobarometer 256 The Gallup Organisation Analytical Report Flash EB N o 251 Public attitudes and perceptions in the euro area Flash Eurobarometer European Commission Europeans attitudes towards
of the European Commission. Communication. This document of the authors. Standard Eurobarometer 75 / Spring 2011 TNS opinion & social
 Standard Eurobarometer European Commission EUROBAROMETER 75 SPRING 2011 Europeans and the European Union budget REPORT Standard Eurobarometer 75 / Spring 2011 TNS opinion & social Fieldwork: May 2011 Publication:
Active Ageing. Fieldwork: September November Publication: January 2012
 Special Eurobarometer 378 Active Ageing SUMMARY Special Eurobarometer 378 / Wave EB76.2 TNS opinion & social Fieldwork: September November 2011 Publication: January 2012 This survey has been requested
NOTE ON EU27 CHILD POVERTY RATES
 NOTE ON EU7 CHILD POVERTY RATES Research note prepared for Child Poverty Action Group Authors: H. Xavier Jara and Chrysa Leventi Institute for Social and Economic Research (ISER) University of Essex The
PROGRESS TOWARDS THE LISBON OBJECTIVES 2010 IN EDUCATION AND TRAINING
 PROGRESS TOWARDS THE LISBON OBJECTIVES IN EDUCATION AND TRAINING In 7, reaching the benchmarks for continues to pose a serious challenge for education and training systems in Europe, except for the goal
Europeans knowledge of economic indicators
 Special Eurobarometer 323 European Commission Europeans knowledge of economic indicators Fieldwork: August - September 2009 Publication: January 2010 Special Eurobarometer 323 / Wave 72.1 TNS Opinion &
Growth, competitiveness and jobs: priorities for the European Semester 2013 Presentation of J.M. Barroso,
 Growth, competitiveness and jobs: priorities for the European Semester 213 Presentation of J.M. Barroso, President of the European Commission, to the European Council of 14-1 March 213 Economic recovery
Gender pension gap economic perspective
 Gender pension gap economic perspective Agnieszka Chłoń-Domińczak Institute of Statistics and Demography SGH Part of this research was supported by European Commission 7th Framework Programme project "Employment
PROGRESS TOWARDS THE LISBON OBJECTIVES 2010 IN EDUCATION AND TRAINING
 PROGRESS TOWARDS THE LISBON OBJECTIVES IN EDUCATION AND TRAINING In, reaching the benchmarks for continues to pose a serious challenge for education and training systems in Europe, except for the goal
Parlemeter - November 2012 European Parliament Eurobarometer (EB/EP 78.2)
") Directorate-General for Communication Public Opinion Monitoring Unit Parlemeter - November European Parliament Eurobarometer (EB/EP 78.2) ANALYTICAL SYNTHESIS Brussels, 14 February 2013. Coverage: Population:
Directorate-General for Communication Public Opinion Monitoring Unit Parlemeter - November European Parliament Eurobarometer (EB/EP 78.2) ANALYTICAL SYNTHESIS Brussels, 14 February 2013. Coverage: Population:
Themes Income and wages in Europe Wages, productivity and the wage share Working poverty and minimum wage The gender pay gap
 5. W A G E D E V E L O P M E N T S At the ETUC Congress in Seville in 27, wage developments in Europe were among the most debated issues. One of the key problems highlighted in this respect was the need
DATA SET ON INVESTMENT FUNDS (IVF) Naming Conventions
 Naming Conventions") DIRECTORATE GENERAL STATISTICS LAST UPDATE: 10 APRIL 2013 DIVISION MONETARY & FINANCIAL STATISTICS ECB-UNRESTRICTED DATA SET ON INVESTMENT FUNDS (IVF) Naming Conventions The series keys related to Investment
DIRECTORATE GENERAL STATISTICS LAST UPDATE: 10 APRIL 2013 DIVISION MONETARY & FINANCIAL STATISTICS ECB-UNRESTRICTED DATA SET ON INVESTMENT FUNDS (IVF) Naming Conventions The series keys related to Investment
Taxation trends in the European Union EU27 tax ratio at 39.8% of GDP in 2007 Steady decline in top personal and corporate income tax rates since 2000
 DG TAXUD STAT/09/92 22 June 2009 Taxation trends in the European Union EU27 tax ratio at 39.8% of GDP in 2007 Steady decline in top personal and corporate income tax rates since 2000 The overall tax-to-gdp
Securing sustainable and adequate social protection in the EU
 Securing sustainable and adequate social protection in the EU Session on Social Protection & Security IFA 12th Global Conference on Ageing 11 June 2014, HICC Hyderabad India Dr Lieve Fransen European Commission
Europeans and the Common Agricultural Policy
 Special Eurobarometer European Commission Europeans and the Common Agricultural Policy Fieldwork October - November 2005 Publication January 2006 Special Eurobarometer 242 / Wave 64.2 - TNS Opinion & Social
Eco-label Flower week 2006
 Special Eurobarometer European Commission Eco-label Flower week 2006 Fieldwork: November-December 2006 Publication: January 2007 Special Eurobarometer 275 / Wave 66.3 TNS Opinion & Social This survey was
COMMISSION STAFF WORKING DOCUMENT Accompanying the document
 EUROPEAN COMMISSION Brussels, 9.10.2017 SWD(2017) 330 final PART 13/13 COMMISSION STAFF WORKING DOCUMENT Accompanying the document REPORT FROM THE COMMISSION TO THE EUROPEAN PARLIAMENT, THE COUNCIL, THE
STAT/14/64 23 April 2014
 STAT/14/64 23 April 2014 Provision of deficit and debt data for 2013 - first notification Euro area and EU28 government deficit at 3.0% and 3.3% of GDP respectively Government debt at 92.6% and 87.1% In
New Europeans. Fieldwork : March 2010 April 2010 Publication: April 2011
 Special Eurobarometer European Commission New Europeans Report Fieldwork : March 2010 April 2010 Publication: April 2011 Special Eurobarometer 346 / Wave TNS Opinion & Social This survey was requested
Fieldwork November - December 2009 Publication June 2010
 Special Eurobarometer 337 European Commission Geographical and labour market mobility Report Fieldwork November - December 2009 Publication June 2010 Special Eurobarometer 337 / Wave TNS Opinion & Social
Overview of Eurofound surveys
 Overview of Eurofound surveys Dublin 21 st October 2010 Maija Lyly-Yrjänäinen Eurofound data European Working Conditions Survey 91, 95, 00, 05, 10 European Quality of Life Survey 03, 07, 09, 10 (EB), 11
Country Health Profiles
 State of Health in the EU Country Health Profiles Brussels, November 2017 1 The Country Health Profiles 1. Highlights 2. Health status 3. Risk Factors 4. Health System (description) 5. Performance of Health
Attitudes of Europeans Towards Tourism REPORT
 Flash Eurobarometer Attitudes of Europeans Towards Tourism REPORT Fieldwork: January 22 Publication: March 22 This survey has been requested by the Directorate-General Enterprise and co-ordinated by Directorate-
Eurofound in-house paper: Part-time work in Europe Companies and workers perspective
 Eurofound in-house paper: Part-time work in Europe Companies and workers perspective Presented by: Eszter Sandor Research Officer, Surveys and Trends 26/03/2010 1 Objectives Examine the patterns of part-time
Fiscal sustainability challenges in Romania
 Preliminary Draft For discussion only Fiscal sustainability challenges in Romania Bucharest, May 10, 2011 Ionut Dumitru Anca Paliu Agenda 1. Main fiscal sustainability challenges 2. Tax collection issues
Safer Internet. Fieldwork Dec Jan 2006 Publication May 2006
 Special Eurobarometer European Commission Safer Internet Fieldwork Dec 2005 - Jan 2006 Publication May 2006 Special Eurobarometer 250 / Wave 64.4 TNS Opinion & Social This survey was requested by Directorate
EBA REPORT ON HIGH EARNERS
 EBA REPORT ON HIGH EARNERS DATA AS OF END 2017 LONDON - 11/03/2019 1 Data on high earners List of figures 3 Executive summary 4 1. Data on high earners 6 1.1 Background 6 1.2 Data collected on high earners
Fieldwork February March 2008 Publication June 2008
 Special Eurobarometer 297 European Commission Attitudes towards radioactive waste Fieldwork February March 2008 Publication June 2008 Report Special Eurobarometer 297 / Wave 69.1 TNS Opinion & Social This
EUROBAROMETER 71. Fieldwork: June - July 2009 Publication: January 2010
 EUROBAROMETER 66 Standard Eurobarometer Report European Commission EUROBAROMETER 71 Future of Europe Fieldwork: June - July 2009 Publication: January 2010 Standard Eurobarometer 71/ Spring 2009 - TNS Opinion
HOW RECESSION REFLECTS IN THE LABOUR MARKET INDICATORS
 REPUBLIC OF SLOVENIA HOW RECESSION REFLECTS IN THE LABOUR MARKET INDICATORS Matej Divjak, Irena Svetin, Darjan Petek, Miran Žavbi, Nuška Brnot ??? What is recession?? Why in Europe???? Why in Slovenia?
H Marie Skłodowska-Curie Actions (MSCA)
") H2020 Key facts and figures (2014-2020) Number of IE researchers funded by MSCA: EU budget awarded to IE organisations (EUR million): Number of IE organisations in MSCA: 253 116,04 116 In detail, the number
H2020 Key facts and figures (2014-2020) Number of IE researchers funded by MSCA: EU budget awarded to IE organisations (EUR million): Number of IE organisations in MSCA: 253 116,04 116 In detail, the number
Employment of older workers Research Note no. 5/2015
 Research Note no. 5/2015 E. Őzdemir, T. Ward M. Fuchs, S. Ilinca, O. Lelkes, R. Rodrigues, E. Zolyomi February - 2016 EUROPEAN COMMISSION Directorate-General for Employment, Social Affairs and Inclusion
Europeans attitudes towards climate change. Report. Special Eurobarometer 300. Fieldwork March April 2008 Publication September 2008
 Special Eurobarometer 300 EUROPEAN PARLIAMENT European Commission Europeans attitudes towards climate change Fieldwork March April 2008 Publication September 2008 Report Special Eurobarometer 300 / Wave
H Marie Skłodowska-Curie Actions (MSCA)
") H2020 Key facts and figures (2014-2020) Number of BE researchers funded by MSCA: EU budget awarded to BE organisations (EUR million): Number of BE organisations in MSCA: 274 161,04 227 In detail, the number
H2020 Key facts and figures (2014-2020) Number of BE researchers funded by MSCA: EU budget awarded to BE organisations (EUR million): Number of BE organisations in MSCA: 274 161,04 227 In detail, the number
2 ENERGY EFFICIENCY 2030 targets: time for action
 ENERGY EFFICIENCY 2030 targets: time for action The Coalition for Energy Savings The Coalition for Energy Savings strives to make energy efficiency and savings the first consideration of energy policies
Investment in Ireland and the EU
 Investment in and the EU Debora Revoltella Director Economics Department Dublin April 10, 2017 20/04/2017 1 Real investment: IE v EU country groupings Real investment (2008 = 100) 180 160 140 120 100 80
FIRST REPORT COSTS AND PAST PERFORMANCE
 FIRST REPORT COSTS AND PAST PERFORMANCE DECEMBER 2018 https://eiopa.europa.eu/ PDF ISBN 978-92-9473-131-9 ISSN 2599-8862 doi: 10.2854/480813 EI-AM-18-001-EN-N EIOPA, 2018 Reproduction is authorised provided
H Marie Skłodowska-Curie Actions (MSCA)
") H2020 Key facts and figures (2014-2020) Number of NL researchers funded by MSCA: EU budget awarded to NL organisations (EUR million): Number of NL organisations in MSCA: 427 268.91 351 In detail, the number
H2020 Key facts and figures (2014-2020) Number of NL researchers funded by MSCA: EU budget awarded to NL organisations (EUR million): Number of NL organisations in MSCA: 427 268.91 351 In detail, the number
Traffic Safety Basic Facts Main Figures. Traffic Safety Basic Facts Traffic Safety. Motorways Basic Facts 2015.
 Traffic Safety Basic Facts 2013 - Main Figures Traffic Safety Basic Facts 2015 Traffic Safety Motorways Basic Facts 2015 Motorways General Almost 30.000 people were killed in road accidents on motorways
European Employment and Social Policy
 Special Eurobarometer European Commission European Employment and Social Policy Report Fieldwork : May 2009 June 2009 Publication: September 2009 Special Eurobarometer 316 / Wave 71.2 TNS Opinion & Social
H Marie Skłodowska-Curie Actions (MSCA)
") H2020 Key facts and figures (2014-2020) Number of FR researchers funded by MSCA: EU budget awarded to FR organisations (EUR million): Number of FR organisations in MSCA: 1 072 311.72 479 In detail, the
H2020 Key facts and figures (2014-2020) Number of FR researchers funded by MSCA: EU budget awarded to FR organisations (EUR million): Number of FR organisations in MSCA: 1 072 311.72 479 In detail, the
COUNCIL OF THE EUROPEAN UNION. Brussels, 13 June /1/13 REV 1 SOC 409 ECOFIN 444 EDUC 190
 COUNCIL OF THE EUROPEAN UNION Brussels, 13 June 2013 10373/1/13 REV 1 SOC 409 ECOFIN 444 EDUC 190 COVER NOTE from: to: Subject: The Employment Committee Permanent Representatives Committee (Part I) / Council
H Marie Skłodowska-Curie Actions (MSCA)
") H2020 Key facts and figures (2014-2020) Number of FI researchers funded by MSCA: EU budget awarded to FI organisations (EUR million): Number of FI organisations in MSCA: 155 47.93 89 In detail, the number
H2020 Key facts and figures (2014-2020) Number of FI researchers funded by MSCA: EU budget awarded to FI organisations (EUR million): Number of FI organisations in MSCA: 155 47.93 89 In detail, the number
STAT/14/ October 2014
 STAT/14/158-21 October 2014 Provision of deficit and debt data for 2013 - second notification Euro area and EU28 government deficit at 2.9% and 3.2% of GDP respectively Government debt at 90.9% and 85.4%
H Marie Skłodowska-Curie Actions (MSCA)
") H2020 Key facts and figures (2014-2020) Number of PT researchers funded by MSCA: EU budget awarded to PT organisations (EUR million): Number of PT organisations in MSCA: 716 66,67 165 In detail, the number
H2020 Key facts and figures (2014-2020) Number of PT researchers funded by MSCA: EU budget awarded to PT organisations (EUR million): Number of PT organisations in MSCA: 716 66,67 165 In detail, the number
EUROSTAT SUPPLEMENTARY TABLE FOR REPORTING GOVERNMENT INTERVENTIONS TO SUPPORT FINANCIAL INSTITUTIONS
 EUROPEAN COMMISSION EUROSTAT Directorate D: Government Finance Statistics (GFS) and Quality Unit D1: Excessive deficit procedure and methodology Unit D2: Excessive deficit procedure (EDP) 1 Unit D3: Excessive
Issues Paper. 29 February 2012
 29 February 212 Issues Paper In the context of the European semester, the March European Council gives, on the basis of the Commission's Annual Growth Survey, guidance to Member States for the Stability
European Commission. Statistical Annex of Alert Mechanism Report 2017
 European Commission Statistical Annex of Alert Mechanism Report 2017 COMMISSION STAFF WORKING DOCUMENT STATISTICAL ANNEX Accompanying the document REPORT FROM THE COMMISSION TO THE EUROPEAN PARLIAMENT,
Investment in France and the EU
 Investment in and the EU Natacha Valla March 2017 22/02/2017 1 Change relative to 2008Q1 % of GDP Slow recovery of investment, and with strong heterogeneity Overall Europe s recovery in investment is slow,
H Marie Skłodowska-Curie Actions (MSCA)
") H2020 Key facts and figures (2014-2020) Number of SE researchers funded by MSCA: EU budget awarded to SE organisations (EUR million): Number of SE organisations in MSCA: 138 114.71 150 In detail, the number
H2020 Key facts and figures (2014-2020) Number of SE researchers funded by MSCA: EU budget awarded to SE organisations (EUR million): Number of SE organisations in MSCA: 138 114.71 150 In detail, the number
May 2009 Euro area external trade surplus 1.9 bn euro 6.8 bn euro deficit for EU27
 STAT/09/106 17 July 2009 May 2009 Euro area external trade surplus 1.9 6.8 deficit for EU27 The first estimate for the euro area 1 (EA16) trade balance with the rest of the world in May 2009 gave a 1.9
December 2010 Euro area annual inflation up to 2.2% EU up to 2.6%
 STAT/11/9 14 January 2011 December 2010 Euro area annual inflation up to 2.2% EU up to 2.6% Euro area 1 annual inflation was 2.2% in December 2010 2, up from 1.9% in November. A year earlier the rate was
Transition from Work to Retirement in EU25
 EUROPEAN CENTRE EUROPÄISCHES ZENTRUM CENTRE EUROPÉEN 1 Asghar Zaidi is Director Research at the European Centre for Social Welfare Policy and Research, Vienna; Michael Fuchs is Researcher at the European
The Trend Reversal of the Private Credit Market in the EU
 The Trend Reversal of the Private Credit Market in the EU Key Findings of the ECRI Statistical Package 2016 Roberto Musmeci*, September 2016 The ECRI Statistical Package 2016, Lending to Households and
H Marie Skłodowska-Curie Actions (MSCA)
") H2020 Key facts and figures (2014-2020) Number of LV researchers funded by MSCA: EU budget awarded to LV organisations (EUR million): Number of LV organisations in MSCA: 35 3.91 11 In detail, the number
H2020 Key facts and figures (2014-2020) Number of LV researchers funded by MSCA: EU budget awarded to LV organisations (EUR million): Number of LV organisations in MSCA: 35 3.91 11 In detail, the number
Fiscal competitiveness issues in Romania
 Fiscal competitiveness issues in Romania Ionut Dumitru President of the Fiscal Council, Chief Economist Raiffeisen Bank* October 2014 World Bank Doing Business Report Ranking (out of 189 countries) Ease
EUROSTAT SUPPLEMENTARY TABLE FOR REPORTING GOVERNMENT INTERVENTIONS TO SUPPORT FINANCIAL INSTITUTIONS
 EUROPEAN COMMISSION EUROSTAT Directorate D: Government Finance Statistics (GFS) and Quality Unit D1: Excessive deficit procedure and methodology Unit D2: Excessive deficit procedure (EDP) 1 Unit D3: Excessive
Traffic Safety Basic Facts Main Figures. Traffic Safety Basic Facts Traffic Safety. Motorways Basic Facts 2017.
 Traffic Safety Basic Facts 2013 - Main Figures Traffic Safety Basic Facts 2015 Traffic Safety Motorways Basic Facts 2017 Motorways General More than 24.000 people were killed in road accidents on motorways
COMMISSION DECISION of 23 April 2012 on the second set of common safety targets as regards the rail system (notified under document C(2012) 2084)
 2084)") 27.4.2012 Official Journal of the European Union L 115/27 COMMISSION DECISION of 23 April 2012 on the second set of common safety targets as regards the rail system (notified under document C(2012) 2084)
27.4.2012 Official Journal of the European Union L 115/27 COMMISSION DECISION of 23 April 2012 on the second set of common safety targets as regards the rail system (notified under document C(2012) 2084)
ENTREPRENEURSHIP IN THE EU AND BEYOND
 Flash Eurobarometer 354 ENTREPRENEURSHIP IN THE EU AND BEYOND COUNTRY REPORT SPAIN Fieldwork: June 2012 This survey has been requested by the European Commission, Directorate-General Enterprise and Industry
Pan-European opinion poll on occupational safety and health
 REPORT Pan-European opinion poll on occupational safety and health Results across 36 European countries Final report Conducted by Ipsos MORI Social Research Institute at the request of the European Agency
January 2009 Euro area external trade deficit 10.5 bn euro 26.3 bn euro deficit for EU27
 STAT/09/40 23 March 2009 January 2009 Euro area external trade deficit 10.5 26.3 deficit for EU27 The first estimate for the euro area 1 (EA16) trade balance with the rest of the world in January 2009
European Commission Directorate-General "Employment, Social Affairs and Equal Opportunities" Unit E1 - Social and Demographic Analysis
 Research note no. 1 Housing and Social Inclusion By Erhan Őzdemir and Terry Ward ABSTRACT Housing costs account for a large part of household expenditure across the EU.Since everyone needs a house, the
May 2009 Euro area annual inflation down to 0.0% EU down to 0.7%
 STAT/09/88 16 June 2009 May 2009 Euro area annual inflation down to 0.0% EU down to 0.7% Euro area 1 annual inflation was 0.0% in May 2009 2, down from 0.6% in April. A year earlier the rate was 3.7%.
Special Eurobarometer 465. Gender Equality 2017
 Summary Gender Equality 01 Gender Pay Gap Survey requested by the European Commission, Directorate-General for Justice and Consumers and co-ordinated by the Directorate-General for Communication This document
August 2008 Euro area external trade deficit 9.3 bn euro 27.2 bn euro deficit for EU27
 STAT/08/143 17 October 2008 August 2008 Euro area external trade deficit 9.3 27.2 deficit for EU27 The first estimate for the euro area 1 (EA15) trade balance with the rest of the world in August 2008
Entrepreneurship in the EU and beyond. Analytical report
 Flash Eurobarometer The Gallup Organization Flash Eurobarometer European Commission Entrepreneurship in the EU and beyond A survey in the EU, EFTA countries, Croatia, Turkey, the US, Japan, South Korea
Traffic Safety Basic Facts Main Figures. Traffic Safety Basic Facts Traffic Safety. Motorways Basic Facts 2016.
 Traffic Safety Basic Facts 2013 - Main Figures Traffic Safety Basic Facts 2015 Traffic Safety Motorways Basic Facts 2016 Motorways General Almost 26.000 people were killed in road accidents on motorways
0pinions on organised, cross-border crime and corruption
 Special Eurobarometer European Commission 0pinions on organised, cross-border crime and corruption Fieldwork: November - December 2005 Publication: March 2006 Special Eurobarometer 245 / Wave 64.3 TNS
H Marie Skłodowska-Curie Actions (MSCA)
") H2020 Key facts and figures (2014-2020) Number of AT researchers funded by MSCA: EU budget awarded to AT organisations (EUR million): Number of AT organisations in MSCA: 215 78.57 140 In detail, the number
H2020 Key facts and figures (2014-2020) Number of AT researchers funded by MSCA: EU budget awarded to AT organisations (EUR million): Number of AT organisations in MSCA: 215 78.57 140 In detail, the number
Scenario for the European Insurance and Occupational Pensions Authority s EU-wide insurance stress test in 2016
 17 March 2016 ECB-PUBLIC Scenario for the European Insurance and Occupational Pensions Authority s EU-wide insurance stress test in 2016 Introduction In accordance with its mandate, the European Insurance
H Marie Sklodowska-Curie Actions (MSCA)
") H2020 Key facts and figures (2014-2020) Number of FR researchers funded by MSCA: EU budget awarded to FR organisations (EUR million): Number of FR organisations in MSCA: 565 198.92 370 In detail, the number
H2020 Key facts and figures (2014-2020) Number of FR researchers funded by MSCA: EU budget awarded to FR organisations (EUR million): Number of FR organisations in MSCA: 565 198.92 370 In detail, the number
State of play of CAP measure Setting up of Young Farmers in the European Union
 State of play of CAP measure Setting up of Young Farmers in the European Union Michael Gregory EN RD Contact Point Seminar CEJA 20 th September 2010 Measure 112 rationale: Measure 112 - Setting up of young
Development Aid in times of economic turmoil
 Special Eurobarometer European Commission Development Aid in times of economic turmoil Fieldwork: May 2009 June 2009 Publication: October 2009 Special Eurobarometer 318 / Wave 71.2 TNS Opinion & Social
Investment and Investment Finance. the EU and the Polish story. Debora Revoltella
 Investment and Investment Finance the EU and the Polish story Debora Revoltella Director - Economics Department EIB Warsaw 27 February 2017 Narodowy Bank Polski European Investment Bank Contents We look
Aggregation of periods for unemployment benefits. Report on U1 Portable Documents for mobile workers Reference year 2016
 Aggregation of periods for unemployment benefits Report on U1 Portable Documents for mobile workers Reference year 2016 Frederic De Wispelaere & Jozef Pacolet - HIVA KU Leuven June 2017 EUROPEAN COMMISSION
Investment in Germany and the EU
 Investment in Germany and the EU Pedro de Lima Head of the Economics Studies Division Economics Department Berlin 19/12/2016 11/01/2017 1 Slow recovery of investment, with strong heterogeneity Overall
COMMISSION STAFF WORKING DOCUMENT Accompanying the document. Report form the Commission to the Council and the European Parliament
 EUROPEAN COMMISSION Brussels, 4.5.2018 SWD(2018) 246 final PART 5/9 COMMISSION STAFF WORKING DOCUMENT Accompanying the document Report form the Commission to the Council and the European Parliament on
The Skillsnet project on Medium-term forecasts of occupational skill needs in Europe: Replacement demand and cohort change analysis
 The Skillsnet project on Medium-term forecasts of occupational skill needs in Europe: Replacement demand and cohort change analysis Paper presented at the Workshop on Medium-term forecast of occupational
Library statistical spotlight
 /9/2 Library of the European Parliament 6 4 2 This document aims to provide a picture of the, in particular by looking at car production trends since 2, at the number of enterprises and the turnover they