European Employment and Social Policy
|
|
|
- Dorcas McCormick
- 5 years ago
- Views:
Transcription
 This document does not represent the point of")
1 Special Eurobarometer European Commission European Employment and Social Policy Report Fieldwork : May 2009 June 2009 Publication: September 2009 Special Eurobarometer 316 / Wave 71.2 TNS Opinion & Social This survey was requested and coordinated by the Directorate-General for Communication ( Research and Political Analysis Unit) This document does not represent the point of view of the European Commission. The interpretations and opinions contained in it are solely those of the authors.
2 INTRODUCTION EUROPEANS CURRENT EMPLOYMENT SITUATION Sample structure Length of current/last job Frequency of changing employers PERCEIVED IMPACT OF THE ECONOMIC CRISIS ON THE JOB MARKET Job losses as a result of the economic crisis Concern about potential economic crisis impact on job market Perceived economic crisis cycle CONFIDENCE IN RETAINING EMPLOYMENT Confidence in retaining jobs Confidence in having a job in two years time CONSEQUENCES OF JOB LOSS Confidence in finding new employment Expectations about the level of unemployment insurance JOB SEEKING Job seeking strategies The importance of qualifications and professional experience TRAINING Participation in training in the past 12 months Assessment of training required to retain current employment
3 6.3 Assessment of training required to find employment Perceived obstacles to training Financing training ATTITUDES TOWARD EMPLOYMENT Europeans and Flexicurity The effectiveness of employment measures PERCEPTIONS OF EU EMPLOYMENT AND SOCIAL POLICIES Perception of the EU s role in employment and social affairs The European Social Fund Familiarity with the European Globalisation Adjustment Fund CONCLUSION ANNEXES Tecnical note Tables Questionnaire 2
4 INTRODUCTION Currently, the European Union s economy is in the midst of the deepest and most widespread recession of the post-war era. In terms of GDP growth, the European Commission forecasts a sharp contraction of the EU economy, by 4% in 2009 (compared with positive growth of 0.8% in 2008). Almost all EU countries are severely hit by the worsening of the financial crisis, the sharp global downturn and ongoing housing market corrections in some economies. 1 However, the EU's strong and coordinated policy response is providing tangible help to support and stimulate economic activity. 2 There have been some signs of improvement and it is forecast that the economy is set to stabilise in 2010 as the ambitious measures taken by governments and central banks are expected to halt the contraction in economic activity and facilitate recovery. 3 The EU has strengthened its efforts to promote employment and social inclusion, as part of its strategy to deal with the economic and financial crisis, through comprehensive initiatives such as: A 200 billion recovery package. Proposing changes to the European Social Fund (ESF) and the European Globalisation Adjustment Fund (EGF) to ensure greater access and support to the labour market. The EURES jobs portal, which provides support for jobseekers who want to take up the right to work in another European country. The new skills for new jobs initiative, improving the analysis and prediction of the economy s future skills requirements, thereby matching people to jobs more efficiently and provide an insight into training needs. The European Employment Strategy, which is one of the pillars of the EU s Strategy for Growth and Jobs, continues to provide a framework for Member States to take coordinated action to promote employment in the context of the crisis. The Commission has stepped up its monitoring of the employment and social situation, including the publication of a new series of monthly monitoring reports on the rapidly changing situation. The European Commission has adopted a "shared commitment for employment", which puts forward key priorities and actions to preserve jobs and help those facing difficulties while paving the way for recovery. The EU played a leading role in the G20 Summit in London on 2 April 2009, which agreed international action to stimulate the economy and improve regulation of the financial sector. Commissioner for Employment, Social Affairs and Equal Opportunities, Vladimír Špidla, discussed the social dimension of the crisis with his counterparts from the G8 countries at the G8 Labour Ministers meeting on 30 March Employment Summit: May 7, boosting efforts to promote employment and social inclusion in the light of the financial crisis
5 To measure the impact of the economic crisis on Europeans jobs and employment prospects, the European Commission's Directorate-General for Employment, Social Affairs and Equal Opportunities commissioned this Eurobarometer study, which was carried out by TNS Opinion & Social using a representative sample of 26,756 people aged 15 or older in the 27 European Union Member States as well as the three candidate countries (Croatia, the former Yugoslav Republic of Macedonia and Turkey). This report starts off by looking at Europeans current employment situation in terms of the proportion of people who are employed and the extent to which people remain with one employer or change employers over their career. The report then considers the extent to which there have been job losses now and over time, either for people personally, their immediate family or colleagues. It then determines that the level of concern regarding future job losses is at its highest in this current wave, most probably due to Europeans feeling that the worst of the economic crisis is yet to come. The report then turns to European citizens own vision for the future their personal confidence that they will keep or find a job and, if unemployed, the expectations about the level of social protection that will be provided. Within this context, we look at job seeking, specifically in terms of the type of assets that are important in finding a job, and the extent to which Europeans are geographically mobile with regard to employment. Training can be a large asset in retaining and finding employment and respondents participation in training is assessed. Here it is found that employers play a large part in financing training, thereby removing the largest obstacle to training (namely finance). Lastly, this report looks at the level of public approval for measures promoting the concept of 'flexicurity' a policy approach which combines more flexible labour markets with high levels of employment security and social protection. It then considers the extent of awareness of EU instruments such as the European Social Fund (ESF), whether the current 10% budget allocation is perceived to be sufficient, and the overall impact of the EU on employment and social affairs. This report presents the principal results obtained. 5 These are analysed in terms of the European average for the 27 Member States (EU27) and then reviewed on a country-by-country basis. For relevant questions, results are also compared to those observed in the previous Eurobarometer surveys on European employment and social policy 6 carried out in and Geographical mobility of citizens 8 carried out in The averages for the previous reports represent the results obtained for all the Member States of the European Union as it was composed at that time. The reader should be aware that there are two types of reports for this Eurobarometer study. This, the Full Report covers an in-depth analysis and focuses on the historical trend questions asked in a Standard Eurobarometer wave, as well as some new questions that focus specifically on the current economic crisis. It reports in detail at the overall EU level as well as at national level and provides insights into socio-demographic analysis of the results. 5 Please also note that the total percentages shown in the tables of this report may exceed 100% where the respondent is allowed to give several answers to a particular question. 6 Special Eurobarometer 261/EB65.3/2006 European employment and social policy 7 It should be noted that Special Eurobarometer 261 was carried out in the 25 Member States which then constituted the EU and, therefore, all references to this survey at EU level refer to this group of countries. 8 Special Eurobarometer 305/EB70.1/2009/ Geographical mobility of citizens 4
6 The Summary Report provides a concise snapshot of the main findings in this Eurobarometer wave, focusing specifically on the impact of the economic crisis on jobs as seen by European citizens at the overall as well as the national level. The current survey, as in 2006 and in 2008, was conducted by the TNS Opinion & Social network. The fieldwork was carried out between 29 May and 15 June The methodology used is that of Eurobarometer surveys as carried out by the Directorate General for Communication ( Research and Political Analysis Unit). A technical note on the manner in which interviews were conducted by the Institutes within the TNS Opinion & Social network is appended as an annex to this report. This note indicates the interview methods and the confidence intervals. 5
7 In this report, the countries are represented by their official abbreviations. The abbreviations used in this report correspond to: ABBREVIATIONS EU27 /NA BE BG CZ D-E DE D-W EE EL ES FR IE IT CY CY (tcc) LT LV LU HU MT NL AT PL PT RO SI SK FI SE UK HR TR MK European Union 27 Member States Don t know / No answer Belgium Bulgaria Czech Republic Denmark East Germany Germany West Germany Estonia Greece Spain France Ireland Italy Republic of Cyprus* Area not controlled by the government of the Republic of Cyprus Lithuania Latvia Luxembourg Hungary Malta The Netherlands Austria Poland Portugal Romania Slovenia Slovakia Finland Sweden The United Kingdom Croatia Turkey The Former Yugoslav Republic of Macedonia (FYROM)** * Cyprus as a whole is one of the 27 European Union Member States. However, the acquis communautaire is suspended in the part of the country that is not controlled by the government of the Republic of Cyprus. For practical reasons, only the interviews conducted in the part of the country controlled by the government of the Republic of Cyprus are recorded in the category CY and included in the EU27 average. The interviews conducted in the part of the country not controlled by the government of the Republic of Cyprus are recorded in the category CY (tcc) [tcc: Turkish Cypriot Community]. ** Provisional code which does not prejudge in any way the definitive nomenclature for this country, which will be agreed following the conclusion of negotiations currently taking place at the United Nations. 6
8 1. EUROPEANS CURRENT EMPLOYMENT SITUATION The first section of the report provides context by looking at Europeans current levels of employment, and explores which countries have relatively higher levels of unemployment. Within this context, we look at how long employees stay with one employer, and the frequency of changing employers. 1.1 Sample structure - Overall, half of Europeans are employed, with a stable result since Half of Europeans are currently not working (or inactive) (50%), whilst 42% are employed and just under a tenth (8%) are self-employed 9. Looking further into the non-working segment, a quarter of Europeans are retired or unable to work due to illness, 9% are students, 8% are house persons (responsible for ordinary shopping and looking after the home) and 8% are unemployed or temporarily not working. 10 By comparison with the data of 2008, the data shows some slight changes with 44% being employed and 7% being self-employed, while the proportion of non-working Europeans has remained almost unchanged at 49%. 9 D15a.2 What is your current occupation? (Aggregated) 10 D15a.1 What is your current occupation? (Specified) 7
9 D15a. What is your current occupation? - % EU Retired or unable to work through illness Skilled manual w orker 10% 11% Student 9% 9% Employed position, working mainly at a desk 8% 9% Unemployed or temporarily not working 8% 7% Responsible for ordinary shopping and looking after the home, or without any current occupation, not working 8% 8% Employed position, not at a desk, but in a service job (hospital, restaurant, police, fireman, etc.) Middle management, other management (department head, junior manager, teacher, technician) 6% 6% 7% 7% Other (unskilled) manual worker, servant 4% 3% Employed position, not at a desk but travelling (salesmen, driver, etc.) 3% 3% Owner of a shop, craftsmen, other self-employed person 3% 3% Employed professional (employed doctor, lawyer, accountant, architect) 2% 2% Business proprietors, ow ner (full or partner) of a company 2% 2% Professional (law yer, medical practitioner, accountant, architect, etc.) 2% 2% Supervisor General management, director or top management 1% 1% 1% 1% Farmer 1% 1% 8 25% 25%

10 Looking at the results at the national level, the highest proportions of citizens not working can be found in Turkey (68%) and the former Yugoslav Republic of Macedonia (66%) in both these countries at least two-thirds of citizens are not working. However, in Turkey, there are relatively higher proportions of house persons (35%) and students (14%), with just over one in ten Turkish citizens classifying themselves as unemployed (11%). This is in contrast with former Yugoslav Republic of Macedonia, where a quarter of citizens say they are unemployed the highest of all European countries surveyed and far higher than the country with the next highest level of unemployment (Lithuania at 16%). Slovakia stands out as a country with higher levels of employment (62% working), followed by Sweden (59%), the Netherlands (58%), the Czech Republic (57%) and Finland (56%). Looking at the country groupings, lower levels of those working are apparent in NMS10 at 47% and NMS12 at 48%. Looking at the occupational levels by socio-demographics reveals that those who are most likely to be employed: Are Men Aged or aged Are educated until the age of 20 or beyond Have an internet connection at home 9
11 D15a.2 What is your current occupation? Employed Selfemployed Not working EU27 42% 8% 50% Sex Male 46% 11% 43% Female 39% 5% 56% Age % 1% 69% % 10% 25% % 13% 24% % 5% 80% Education (End of) 15-22% 5% 73% % 8% 40% % 12% 28% Still studying % Internet connection at home Yes 52% 10% 38% No 28% 5% 67% - Turkey and former Yugoslav Republic of Macedonia show the lowest levels of employment - Employees who are currently not working, were asked about their previous type of employment 11. Here, it is relevant to note that, of the respondents currently not working, 23% have never done any paid work. Taking into account that half the sample are currently not working, it means that 12% of the sample have never done any paid work. On a country level, a second interesting finding arises: Turkey and the former Yugoslav Republic of Macedonia, who have the highest proportion of respondents currently not working (68% and 66% respectively), also have the highest proportion of respondents who have never done any paid work (71% and 52% of those who are currently unemployed, respectively). Therefore, of the respondents sampled, just under half of those in Turkey (48%) have never done any paid work (34% for those in the former Yugoslav Republic of Macedonia). Greece and Italy also deserve a mention, where just under a quarter of respondents have never worked (24% for each). By contrast, countries where very few respondents have never worked include Denmark (3%), Finland (4%) and the UK (5%). The socio-demographic breakdown shows that across the EU27 those who are most likely to have never done any paid work are: Women Aged D15b.1 Did you do any paid work in the past? What was your last occupation? 10
12 Still studying Currently a student (or else, a house person) 1.2 Length of current/last job - On average, people have been with their current employer/last employer for around 12 years- The largest proportion of those surveyed have been with their current/last employer for one to five years (31%) whilst 15% say they have been with their employer for 6 to 10 years, a further 15% for 11 to 20 years and 16% of the sample have been with their employer for more than 20 years, resulting in an overall average of 11.6 years 12. This is lower than the average recorded in 2006 (12.2 years) largely due to more of the sample stating that they ve been with their employer for one to five years. QD5 For how long have you been working for your current employer or last employer if you are not currently working? - %EU to 5 years 28% 31% More than 20 years 11 to 20 years 6 to 10 years Never had any paid work 16% 17% 15% 15% 15% 14% 12% 14% Less than one year 4% 6% 7% 6% Countries that report the highest levels of employer-loyalty, in terms of staying with one employer for the greatest length of time, include Slovenia (14.9 years), Finland (13.7 years), France (13.6 years) and Luxembourg (13.5 years). By contrast, Romania (6.2 years), Turkey (7.3 years) and Latvia (7.7 years) report the lowest levels of staying with one employer, though it should be noted that 33% of those in Romania are also unsure of the answer to this question, and 51% in Turkey have never had any paid work (though the average figures excludes mentions of don t know and never had any paid work ). Those in the EU15 have also stayed with their current employer for longer (12.1 years) when compared to those countries which joined the EU since 2004 (9.9 years). 12 QD5. For how long have you been working for your current employer or last employer if you are not currently working? 11
13 QD5 For how long have you been working for your current employer or last employer if you are not currently working? - average SI FI FR LU IT EL DE BE SE PT NL MT EU27 AT CY ES SK CZ PL BG LT HU IE EE UK LV RO 6,2 7,7 14,9 14,2 13,7 13,1 13,6 12,4 13,5 14,3 13, ,2 13,9 13,1 13, ,3 12,8 12,7 12,1 13,4 11,8 10,6 11,7 12,7 11,6 12,2 11,4 12, , ,9 10,7 11,6 10, ,6 13,3 10,3 10,7 10,2 9,8 10,1 10,1 9,8 11,8 9,7 10 9,5 10 9,3 9,6 8,9 14,1 12
14 The socio-demographic analysis reveals: Men are likely to stay with one employer for longer than women. Those who are older tend to have stayed with their last employer for longer. Respondents with a household composition of one or two people have been with their current employer for longer. In-line with the age-related findings, those who are retired were with their last employer for the longest (20.2 years), followed by those who are self-employed (11.8 years) and managers (11.3 years). Those in rural villages worked with their employer for longer than those in large towns. Those who own their house/apartment have been with their employer longer. Predictably, those who haven t lost their jobs due to the economic crisis, who are not concerned about losing their jobs, and who feel a sense of job stability, tend to have been with their current/last employer for longer. 13
15 QD5 For how long have you been working for your current employer or last employer if you are not currently working? Never had any paid work Less than one year 1 to 5 years 6 to 10 years 11 to 20 years More than 20 years EU27 12% 4% 31% 15% 15% 16% 7% Sex Male 9% 3% 31% 15% 16% 19% 7% Female 15% 4% 30% 16% 15% 12% 8% Age % 8% 36% 2% - - 4% % 4% 53% 21% 10% 1% 5% % 3% 29% 20% 24% 15% 6% % 2% 12% 13% 20% 34% 11% Education (End of) 15-11% 2% 21% 15% 18% 22% 11% % 4% 36% 17% 17% 15% 7% 20+ 2% 3% 38% 19% 17% 16% 5% Still studying 81% 5% 10% 1% - - 3% Household composition 1 9% 4% 27% 15% 16% 20% 9% 2 7% 4% 28% 13% 17% 23% 8% 3 16% 4% 35% 16% 14% 9% 6% 4+ 18% 3% 34% 17% 14% 8% 6% Respondent occupation scale Self- employed 1% 4% 29% 18% 22% 15% 11% Managers - 2% 35% 22% 23% 16% 2% Other white collars - 3% 46% 22% 16% 10% 3% Manual workers - 4% 46% 20% 16% 10% 4% House persons 36% 5% 29% 11% 6% 4% 9% Unemployed 10% 7% 49% 14% 6% 4% 10% Retired 5% 2% 11% 12% 21% 35% 14% Students 81% 5% 10% 1% - - 3% Subjective urbanisation Rural village 11% 4% 29% 15% 16% 17% 8% Small/mid size town 14% 3% 29% 16% 15% 16% 7% Large town 12% 5% 35% 14% 15% 12% 7% Ownership house/ apartment Yes 11% 3% 27% 16% 17% 18% 8% No 15% 6% 39% 14% 11% 9% 6% Has lost his job Yes 3% 10% 53% 14% 9% 4% 7% No 13% 3% 29% 15% 16% 17% 7% Concerned about losing job No 6% 3% 32% 18% 19% 17% 5% A bit 6% 3% 41% 20% 17% 9% 4% Yes 7% 3% 40% 19% 16% 9% 6% Job stability Confident - 3% 39% 21% 20% 13% 4% Not confident - 4% 51% 16% 15% 8% 6% 14

16 1.3 Frequency of changing employers - Most respondents have changed their employer between one and five times- Sixty-percent of those surveyed say they have changed their employer between one and five times, with only 13% saying they have never changed employer 13. The remainder of the sample is divided between those who have changed employer 6 to 10 times (9%) and more than 10 times (2%) whilst 12% spontaneously say they have never had any paid work and the remainder are unsure. Countries with the highest average levels of changing jobs include Denmark (4.6 times), the UK (4.5 times), Sweden (4.2 times) and France (4 times), resulting in an overall higher frequency of changing employers in EU15 (3.3 times) when compared to NMS12 (2.6 times). In addition, comparing the results with the 2006 Eurobarometer shows that Spain, Cyprus and Slovakia show comparatively higher levels of changing jobs, largely due to fewer people saying they have never changed employer. 13 QD4. How many times have you changed employer in your working life so far? 15
17 QD4 How many times have you changed employer in your working life so far? (DO NOT COUNT VACATION JOBS WHILE IN FULL-TIME EDUCATION) - average UK SE FR FI EE LV ES NL IE EU27 HU LT AT SK CY EL PT DE CZ PL BG BE SI LU MT RO IT 4 3,7 3,5 3,9 3,5 3,4 3,4 3,5 3,4 2,4 3,2 3 3,2 3 3,2 2,9 3,1 2,9 3, ,9 2,9 2,3 2,9 2 2,9 2,5 2,7 2,6 2,7 2,4 2,7 2,6 2,6 2,4 2,6 2,4 2,5 2,3 2,3 2,2 2,2 1,8 2,1 1,8 2 1,7 2 1,9 4,2 4,2 4,6 4,7 4,5 4,5 16
18 The socio-demographic groupings most likely to have changed employers are: Men. Aged Educated up to the age of 19. Living alone in the household. Currently unemployed, or manual workers. Living in large towns. Respondents who have lost their jobs due to the economic crisis. QD4 How many times have you changed employer in your working life so far? (DO NOT COUNT VACATION JOBS WHILE IN FULL-TIME EDUCATION) Never had any paid work Never changed of employer 1 to 5 times 6 times or more EU27 12% 13% 60% 11% 4% Sex Male 10% 13% 61% 13% 3% Female 15% 13% 59% 9% 4% Age % 12% 32% 4% 2% % 12% 67% 11% 4% % 12% 67% 15% 3% % 14% 63% 11% 4% Education (End of) 15-11% 12% 61% 12% 4% % 12% 67% 13% 4% 20+ 2% 17% 68% 11% 2% Still studying 81% 4% 13% 0% 2% Household composition 1 9% 12% 60% 14% 5% 2 8% 13% 64% 12% 3% 3 16% 12% 60% 9% 3% 4+ 18% 13% 57% 9% 3% Respondent occupation scale Self- employed 1% 18% 65% 10% 6% Managers 1% 20% 67% 10% 2% Other white collars 1% 15% 71% 11% 2% Manual workers - 14% 68% 15% 3% House persons 36% 6% 48% 7% 3% Unemployed 9% 5% 62% 20% 4% Retired 5% 15% 65% 10% 5% Students 81% 4% 13% 0% 2% Subjective urbanisation Rural village 11% 14% 61% 10% 4% Small/mid size town 13% 13% 60% 11% 3% Large town 12% 11% 60% 13% 4% Has lost his job Yes 3% 4% 67% 22% 4% No 13% 14% 60% 10% 3% 17
19 2. PERCEIVED IMPACT OF THE ECONOMIC CRISIS ON THE JOB MARKET In this section, we look at whether Europeans have experienced job losses, either personally, amongst their families and friends or amongst colleagues, and their level of concern regarding future job losses due to the economic crisis. Here, we find that Europeans are very concerned about future job losses, which is probably due to the fact that they feel the worst impact of the economic crisis is yet to come. 2.1 Job losses as a result of the economic crisis - Europeans have experienced job losses due to the economic crisis - Europeans were asked whether, due to the economic crisis, they themselves had lost a job, someone from their family or friendship circle had lost their job or whether one of their colleagues had lost their job 14. Overall, 9% of those polled say they had lost their job due to the economic crisis. However, further analysis of these citizens at the overall EU27 level show that 3% have since found a job (and are not currently unemployed) resulting in an overall net job loss of 6%. In addition, since the total potential active working population is 58%, this results in a total effective net job loss, due to the economic crisis, of 3.48%. Compared to personal job loss, more citizens know families or friends that have lost their jobs (36%) and around a quarter state that one of their colleagues has lost their job (24%). Looking at the individual results at the national level, it is clear that the responses to these three measures show a strong correlation countries where respondents are more likely to have personally experienced job loss also rank highly in terms of friends/family and colleagues losing their jobs. The claimed job loss rate across all three measures is highest in the following countries (with the figures indicating claimed personal job loss 15 ; friends/family job loss; and colleagues job loss): Latvia 21%; 61%; 57% Lithuania 18%; 54%; 43% Spain 17%; 55%; 36% Ireland 16%; 49%; 37% Portugal 16%; 39%; 32% Estonia 15%; 52%; 42% Hungary 15%; 48%; 38% Other countries that stand out are Slovenia and Slovakia where, though the personal and friends/family job loss measure is on par or below the EU average of 9% and 36%, the incidence of colleagues having lost their jobs is higher: Slovakia (9%; 37%; 38%), Slovenia (7%; 29%; 37%). 14 QB1. Please tell me whether or not each of the following situations has happened to you, as a result of the economic crisis? You lost your job; Someone from your family, a relative, or a close friend lost their job; One of your colleagues has lost their job 15 Please note that these figures are the actual claimed personal job loss, and not the recalculated net job loss 18
20 On the other hand are countries that have experienced comparatively lower job losses across all three measures: Luxembourg 4%; 23%; 17% Greece 4%; 28%; 12% The Netherlands 5%; 24%; 16% Malta 5%; 26%; 15% Belgium 7%; 21%; 14% Cyprus 7%; 30%; 13% We see that, for the country groupings, countries in the EU6 16 report lower levels of job losses (7%, 31%, 19%) compared to NMS10 (11%, 37%, 27%). QB1. Please tell me whether or not each of the following situations has happened to you, as a result of the economic You lost your job crisis? Someone from your family, a relative, or a close friend lost their job One of your colleagues has lost their job EU27 9% 36% 24% BE 7% 21% 14% BG 10% 31% 29% CZ 11% 38% 35% 7% 36% 26% DE 7% 30% 20% EE 15% 52% 42% IE 16% 49% 37% EL 4% 28% 12% ES 17% 55% 36% FR 7% 33% 19% IT 6% 33% 18% CY 7% 30% 13% LV 21% 61% 57% LT 18% 54% 43% LU 4% 23% 17% HU 15% 48% 38% MT 5% 26% 15% NL 5% 24% 16% AT 7% 32% 27% PL 9% 31% 17% PT 16% 39% 32% RO 9% 28% 26% SI 7% 29% 37% SK 9% 37% 38% FI 9% 32% 23% SE 7% 37% 24% UK 9% 44% 28% HR 10% 32% 31% TR 12% 44% 24% MK 10% 35% 22% Highest percentage per item Highest percentage per country Lowest percentage per item Lowest percentage per country 16 The EU6 average is made up of the following: Belgium, Denmark, West-Germany, France, Italy and the Netherlands 19
21 From a socio-demographic point of view, those who have been hardest hit by job losses due to the economic crisis are: Men. Aged or aged 40-54, though this is understandable since this is the core working population. Those who were educated up to the age of 19. Living in large towns. QB1.Please tell me whether or not each of the following situations has happened to you, as a result of the economic crisis. Someone from your family, a relative, or a close friend lost their job One of your colleagues has lost their job You lost your job EU27 36% 24% 9% Sex Male 36% 29% 11% Female 36% 19% 7% Age % 23% 10% % 32% 13% % 31% 12% % 13% 3% Education (End of) 15-37% 18% 8% % 29% 12% % 25% 7% Still studying 30% 13% 3% Respondent occupation scale Self- employed 32% 25% 5% Managers 34% 28% 3% Other white collars 39% 30% 4% Manual workers 41% 33% 7% House persons 38% 12% 7% Unemployed 54% 53% 59% Retired 27% 9% 2% Students 30% 13% 3% Subjective urbanisation Rural village 35% 22% 8% Small/mid size town 36% 24% 9% Large town 37% 27% 10% 20
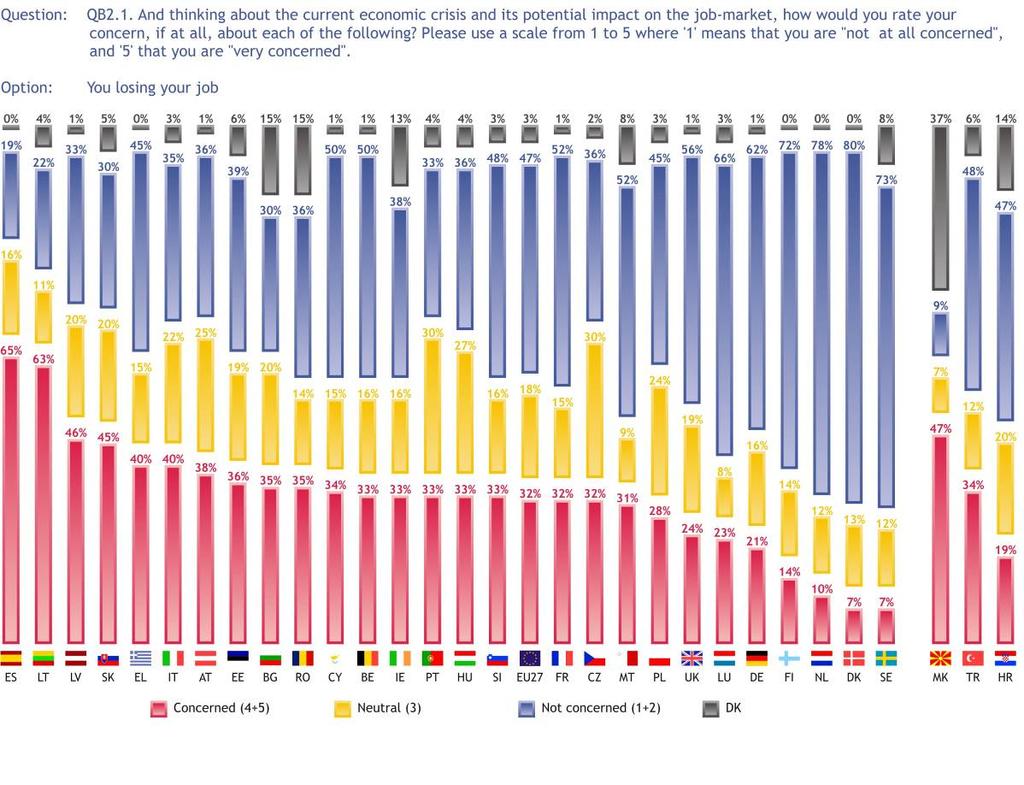
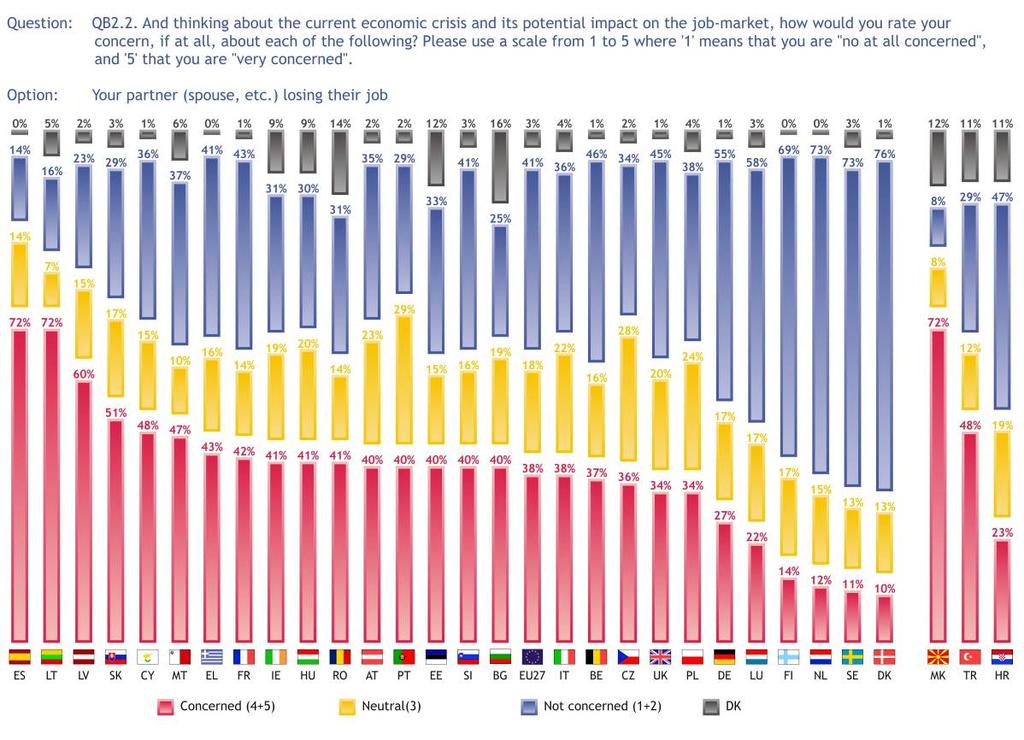
22 2.2 Concern about potential economic crisis impact on job market - Although there have been job losses due to the economic crisis, the level of concern regarding job losses to come is high - Europeans were asked to consider the current economic crisis and its impact on the job market, and to indicate their level of concern regarding job losses for themselves, their partners and their children. 17 For each of these statements there were high spontaneous mentions of Not applicable, largely from those not working, the unmarried or those who do not have children. It would therefore be prudent to exclude these respondents from the analysis. This provides the following results: QB2. And thinking about the current economic crisis and its potential impact on the job-market, how would you rate your concern, if at all, about each of the following? Answer 'concerned' -%EU Your children losing their job 47% Your partner (spouse, etc.) losing their job 38% You losing your job 32% The first key finding in the above data is that Europeans concern for their children s job losses is the highest. Later in this report, we will see that Europeans believe that the level of one s qualifications and professional experience are the two most important assets required for finding a job easily. It could therefore be hypothesised that parents concerns stem from the fact that children/young people, as entrants into the job market, are likely to have fewer years of work experience, and are therefore more vulnerable in these economic times, coupled with parents natural concern over the wellbeing of their children. 17 QB2. And thinking about the current economic crisis and its potential impact on the job-market, how would you rate your concern, if at all, about each of the following? Please use a scale from 1 to 5 where '1' means that you are "no at all concerned", and '5' that you are "very concerned". You losing your job; Your partner (spouse, etc.) losing their job; Your children losing their job 21
23 It is also important to note that close to a third of working Europeans (32%) are very concerned about losing their jobs, with even higher levels of concern over their spouses losing their jobs. Turning now to the national data, the second key finding emerges: the employed population in countries where the level of concern for personal job loss is high also rank the highest for concern regarding their spouses or children losing their jobs. Countries with high levels of concern for all three measures include: Spain 65% personal; 72% partner; 77% children Lithuania 63% personal; 72% partner; 69% children Latvia 46% personal; 60% partner; 72% children Here it is noted that, in terms of the actual job loss analysis provided above, citizens from Spain, Latvia and Lithuania also reported higher incidences of job losses, thus justifying their higher level of concern for future job losses. At the opposite end of the spectrum are countries with low levels of concern about job loss for themselves, their partners or their children, namely Denmark (80% not concerned about personal job loss; 76% not concerned for partner; 62% not concerned for children), the Netherlands (78%; 73%; 60%), Sweden (73%; 73%; 56%), Finland (72%; 69%; 51%) and Luxembourg (66%; 58%; 56%). In addition, when reporting on actual job losses above, citizens in the Netherlands and Luxembourg reported a lower incidence of job loss, hence their lower level of concern. In terms of the country groupings, it is noted that the group consisting of the Nordic countries and The Netherlands shows less concern regarding job losses across all three measures; in contrast, respondents in NMS12 are less likely to be not concerned only 38% (for personal), 33% (for partner) and 27% (for children) say they are not concerned about future job losses. 22
24 23

25 Analysis by socio-demographic variables shows: Women are more concerned about future job losses, for themselves, their partners and their children. Those aged are most likely to be concerned about job losses for themselves and their partners, whereas those aged 55+ are most concerned about their children s potential job losses. This makes sense in light of these respondents children most likely being old enough to be employed. Respondents who ended their education earlier (age 15 or before, are most concerned about job losses on all three measures). Those who have personally lost their jobs, are more worried that the same will happen to their partners and children. As would be expected, those who are not confident about their job stability, are also more worried that the economic crisis will result in them, their spouses or children losing their jobs. 24
26 QB2. And thinking about the current economic crisis and its potential impact on the job-market, how would you rate your concern, if at all, about each of the following? Please use a scale from 1 to 5 where '1' means that you are "no at all concerned", and '5' that you are "very concerned". You losing your job Your partner (spouse, etc.) losing their job Your children losing their job Concerned (4+5) Not concerned (1+2) Concerned (4+5) Not concerned (1+2) Concerned (4+5) Not concerned (1+2) EU27 32% 47% 3% 38% 41% 3% 47% 31% 4% Sex Male 30% 48% 3% 34% 44% 3% 43% 34% 4% Female 34% 46% 3% 42% 38% 3% 51% 28% 4% Age % 45% 4% 40% 36% 5% 28% 44% 18% % 45% 2% 41% 37% 2% 34% 41% 10% % 44% 2% 40% 39% 2% 48% 30% 3% % 57% 4% 29% 54% 4% 51% 28% 2% Education (End of) 15-38% 42% 4% 44% 38% 3% 57% 23% 2% % 43% 2% 42% 37% 2% 46% 31% 4% % 56% 2% 30% 49% 2% 36% 41% 4% Still studying 26% 48% 7% 29% 44% 9% 23% 47% 21% Has lost his job Yes % 18% 2% 65% 18% 5% No 32% 47% 3% 34% 44% 3% 46% 32% 4% Job stability Confident 25% 54% 1% 30% 48% 1% 36% 41% 4% Not confident 77% 9% 2% 62% 18% 3% 60% 16% 6% 25

27 2.3 Perceived economic crisis cycle - When considering the impact of the economic crisis on the job market, more than six in ten Europeans feel the worst is yet to come - Europeans high levels of concern about job losses are explained when one considers that 61% of Europeans feel that the worst is still to come. 18 Just over a quarter of Europeans (28%) feel more optimistically that the impact of the crisis on jobs has already reached its peak, while around one in ten (11%) have no opinion. The highest proportions of respondents believing the worst is still to come can be found in Latvia (82%), Estonia (76%), Lithuania (74%), Cyprus (73%), Luxembourg (73%) and Croatia (73%). As seen above, Latvia and Lithuania are very concerned about job losses, most likely due to also feeling that the worst is yet to come. Estonia and Cyprus follow the same trend of being concerned about job losses and feeling the worst is yet to come. Luxembourg and Croatia show somewhat different results: though both countries feel the worst of the crisis is yet to come, both also show lower than average levels of concern about job losses. The trend at the other end of the spectrum also holds true: Sweden, a country that showed the lowest levels of concern over job losses, is also now most likely to say that the impact of the economic crisis on jobs has already reached its peak (45%), followed by Turkey (39%) and Denmark (36%; another country that posted low levels of job loss concern). 18 QB3 Some analysts say that the impact of the economic crisis on the job market has already reached its peak and things will recover little by little; others, on the contrary, say that the worst is still to come. Which of the two statements is closer to your opinion? 26
28 However, it should be noted that the absolute majority of citizens in all three of these countries still feel that the worst is still to come. Finally, it is worth noting the comparatively high levels of citizens in Bulgaria who are unable to give an opinion (34% don t know), together with Romania (23% don t know) and Portugal (21% don t know). Looking at the results on a socio-demographic level, and discarding relatively higher mentions of don t know (where relevant), reveals that some groups are slightly more likely to feel the worst is yet to come including: Aged 40+. Those who ended their education before the age of 20. Living in a household with two people. Currently unemployed. Living in a rural village. Not the owners of their house or apartment. Those who do not have an internet connection at home (though the same group are also more likely to say don t know). Pessimistic in general about the national situation of employment, the national economy and the financial situation in their household. Those who have lost their jobs due to the economic crisis (though those who haven t lost their jobs are also more likely to have no opinion). Those who are concerned about losing their jobs and not confident in their job stability. 27
29 QB3 Some analysts say that the impact of the economic crisis on the job market has already reached its peak and things will recover little by little; others, on the contrary, say that the worst is still to come. Which of the two statements is closer to your opinion? The worst is still to come The impact of the crisis on jobs has already reached its peak EU27 61% 28% 11% Sex Male 61% 30% 9% Female 61% 27% 12% Age % 33% 13% % 32% 9% % 27% 8% % 25% 13% Education (End of) 15-62% 24% 14% % 28% 10% % 32% 8% Still studying 52% 34% 14% Household composition 1 61% 25% 14% 2 64% 26% 10% 3 59% 31% 10% 4+ 59% 31% 10% Respondent occupation scale Self- employed 61% 29% 10% Managers 61% 32% 7% Other white collars 57% 33% 10% Manual workers 62% 29% 9% House persons 59% 28% 13% Unemployed 70% 22% 8% Retired 62% 24% 14% Students 52% 34% 14% Subjective urbanisation Rural village 63% 26% 11% Small/mid size town 60% 29% 11% Large town 59% 31% 10% Ownership house/ apartment Yes 60% 29% 11% No 63% 26% 11% Internet connection at home Yes 60% 31% 9% No 62% 24% 14% Nat. situation of employment Good 50% 40% 10% Bad 64% 26% 10% Situation of national economy Good 49% 40% 11% Bad 64% 26% 10% Financial situation household Good 57% 33% 10% Bad 68% 20% 12% Has lost his job Yes 69% 24% 7% No 60% 29% 11% Concerned about losing job No 57% 34% 9% A bit 57% 32% 11% Yes 65% 27% 8% Job stability Confident 59% 33% 8% Not confident 70% 22% 8% 28

30 3. CONFIDENCE IN RETAINING EMPLOYMENT This section explores whether Europeans feel confident of retaining their jobs or, for those who are currently unemployed, their confidence that they will have a job in two year s time. 3.1 Confidence in retaining jobs -Europeans confidence in keeping their current job has declined- Respondents who are currently working were asked the confidence in their ability to keep their job in the coming months 19. Although Europeans are fairly confident (80% are confident in their ability to keep their job in the coming months), this figure has declined from 84% confidence in the 2006 Eurobarometer survey. This is largely due to fewer people being very confident about keeping their job (50% in 2006 vs. 40% in 2009). Countries where respondents are the most confident that they will keep their job in the coming months include Luxembourg (93%), Denmark and Finland (both 92%) and Sweden (90%). On the other hand are the countries where at least a third of respondents do not feel confident about their ability to keep a job: Slovakia (42%), Hungary (41%), Lithuania (40%), Turkey (39%) and Greece (35%). Overall, those in the EU15 are more confident in their ability to keep their jobs (82%) when compared to the NMS12 (70%). 19 QD7 How confident would you say you are in your ability to keep your job in the coming months? Are you? Very confident; Fairly confident; Not very confident; Not at all confident; Don't know 29
31 Comparing the results from the 2006 Eurobarometer shows the largest decrease in confidence occurred in the following countries: Latvia (87% to 71%), Spain (86% to 72%), Ireland (89% to 75%), Lithuania (73% to 57%) and Greece (78% to 63%). On the other hand, confidence levels increased in seven countries. Item was not previously asked for MK EB71.2 May-Jun 2009 / EB65.3 Apr-May
32 The socio-demographic analysis shows that those who are most confident in their ability to keep their jobs in the coming months are: Aged (those aged and working are more likely to be not confident while a larger proportion of those aged 55+ are unsure of their answer). Educated for longer (age 20 and older). Living in a larger household (4 or more people). Managers (manual workers are the least confident). Owners of their house/apartment. Optimistic in general about the national situation of employment, the national economy and the financial situation in their household. Not concerned about losing their job due to the economic crisis impact on the job market. 31
33 QD7 How confident would you say you are in your ability to keep your job in the coming months? Are you? Confident Not confident EU27 80% 16% 4% Sex Male 81% 16% 3% Female 80% 16% 4% Age % 19% 3% % 16% 3% % 16% 3% % 16% 9% Education (End of) 15-71% 21% 8% % 18% 4% % 11% 2% Still studying - Household composition 1 77% 17% 6% 2 78% 17% 5% 3 80% 17% 3% 4+ 83% 15% 2% Respondent occupation scale Self- employed 81% 14% 5% Managers 90% 8% 2% Other white collars 81% 16% 3% Manual workers 74% 22% 4% House persons Unemployed Retired Students Ownership house/ apartment Yes 81% 16% 3% No 77% 18% 5% Nat. situation of employment Good 89% 9% 2% Bad 78% 18% 4% Situation of national economy Good 87% 10% 3% Bad 78% 18% 4% Financial situation household Good 88% 9% 3% Bad 60% 34% 6% Concerned about losing job No 96% 3% 1% A bit 87% 10% 3% Yes 62% 35% 3% 32
34 3.2 Confidence in having a job in two years time - Two thirds of Europeans who want to be working in two years time feel confident they will have a job - All respondents were asked how confident they were of having a job in two years time. 20 However, it should be borne in mind that 35% of respondents spontaneously said they were not looking for a job in two years time. It would therefore be prudent to exclude these respondents from the analysis. This results in an overall confidence of 66% in this survey (of the sub-base), which is stable as compared with the confidence level reported in The data at national level shows a great correlation between countries where the workers are confident in their ability to keep their jobs, and all potentially active respondents confidence in having a job in two years time. The countries with the highest confidence levels are again Finland (90%), Denmark (87%), the Netherlands (85%), Luxembourg (83%) and the UK (81%). In addition, there s similarity in the countries that are not confident: Slovakia (57%), former Yugoslav Republic of Macedonia (55%), Lithuania, Latvia and Greece (all three at 52%). Again, confidence is higher amongst the 15 original European Union Member States (70%), driven especially by high levels of confidence in Finland, Austria and Sweden (78%) when compared to the 12 New Member States (54%). 20 QD8 Would you say that you are very confident, fairly confident, not very confident or not at all confident in having a job in 2 years time? 33
, Lithuania (51% to 39%), the Czech Republic (80% to 71%) and Bulgaria (47% to 39%).")
35 Item was not previously asked for HR, MK, TR EB71.2 May-Jun 2009 / EB70.1 Oct-Nov 2008 Comparing the results with the 2008 Eurobarometer shows decreased confidence in Latvia (61% to 46%), Lithuania (51% to 39%), the Czech Republic (80% to 71%) and Bulgaria (47% to 39%). However, there have been increases in the confidence about having a job in two years time for those in Luxembourg (75% to 83%), Romania (49% to 56%) and Germany (68% to 74%). Overall, around half of Member States have seen a rise in confidence by this measure, and half have seen a fall. Analysis of the socio-demographic variables reveals the following: Men are more likely than women to be confident by this measure. The highest confidence level is found in the age group, with the lowest confidence in the potentially active 55+ age group (bearing in mind that respondents who spontaneously say they won t be looking for a job in 2 years time have been excluded from the analysis). The confidence level increases proportionately with education, with those who have been educated at least to the age of 20 being the most confident. 34
36 The further demographic trends follow the same trends as noticed amongst workers confidence levels, in that those who are the most confident are optimistic about the national economy and employment, and haven t been hit by the economic crisis impact on the job market. QD8 Would you say that you are very confident, fairly confident, not very confident or not at all confident in having a job in 2 years time? Very confident + Fairly confident Not very confident + Not at all confident EU27 66% 28% 6% Sex Male 69% 26% 5% Female 63% 30% 6% Age % 27% 5% % 25% 4% % 29% 4% % 33% 14% Education (End of) 15-50% 41% 9% % 30% 5% % 18% 3% Still studying 65% 28% 7% Nat. situation of employment Good 84% 13% 3% Bad 63% 31% 6% Situation of national economy Good 79% 17% 4% Bad 63% 31% 6% Has lost his job Yes 47% 49% 4% No 69% 25% 6% 35

37 4. CONSEQUENCES OF JOB LOSS This section explores respondents perceived confidence in finding new employment, in the event of being laid off, and what proportion of their income they feel would be covered by their country s unemployment insurance. 4.1 Confidence in finding new employment - Finding a new job is perceived to be harder than before - Working respondents were asked their perceived likelihood of finding a job in the next six months if they were laid off. 21 Thirty-nine percent of Europeans feel they are very likely, 21% feel they are likely and 33% feel they are unlikely to find a new job in the next six months. A decline in confidence levels is evident for this measure as well: very likely declined from 44% in 2008 (to 39% in 2009) while those feeling it unlikely that they would find a new job increased from 28% in 2008 to 33% currently, showing one of the most significant shifts when these results are compared with The following countries post the lowest likelihood levels on this measure, with the figure in brackets indicating the proportion of respondents who felt it was not likely that they would find a job: Hungary (47%), Italy (46%), the former Yugoslav Republic of Macedonia (45%) and Lithuania (44%). Here, the reader is reminded that the former Yugoslav Republic of Macedonia and Lithuania also ranked lowest with regard to confidence levels in having a job in two years time. 21 QD14 If you were to be laid-off, how would you rate on a scale of 1 to 10, the likelihood of you finding a job in the next six months? '1' means that it "would be not at all likely" and '10' means that it "would be very likely". 36
38 On the other side of the spectrum are countries that believe the chance of finding a new job is very likely : Denmark (71%), the Netherlands (65%), Sweden (63%) and Finland (59%). Predictably, these countries were also prominent in people s confidence levels to retain their jobs. It therefore fits that countries in the EU15 states are more likely to feel they ll find a job (38% very likely), compared to NMS 12 (43% very likely). There are also higher levels of optimism in the non-euro zone (47% very likely) when compared to the Euro zone (35% very likely). Item was not previously asked for HR, MK, TR EB71.2 May-Jun 2009 / EB70.1 Oct-Nov 2008 Lithuania, one of the countries with the lowest optimism about finding a new job, also shows the highest increase in respondents believing they are not likely to find a job: from 23% in 2008 to 44% currently. Other countries showing major shifts, with more respondents feeling they re not likely to find a job include Ireland (26% to 42%), Spain (28% to 40%), Estonia (17% to 29%, although Estonians are still more optimistic than the EU average on this measure) and Hungary (35% to 47%, resulting in Hungary being the most pessimistic of all countries surveyed). 37
39 Analysis on socio-demographic variables shows the following groups are more likely to feel they won t be able to find a job: Women. Older respondents (aged 55+). Those who are lesser educated (ended their education at or before the age of 15). Manual workers (with managers showing the most optimism). People in rural villages and small towns (people in large towns show more optimism). Do not have an internet connection at home. Are not satisfied with the life they lead. Are generally pessimistic about the national employment situation, national economy and financial situation in their household. Have lost their job due to the economic crisis. Are concerned about losing their jobs, and not confident in their job stability. 38
40 QD14 If you were to be laid-off, how would you rate on a scale of 1 to 10, the likelihood of you finding a job in the next six months? '1' means that it "would be not at all likely" and '10' means that it "would be very likely". Not likely Likely Very likely EU27 33% 21% 39% 7% Sex Male 31% 21% 41% 6% Female 35% 21% 36% 7% Age % 24% 45% 5% % 22% 46% 5% % 22% 36% 6% % 14% 24% 15% Education (End of) 15-46% 20% 23% 11% % 23% 36% 7% % 20% 49% 5% Still studying Respondent occupation scale Self- employed 33% 15% 38% 14% Managers 26% 17% 53% 5% Other white collars 32% 25% 37% 5% Manual workers 36% 24% 35% 5% House persons Unemployed Retired Students Subjective urbanisation Rural village 33% 22% 37% 8% Small/mid size town 35% 22% 37% 7% Large town 29% 20% 46% 5% Internet connection at home Yes 30% 21% 43% 6% No 40% 23% 29% 9% Satis. life you lead Satisfied 30% 22% 42% 6% Not satisfied 46% 21% 25% 8% Nat. situation of employment Good 20% 17% 58% 6% Bad 36% 22% 35% 7% Situation of national economy Good 25% 18% 52% 5% Bad 35% 22% 36% 7% Financial situation household Good 29% 21% 44% 6% Bad 44% 23% 26% 7% Has lost his job Yes 40% 24% 33% 3% No 32% 21% 40% 7% Concerned about losing job No 26% 15% 53% 7% A bit 32% 30% 33% 5% Yes 43% 26% 27% 4% Job stability Confident 29% 21% 44% 6% Not confident 51% 24% 21% 4% 39
41 4.2 Expectations about the level of unemployment insurance - Unemployment is expected to lead to a cut of around 30% of current income - Just over a quarter of Europeans (28%) believe that, if they were laid off, their country s unemployment insurance would compensate them for between 51% and 70% of their current income 22. Around a fifth believe that their welfare system would pay out a sum higher than this band (though only 4% believe it to be as high as 91% to 100% of current income) while a further 28% believe it to be lower than 51% of current income. Although this question was only asked of working Europeans, 24% stated that they did not know the level of protection against loss of income offered by their country. The results show little change over time. QD16 If you were to be laid-off, how much do you think the unemployment insurance and the welfare system in (OUR COUNTRY) will compensate you for the loss of income during the first six months as a percentage of your current income? - %EU % or less of your current income 17% 17% 31 to 50% of your current income 11% 12% 51 to 70% of your current income 27% 28% 71 to 90% of your current income 16% 17% 91 to 100% of your current income 4% 4% 23% 24% 22 QD16 If you were to be laid-off, how much do you think the unemployment insurance and the welfare system in (OUR COUNTRY) will compensate you for the loss of income during the first six months as a percentage of your current income? 40
, the Netherlands (43%) and Sweden (43%).")
42 Close to two-thirds of working citizens in Luxembourg believe their country s welfare system will pay out at least 71% of their current income. This is far above the countries with the second highest perceived level of income protection: Spain (44% perceived payment of 71%+ to apply), the Netherlands (43%) and Sweden (43%). By contrast, those in the UK, Greece and Croatia do not expect a large payment, and in fact 56% of those in the UK expect a payment of 30% or less of current income (40% in Greece and 36% in Croatia state the same). Citizens in the Former Yugoslav Republic of Macedonia, Malta and Turkey show high levels of ambivalence, with more than half of working citizens not knowing what level of income protection is offered in their country. Comparing the results with 2008 shows that, overall, the perceived levels of unemployment insurance compensation have remained stable. However, some shifts at national level are evident; more British citizens believe that the insurance benefit will be 30% or less of current income (49% in 2008 to 56% currently) rather than being higher. In Malta, mentions for this band have also increased (19% to 25%) though more respondents also don t know what level of compensation is provided (43% to 51%). Similar increases over time in the level of uncertainty can also be seen in Portugal (26% to 45%) and Latvia (28% to 36%). In contrast, more of those polled in Romania now believe that the unemployment insurance will be 91% to 100% of income (4% to 12%), and more Slovenians believe their insurance will be 71% to 90% of income (14% to 30%). 41
43 Item was not previously asked for HR, MK, TR EB71.2 May-Jun 2009 / EB70.1 Oct-Nov 2008 The socio-demographic analysis shows the following groups are more likely to state the level of unemployment insurance will be at least 71% of income: Men (though it is also noted that more women are unsure of the level of insurance). Aged (25-39). Here also, it is clear that many older respondents (55+) do not know the level of unemployment insurance. Higher educated (age 20 and beyond). Close to a third of those who ended their education before the age of 16 don t know the level of insurance. White-collar workers (those who are self-employed are more likely to be unsure.) Live in rural villages. 42
44 Have an internet connection at home. Positive about the financial situation in their household. Confident in their job stability. QD16 If you were to be laid-off, how much do you think the unemployment insurance and the welfare system in (OUR COUNTRY) will compensate you for the loss of income during the first six months as a percentage of your current income? 71% or more of your current income 51 to 70% of your current income 50% or less of your current income EU27 20% 28% 28% 24% Sex Male 22% 28% 28% 22% Female 19% 27% 28% 26% Age % 28% 29% 26% % 26% 28% 23% % 30% 28% 21% % 25% 26% 34% Education (End of) 15-16% 29% 23% 32% % 28% 29% 23% % 27% 28% 21% Still studying Respondent occupation scale Self- employed 11% 16% 35% 38% Managers 21% 31% 29% 19% Other white collars 24% 28% 28% 20% Manual workers 22% 30% 25% 23% House persons Unemployed Retired Students Subjective urbanisation Rural village 24% 28% 23% 25% Small/mid size town 20% 29% 28% 23% Large town 17% 25% 34% 24% Internet connection at home Yes 22% 28% 28% 22% No 17% 25% 28% 30% Financial situation household Good 22% 28% 27% 23% Bad 17% 27% 30% 26% Job stability Confident 21% 28% 28% 23% Not confident 18% 26% 32% 24% 43
45 5. JOB SEEKING In this section, we look at whether respondents feel job mobility (changing job or sector) or geographic mobility (changing location) will assist the most in finding a job and the qualifications and experience required to find a job more easily. 5.1 Job seeking strategies - Most would first apply for a job in a different location, rather than change jobs - Citizens who are currently working were asked how, in the event of being laid off, they would find a job by applying for the same or a different job, in the same or a different location. 23 Most European working citizens feel they would find a job by applying for the same kind of job, in the same location but for a different employer (47%). Alternatively, just under a third say they would opt for the same kind of job, but in a different location (32%). Around one in ten feel they would apply for a different kind of job in another location (9%) while 13% would start their own business. QD15 If you were to be laid-off, how would you find a job? (MAX. 2 ANSWERS) -%EU By applying for the same kind of job, in the same location, but for another employer By applying for the same kind of job but in a different location By applying for a completely different kind of job in the same location By starting your own business By applying for a completely different kind of job in another location Other (SPONTANEOUS) 19% 18% 13% 14% 9% 10% 4% 5% 9% 8% 32% 32% 47% 46% Those not working were asked a similar question, 24 examining what they believe would be the easiest way of finding a job. Here it should be noted that 29% of those not working spontaneously said that they were not looking for a job. They have therefore been excluded from the analysis. 23 QD15 If you were to be laid-off, how would you find a job? (MAX. 2 ANSWERS) 24 QD17 In your opinion, what would be the easiest way to find a job? (MAX. 2 ANSWERS) 44
46 A relatively large proportion of those not working and looking for a job say they would take up any job (38%). This response has barely changed since the previous reading (37% in 2006 up to 38% now). Around a quarter of those not working further say they would apply for the same kind of job, either in the same location (27%) or a different location (21%). QD17 In your opinion, what would be the easiest way to find a job? (MAX. 2 ANSWERS) -%EU By taking up any job By applying for the same kind of job as your last one, in the same location, but for another employer By applying for the same kind of job as your last one, but in a different location By starting your own business By applying for a completely different kind of job than your last one, but still in the same location By applying for a completely different kind of job than your last one, and in a different location Other (SPONTANEOUS) 3% 4% 13% 14% 12% 12% 8% 8% 10% 9% 21% 22% 27% 27% 38% 37% Turning now to the analysis by country for 2009, and for those working, the following countries working citizens have a much higher preference for staying in the same job and same location, when compared to the other options: Turkey, Romania, Cyprus, Greece, Poland, the Czech Republic and the UK. Only four countries provide higher mentions for applying for the same job but in a different location when compared to keeping the same job and location: the former Yugoslav Republic of Macedonia, Slovenia, France, Luxembourg and The Netherlands. 45
47 QD15. If you were to be laid-off, how would you find a job? (MAX. 2 ANSWERS) By applying for the same kind of job, in the same location, but for another employer By applying for the same kind of job but in a different location By applying for a completely different kind of job in the same location By starting your own business By applying for a completely different kind of job in another location Other (SPONTANEOUS) EU27 47% 32% 19% 13% 9% 4% 9% BE 52% 27% 23% 12% 8% 4% 3% BG 55% 16% 28% 10% 6% 2% 11% CZ 54% 27% 23% 9% 6% 2% 7% 59% 35% 30% 8% 11% 3% 2% DE 51% 44% 15% 10% 11% 5% 7% EE 34% 30% 26% 11% 20% 4% 6% IE 50% 37% 16% 11% 9% 3% 14% EL 48% 26% 12% 29% 4% 0% 8% ES 45% 36% 23% 14% 13% 3% 6% FR 40% 43% 16% 15% 14% 2% 6% IT 37% 21% 18% 14% 8% 4% 16% CY 55% 27% 23% 7% 8% 2% 7% LV 43% 25% 20% 11% 12% 9% 7% LT 42% 27% 22% 9% 16% 9% 6% LU 36% 38% 10% 9% 12% 8% 9% HU 42% 32% 15% 3% 10% 2% 9% MT 36% 35% 11% 8% 17% 3% 15% NL 40% 42% 12% 14% 12% 6% 4% AT 51% 39% 24% 8% 8% 5% 5% PL 48% 17% 19% 12% 7% 2% 12% PT 50% 34% 12% 10% 6% 2% 16% RO 51% 16% 16% 14% 4% 3% 17% SI 30% 35% 15% 14% 16% 9% 4% SK 55% 25% 29% 11% 6% 2% 11% FI 41% 32% 25% 13% 9% 3% 3% SE 51% 32% 26% 14% 5% 5% 5% UK 55% 29% 23% 13% 8% 3% 6% HR 50% 26% 22% 9% 8% 4% 7% TR 46% 13% 4% 16% 5% 8% 14% MK 20% 26% 10% 28% 11% 8% 13% Highest percentage per item Highest percentage per country Lowest percentage per item Lowest percentage per country 46

48 Comparing the results with 2006, for those working, at the national level, it emerges that citizens who are now more likely to remain in the same location, with the same job, are Lithuanians, Maltese, Austrians and the Spanish. The increase in Malta for this statement can be attributed to fewer mentions of starting your own business. Austrians are more likely to stay within the same location (whether in the same or a different job) and less likely to choose a different location. Item was not previously asked for MK EB71.2 May-Jun 2009 / EB65.3 Apr-May 2006 The Spanish record increases on all statements, largely due to fewer Spaniards answering don t know to this question than in In contrast, countries that are now more inclined to apply for the same kind of job, but in a different location, include the Czech Republic, Hungary, Latvia, Ireland and Portugal. 47
49 Analysing the working respondents socio-demographic groupings show: Women tend to prefer to stay in the same job, in the same location, while men are more likely to start their own business. Those in the youngest age group (age 15-24) post higher scores on all measures with the exception of starting their own business. Respondents who have been educated for longer (age 20 or above) are more geographically mobile (applying for the same type of job, but in a different location) and more likely to start their own business. Those with lower education levels are more likely to say they ll explore other options or are unsure of what they would do. Self-employed workers are most likely to say they ll start their own business, explore other options or are unsure of what they would do. Managers show greater geographic mobility (applying for the same kind of job, but in a different location) while other white-collar workers and manual workers show greater job mobility (being open to applying for a different kind of job). Those in large towns are more likely to want to remain in the same location, whilst those in rural villages are comparatively more open to exploring other locations, suggesting an acceptance that larger towns may offer better employment prospects. Interestingly, home ownership does not seem to impact on geographic mobility, as those who own their house or apartment are as willing to change location (whilst applying for the same kind of job) as those who don t own their accommodations. 48
50 QD15 If you were to be laid-off, how would you find a job? (MAX. 2 ANSWERS) By applying for the same kind of job, in the same location, but for another employer By applying for the same kind of job but in a different location By applying for a completely different kind of job in the same location By starting your own business By applying for a completely different kind of job in another location Other (SPONTANEOUS) EU27 47% 32% 19% 13% 9% 4% 9% Sex Male 44% 33% 18% 15% 10% 3% 9% Female 51% 31% 20% 10% 8% 4% 8% Age % 37% 23% 9% 12% 2% 5% % 34% 19% 13% 10% 2% 7% % 34% 19% 13% 9% 3% 8% % 18% 17% 14% 7% 10% 18% Education (End of) 15-45% 27% 17% 10% 9% 6% 14% % 30% 21% 12% 10% 4% 8% % 37% 17% 15% 8% 3% 7% Still studying Respondent occupation scale Self- employed 28% 18% 11% 30% 7% 7% 19% Managers 50% 40% 15% 13% 7% 4% 6% Other white collars 51% 32% 21% 8% 10% 2% 7% Manual workers 51% 33% 22% 9% 11% 3% 7% House persons Unemployed Retired Students Subjective urbanisation Rural village 39% 36% 17% 13% 12% 4% 11% Small/mid size town 48% 31% 20% 13% 9% 4% 8% Large town 57% 28% 20% 12% 6% 3% 7% Ownership house/ apartment Yes 46% 32% 18% 14% 9% 3% 9% No 50% 33% 20% 10% 11% 4% 7% 49
51 Turning now to results for those not working by country, non-working citizens of the following countries are most likely to take up any job, rather than staying in the same job and same location: Slovenia, the former Yugoslav Republic of Macedonia, Italy and Latvia. In addition, Slovenia and Latvia record large increases for this statement when compared to 2006 (Slovenia: 28% to 51% for any job; Latvia: 32% to 52%) with Estonia and Spain also showing increased openness to taking up any job. By contrast, those who prefer to stay within the same job and same location, rather than taking up any job, come from the Netherlands, Cyprus, Denmark and Sweden. It should nevertheless be noted that Denmark records a decrease in willingness to stay in the same job and location and take up any job and increases in willingness to take up a different type of job (whether in the same or a different location). The Swedish are also less likely to take up any job (when compared to 2006), and show more interest in starting their own business. QD17 In your opinion, what would be the easiest way to find a job? (MAX. 2 ANSWERS) By taking up any job By applying for the same kind of job as your last one, in the same location, but for another employer By applying for the same kind of job as your last one, but in a different location By starting your own business By applying for a completely different kind of job than your last one, but still in the same location By applying for a completely different kind of job than your last one, and in a different location EU27 38% 27% 21% 13% 12% 8% 3% 10% Other (SPONTANEOUS) BE 44% 32% 27% 12% 15% 6% 2% 3% BG 40% 22% 12% 3% 10% 7% 3% 23% CZ 41% 29% 13% 10% 23% 0% 1% 6% 27% 34% 24% 9% 22% 15% 7% 7% DE 28% 31% 29% 6% 15% 9% 4% 13% EE 28% 33% 22% 20% 14% 11% 2% 8% IE 31% 31% 20% 6% 11% 6% 5% 28% EL 38% 39% 22% 17% 4% 6% 1% 2% ES 51% 29% 15% 13% 16% 8% 1% 4% FR 33% 30% 34% 19% 14% 7% 5% 5% IT 44% 11% 15% 20% 6% 7% 3% 14% CY 25% 32% 9% 10% 16% 12% 8% 13% LV 52% 20% 12% 8% 14% 8% 3% 7% LT 47% 24% 16% 10% 8% 7% 5% 7% LU 35% 20% 30% 9% 8% 8% 5% 16% HU 41% 24% 12% 8% 10% 7% 6% 6% MT 39% 18% 18% 15% 6% 4% 2% 22% NL 31% 42% 27% 10% 10% 6% 3% 3% AT 37% 36% 25% 9% 19% 9% 7% 0% PL 29% 27% 17% 22% 12% 7% 3% 4% PT 42% 19% 17% 6% 14% 4% 3% 12% RO 27% 16% 5% 12% 7% 1% 1% 43% SI 51% 12% 16% 20% 6% 12% 7% 3% SK 45% 27% 10% 25% 18% 8% 3% 8% FI 29% 29% 19% 4% 19% 9% 4% 15% SE 31% 37% 24% 12% 7% 5% 2% 17% UK 40% 39% 26% 9% 15% 12% 1% 4% HR 42% 24% 13% 16% 8% 6% 2% 12% TR 24% 23% 8% 11% 5% 4% 5% 28% MK 45% 9% 8% 30% 3% 7% 3% 9% Highest percentage per item Lowest percentage per item Highest percentage per country Lowest percentage per country 50
52 The socio-demographic analysis of those who are not working (and still excluding those who spontaneously said they were not looking for a job) shows: Men are more likely than women to apply for the same type of job (whether in the same or a different location) or to start their own business. Women, on the other hand, are more likely to say they ll take up any job. Those in the middle age groups (age 25-54) tend to prefer staying in the same job and same location. Here, younger respondents are more likely to believe they would start their own business. Better educated respondents prefer applying for the same kind of job, while lesser educated respondents would take on any kind of job. People in rural villages are also more likely to be willing to take on any kind of job. 51
53 QD17 In your opinion, what would be the easiest way to find a job? (MAX. 2 ANSWERS) By taking up any job By applying for the same kind of job as your last one, in the same location, but for another employer By applying for the same kind of job as your last one, but in a different location By starting your own business By applying for a completely different kind of job than your last one, but still in the same location By applying for a completely different kind of job than your last one, and in a different location Other (SPONTANEOUS) EU27 38% 27% 21% 13% 12% 8% 3% 10% Sex Male 35% 29% 23% 15% 13% 8% 3% 9% Female 40% 26% 19% 11% 12% 7% 2% 11% Age % 26% 21% 16% 9% 7% 2% 13% % 30% 21% 12% 14% 10% 4% 4% % 30% 23% 10% 15% 7% 2% 6% % 19% 11% 14% 13% 7% 2% 19% Education (End of) 15-44% 24% 15% 10% 14% 8% 2% 11% % 30% 21% 11% 13% 8% 3% 6% % 31% 27% 13% 17% 10% 4% 5% Still studying 33% 26% 21% 18% 9% 6% 3% 15% Subjective urbanisation Rural village 42% 25% 21% 12% 10% 9% 2% 9% Small/mid size town 39% 26% 20% 14% 14% 6% 3% 10% Large town 32% 31% 21% 13% 12% 8% 3% 11% 52
54 5.2 The importance of qualifications and professional experience - Europeans continue to place high importance on professional experience and qualifications as key assets for employability - More than half of Europeans feel that the level of professional experience (54%) and one s qualifications (52%) are the two most important assets to emphasise in order to find a job easily today. 25 These two assets stand apart from the other options measured, and professional experience has increased from 51% in 2006 to 54% currently. QD6 In your opinion, which two assets should one emphasize in order to easily find a job today? (MAX. 2 ANSWERS) - %EU Professional experience Level of one s qualifications 54% 51% 52% 51% Ability to adapt Computer skills Language skills Willingness to work abroad None of these (SPONTANEOUS) Other (SPONTANEOUS) 6% 5% 1% 1% 2% 2% 2% 2% 19% 19% 17% 21% 34% 35% The 2009 national analysis reveals some interesting trends. The French place less importance on the level of one s qualifications (37%) and opt rather to emphasise professional experience (70%) as well as the ability to adapt (55%). Citizens in Malta and Cyprus follow a similar trend: both place considerable emphasis on the level of one s qualification (70% for both Cyprus and Malta), whilst just under half choose professional experience (46% and 45% for Malta and Cyprus respectively) but then post results higher than the EU average for computer skills (32% for Malta and 30% for Cyprus compared to the EU average of 19%). 25 QD6 In your opinion, which two assets should one emphasize in order to easily find a job today? (MAX. 2 ANSWERS) 53
55 Germany and the Netherlands also place the main emphasis on the level of one s qualifications, with more than two-thirds of citizens in these countries choosing this attribute. Although the Danish emphasise the level of one s qualification (56%), the ability to adapt is also important in this country, ranking second (53%). Looking at the country groupings, it is noted that, when comparing EU15 with NMS12, those in EU15 are more likely to emphasise professional experience (54%), the ability to adapt (36%) and computer skills (19%), whereas those in NMS12 are more likely to emphasise the level of one s qualifications (55%) and language skills (24%). 54
56 QD6 In your opinion, which two assets should one emphasize in order to easily find a job today? (MAX. 2 ANSWERS) Professional experience Level of one s qualifications Ability to adapt Computer skills Language skills Willingness to work abroad None of these (SPONTANEOUS) Other (SPONTANEOUS) EU27 54% 52% 34% 19% 17% 6% 1% 2% 2% BE 56% 57% 30% 16% 28% 4% 0% 1% 0% BG 53% 54% 17% 22% 25% 5% 1% 0% 5% CZ 58% 54% 35% 18% 21% 1% 1% 1% 1% 42% 56% 53% 21% 16% 4% 0% 1% 1% DE 42% 67% 34% 22% 17% 5% 0% 2% 1% EE 47% 50% 25% 18% 41% 4% 0% 3% 2% IE 44% 64% 37% 21% 10% 8% 1% 2% 2% EL 58% 54% 15% 29% 21% 4% 1% 5% 0% ES 67% 53% 26% 7% 13% 5% 1% 4% 2% FR 70% 37% 55% 9% 8% 11% 0% 1% 1% IT 51% 45% 27% 19% 22% 10% 2% 3% 1% CY 45% 70% 20% 30% 18% 2% 0% 7% 0% LV 48% 36% 34% 12% 33% 8% 3% 6% 1% LT 68% 61% 22% 13% 15% 2% 1% 2% 2% LU 44% 61% 31% 13% 33% 7% 0% 1% 1% HU 58% 48% 28% 15% 25% 4% 1% 4% 2% MT 46% 70% 22% 32% 7% 5% 1% 2% 1% NL 53% 67% 41% 15% 11% 2% 0% 3% 1% AT 58% 48% 31% 28% 16% 10% 1% 1% 1% PL 44% 55% 23% 15% 34% 5% 1% 2% 3% PT 64% 52% 23% 12% 7% 6% 2% 2% 3% RO 61% 64% 21% 14% 7% 3% 0% 2% 5% SI 53% 45% 30% 17% 26% 6% 3% 4% 1% SK 48% 42% 28% 24% 40% 7% 1% 1% 2% FI 56% 51% 46% 11% 22% 3% 0% 2% 2% SE 42% 54% 51% 20% 14% 4% 1% 5% 1% UK 50% 42% 41% 34% 10% 4% 1% 2% 2% HR 47% 45% 30% 26% 25% 5% 2% 2% 2% TR 42% 35% 15% 25% 32% 2% 4% 4% 10% MK 33% 36% 16% 35% 36% 8% 3% 6% 3% Highest percentage per item Highest percentage per country Lowest percentage per item Lowest percentage per country 55
57 Comparing the results at national level from 2006 to 2009 shows: The rise in overall mentions for professional experience is largely due to citizens in Malta, the Czech Republic, Cyprus and Romania who increased mentions of this asset by at least 10 percentage points QD6 In your opinion, which two assets should one emphasize in order to easily find a job today? (MAX. 2 ANSWERS) Answer 'professional experience' FR LT ES PT RO AT HU EL CZ FI BE EU27 SI NL BG IT UK SK LV EE MT CY PL LU IE SE DE % 71% 68% 65% 67% 61% 64% 62% 61% 51% 58% 55% 58% 54% 58% 58% 58% 47% 56% 59% 56% 49% 54% 51% 53% 48% 53% 55% 53% 53% 51% 50% 50% 49% 48% 47% 48% 50% 47% 46% 46% 34% 45% 35% 44% 41% 44% 39% 44% 47% 42% 40% 42% 39% 42% 37% 56
58 Belgians now place greater emphasis on the level of one s qualifications and professional experience at the expense of language skills and computer skills The British have increased their mentions of computer skills and decreased mentions of language skills Latvians have higher mentions particularly for the ability to adapt and to some extent the willingness to work abroad and record fewer mentions of level of one s qualifications On a socio-demographic level, we find: Men are more likely to emphasise professional experience compared to women. Women, on the other hand, are more likely to mention computer skills. The youngest age group is more likely to mention level of one s qualifications and language skills while those in the middle age groups (aged 25-54) place greater emphasis on professional experience and ability to adapt than their younger and older counterparts. Better educated people, and those who are still studying, emphasise the level of one s qualifications more. Better educated respondents also mention the ability to adapt more. Students see greater value in language skills. Managers place greater emphasis on the level of one s qualifications and the ability to adapt. Other white-collar workers and house persons are more likely to mention computer skills. Manual workers place greater emphasis on professional experience and the ability to adapt. Finally, students place emphasis on the level of one s qualifications and language skills. QD6 In your opinion, which two assets should one emphasize in order to easily find a job today? (MAX. 2 ANSWERS) Professional experience Level of one s qualifications Ability to adapt Computer skills Language skills Willingness to work abroad None of these (SPONTANEOUS ) Other (SPONTANEOUS ) EU27 54% 52% 34% 19% 17% 6% 1% 2% 2% Sex Male 58% 51% 35% 17% 16% 6% 1% 3% 1% Female 51% 53% 33% 20% 18% 6% 1% 2% 2% Age % 56% 30% 20% 24% 7% 1% 2% 1% % 50% 36% 17% 15% 5% 1% 3% 1% % 50% 38% 19% 14% 5% 1% 3% 1% % 53% 30% 19% 17% 7% 1% 2% 4% Education (End of) 15-53% 49% 31% 20% 14% 6% 2% 2% 4% % 49% 36% 20% 15% 5% 1% 2% 1% % 58% 38% 15% 17% 6% 0% 3% 1% Still studying 42% 60% 26% 21% 31% 8% 1% 2% 1% Respondent occupation scale Self- employed 57% 50% 36% 15% 16% 6% 2% 3% 1% Managers 54% 60% 42% 15% 16% 4% 0% 2% 0% Other white collars 59% 48% 35% 23% 16% 4% 1% 2% 0% Manual workers 62% 48% 40% 16% 13% 6% 1% 2% 1% House persons 49% 54% 26% 23% 18% 7% 1% 3% 3% Unemployed 58% 44% 31% 18% 14% 7% 2% 4% 2% Retired 49% 54% 30% 19% 17% 6% 1% 2% 4% Students 42% 60% 26% 21% 31% 8% 1% 2% 1% 57

59 6. TRAINING In this section, respondents were asked whether they had participated in training in the past 12 months. Workers then self-assess their level of education and training; whether it is sufficient in order to keep their job, and non-workers are asked a similar question in the context of them finding a job soon. Analysis then turns to the perceived obstacles among those who would like to have training, but feel they can t access it, and find that most people feel affordability is the main barrier to further education or training. This is placed in context when assessing, amongst those who have received training, how the training was funded. 6.1 Participation in training in the past 12 months - Around one in five of those sampled have recently participated in training courses - Just over one in five respondents (22%) have participated in training course in the past 12 months 26, a figure that has declined from 24% in On this measure, Sweden stands out as more than half of the respondents from the country had participated in training recently (55%). This is followed by Finland (42%), the Netherlands (38%), Denmark (33%) and the UK (30%). Countries where fewer respondents have recently received training include Greece (6%), Bulgaria (8%), and Italy (11%). Looking at the country groupings, the highest levels of training can therefore be found in Finland, Austria and Sweden (41%), and a higher incidence in the EU15 (24%) when compared to NMS12 (17%). 26 QD9. During the last 12 months, have you participated in any training courses? 58
60 Comparing the results with the 2006 Eurobarometer, on a country level, shows that the following countries indicate higher levels of training: Luxembourg (22% to 28%), Spain (16% to 20%), Germany (23% to 26%) and Romania (10% to 13%). However, in most countries, fewer respondents have received training particularly in Belgium (30% to 21%), Cyprus (18% to 12%), the UK (34% to 30%), Greece (10% to 6%) and the Netherlands (42% to 38%). Item was not previously asked for MK EB71.2 May-Jun 2009 / EB65.3 Apr-May
61 The socio-demographic analysis shows: Men are more likely to have received training than women. Those in the middle age groups (age 25-54) are more likely to have received training. People who are better educated are more likely to have received training. Managers are most likely to have received training, and in fact, more managers have received training than not. As expected, pensioners and house persons are the least likely to have received training. In general, people who are optimistic about the national situation of employment, the national economy and their household s financial situation are more likely to have received training. Interestingly, there is no difference in the incidence of training amongst those who have lost their jobs due to the economic crisis, and those who haven t, though those who are concerned about losing their jobs, and are not confident about their job stability, are less likely to have received training. 60
62 QD9 During the last 12 months, have you participated in any training courses? Yes No EU27 22% 77% 1% Sex Male 24% 75% 1% Female 20% 78% 2% Age % 73% 2% % 67% 1% % 69% 1% % 91% 2% Education (End of) 15-6% 93% 1% % 77% 1% % 61% 1% Still studying 21% 76% 3% Respondent occupation scale Self- employed 26% 73% 1% Managers 58% 42% - Other white collars 35% 64% 1% Manual workers 29% 70% 1% House persons 6% 92% 2% Unemployed 18% 82% - Retired 3% 95% 2% Students 21% 76% 3% Nat. situation of employment Good 30% 68% 2% Bad 21% 78% 1% Situation of national economy Good 29% 69% 2% Bad 21% 78% 1% Financial situation household Good 27% 72% 1% Bad 14% 84% 2% Has lost his job Yes 23% 77% - No 22% 76% 2% Concerned about losing job No 38% 61% 1% A bit 28% 71% 1% Yes 24% 75% 1% Job stability Confident 40% 60% - Not confident 19% 79% 2% 61

63 6.2 Assessment of training required to retain current employment - Most workers feel their education and training to date has been sufficient - The majority of workers (62%) feel their education and training to date is sufficient to keep their jobs 27. This figure has increased from 58% in Just under one in five feel they need further training, and that they will get this training (19%) while 13% feel they require further training but are not likely to receive it. Countries where workers are most likely to feel their education and training to date has been sufficient include Greece (82%), the Czech Republic (81%), Bulgaria (80%), Netherlands (79%), Cyprus (78%), Slovakia (78%) and Sweden (76%). Here it should be noted that there are several countries where a higher proportion of the overall population has recently received training and workers report they feel their training is sufficient; the Netherlands, Sweden and Finland. In addition, when comparing this year s results with 2006, substantially more people feel their education and training is sufficient in the Netherlands (51% to 79%), with large increases also noted for Hungary (42% to 55%), Belgium (63% to 75%), Finland (63% to 73%), Latvia (56% to 66%) and Poland (48% to 58%). 27 QD11. Thinking about yourself, do you think that in order for you to keep your job...? Your education and training to date is sufficient; You should follow a more specialised training but you cannot currently do this; You should follow training and you will do so. 62
64 Item was not previously asked for MK EB71.2 May-Jun 2009 / EB65.3 Apr-May 2006 Despite the increase for sufficient training in Hungary, this country still has the highest proportion of workers saying they should follow training but can t (30%), followed by Malta (21%) and Croatia (20%). In Portugal and Spain there are increased mentions for needing training which cannot be obtained (when compared to 2006) and a decline in the number of workers now feeling their education and training is sufficient. The countries in which most workers anticipate acquiring more training are Germany (30%), Austria and Denmark (respectively at 29% and 28%). Again it is noted that respondents in these countries are more likely to have received training in the past 12 months, further indicating that conditions are conducive to receiving training in these countries. 63

65 From a socio-demographic perspective, workers who are most likely to feel their education and training to date is sufficient are more often: Older (age 40+). Self-employed. Owners of their house/apartment. Satisfied with the life they lead. Those who have not lost their jobs due to the impact of the economic crisis. Not concerned about losing their jobs and confident about their job stability. 64
66 QD11 Thinking about yourself, do you think that in order for you to keep your job...? Your education and training to date is sufficient You should follow a more specialised training but you cannot currently do this You should follow training and you will do so EU27 62% 13% 19% 6% Sex Male 62% 12% 20% 6% Female 61% 13% 19% 7% Age % 15% 25% 5% % 14% 23% 5% % 12% 18% 5% % 8% 10% 13% Respondent occupation scale Self- employed 65% 10% 17% 8% Managers 60% 9% 27% 4% Other white collars 62% 14% 19% 5% Manual workers 61% 15% 17% 7% House persons Unemployed Retired Students Ownership house/ apartment Yes 64% 12% 18% 6% No 56% 14% 23% 7% Satis. life you lead Satisfied 63% 11% 21% 5% Not satisfied 55% 19% 14% 12% Has lost his job Yes 51% 21% 23% 5% No 62% 12% 19% 7% Concerned about losing job No 68% 7% 21% 4% A bit 60% 15% 20% 5% Yes 57% 18% 17% 8% Job stability Confident 66% 10% 20% 4% Not confident 47% 25% 18% 10% 65

67 6.3 Assessment of training required to find employment - Most non-workers feel they would require further education and training in order to find a job - Those respondents who are currently not working were asked whether they feel their education and training is sufficient in order to find a job soon 28. Here it should be noted that more than a third of non-workers (36%) say spontaneously that they are not looking for a job. These respondents have been excluded from the following analysis. Most non-workers say they would need to follow more specialised training, and intend to do this (33%), a similar proportion feeling their education and training to date is sufficient (31%) and around a quarter feel they should receive more training, but cannot currently do so (26%). Comparing the results with the 2008 Eurobarometer shows that slightly fewer respondents now feel their education and training is sufficient (34% to 31%) whilst slightly more feel they should follow training, and will do so (31% to 33%). 28 QD12. Thinking about yourself, do you think that in order to find a job soon? Your education and training to date is sufficient; You should follow a more specialised training but you cannot currently do this; You should follow a more specialised training and you intend doing this. 66

68 The Dutch stand out in that 61% of non-workers feel their education and training is up-to-date. The reader is reminded that a large proportion of working Dutch respondents stated the same and, overall, the Netherlands ranked third in terms of receiving training in the past 12 months, indicating high levels of education and training overall. Turning back to the findings from non-workers, other countries with high proportions of non-workers feeling their education and training to date is sufficient include the Czech Republic (48%) and Slovakia (46%). These two countries working counterparts also show higher mentions for this attribute although, overall, the incidence of receiving training is on par with the EU27 average. Comparing the results for this attribute with the findings from 2008 shows increased mentions of sufficient education and training in Greece (26% to 43%), Slovakia (28% to 46%) and Estonia (20% to 36%). The countries with the highest proportions of non-workers who say they should follow a more specialised training but cannot currently do so mirror the results for workers; Hungary (43%), Malta (38%), Latvia (37%), Italy (36%) and Croatia (31%). Three countries show the greatest increase in mentions on this attribute: Italy (29% to 36%), Luxembourg (13% to 19%) and Germany (19% to 25%). Finally, countries with higher proportions of non-workers saying they should follow training and intend to do so include Finland (48%), France (44%), Denmark (43%) and Spain (42%, with a large increase since 2008 s result of 23%). 67
69 The socio-demographic analysis, for non-workers (still excluding those respondents who are not looking for a job) shows that: Men are more likely to feel their education and training is sufficient, or that they should follow more training and intend to do this. More women than men state they should follow training, but cannot currently do this. The youngest respondents (aged 15-24) are most likely to say they need more specialised training and intend to obtain this. Those in the middle age groups are more likely to say they need training, and can t currently obtain it, whilst older respondents are more likely to say their education and training to date has been sufficient. As might be expected, better educated respondents are more likely to say their training is sufficient, and students are more likely to say they should follow more training, and intend to do so. Respondents who ended their education by the age of 15 state that, though they need more training, they cannot currently obtain it. Those in rural villages are more likely to say their training is sufficient, those in small- or mid-sized towns show higher mentions for needing training, but not being able to obtain it, and those in large towns are more likely to follow through with their training needs. Those without an internet connection are more likely to feel they can t get the training they need. People satisfied with their lives are more likely to intend getting the training they require. People who are optimistic about the national employment situation, the national economy and the financial situation in their household are more likely to intend getting the training they need. Interestingly, those who have lost their jobs due to the impact of the economic crisis are more likely to feel their education and training is sufficient. However, they re also more likely to say they need education and can t get it. 68
70 QD12 Thinking about yourself, do you think that in order to find a job soon? Your education and training to date is sufficient You should follow a more specialised training but you cannot currently do this You should follow a more specialised training and you intend doing this EU27 31% 26% 33% 10% Sex Male 34% 20% 37% 9% Female 29% 30% 30% 10% Age % 17% 45% 10% % 32% 30% 6% % 34% 20% 10% % 26% 11% 22% Education (End of) 15-26% 41% 20% 13% % 32% 27% 8% % 23% 26% 6% Still studying 28% 12% 49% 11% Subjective urbanisation Rural village 34% 25% 30% 11% Small/mid size town 30% 29% 33% 8% Large town 31% 22% 36% 11% Internet connection at home Yes 33% 22% 38% 7% No 29% 33% 23% 14% Satis. life you lead Satisfied 32% 22% 38% 8% Not satisfied 31% 35% 22% 13% Nat. situation of employment Good 34% 21% 36% 9% Bad 31% 26% 32% 10% Situation of national economy Good 34% 23% 34% 9% Bad 31% 27% 33% 9% Financial situation household Good 33% 19% 39% 9% Bad 30% 33% 27% 10% Has lost his job Yes 36% 29% 28% 7% No 29% 24% 36% 11% 69
71 6.4 Perceived obstacles to training - Affordability is the greatest obstacle to further training - Respondents (both working and non-working) who previously said they would like further training, but cannot obtain it, were asked the main barrier to taking part in a training course 29. Here, more than a third say the main reason is you cannot afford it (37%), a measure that has remained stable since The second most cited reason is you do not have time because of family responsibilities (24%, and slightly down from 26% in 2006). These two reasons stand out from the other issues preventing people from taking part in training: training conflicts with your work schedule (18%), your current employer will not support you (17%) and you do not know of any training offers (15%). QD13 From the following list, what are the main reasons preventing you from taking part in a training course? (MULTIPLE ANSWERS POSSIBLE) -%EU You cannot afford it You do not have time because of family responsibilities Training conflicts with your work schedule Your current employer will not support you You do not know about any training offers There is no training offered close enough to where you are You cannot participate for other personal reasons You do not have the necessary experience or qualifications Your age prevents you from doing it You are not comfortable with the idea of going back to something that is like school Your health prevents you from doing it Other (SPONTANEOUS) 18% 17% 17% 18% 15% 13% 12% 16% 9% 8% 9% 9% 8% 10% 7% 6% 4% 4% 5% 7% 4% 5% 24% 26% 37% 37% Looking at the results on a country level, Hungary and Latvia have the highest levels of people saying they cannot afford it (60% and 57% respectively). (The reader may recall that workers and non-workers in Hungary and Latvia posted some of the highest proportions for being unable to follow training, and affordability is now revealed as the most serious barrier.) Other countries where people cite affordability as their main deterrent include Ireland (50%), Portugal (50%), Slovenia (49%) and Romania (48%). 29 QD13 From the following list, what are the main reasons preventing you from taking part in a training course? (MULTIPLE ANSWERS POSSIBLE) 70
72 In this regard, it should be noted that the Irish have increased their mentions of affordability from 13% in 2006 to 50% currently with relatively higher mentions also in the Czech Republic (21% to 43%) and Latvia (38% to 57%). Item was not previously asked for MK EB71.2 May-Jun 2009 / EB65.3 Apr-May 2006 There are only four countries where the mentions for you do not have time because of family responsibilities is higher than you cannot afford it, namely Cyprus (61%, though bear in mind it is based on a smaller sample of n=46), Malta (37%), the UK (37%) and Luxembourg (34%, again based on a small sample of n=41). 71
73 QD13 From the following list, what are the main reasons preventing you from taking part in a training course? (MULTIPLE ANSWERS POSSIBLE) You cannot afford it You do not have time because of family responsibilities Training conflicts with your work schedule Your current employer will not support you You do not know about any training offers There is no training offered close enough to where you are You cannot participate for other personal reasons You do not have the necessary experience or qualifications Your age prevents you from doing it You are not comfortable with the idea of going back to something that is like school Your health prevents you from doing it Other (SPONTANEOUS) EU27 37% 24% 18% 17% 15% 12% 9% 9% 8% 7% 4% 5% 4% BE 33% 20% 27% 11% 15% 13% 17% 13% 7% 15% 9% 11% - BG 40% 20% 7% 7% 22% 21% 10% 13% 12% 7% 7% - 9% CZ 43% 14% 13% 19% 25% 28% 7% 10% 5% 9% 7% 9% - 27% 19% 27% 19% 10% 9% 7% 10% 7% 2% 5% 15% 5% DE 29% 18% 25% 25% 19% 11% 8% 19% 9% 9% 5% 8% 2% EE 44% 15% 18% 17% 13% 22% 11% 5% 4% 4% 3% 4% 8% IE 50% 10% 16% 16% 19% 12% 9% 6% 7% 7% 2% 6% 11% EL 37% 33% 19% 20% 33% 23% 10% 7% 16% 1% - - 2% ES 27% 25% 26% 11% 19% 11% 6% 6% 5% 8% 2% 4% 4% FR 41% 24% 14% 20% 11% 19% 8% 5% 7% 7% 6% 6% 4% IT 39% 23% 16% 20% 9% 13% 7% 11% 9% 8% 3% 3% 2% CY 18% 61% 7% 13% 9% 1% 10% - 10% - - 8% 4% LV 57% 18% 20% 5% 10% 18% 8% 6% 7% 6% 4% - 1% LT 42% 13% 9% 13% 14% 15% 21% 6% 8% 1% 5% 9% 4% LU 22% 34% 10% 20% 9% 4% 8% 12% 10% 4% 3% 6% 7% HU 60% 24% 11% 21% 19% 18% 11% 12% 11% 1% 4% 1% 1% MT 15% 37% 22% - 5% 4% 24% 14% 3% 5% - 5% 12% NL 37% 23% 12% 12% 12% 9% 14% 13% 14% 10% 15% 15% 4% AT 42% 33% 30% 24% 12% 12% 8% 10% 9% 11% 2% 1% 3% PL 41% 26% 13% 21% 16% 12% 12% 8% 8% 6% 4% 5% 5% PT 50% 16% 11% 13% 13% 9% 7% 10% 4% 1% 2% 2% 3% RO 48% 20% 12% 14% 20% 15% 8% 12% 7% 6% 3% 1% 15% SI 49% 8% 12% 17% 12% 3% 14% 8% 11% 7% 7% 12% - SK 29% 17% 14% 22% 10% 19% 2% 7% 6% 13% 8% 5% 16% FI 20% 28% 22% 12% 2% 9% 8% 2% 9% 2% - 11% - SE 30% 6% 16% 18% 7% 13% 5% - 15% 8% 7% 10% 10% UK 36% 37% 17% 11% 12% 2% 10% 3% 7% 4% 6% 3% 4% HR 45% 22% 13% 11% 4% 8% 8% 3% 7% 5% 1% 4% 10% TR 44% 12% 15% 2% 9% 3% 22% 2% 3% 2% 1% 4% 10% MK 28% 17% 4% 7% 10% 12% 14% 5% 16% 1% 4% 3% 15% Highest percentage per item Highest percentage per country Lowest percentage per item Lowest percentage per country 72
74 Looking at socio-demographic variables, it can be seen that: Men are more likely to cite affordability, lack of employer support and training conflicting with their work schedule, whereas women are more likely to mention family responsibilities and not being aware of training available. Those who ended their education earlier are more likely to mention affordability and lacking the necessary experience or qualifications. Better educated respondents are more likely to see a lack of employer support and work schedule conflicts as major deterrents. Self-employed people are more likely to mention work schedule conflicts, whilst other employed respondents are more likely to view lack of employer support as a barrier. House persons view family responsibilities as one of the main deterrents, but are also more likely to be unaware of any training offers. For the unemployed, affordability is the main concern. Those in rural villages are more likely to say there is no training offered close to where they are, compared to those in towns. 73
75 6.5 Financing training - Employers are playing a large role in financing training - We have seen that a lack of financial resources is the main barrier to embarking on further training. Within this context, we look at how people who have received training financed it 30. For the majority of people who received training in the past 12 months, their current employer funded the training (58%), indicating the large role employers are playing in developing the skills of their employees. Alternatively, respondents funded the training themselves (21%) or the government / a public organisation within the country provided funding (17%). Mentions of the European Union are low at only 4%, though showing some increase since the previous measure of 2% in QD10 Who funded this training? Was it? (MULTIPLE ANSWERS POSSIBLE) - %EU Your current employer 58% 57% Yourself The (NATIONALITY) Government and\ or a public organisation within (OUR COUNTRY) 21% 23% 17% 19% The European Union 4% 2% Other (SPONTANEOUS) 5% 4% 1% 1% On a country level, and still looking at respondents who have received training in the past 12 months, the following countries show the highest incidence of funding being provided by the current employer, and for at least two-thirds of trainees: the Czech Republic, the Netherlands, Finland, UK and Germany. Here it is noted that the latter four countries previously showed higher incidences of training in the past 12 months. It appears, therefore, that where employer funding is involved, there is a higher incidence of training, suggesting the importance of this mechanism. 30 QD10. Who funded this training? Was it? Your current employer; The (NATIONALITY) Government and\ or a public organisation within (OUR COUNTRY); The European Union; Yourself. 74
76 Countries with the highest incidence of receiving training through the funding of the government or a public organisation include Greece (56%) and Malta (46%), followed by Cyprus (37%), Spain (36%) and Turkey (36%). Specifically for Greece, Cyprus and Turkey, the reader is reminded that the incidence of people receiving training in these countries is low. We now see that, where people have received training, it tended to be funded by the government or another public agency. In Greece and Turkey, the proportion of trainees receiving funding from the government is higher than those who received funding from their employers which could partially be explained by the higher levels of unemployment in these two countries, especially in Turkey (68% unemployed). The overall conclusion remains that training funded privately through employers seems to have a larger reach than other initiatives. At least a third of people in Hungary, Latvia and Italy funded their training themselves. For the European Union, the highest proportion of beneficiaries from EU funding can be found in Poland (19%, and increasing from 12% in 2006), Portugal (14%, up from 6% in 2006), Spain (12% vs. 4% in 2006), Greece (12%) and Estonia (10% vs. 4% in 2006). The EU is also appears to be more active in funding countries in the NMS12 (10%) compared to EU15 (3%). This tends to reflect actual funding levels under EU instruments such as the European Social Fund. 75
77 QD10 Who funded this training? Was it? (MULTIPLE ANSWERS POSSIBLE) Answer 'the European Union' PL PT ES EL EE SK LV SI LT CY IE MT IT EU27 CZ RO BG UK SE FI AT NL HU LU FR DE BE 0% 0% 1% 1% 1% 1% 1% 1% 1% 1% 1% 1% 1% 1% 1% 1% 1% 1% 1% 1% 1% 1% 2% 2% 2% 2% 2% 2% 2% 2% 3% 3% 3% 3% 4% 4% 4% 4% 4% 4% 4% 5% 5% 5% 5% 5% 6% % 9% 8% 12% 12% 12% 14% 17% 19% 76
78 The socio-demographic results show: Men's training is more likely to be financed by their current employer, while women mention the government or paying themselves more than men. As might be anticipated, those who are self-employed tend to have to pay for the training themselves, while those who are working receive funding from their employers. For the few house persons and unemployed who received training, most of it was funded by the government, although around a third paid for it themselves. Students rely equally on government funding and paying for the training themselves. QD10 Who funded this training? Was it? (MULTIPLE ANSWERS POSSIBLE) Your current employer Yourself The (NATIONALITY) Government and\ or a public organisation within (OUR COUNTRY) The European Union Other (SPONTANEOUS) EU27 58% 21% 17% 4% 5% 1% Sex Male 61% 20% 15% 4% 5% 1% Female 55% 23% 19% 4% 5% 1% Age % 28% 26% 4% 10% 1% % 20% 17% 4% 4% 1% % 17% 15% 3% 3% 1% % 25% 10% 4% 6% 1% Respondent occupation scale Self- employed 22% 61% 13% 2% 6% 0% Managers 78% 14% 12% 4% 1% 0% Other white collars 82% 11% 6% 3% 2% 1% Manual workers 74% 12% 14% 3% 3% 1% House persons 10% 34% 42% 7% 6% 7% Unemployed 12% 23% 50% 6% 11% 1% Retired 10% 49% 24% 5% 14% 1% Students 7% 35% 35% 8% 19% 2% 77
79 7. ATTITUDES TOWARD EMPLOYMENT In this section, respondents attitudes toward employment are measured on two specific aspects: an evaluation of the concept of flexicurity, which combines flexibility and employment security and the effectiveness of certain measures aimed at getting more people into work and staying at work for longer. 7.1 Europeans and Flexicurity - Respondents agree with the assumptions that underlie the concept of flexicurity - 'Flexicurity' is a policy approach that combines different aspects of a more flexible labour market with employment security and social protection. Five proposals directly or indirectly corresponding to the various measures for 'flexicurity' were submitted to interviewees for their evaluation 31. The analysis of the results demonstrates that overall a large majority of citizens agree with four of the five proposals which underpin the concept of 'flexicurity' (between 71% and 88%). The results for these statements are also stable since the previous measure in However, public opinion is divided on the question of retirement (43% of respondents believe that in their countries many people retire too early, while 49% do not agree with this statement). The statement regular training improves one s job opportunities receives the highest agreement of all: 88% of respondents agree with it. In addition, around two-thirds of respondents feel that being able to change easily from one job to another is a useful asset to help people find a job nowadays (76%). This finding fits with the fact that a large majority of EU citizens (73%) recognise that it is no longer possible to spend one's entire working life with the same employer. Finally, just over 7 in 10 respondents agree with the statement work contracts should become more flexible to encourage job creation. 31 QD18 Please tell me, for each of the following statements, to what extent you agree or disagree with it. 78
80 QD18. Please tell me, for each of the following statements, to what extent you agree or disagree with it. Answer 'agree' - % EU Regular training improves one s job opportunities 88% 88% Being able to change easily from one job to another is a useful asset to help people find a job nowadays 76% 76% Life-time jobs with the same employer are a thing of the past 73% 75% Work contracts should become more flexible to encourage job creation 71% 71% In (OUR COUNTRY) many people retire too early 43% 45% Analysis on a country level shows the countries where most people feel lifetime jobs are a thing of the past includes Hungary (89%), Sweden (84%), Greece and Austria (both 83%), which contrasts with the lowest levels of agreement recorded in Lithuania (41%), Italy (56%) and Luxembourg (59%). 79
 and Ireland (86%) and least likely in the Czech Republic (57%) and the Netherlands")
81 People feeling work contracts should become more flexible are most likely to be found in Slovenia, Croatia (both 87%) and Ireland (86%) and least likely in the Czech Republic (57%) and the Netherlands (59%). 80

82 The Danish, Latvians and Slovaks are most likely to agree that being able to change easily from one job to another is a useful asset to help people find a job nowadays as more than nine in ten respondents agree with this statement. In comparison, only around half of Greeks, Cypriots and Turks state the same. 81
 which")
83 On the issue of retirement, the countries show great variance of responses. More than 7 in 10 of those in Hungary and Croatia feel that people in their country retire too early (77% and 71% respectively) which contrasts sharply with the 13% in Lithuania and 16% in Estonia. 82

84 Finally, countries where the most citizens believe that regular training improves one s job opportunities include Denmark, Cyprus (both 97%), Estonia, Malta and Sweden (all 95%). We have already seen that Sweden, Finland, the Netherlands and Denmark have the highest incidence of people receiving training in the past 12 months; the same countries also rank highest in terms of people believing that regular training improves one s job opportunities. In all countries, at least 7 in 10 respondents agree that training is beneficial for one s job opportunities, though it is still interesting to note that the countries with the lowest levels of agreement on this statement tend to be those with a lower incidence of people having participated in training during the past 12 months, namely Bulgaria, Hungary and Italy. Turning now to changes in views on the key flexicurity statements, we can see that in Malta and Austria the numbers agreeing that lifetime jobs with the same employer are a thing of the past have increased markedly when compared with the 2006 Eurobarometer (62% to 70% for Malta; 75% to 83% for Austria), whilst large decreases are found in Lithuania (50% to 41%), Poland (74% to 65%) and Latvia (69% to 61%). These country differences can be set against an overall decline or two points across the EU27 (75% to 73%). 83
85 QD18.1 'Life-time jobs with the same employer are a thing of the past' % agree Change EB EB (% points) EU27 75% 73% -2% MT 62% 70% +8% AT 75% 83% +8% RO 73% 76% +3% SI 79% 82% +3% CZ 71% 73% +2% BG 58% 60% +2% IE 80% 82% +2% SE 83% 84% +1% HU 88% 89% +1% ES 69% 70% +1% PT 81% 82% +1% SK 82% 82% = IT 57% 56% -1% EL 84% 83% -1% UK 83% 81% -2% NL 68% 66% -2% 81% 79% -2% BE 74% 72% -2% DE 83% 80% -3% LU 62% 59% -3% EE 73% 69% -4% FR 83% 78% -5% FI 83% 77% -6% CY 66% 60% -6% LV 69% 61% -8% PL 74% 65% -9% LT 50% 41% -9% 84
86 Results for the statement work contracts should become more flexible to encourage job creation are stable at the EU27 level. However increased levels of agreement occur in Belgium (73% to 77%) and Slovakia (67% to 71%). Such an increase is also seen in Italy but this is largely due to more respondents expressing an opinion, compared to the 2006 survey. QD18.2 'Work contracts should become more flexible to encourage job creation' % agree Change EB EB (% points) EU27 71% 71% = IT 63% 67% +4% BE 73% 77% +4% SK 67% 71% +4% IE 84% 86% +2% 82% 83% +1% FR 68% 69% +1% MT 81% 82% +1% HU 84% 84% = CZ 58% 57% -1% ES 62% 61% -1% SE 70% 69% -1% AT 76% 75% -1% UK 81% 80% -1% BG 84% 83% -1% NL 61% 59% -2% FI 78% 76% -2% EE 81% 79% -2% CY 84% 82% -2% RO 86% 84% -2% SI 89% 87% -2% LV 83% 79% -4% PL 85% 80% -5% EL 75% 70% -5% LT 85% 79% -6% PT 69% 62% -7% DE 71% 64% -7% LU 75% 68% -7% 85
87 On the issue of retirement, more people in Latvia, Poland and Slovakia agree that people in their country retire too early than was the case in 2006 (although a greater proportion of Latvians is now prepared to offer an opinion). In contrast, respondents from the following countries are now more likely to disagree: Malta, Spain, Slovenia, Germany and Portugal. QD18.4 'In (OUR COUNTRY) many people retire too early' % agree Change EB EB (% points) EU27 45% 43% -2% LV 45% 55% +10% PL 41% 49% +8% SK 51% 59% +8% CY 37% 43% +6% UK 27% 32% +5% AT 49% 53% +4% HU 73% 77% +4% RO 56% 60% +4% 47% 50% +3% IT 50% 52% +2% FI 39% 41% +2% NL 33% 34% +1% EE 16% 16% = SE 51% 50% -1% CZ 52% 51% -1% BG 26% 24% -2% LT 16% 13% -3% FR 34% 30% -4% IE 43% 38% -5% BE 49% 44% -5% ES 50% 44% -6% LU 42% 35% -7% EL 56% 49% -7% SI 49% 39% -10% DE 53% 42% -11% PT 54% 43% -11% MT 38% 23% -15% 86
88 The socio-demographic analysis shows: Men are more likely than women to feel that the ability to change jobs is a useful asset and people retire too early. Agreement with the statements lifetime jobs are a thing of the past and people retire too early increases with age, partially due to younger respondents not having an opinion on retirement age. In addition, younger respondents (aged 15-24) tend to buy in more to the measures of flexicurity such as flexible work contracts will encourage job creation, the ability to change jobs is a useful asset to have and regular training improves job opportunities. People who have been educated for longer and managers, tend to see more value in the ability to change jobs and regular training. QD18. Please tell me, for each of the following statements, to what extent you agree or disagree with it. Answer 'Totally agree'+'tend to agree' Regular training improves one s job opportunities Being able to change easily from one job to another is a useful asset to help people find a job nowadays Life-time jobs with the same employer are a thing of the past Work contracts should become more flexible to encourage job creation In (OUR COUNTRY) many people retire too early EU27 88% 76% 73% 71% 43% Sex Male 88% 77% 73% 71% 45% Female 87% 74% 73% 71% 41% Age % 79% 70% 77% 38% % 77% 72% 73% 41% % 76% 75% 70% 43% % 73% 76% 67% 46% Education (End of) 15-84% 69% 75% 68% 44% % 76% 74% 73% 43% % 82% 76% 69% 46% Still studying 91% 79% 66% 75% 37% 87
89 7.2 The effectiveness of employment measures - Regular training and business start-up support are seen as the most effective measures in getting and keeping people employed - Respondents were provided with a list of measures and asked to rate their effectiveness in contributing to improved access to the labour market and extending working life 32. Respondents rate most of these measures as being effective, particularly regular training for people at work (87%) and supporting people who want to start their own business (86%). However, opinions differ on the question of early retirement (46% believe discouraging early retirement is effective) and, to a certain extent, increasing the difference in income between working and non-working people (59% agreement). Ratings for all the measures have remained fairly stable since QD19. For each of the following measures, how effective do you think they are in getting more people into work and staying at work longer in their life? Answer 'effective' - % EU Regular training for people at work Supporting people who want to start their own business Increasing child care facilities Increasing care facilities for elderly persons and other dependents Transforming undeclared work into regular jobs 87% 87% 86% 86% 80% 82% 79% 79% 74% 76% Promoting geographical mobility of people\ workers Increasing the difference in income between working and non-working people 64% 66% 59% 62% Discouraging early retirement 46% 48% Analysis of the results by country shows a pattern where people in some countries feel that increasing care facilities, whether for children or the elderly, would be effective in attracting and retaining more people to the workforce: Cyprus, Malta, Greece, Spain and Croatia. On the other side of the spectrum are countries that provide below average effectiveness ratings for both types of care facilities, namely Hungary, Denmark and Turkey. Hungary posts lower than average effectiveness ratings on all measures, except for discouraging early retirement, where this country s results are on par with the EU27 average. An increase is seen in Hungary for the effectiveness of increasing the difference in income between working and non-working people from 46% to 53%. 32 QD19 For each of the following measures, how effective do you think they are in getting more people into work and staying at work longer in their life? 88
90 Countries that show consistently higher ratings for the effectiveness of the various measures, when compared to the EU27 average, include: Malta and Cyprus (with the exception of geographic mobility and transforming undeclared work into regular jobs). Comparing the results with 2006, Malta shows a decrease in the effectiveness of geographic mobility (from 64% to 52%) largely due to increases in rating geographic mobility as not effective and don t know. Cyprus shows a significant shift in the rating of the effectiveness of transforming undeclared work into regular jobs from 79% to 67%. Greece (with the exception of geographic mobility) Spain (with the exception of discouraging early retirement) Finally, it can be seen that the Czech Republic and Denmark show large increases in the perceived effectiveness of the various measures, when compared to On the other hand, Latvia and Slovenia show several decreases in effectiveness ratings across the measures. QD19. For each of the following measures, how effective do you think they are in getting more people into work and staying at work longer in their life? - % Effective Regular training for people at work Supporting people who want to start their own business Increasing child care facilities Increasing care facilities for elderly persons and other dependents Transforming undeclared work into regular jobs Promoting geographical mobility of people\ workers Increasing the difference in income between working and non-working people Discouraging early retirement EU27 87% 86% 80% 79% 74% 64% 59% 46% BE 91% 88% 86% 84% 76% 73% 75% 51% BG 75% 78% 79% 75% 72% 60% 53% 39% CZ 86% 78% 80% 73% 56% 72% 71% 39% 92% 79% 66% 55% 59% 66% 60% 55% DE 91% 84% 79% 72% 73% 68% 60% 38% EE 90% 86% 73% 65% 60% 56% 55% 33% IE 91% 91% 85% 81% 75% 78% 73% 52% EL 92% 93% 92% 85% 84% 62% 75% 61% ES 94% 93% 91% 92% 81% 69% 48% 44% FR 89% 93% 83% 86% 78% 67% 53% 37% IT 83% 86% 83% 83% 80% 65% 54% 60% CY 98% 97% 96% 91% 67% 65% 77% 52% LV 84% 85% 68% 68% 76% 52% 58% 31% LT 82% 85% 65% 69% 63% 53% 48% 33% LU 91% 88% 77% 85% 65% 66% 50% 42% HU 58% 47% 50% 48% 50% 45% 53% 45% MT 95% 92% 95% 92% 56% 52% 67% 52% NL 86% 84% 76% 77% 60% 61% 65% 43% AT 89% 87% 81% 84% 70% 77% 67% 51% PL 81% 87% 84% 79% 78% 46% 63% 47% PT 86% 84% 83% 85% 68% 69% 60% 61% RO 82% 83% 75% 75% 77% 58% 65% 62% SI 82% 81% 71% 70% 72% 61% 64% 41% SK 77% 87% 80% 81% 80% 75% 81% 47% FI 84% 86% 72% 69% 70% 72% 48% 58% SE 89% 92% 64% 79% 78% 65% 45% 41% UK 89% 85% 78% 77% 62% 61% 63% 46% HR 91% 91% 89% 88% 86% 74% 74% 74% TR 75% 73% 67% 66% 65% 58% 59% 43% MK 85% 87% 77% 73% 83% 56% 57% 51% Highest percentage per item Lowest percentage per item Highest percentage per country Lowest percentage per country 89
91 The analysis on socio-demographic variables shows: Women are more likely to find increasing care facilities (for children and the elderly) to be effective. In general, the effectiveness rating for most measures is highest amongst the youngest respondents and then decreases with age, possibly indicating a degree of pessimism regarding the effectiveness of such measures that comes with age-related experience. Those who have been educated for longer are more likely to view child care facilities and training as effective, though they are more likely to say that discouraging early retirement is not effective. As might be expected, those in larger households are more likely to call for increasing care facilities (for children and the elderly) though in general the perceived effectiveness of most measures also increases with household size. Understandably, house persons see a greater effectiveness in increasing childcare and elderly care facilities while self-employed workers are more likely to mention discouraging early retirement. 90
92 QD19. For each of the following measures, how effective do you think they are in getting more people into work and staying at work longer in their life? Answer 'Very effective' + 'Fairly effective' Regular training for people at work Supporting people who want to start their own business Increasing child care facilities Increasing care facilities for elderly persons and other dependents Transforming undeclared work into regular jobs Promoting geographical mobility of people\ workers Increasing the difference in income between working and non-working people Discouraging early retirement EU27 87% 86% 80% 79% 74% 64% 59% 46% Sex Male 86% 87% 78% 76% 73% 65% 60% 47% Female 87% 86% 83% 81% 74% 63% 58% 46% Age % 90% 82% 80% 75% 69% 63% 47% % 88% 82% 79% 74% 65% 61% 45% % 85% 80% 79% 74% 63% 57% 46% % 85% 79% 78% 73% 61% 56% 48% Education (End of) 15-84% 84% 79% 80% 72% 61% 55% 48% % 86% 81% 80% 74% 63% 61% 47% % 88% 82% 79% 75% 67% 59% 46% Still studying 88% 89% 80% 77% 72% 69% 58% 45% Household composition 1 85% 85% 78% 77% 72% 62% 58% 47% 2 87% 86% 79% 78% 73% 63% 57% 47% 3 86% 87% 83% 79% 75% 65% 58% 46% 4+ 87% 87% 82% 81% 75% 65% 61% 47% Respondent occupation scale Self- employed 87% 88% 81% 79% 74% 67% 62% 56% Managers 90% 86% 82% 78% 73% 68% 60% 43% Other white collars 88% 87% 83% 79% 76% 66% 60% 48% Manual workers 86% 87% 81% 81% 74% 63% 61% 45% House persons 86% 86% 85% 83% 75% 63% 57% 49% Unemployed 84% 85% 80% 78% 72% 61% 56% 45% Retired 85% 84% 78% 78% 72% 60% 55% 47% Students 88% 89% 80% 77% 72% 69% 58% 45% 91
93 8. PERCEPTIONS OF EU EMPLOYMENT AND SOCIAL POLICIES In this final section we look at citizens awareness of the EU and its activities, in terms of the knowledge people have about several of the EU s funds and programmes, awareness of some of their objectives and their overall assessment of the impact of the EU in this area. 8.1 Perception of the EU s role in employment and social affairs Awareness of EU funds and programmes - Awareness of the ESF has remained unchanged over time with a third of Europeans being aware of it - A third of Europeans are aware of the ESF 33, a result which has remained stable since Awareness of the European Regional Development Fund ( ERDF ) and the Erasmus programme are slightly lower than the ESF, at 30% each. Though awareness of the ERDF is stable, awareness of The Erasmus programme has increased from 27% in The EU Lisbon Strategy for Growth and Jobs shows the lowest awareness at 19%. QD1. Have you heard of? Answer 'yes' -%EU The European Social Fund - ESF 33% 33% The Erasmus Programme 27% 30% The European Regional Development Fund ERDF 30% 30% The EU "Lisbon Strategy" for Growth and Jobs 12% 19% 33 QD1. Have you heard of? 92

94 At the national level, there is greatest awareness of the ESF among those in Slovakia (59%), Portugal (58%), Spain (53%), Estonia (49%) and Slovenia (47%). For the latter three countries, awareness of the ESF has increased by at least 12 percentage points since the previous reading. A similar increase is noted in Sweden; although only a quarter of Swedes are aware of the ESF, this has increased significantly from 14% in Countries where more than eight in ten citizens are not aware of the ESF include Turkey (88%) and Denmark (83%) whilst at least three-quarters of those in Austria, Cyprus, Romania, the former Yugoslav Republic of Macedonia and Sweden have never heard of the ESF. Awareness of the ESF in Turkey has declined from a level of 21% in 2006 to 12% currently, with a similar fall in Greece (42% awareness in 2006 to 33% currently). Item was not previously asked for MK EB71.2 May-Jun 2009 / EB65.3 Apr-May
95 The socio-demographic groups with higher levels of awareness of the ESF are: Men. Aged Better educated. Managers. Living in large towns. Home owners. Those with an internet connection at home. QD1.1 Have you heard of? The European Social Fund - ESF Yes No EU27 33% 67% Sex Male 36% 64% Female 31% 69% Age % 70% % 64% % 63% % 71% Education (End of) 15-23% 77% % 68% % 54% Still studying 32% 68% Respondent occupation scale Self- employed 42% 58% Managers 51% 49% Other white collars 41% 59% Manual workers 31% 69% House persons 24% 76% Unemployed 29% 71% Retired 28% 72% Students 32% 68% Subjective urbanisation Rural village 32% 68% Small/mid size town 32% 68% Large town 37% 63% Ownership house/ apartment Yes 35% 65% No 29% 71% Internet connection at home Yes 39% 61% No 26% 74% 94

96 8.1.2 EU activities in employment and social affairs - Most respondents feel what they know about the EU s activity in the employment and social affairs is positive- Citizens were asked their overall perception of what the European Union does in the area of employment and social affairs, based on what they see, read or hear. 34 The majority of Europeans feel what they see, read and hear about the EU in this context is positive (52%) though there are more who feel that coverage is fairly positive (47%) compared to very positive (5%). Results for the overall positive rating are down 4% since the previous measure, though this seems to be due to more people having no opinion (from 19% to 22%). Nevertheless, close to a quarter of Europeans feel that what they see, read and hear tends to be negative (26%) 21% feel it is fairly negative and 5% feel it is very negative. At the national level, the following countries record higher positive ratings for the way the EU is portrayed in 2009: The former Yugoslav Republic of Macedonia (73%), Cyprus (71%), Slovakia (69%), Finland (68%) and Spain (65%). Ignoring the results for don t know and comparing the scores for positive and negative reveals that Estonia, Malta, Romania and Bulgaria also post relatively higher positive ratings. Both Spain and Portugal have seen increases in positive ratings since QD22 In general, would you say that what you see, read or hear about what the European Union does in the area of employment and social affairs is very positive, fairly positive, fairly negative or very negative? 95
97 On the other hand there are only two countries where the views are predominantly that the media s coverage of the EU s contribution in this area is more negative than positive: the UK and France. More negative mentions are also noted over time from Latvia, Hungary, Ireland, Slovenia and the UK, when compared to Overall, it is clear that on this measure, those in NMS12 tend to see, read and hear more that is positive about the EU s impact (61% positive rating) than those in EU15 (49% positive rating). Item was not previously asked for MK EB71.2 May-Jun 2009 / EB65.3 Apr-May
98 The socio-demographic groupings most likely to find what they see, read and hear putting the EU s contribution in this in a positive light are: Men (though women are more likely to have no opinion). Younger (aged 15-39). Better educated or still studying. Managers or students. Living in large towns. Home owners. Those with an internet connection at home. People who haven t lost their jobs due to the economic crisis. QD22 In general, would you say that what you see, read or hear about what the European Union does in the area of employment and social affairs is very positive, fairly positive, fairly negative or very negative? Very positive + Fairly positive Fairly negative + Very negative EU27 52% 26% 22% Sex Male 54% 27% 19% Female 50% 25% 25% Age % 20% 22% % 24% 20% % 29% 20% % 28% 26% Education (End of) 15-41% 30% 29% % 28% 21% % 24% 18% Still studying 60% 18% 22% Respondent occupation scale Self- employed 57% 25% 18% Managers 60% 25% 15% Other white collars 58% 25% 17% Manual workers 50% 29% 21% House persons 48% 24% 28% Unemployed 42% 31% 27% Retired 46% 27% 27% Students 60% 18% 22% Subjective urbanisation Rural village 49% 27% 24% Small/mid size town 52% 26% 22% Large town 54% 25% 21% Ownership house/ apartment Yes 54% 25% 21% No 46% 29% 25% Internet connection at home Yes 54% 26% 20% No 48% 26% 26% Has lost his job Yes 45% 33% 22% No 52% 26% 22% 97
99 8.1.3 The impact of the EU on employment and social affairs - Across all measures, citizens perceive the EU as retaining a positive impact on employment and social affairs - Citizens were polled about the perceived impact the EU has had on various employment and social policies. 35 Here, we see firstly that the overall impact has been positive, with results ranging from 62% to 78% positive impact and, secondly, that the results have remained stable since The EU is perceived to have had the most positive impact on improving access to education and training (78%), followed by promoting equality between women and men (76%). In addition, more than seven in ten Europeans feel the EU has had a positive impact on combating other forms of discrimination (73%), creating new job opportunities and fighting unemployment (72%) and fighting against social exclusion and poverty (70%). QD20. Please tell me to what extent you think the European Union has a positive or negative impact on each of the following employment and social policies. Answer 'Positive impact' - % EU Improving access to education and training Promoting equality between women and men Combatting other forms of discrimination Creating new job opportunities and fighting unemployment Fighting against social exclusion and poverty Setting minimum standards for working conditions throughout the EU Exchanging best practices in employment policies among the Member States of the EU Promoting dialogue between employers and trade unions Reducing regional disparities in unemployment Coordinating the reform of the national systems of social protection (pensions, healthcare, etc.) 78% 79% 76% 76% 73% 75% 72% 72% 70% 71% 69% 70% 66% 68% 64% 64% 63% 64% 62% 64% At a national level, the following countries record consistently higher positive impact ratings, on all employment and social policies measured, when compared to the EU average: Cyprus, Spain, Slovakia, Romania and Greece. Further, Italy and Malta post high impact ratings for all issues except for exchanging best practices in employment policies among the Member States of the EU. The Dutch and Estonians also feel the EU has had a positive impact on most ratings. Overall, those in NMS12 perceive the EU to have had a much greater positive impact, across all employment and social policies, than those in EU QD20 Please tell me to what extent you think the European Union has a positive or negative impact on each of the following employment and social policies. 98
100 QD20. Please tell me to what extent you think the European Union has a positive or negative impact on each of the following employment and social policies. Answer 'Very positive impact' + 'Fairly positive impact'. Improving access to education and training Promoting equality between women and men Combatting other forms of discrimination Creating new job opportunities and fighting unemployment Fighting against social exclusion and poverty Setting minimum standards for working conditions throughout the EU Exchanging best practices in employment policies among the Member States of the EU Promoting dialogue between employers and trade unions Reducing regional disparities in unemployment Coordinating the reform of the national systems of social protection (pensions, healthcare, etc.) EU27 78% 76% 73% 72% 70% 69% 66% 64% 63% 62% BE 85% 82% 77% 77% 72% 74% 70% 72% 66% 70% BG 75% 77% 71% 74% 72% 73% 71% 65% 67% 68% CZ 86% 81% 74% 77% 69% 68% 73% 68% 67% 66% 80% 71% 69% 62% 64% 60% 66% 56% 54% 50% DE 82% 82% 79% 75% 77% 73% 72% 65% 70% 63% EE 86% 74% 74% 82% 77% 66% 76% 77% 71% 75% IE 77% 75% 71% 68% 67% 74% 64% 64% 58% 63% EL 82% 83% 79% 76% 74% 71% 72% 74% 69% 77% ES 87% 88% 85% 84% 83% 73% 78% 77% 75% 77% FR 68% 64% 60% 57% 56% 53% 55% 50% 41% 50% IT 80% 82% 78% 81% 78% 77% 67% 72% 75% 76% CY 95% 93% 89% 84% 82% 80% 76% 75% 67% 86% LV 75% 62% 56% 62% 56% 60% 59% 55% 54% 48% LT 78% 73% 67% 80% 72% 64% 63% 69% 68% 62% LU 76% 74% 67% 59% 59% 55% 60% 58% 44% 54% HU 76% 70% 68% 68% 64% 65% 63% 61% 64% 60% MT 94% 91% 87% 89% 83% 74% 60% 81% 53% 79% NL 85% 84% 80% 80% 80% 67% 80% 76% 65% 56% AT 83% 80% 72% 73% 72% 75% 71% 69% 67% 61% PL 82% 76% 75% 78% 69% 76% 71% 62% 71% 61% PT 71% 68% 64% 62% 59% 60% 56% 54% 52% 54% RO 78% 78% 76% 76% 74% 74% 69% 73% 70% 75% SI 75% 73% 65% 64% 59% 64% 58% 59% 57% 58% SK 84% 83% 78% 85% 74% 75% 72% 68% 77% 71% FI 84% 76% 71% 74% 70% 70% 73% 68% 66% 67% SE 74% 63% 68% 64% 58% 58% 69% 50% 55% 49% UK 63% 62% 60% 57% 54% 61% 49% 53% 45% 48% HR 79% 76% 77% 78% 74% 73% 72% 73% 75% 72% TR 60% 60% 57% 62% 60% 53% 49% 54% 57% 57% MK 84% 83% 75% 78% 73% 73% 73% 70% 64% 74% Highest percentage per item Highest percentage per country Lowest percentage per item Lowest percentage per country 99
, though there are fewer mentions of positive impact in some Member States, particularly Slovenia (76% to 64%), Latvia (74% to 62%) and the UK (68% to 57%).")
101 Comparing the results for creating new job opportunities and fighting unemployment the highest increases in positive impact mentions are seen among the Spanish (69% to 84%), Germans (64% to 75%) and Austrians (65% to 73%), though there are fewer mentions of positive impact in some Member States, particularly Slovenia (76% to 64%), Latvia (74% to 62%) and the UK (68% to 57%). Some of these latter countries consistently express a more negative or pessimistic assessment on numerous measures throughout the analysis. Item was not previously asked for MK EB71.2 May-Jun 2009 / EB65.3 Apr-May
102 Across all the measures assessed, the socio-demographic groups that see the most positive impact include: Men. However, it should be noted that men are also more likely to perceive a negative impact due to more women giving no opinion. Younger (aged 15-39). Older respondents (aged 55+) are less likely to have an opinion. Better educated or still studying. Managers, self-employed or students. Living in large towns (those in rural villages are more likely to have no opinion). Generally satisfied and optimistic about their household finances, the national economy and the national employment situation. More confident about their job stability. 101
103 QD20. Please tell me to what extent you think the European Union has a positive or negative impact on each of the following employment and social policies. Answer 'Very positive impact' + 'Fairly positive impact' Improving access to education and training Promoting equality between women and men Combatting other forms of discrimination Creating new job opportunities and fighting unemployment Fighting against social exclusion and poverty Setting minimum standards for working conditions throughout the EU Exchanging best practices in employment policies among the Member States of the EU Promoting dialogue between employers and trade unions Reducing regional disparities in unemployment Coordinating the reform of the national systems of social protection (pensions, healthcare, etc.) EU27 78% 76% 73% 72% 70% 69% 66% 64% 63% 62% Sex Male 79% 78% 75% 73% 71% 70% 68% 66% 65% 64% Female 77% 74% 72% 71% 68% 68% 65% 63% 61% 62% Age % 81% 78% 77% 73% 72% 70% 67% 66% 67% % 79% 76% 76% 72% 74% 70% 68% 67% 66% % 75% 74% 71% 70% 69% 66% 63% 62% 63% % 72% 68% 67% 66% 63% 62% 61% 60% 59% Education (End of) 15-71% 71% 67% 66% 65% 61% 60% 60% 59% 59% % 75% 73% 72% 69% 69% 65% 65% 63% 65% % 80% 78% 75% 73% 74% 73% 66% 67% 64% Still studying 84% 82% 80% 79% 76% 73% 72% 67% 66% 67% Respondent occupation scale Self- employed 80% 78% 75% 76% 72% 73% 69% 66% 68% 67% Managers 82% 83% 83% 76% 76% 80% 76% 67% 66% 64% Other white collars 83% 79% 79% 74% 73% 72% 71% 68% 67% 66% Manual workers 78% 75% 72% 71% 69% 68% 66% 67% 64% 64% House persons 75% 74% 72% 69% 69% 67% 63% 62% 63% 63% Unemployed 72% 72% 69% 70% 66% 64% 60% 62% 60% 62% Retired 72% 71% 66% 68% 64% 63% 60% 59% 58% 59% Students 84% 82% 80% 79% 76% 73% 72% 67% 66% 67% Subjective urbanisation Rural village 76% 73% 71% 69% 67% 67% 65% 62% 61% 61% Small/mid size town 78% 76% 73% 73% 71% 69% 66% 65% 64% 64% Large town 79% 78% 76% 74% 71% 72% 68% 65% 65% 65% Nat. situation of employment Good 84% 82% 80% 78% 77% 76% 76% 71% 70% 68% Bad 77% 75% 73% 71% 69% 67% 65% 64% 63% 63% Situation of national economy Good 82% 80% 77% 77% 74% 75% 74% 68% 69% 66% Bad 77% 76% 73% 71% 69% 68% 65% 64% 62% 62% Financial situation household Good 80% 78% 75% 74% 72% 71% 69% 66% 65% 64% Bad 74% 72% 69% 69% 65% 65% 61% 62% 61% 60% Job stability Confident 82% 80% 78% 76% 74% 74% 71% 68% 66% 66% Not confident 73% 73% 69% 67% 65% 66% 63% 63% 61% 59% 102
 than say they are interested (45%).")
104 8.1.4 Interest in information regarding the EU s activities - Interest in detailed information regarding the EU s employment and social policies has declined - In terms of information, slightly more respondents say they are not interested in receiving more information (52%) than say they are interested (45%). 36 In addition, the proportion of those who are not interested has increased from 48% in 2006, largely due to more people now saying they are not at all interested (from 20% in 2006 to 24% currently). Countries showing the highest levels of interest in receiving more information include Cyprus (63% interested), the former Yugoslav Republic of Macedonia (62%) and Slovakia (60%), whilst more than half of people in Latvia, Sweden, Bulgaria, Greece and Italy also express interest. 36 QD21. Overall, how interested would you be in receiving detailed information on the employment and social policies funded by the European Union? Would you be? 103
, the UK (65%), Slovenia (63%), the Netherlands (62%), Denmark (63%) and Croatia (61%).")
105 The countries where the majority of respondents say they are not interested include Turkey (67% not interested, and ranking the highest even though 18% of Turkish couldn t form an opinion), the UK (65%), Slovenia (63%), the Netherlands (62%), Denmark (63%) and Croatia (61%). 104
, Romania (26% to 49%), Greece (34% to 46%), France (39% to 51%) and")
106 Comparing the results on a country level with those obtained in 2006 shows increases in interest amongst Swedes (45% to 56%), Portuguese (42% to 52%) and Spanish (32% to 41%) citizens. However, there are more countries where we have seen increases in not interested responses, particularly Lithuania (32% to 58%), Romania (26% to 49%), Greece (34% to 46%), France (39% to 51%) and Slovenia (52% to 63%). Item was not previously asked for MK EB71.2 May-Jun 2009 / EB65.3 Apr-May 2006 The socio-demographic groupings most likely to be interested in receiving more information are: Men. Younger (aged 15-39). Those aged 55+ show the least interest. Better educated, or still studying. Living in larger households (three or more people). Managers, white collar workers and students. House persons and retired respondents show the least interest. 105
107 Living in large towns. Have an internet connection at home. Generally more positive about the national employment situation and national economy. Those who have lost their jobs due to the economic crisis. QD21 Overall, how interested would you be in receiving detailed information on the employment and social policies funded by the European Union? Would you be? Very interested + Fairly interested Not very interested + Not at all interested EU27 45% 52% 3% Sex Male 47% 50% 3% Female 44% 52% 4% Age % 46% 3% % 45% 3% % 47% 3% % 62% 4% Education (End of) 15-31% 64% 5% % 51% 3% % 43% 2% Still studying 52% 45% 3% Household composition 1 39% 58% 3% 2 43% 54% 3% 3 50% 47% 3% 4+ 50% 47% 3% Respondent occupation scale Self- employed 51% 45% 4% Managers 60% 38% 2% Other white collars 54% 44% 2% Manual workers 48% 49% 3% House persons 37% 57% 6% Unemployed 49% 48% 3% Retired 30% 66% 4% Students 52% 45% 3% Subjective urbanisation Rural village 42% 55% 3% Small/mid size town 46% 51% 3% Large town 48% 48% 4% Internet connection at home Yes 51% 47% 2% No 37% 59% 4% Nat. situation of employment Good 49% 49% 2% Bad 45% 52% 3% Situation of national economy Good 50% 48% 2% Bad 44% 53% 3% Has lost his job Yes 52% 44% 4% No 45% 52% 3% 106
108 8.2 The European Social Fund Knowledge of the ESF s objectives - More citizens now say they don t know what the ESF s objectives are- The relatively high and stable awareness of the European Social Fund (33%) has to be seen in the light of respondents limited knowledge of its objectives. As shown on the next table, the spontaneous answers to an open question related to the ESF s objectives 37 illustrate that European citizens know little about the fund s objectives. QD2 Can you tell me what the ESF is all about, or what you think it might do? -%EU Fund to help people in need, low socio-economic classes, etc. Fund to deal with social issues, health care, social helps, etc. Fund to support EU Member States, future/new EU member States, candidates Fund to fight unemployment, for creation of jobs, etc. Fund to help countries in need, poor countries, developping countries, etc. Fund to finance training and education Fund to level out social differencies between countries Nothing Fund to ensure good\ better working conditions Fund to support projects, dotations to various organisations or institutions Fund to improve national issues (economic situation, infrastructure, roads, etc.) Never heard about it Fund to help companies, to help SMEs Others 9% 9% 7% 7% 5% 3% 3% 3% 2% 2% 2% 2% 1% 2% 50% When interviewees were invited to describe the Fund's objectives spontaneously, half felt unable to provide an answer (50% don't know which has increased from 35% don t know in 2006), or quoted objectives which are not related to the ESF. Only 7% correctly identified 'fighting unemployment and creating jobs' and only 3% identified 'financing education and training' which are main objectives of the ESF. Similarly low proportions cited other objectives which can be considered more or less correct (see table above). 37 QD2 Can you tell me what the European Social Fund or ESF is all about, or what you think it might do? (OPEN QUESTION MULTIPLE ANSWERS POSSIBLE). As a reminder, the coding of this open-ended question was done ex post. Therefore, all the coded responses shown in the table were not proposed to the respondents. 107

109 8.2.2 Assessment of the ESF s budget - More respondents feel the ESF s budget allocation is too little than was the case in 2006, though mentions of don t know have also increased - Citizens were told that the European Social Fund s budget allocation is 10% of the EU s total budget. 38 The largest proportion of Europeans said this allocation was just right (35%), followed closely by those who felt that it was too little (34%), with only 5% saying it was too much. Just over a quarter of Europeans felt they could not answer this question. Comparing the results with 2006 shows that more citizens feel that the budget allocation is too little (29% in 2006 to 34% in 2009) though there are also more who could not answer (22% in 2006 to 26% in 2009). Countries most likely to feel that the budget allocation is too little include Greece (increasing from 51% in 2006 to 62% currently); France (increasing from 40% to 46%), Spain (increasing from 30% to 42%), Latvia and Hungary (35% to 42% for both). Further large rises in the perception that the budget allocation is too little are evident in Luxembourg (17% to 31%) and the UK (20% to 31%). 38 QD3 The European Social Fund (ESF) is the European Union fund dedicated to helping European citizens develop their skills and improve their job prospects. The European Union dedicates some 10% of its overall budget to the European Social Fund. Would you say that this share of the budget is too much, about right or too little? 108

110 Countries least likely to have an opinion on the matter include Turkey (don t know increased from 41% to 54%), Bulgaria (58% down to 53%), Portugal (32% to 49%) and Romania (56% down to 46%). The relatively higher awareness of the European Social Fund in Portugal, Malta and Ireland does not translate into any strong opinion on the budget allocation, with these countries posting above average mentions of don t know. Item was not previously asked for MK EB71.2 May-Jun 2009 / EB65.3 Apr-May
111 The socio-demographic analysis reveals: Men are more likely to say the allocation is about right, while slightly more women think that it is too little. Younger respondents are more likely to feel the allocation is about right or too little, whereas mentions of don't know increase with age. Better educated respondents are both more likely to say the budget allocation is about right and to have an opinion. Smaller households (people living alone, or with two people in the household) are more likely to have no opinion. Managers and students are likely to say the allocation is about right. More manual workers feel the allocation is too little and house persons and retirees are more likely to have no opinion. People in large towns, and those with an internet connection, are more likely to say about right, and to have an opinion. People who have lost their jobs due to the economic crisis, and who are not confident about their job stability, are more likely to say the allocation is too little. 110
112 QD3 The European Social Fund (ESF) is the European Union fund dedicated to helping European citizens develop their skills and improve their job prospects. The European Union dedicates some 10% of its overall budget to the European Social Fund. Would you say that this share of the budget is too much, about right or too little? Too About Too much right little EU27 5% 35% 34% 26% Sex Male 5% 38% 33% 24% Female 3% 33% 35% 29% Age % 39% 37% 21% % 37% 37% 21% % 36% 34% 25% % 32% 30% 34% Education (End of) 15-4% 28% 31% 37% % 34% 36% 26% 20+ 5% 43% 33% 19% Still studying 4% 42% 34% 20% Household composition 1 5% 34% 31% 30% 2 5% 35% 32% 28% 3 3% 35% 38% 24% 4+ 4% 37% 35% 24% Respondent occupation scale Self- employed 5% 37% 35% 23% Managers 6% 46% 31% 17% Other white collars 5% 40% 35% 20% Manual workers 4% 33% 37% 26% House persons 2% 33% 33% 32% Unemployed 4% 27% 44% 25% Retired 4% 32% 29% 35% Students 4% 42% 34% 20% Subjective urbanisation Rural village 4% 33% 34% 29% Small/mid size town 4% 36% 35% 25% Large town 5% 38% 33% 24% Has lost his job Yes 4% 29% 44% 23% No 4% 36% 33% 27% Job stability Confident 5% 40% 34% 21% Not confident 4% 28% 44% 24% 111
.")
113 8.3 Familiarity with the European Globalisation Adjustment Fund - Awareness and familiarity with the EGF is relatively low - In comparison with the ESF, awareness of the European Globalisation Adjustment Fund is lower, with just over a quarter of respondents having heard of the Fund (26%). 39 The majority of respondents state they have never heard or read anything about the European Globalisation Adjustment Fund (71%) and the remaining 3% are unsure perhaps unsurprising given the smaller and newer nature of the Fund compared to the ESF. In addition, amongst the 26% of respondents aware of the Fund, only 4% are very familiar, and 22% say they re not familiar with it. On a country level, those posting the highest awareness for the European Globalisation Adjustment Fund include Slovakia (44% total awareness), Slovenia (41%), Finland (41%) and Portugal (37%). These four countries also post aboveaverage awareness of the ESF, indicating generally higher awareness of the EU Funds in these countries. Still, in these countries, most respondents are not familiar with the Fund, with the highest levels of being familiar recorded in Portugal at only 8%. The lowest levels of awareness of the EGF are found in the UK (10%), Denmark (12%), Cyprus (15%), the Netherlands (18%), France (19%) and Poland (20%). However, apart from France, none of these countries has yet received funding under the EGF. 39 QC1 Have you ever heard or read about the European Globalisation adjustment Fund that is a fund to help victims of globalisation? Yes, and you are very familiar with it; Yes, but you are not very familiar with it; No, you have never heard or read about it 112

114 The socio-demographic groups most likely to be aware of the Fund are: Men. Aged Better educated. Managers. Home owners. People with an internet connection at home. People who are confident about their job security. 113
115 QC1 Have you ever heard or read about the European Globalisation adjustment Fund that is a fund to help victims of globalisation? Yes, and you are very familiar with it Yes, but you are not very familiar with it No, you have never heard or read about it EU27 4% 22% 71% 3% Sex Male 5% 22% 70% 3% Female 3% 21% 72% 4% Age % 20% 74% 3% % 23% 70% 3% % 23% 69% 3% % 20% 73% 4% Education (End of) 15-2% 15% 78% 5% % 23% 71% 3% 20+ 6% 26% 66% 2% Still studying 3% 22% 72% 3% Respondent occupation scale Self- employed 6% 27% 64% 3% Managers 6% 31% 62% 1% Other white collars 5% 25% 67% 3% Manual workers 3% 21% 73% 3% House persons 2% 16% 78% 4% Unemployed 3% 16% 76% 5% Retired 3% 20% 73% 4% Students 3% 22% 72% 3% Ownership house/ apartment Yes 4% 23% 70% 3% No 4% 19% 74% 3% Internet connection at home Yes 4% 24% 70% 2% No 3% 18% 74% 5% Job stability Confident 5% 25% 68% 2% Not confident 4% 22% 70% 4% 114
116 CONCLUSION In line with an increase in the EU unemployment rate to 8.9% in May/June 2009 (compared to 6.8% a year earlier), Europeans are reporting that they have experienced job losses due to the economic crisis, either personally (estimated at 3.5% net loss of the working population) or by their friends, family and work colleagues (the latter results both at 25+%). Countries that seem hardest hit, based on the views of their citizens, include Latvia, Lithuania, Spain, Ireland, Estonia, Hungary and Portugal. Countries reporting lower levels of job losses include Luxembourg, Belgium, Greece, the Netherlands, Malta and Cyprus, with a reported lower incidence of job losses in EU15 as compared with NMS10. It is therefore not surprising that around a third of Europeans in the workplace are very concerned that they may lose their jobs in the future, with even more people being concerned about their partner or children losing their jobs. The level of concern also correlates strongly with the reported incidence of job losses; citizens of those countries which have experienced higher levels of job losses are more likely to be very concerned about further job cuts. This level of concern is further explained by the fact that at least six in ten Europeans feel that the worst of the economic crisis is yet to come. Therefore, although market indicators predict that the economy will start to stabilise in 2010, many Europeans feel the greatest impact of the crisis has yet to hit the job market. Europeans differ on the perceived levels of unemployment insurance compensation they would receive in the event of losing their job. At least half believe it will be up to 70% of current income; a fifth believe it would be higher than this, and a quarter say they do not know. Europeans confidence in keeping their jobs, or finding a job in the event of being laid off, has declined somewhat since 2006, indicating the greater level of uncertainty that prevails in the current period of economic uncertainty. The majority of Europeans believe that, in these times, the level of one s professional experience and qualifications and are the two most important aspects one should emphasise in order to find a job easily. Should they need to find a job, most respondents would opt for the same type of job, in the same location, or alternatively widen their search for the same type of job, in a different location, showing a greater geographical mobility than job mobility. About one in four of those Europeans not working state that they will take up any job; a result that has not changed significantly since Around one in five of those interviewed had participated in training during the past 12 months, and most workers feel their training and education to date has been sufficient to keep their jobs. This contrasts with the majority of non-workers who feel that they would need further education and training in order to find a job. The biggest obstacle to further training is affordability and, to some extent, family responsibilities. Employers play a large part in financing training, and it is noted that countries with high incidences of training also have high proportions of employers funding training; particularly the Netherlands, Finland, UK and Germany. EU-funded training plays an important role in several eastern and southern Member States. 115
117 People see a lot of value in training and believe that regular training improves one s job opportunities. Furthermore, respondents broadly agree with the concepts which underpin flexicurity. They feel being able to change easily from one job to another is a useful asset to help find a job, staying with one employer is no longer realistic and work should become more flexible to encourage job creation. People are most divided on the topic of retirement, both in terms of assessing whether or not people retire too early and whether discouraging early retirement is an effective measure to attract and retain people in the work force. Rather, respondents would like to see regular training for people at work and better support for those who would like to start their own business. Overall, a third of Europeans are aware of the European Social Fund (ESF), one of the EU's main tools to support those who may lose their jobs as a result of the crisis. Once the Fund s purpose is explained, a third feel that the ESF s budget allocation is too little (with a quarter feeling unable to form an opinion about the ESF). Around half of Europeans feel that what they know of the EU's role in the area of employment and social affairs is broadly positive, around a quarter feel it is negative and the remainder have no opinion. Although the impact of the EU is perceived to be positive, specifically in the area of improving access to education and training and promoting equality between men and women, awareness of the EU s activities could be improved. However, respondents show general apathy regarding the EU s activities in that many are not interested in receiving detailed information regarding the EU s employment and social policies. In comparison with the ESF, awareness of the European Globalisation Adjustment Fund is lower, reflecting the smaller resources and new nature of this Fund. The survey clearly reflects the sombre mood of Europeans on the topic of employment and social policy. Expectations of citizens on the role of the EU in this context are profound and likely to increase in the (near) future. 116
118 ANNEXES
119 TECHNICAL SPECIFICATIONS
120 TECHNICAL SPECIFICATIONS Between the 25 th of May and the 17 th of June 2009, TNS Opinion & Social, a consortium created between Taylor Nelson Sofres and EOS Gallup Europe, carried out wave 71.2 of the EUROBAROMETER, on request of the EUROPEAN COMMISSION, Directorate-General for Communication, Research and Political Analysis. The SPECIAL EUROBAROMETER 316 is part of wave 71.2 covers the population of the respective nationalities of the European Union Member States, resident in each of the Member States and aged 15 years and over. The SPECIAL EUROBAROMETER 316 has also been conducted in the three candidate countries (Croatia, Turkey and the Former Yugoslav Republic of Macedonia). In these countries, the survey covers the national population of citizens and the population of citizens of all the European Union Member States that are residents in these countries and have a sufficient command of the national languages to answer the questionnaire. The basic sample design applied in all states is a multi-stage, random (probability) one. In each country, a number of sampling points was drawn with probability proportional to population size (for a total coverage of the country) and to population density. In order to do so, the sampling points were drawn systematically from each of the "administrative regional units", after stratification by individual unit and type of area. They thus represent the whole territory of the countries surveyed according to the EUROSTAT NUTS II (or equivalent) and according to the distribution of the resident population of the respective nationalities in terms of metropolitan, urban and rural areas. In each of the selected sampling points, a starting address was drawn, at random. Further addresses (every Nth address) were selected by standard "random route" procedures, from the initial address. In each household, the respondent was drawn, at random (following the "closest birthday rule"). All interviews were conducted face-to-face in people's homes and in the appropriate national language. As far as the data capture is concerned, CAPI (Computer Assisted Personal Interview) was used in those countries where this technique was available.


121 ABBREVIA- N FIELDWORK POPULATION COUNTRIES INSTITUTES TIONS INTERVIEWS DATES 15+ BE Belgium TNS Dimarso /05/ /06/ BG Bulgaria TNS BBSS /05/2009 8/06/ CZ Czech Rep. TNS Aisa /05/ /06/ Denmark TNS Gallup /05/ /06/ DE Germany TNS Infratest /05/ /06/ EE Estonia Emor /05/ /06/ IE Ireland TNS MRBI /05/ /06/ EL Greece TNS ICAP /05/ /06/ ES Spain TNS Demoscopia /05/ /06/ FR France TNS Sofres /05/ /06/ IT Italy TNS Infratest /05/ /06/ CY Rep. of Cyprus Synovate /05/ /06/ LV Latvia TNS Latvia /05/ /06/ LT Lithuania TNS Gallup Lithuania /05/ /06/ LU Luxembourg TNS ILReS /05/ /06/ HU Hungary TNS Hungary /05/ /06/ MT Malta MISCO /05/ /06/ NL Netherlands TNS NIPO /05/ /06/ AT Austria Österreichisches Gallup-Institut /05/ /06/ PL Poland TNS OBOP /05/ /06/ PT Portugal TNS EUROTESTE /05/ /06/ RO Romania TNS CSOP /05/ /06/ SI Slovenia RM PLUS /05/ /06/ SK Slovakia TNS AISA SK /05/ /06/ FI Finland TNS Gallup Oy /05/ /06/ SE Sweden TNS GALLUP /05/ /06/ UK United Kingdom TNS UK /05/ /06/ TOTAL EU /05/ /06/ HR Croatia Puls /05/ /06/ TR Turkey TNS PIAR /05/ /06/ MK Former Yugoslav Rep. of Macedonia TNS Brima /05/2009 3/06/ TOTAL CC /05/ /06/ TOTAL /05/ /06/ For each country a comparison between the sample and the universe was carried out. The Universe description was derived from Eurostat population data or from national statistics offices. For all countries surveyed, a national weighting procedure, using marginal and intercellular weighting, was carried out based on this Universe description. In all countries, gender, age, region and size of locality were introduced in the iteration procedure. For international weighting (i.e. EU averages), TNS Opinion & Social applies the official population figures as provided by EUROSTAT or national statistic offices. The total population figures for input in this post-weighting procedure are listed above. Readers are reminded that survey results are estimations, the accuracy of which, everything being equal, rests upon the sample size and upon the observed percentage. With samples of about 1,000 interviews, the real percentages vary within the following confidence limits: Observed percentages 10% or 90% 20% or 80% 30% or 70% 40% or 60% 50% Confidence limits ± 1.9 points ± 2.5 points ± 2.7 points ± 3.0 points ± 3.1 points
Employment and Social Policy
 Special Eurobarometer 377 European Commission Employment and Social Policy REPORT Special Eurobarometer 377 / Wave TNS opinion & social Fieldwork: September October 2011 Publication: December 2011 This
Special Eurobarometer 418 SOCIAL CLIMATE REPORT
 Special Eurobarometer 418 SOCIAL CLIMATE REPORT Fieldwork: June 2014 Publication: November 2014 This survey has been requested by the European Commission, Directorate-General for Employment, Social Affairs
Flash Eurobarometer 398 WORKING CONDITIONS REPORT
 Flash Eurobarometer WORKING CONDITIONS REPORT Fieldwork: April 2014 Publication: April 2014 This survey has been requested by the European Commission, Directorate-General for Employment, Social Affairs
PUBLIC PERCEPTIONS OF VAT
 Special Eurobarometer 424 PUBLIC PERCEPTIONS OF VAT REPORT Fieldwork: October 2014 Publication: March 2015 This survey has been requested by the European Commission, Directorate-General for Taxations and
Flash Eurobarometer 470. Report. Work-life balance
 Work-life balance Survey requested by the European Commission, Directorate-General for Justice and Consumers and co-ordinated by the Directorate-General for Communication This document does not represent
Flash Eurobarometer 458. Report. The euro area
 The euro area Survey requested by the European Commission, Directorate-General for Economic and Financial Affairs and co-ordinated by the Directorate-General for Communication This document does not represent
Flash Eurobarometer 386 THE EURO AREA REPORT
 Eurobarometer THE EURO AREA REPORT Fieldwork: October 2013 Publication: November 2013 This survey has been requested by the European Commission, Directorate-General for Economic and Financial Affairs and
Fieldwork February March 2008 Publication October 2008
 Special Eurobarometer 298 European Commission Consumer protection in the internal market Fieldwork February March 2008 Publication October 2008 Report Special Eurobarometer 298 / Wave 69.1 TNS Opinion
Active Ageing. Fieldwork: September November Publication: January 2012
 Special Eurobarometer 378 Active Ageing SUMMARY Special Eurobarometer 378 / Wave EB76.2 TNS opinion & social Fieldwork: September November 2011 Publication: January 2012 This survey has been requested
EUROBAROMETER 71. Fieldwork: June - July 2009 Publication: January 2010
 EUROBAROMETER 66 Standard Eurobarometer Report European Commission EUROBAROMETER 71 Future of Europe Fieldwork: June - July 2009 Publication: January 2010 Standard Eurobarometer 71/ Spring 2009 - TNS Opinion
Social climate. Fieldwork May-June 2009 Publication January 2010
 Special Eurobarometer European Commission Social climate Full report Fieldwork May-June 2009 Publication January 2010 Special Eurobarometer 315 / Wave - European Opinion Research Group EEIG This survey
Fieldwork November - December 2009 Publication June 2010
 Special Eurobarometer 337 European Commission Geographical and labour market mobility Report Fieldwork November - December 2009 Publication June 2010 Special Eurobarometer 337 / Wave TNS Opinion & Social
Standard Eurobarometer
 Standard Eurobarometer 67 / Spring 2007 Standard Eurobarometer European Commission SPECIAL EUROBAROMETER EUROPEANS KNOWELEDGE ON ECONOMICAL INDICATORS 1 1 This preliminary analysis is done by Antonis PAPACOSTAS
Europeans attitudes towards climate change. Report. Special Eurobarometer 300. Fieldwork March April 2008 Publication September 2008
 Special Eurobarometer 300 EUROPEAN PARLIAMENT European Commission Europeans attitudes towards climate change Fieldwork March April 2008 Publication September 2008 Report Special Eurobarometer 300 / Wave
Standard Eurobarometer 83 Spring 2015 THE EU BUDGET REPORT
 Standard Eurobarometer 83 Spring 2015 THE EU BUDGET REPORT Fieldwork: May 2015 This survey has been requested and co-ordinated by the European Commission, Directorate-General for Communication. http://ec.europa.eu/public_opinion/index_en.htm
Flash Eurobarometer 408 EUROPEAN YOUTH REPORT
 Flash Eurobarometer EUROPEAN YOUTH REPORT Fieldwork: December 2014 Publication: April 2015 This survey has been requested by the European Commission, Directorate-General for Education and Culture and co-ordinated
Flash Eurobarometer 458. The euro area
 The euro area Survey requested by the European Commission, Directorate-General for Economic and Financial Affairs and co-ordinated by the Directorate-General for Communication This document does not represent
Flash Eurobarometer 441. Report. European SMEs and the Circular Economy
 European SMEs and the Circular Economy Survey requested by the European Commission, Directorate-General Environment and co-ordinated by the Directorate-General for Communication This document does not
Two years to go to the 2014 European elections European Parliament Eurobarometer (EB/EP 77.4)
") Directorate-General for Communication PUBLIC OPINION MONITORING UNIT Brussels, 23 October 2012. Two years to go to the 2014 European elections European Parliament Eurobarometer (EB/EP 77.4) FOCUS ON THE
Directorate-General for Communication PUBLIC OPINION MONITORING UNIT Brussels, 23 October 2012. Two years to go to the 2014 European elections European Parliament Eurobarometer (EB/EP 77.4) FOCUS ON THE
Attitudes of Europeans Towards Tourism REPORT
 Flash Eurobarometer Attitudes of Europeans Towards Tourism REPORT Fieldwork: January 22 Publication: March 22 This survey has been requested by the Directorate-General Enterprise and co-ordinated by Directorate-
October 2010 Euro area unemployment rate at 10.1% EU27 at 9.6%
 STAT//180 30 November 20 October 20 Euro area unemployment rate at.1% EU27 at 9.6% The euro area 1 (EA16) seasonally-adjusted 2 unemployment rate 3 was.1% in October 20, compared with.0% in September 4.
Flash Eurobarometer N o 189a EU communication and the citizens. Analytical Report. Fieldwork: April 2008 Report: May 2008
 Gallup Flash Eurobarometer N o 189a EU communication and the citizens Flash Eurobarometer European Commission Expectations of European citizens regarding the social reality in 20 years time Analytical
Safer Internet. Fieldwork Dec Jan 2006 Publication May 2006
 Special Eurobarometer European Commission Safer Internet Fieldwork Dec 2005 - Jan 2006 Publication May 2006 Special Eurobarometer 250 / Wave 64.4 TNS Opinion & Social This survey was requested by Directorate
Europeans knowledge of economic indicators
 Special Eurobarometer 323 European Commission Europeans knowledge of economic indicators Fieldwork: August - September 2009 Publication: January 2010 Special Eurobarometer 323 / Wave 72.1 TNS Opinion &
January 2010 Euro area unemployment rate at 9.9% EU27 at 9.5%
 STAT//29 1 March 20 January 20 Euro area unemployment rate at 9.9% EU27 at 9.5% The euro area 1 (EA16) seasonally-adjusted 2 unemployment rate 3 was 9.9% in January 20, the same as in December 2009 4.
New Europeans. Fieldwork : March 2010 April 2010 Publication: April 2011
 Special Eurobarometer European Commission New Europeans Report Fieldwork : March 2010 April 2010 Publication: April 2011 Special Eurobarometer 346 / Wave TNS Opinion & Social This survey was requested
SOLIDARITY THAT SPANS THE GLOBE: EUROPEANS AND DEVELOPMENT AID
 Special Eurobarometer 392 SOLIDARITY THAT SPANS THE GLOBE: EUROPEANS AND DEVELOPMENT AID REPORT Fieldwork: June 2012 Publication: October 2012 This survey has been requested by Directorate-General Development
of the European Commission. Communication. This document of the authors. Standard Eurobarometer 75 / Spring 2011 TNS opinion & social
 Standard Eurobarometer European Commission EUROBAROMETER 75 SPRING 2011 Europeans and the European Union budget REPORT Standard Eurobarometer 75 / Spring 2011 TNS opinion & social Fieldwork: May 2011 Publication:
Europeans and the Common Agricultural Policy
 Special Eurobarometer European Commission Europeans and the Common Agricultural Policy Fieldwork October - November 2005 Publication January 2006 Special Eurobarometer 242 / Wave 64.2 - TNS Opinion & Social
Parlemeter - November 2012 European Parliament Eurobarometer (EB/EP 78.2)
") Directorate-General for Communication Public Opinion Monitoring Unit Parlemeter - November European Parliament Eurobarometer (EB/EP 78.2) ANALYTICAL SYNTHESIS Brussels, 14 February 2013. Coverage: Population:
Directorate-General for Communication Public Opinion Monitoring Unit Parlemeter - November European Parliament Eurobarometer (EB/EP 78.2) ANALYTICAL SYNTHESIS Brussels, 14 February 2013. Coverage: Population:
0pinions on organised, cross-border crime and corruption
 Special Eurobarometer European Commission 0pinions on organised, cross-border crime and corruption Fieldwork: November - December 2005 Publication: March 2006 Special Eurobarometer 245 / Wave 64.3 TNS
DATA SET ON INVESTMENT FUNDS (IVF) Naming Conventions
 Naming Conventions") DIRECTORATE GENERAL STATISTICS LAST UPDATE: 10 APRIL 2013 DIVISION MONETARY & FINANCIAL STATISTICS ECB-UNRESTRICTED DATA SET ON INVESTMENT FUNDS (IVF) Naming Conventions The series keys related to Investment
DIRECTORATE GENERAL STATISTICS LAST UPDATE: 10 APRIL 2013 DIVISION MONETARY & FINANCIAL STATISTICS ECB-UNRESTRICTED DATA SET ON INVESTMENT FUNDS (IVF) Naming Conventions The series keys related to Investment
Europeans attitudes towards the issue of sustainable consumption and production. Analytical report
 Flash Eurobarometer 256 The Gallup Organisation Analytical Report Flash EB N o 251 Public attitudes and perceptions in the euro area Flash Eurobarometer European Commission Europeans attitudes towards
Vocational Training. Fieldwork October-November 2004 Publication August 2005
 Special Eurobarometer European Commission Vocational Training Fieldwork October-November 2004 Publication August 2005 Special Eurobarometer 216 / Wave 62..1 TNS Opinion & Social This survey was requested
Social Protection and Social Inclusion in Europe Key facts and figures
 MEMO/08/625 Brussels, 16 October 2008 Social Protection and Social Inclusion in Europe Key facts and figures What is the report and what are the main highlights? The European Commission today published
Fieldwork February March 2008 Publication June 2008
 Special Eurobarometer 297 European Commission Attitudes towards radioactive waste Fieldwork February March 2008 Publication June 2008 Report Special Eurobarometer 297 / Wave 69.1 TNS Opinion & Social This
PROGRESS TOWARDS THE LISBON OBJECTIVES 2010 IN EDUCATION AND TRAINING
 PROGRESS TOWARDS THE LISBON OBJECTIVES IN EDUCATION AND TRAINING In 7, reaching the benchmarks for continues to pose a serious challenge for education and training systems in Europe, except for the goal
Health and food. Fieldwork November December 2005 Publication November 2006
 Special Eurobarometer European Commission Health and food Fieldwork November December 2005 Publication November 2006 Special Eurobarometer 246 / Wave 64.3 TNS Opinion & Social This survey was requested
Special Eurobarometer 459. Report. Climate change
 Climate change Survey requested by the European Commission, Directorate-General for Climate Action and co-ordinated by the Directorate- General for Communication This document does not represent the point
Taylor & Francis Open Access Survey Open Access Mandates
 Taylor & Francis Open Access Survey Open Access Mandates Annex C European Union November 2014 November 2014 0 The results presented in this report are based on research carried out on behalf of Taylor
PROGRESS TOWARDS THE LISBON OBJECTIVES 2010 IN EDUCATION AND TRAINING
 PROGRESS TOWARDS THE LISBON OBJECTIVES IN EDUCATION AND TRAINING In, reaching the benchmarks for continues to pose a serious challenge for education and training systems in Europe, except for the goal
Overview of Eurofound surveys
 Overview of Eurofound surveys Dublin 21 st October 2010 Maija Lyly-Yrjänäinen Eurofound data European Working Conditions Survey 91, 95, 00, 05, 10 European Quality of Life Survey 03, 07, 09, 10 (EB), 11
Themes Income and wages in Europe Wages, productivity and the wage share Working poverty and minimum wage The gender pay gap
 5. W A G E D E V E L O P M E N T S At the ETUC Congress in Seville in 27, wage developments in Europe were among the most debated issues. One of the key problems highlighted in this respect was the need
COMMISSION STAFF WORKING DOCUMENT Accompanying the document
 EUROPEAN COMMISSION Brussels, 9.10.2017 SWD(2017) 330 final PART 13/13 COMMISSION STAFF WORKING DOCUMENT Accompanying the document REPORT FROM THE COMMISSION TO THE EUROPEAN PARLIAMENT, THE COUNCIL, THE
Gender pension gap economic perspective
 Gender pension gap economic perspective Agnieszka Chłoń-Domińczak Institute of Statistics and Demography SGH Part of this research was supported by European Commission 7th Framework Programme project "Employment
Introduction of the euro in the new member states
 EOS Gallup Europe Introduction of the euro in the new member states - Report p. 1 Introduction of the euro in the new member states Conducted by EOS Gallup Europe upon the request of the European Commission.
Humanitarian Aid. Fieldwork June July 2006 Publication October 2006
 Special Eurobarometer European Commission Humanitarian Aid Fieldwork June July 2006 Publication October 2006 Special Eurobarometer 268 / Wave 65.4 TNS Opinion & Social This survey was requested by Directorate
Growth, competitiveness and jobs: priorities for the European Semester 2013 Presentation of J.M. Barroso,
 Growth, competitiveness and jobs: priorities for the European Semester 213 Presentation of J.M. Barroso, President of the European Commission, to the European Council of 14-1 March 213 Economic recovery
Eurofound in-house paper: Part-time work in Europe Companies and workers perspective
 Eurofound in-house paper: Part-time work in Europe Companies and workers perspective Presented by: Eszter Sandor Research Officer, Surveys and Trends 26/03/2010 1 Objectives Examine the patterns of part-time
Special Eurobarometer 465. Gender Equality 2017
 Summary Gender Equality 01 Gender Pay Gap Survey requested by the European Commission, Directorate-General for Justice and Consumers and co-ordinated by the Directorate-General for Communication This document
Fieldwork: October 2006 Report: December 2006
 Flash Eurobarometer European Commission Business attitudes towards cross-border sales and consumer protection Summary Fieldwork: October 2006 Report: December 2006 Flash Eurobarometer 186 The Gallup Organization
Development Aid in times of economic turmoil
 Special Eurobarometer European Commission Development Aid in times of economic turmoil Fieldwork: May 2009 June 2009 Publication: October 2009 Special Eurobarometer 318 / Wave 71.2 TNS Opinion & Social
Employment of older workers Research Note no. 5/2015
 Research Note no. 5/2015 E. Őzdemir, T. Ward M. Fuchs, S. Ilinca, O. Lelkes, R. Rodrigues, E. Zolyomi February - 2016 EUROPEAN COMMISSION Directorate-General for Employment, Social Affairs and Inclusion
Securing sustainable and adequate social protection in the EU
 Securing sustainable and adequate social protection in the EU Session on Social Protection & Security IFA 12th Global Conference on Ageing 11 June 2014, HICC Hyderabad India Dr Lieve Fransen European Commission
Pan-European opinion poll on occupational safety and health
 REPORT Pan-European opinion poll on occupational safety and health Results across 36 European countries Final report Conducted by Ipsos MORI Social Research Institute at the request of the European Agency
11 th Economic Trends Survey of the Impact of Economic Downturn
 11 th Economic Trends Survey 11 th Economic Trends Survey of the Impact of Economic Downturn 11 th Economic Trends Survey COUNTRY ANSWERS Austria 155 Belgium 133 Bulgaria 192 Croatia 185 Cyprus 1 Czech
Taxation trends in the European Union EU27 tax ratio at 39.8% of GDP in 2007 Steady decline in top personal and corporate income tax rates since 2000
 DG TAXUD STAT/09/92 22 June 2009 Taxation trends in the European Union EU27 tax ratio at 39.8% of GDP in 2007 Steady decline in top personal and corporate income tax rates since 2000 The overall tax-to-gdp
Traffic Safety Basic Facts Main Figures. Traffic Safety Basic Facts Traffic Safety. Motorways Basic Facts 2015.
 Traffic Safety Basic Facts 2013 - Main Figures Traffic Safety Basic Facts 2015 Traffic Safety Motorways Basic Facts 2015 Motorways General Almost 30.000 people were killed in road accidents on motorways
The 2009 European elections
 Special Eurobarometer 299 EUROPEAN PARLIAMENT European Commission The 2009 European elections Fieldwork: March May 2008 Publication: September 2008 Report Special Eurobarometer 299/ Wave 69.2 TNS opinion
NOTE ON EU27 CHILD POVERTY RATES
 NOTE ON EU7 CHILD POVERTY RATES Research note prepared for Child Poverty Action Group Authors: H. Xavier Jara and Chrysa Leventi Institute for Social and Economic Research (ISER) University of Essex The
May 2009 Euro area external trade surplus 1.9 bn euro 6.8 bn euro deficit for EU27
 STAT/09/106 17 July 2009 May 2009 Euro area external trade surplus 1.9 6.8 deficit for EU27 The first estimate for the euro area 1 (EA16) trade balance with the rest of the world in May 2009 gave a 1.9
Eco-label Flower week 2006
 Special Eurobarometer European Commission Eco-label Flower week 2006 Fieldwork: November-December 2006 Publication: January 2007 Special Eurobarometer 275 / Wave 66.3 TNS Opinion & Social This survey was
January 2009 Euro area external trade deficit 10.5 bn euro 26.3 bn euro deficit for EU27
 STAT/09/40 23 March 2009 January 2009 Euro area external trade deficit 10.5 26.3 deficit for EU27 The first estimate for the euro area 1 (EA16) trade balance with the rest of the world in January 2009
EUROPEAN COMMISSION EUROSTAT
 EUROPEAN COMMISSION EUROSTAT Directorate F: Social statistics Unit F-3: Labour market Doc.: Eurostat/F3/LAMAS/29/14 WORKING GROUP LABOUR MARKET STATISTICS Document for item 3.2.1 of the agenda LCS 2012
Fiscal sustainability challenges in Romania
 Preliminary Draft For discussion only Fiscal sustainability challenges in Romania Bucharest, May 10, 2011 Ionut Dumitru Anca Paliu Agenda 1. Main fiscal sustainability challenges 2. Tax collection issues
ENTREPRENEURSHIP IN THE EU AND BEYOND
 Flash Eurobarometer 354 ENTREPRENEURSHIP IN THE EU AND BEYOND COUNTRY REPORT SPAIN Fieldwork: June 2012 This survey has been requested by the European Commission, Directorate-General Enterprise and Industry
H Marie Skłodowska-Curie Actions (MSCA)
") H2020 Key facts and figures (2014-2020) Number of IE researchers funded by MSCA: EU budget awarded to IE organisations (EUR million): Number of IE organisations in MSCA: 253 116,04 116 In detail, the number
H2020 Key facts and figures (2014-2020) Number of IE researchers funded by MSCA: EU budget awarded to IE organisations (EUR million): Number of IE organisations in MSCA: 253 116,04 116 In detail, the number
H Marie Skłodowska-Curie Actions (MSCA)
") H2020 Key facts and figures (2014-2020) Number of BE researchers funded by MSCA: EU budget awarded to BE organisations (EUR million): Number of BE organisations in MSCA: 274 161,04 227 In detail, the number
H2020 Key facts and figures (2014-2020) Number of BE researchers funded by MSCA: EU budget awarded to BE organisations (EUR million): Number of BE organisations in MSCA: 274 161,04 227 In detail, the number
HOW RECESSION REFLECTS IN THE LABOUR MARKET INDICATORS
 REPUBLIC OF SLOVENIA HOW RECESSION REFLECTS IN THE LABOUR MARKET INDICATORS Matej Divjak, Irena Svetin, Darjan Petek, Miran Žavbi, Nuška Brnot ??? What is recession?? Why in Europe???? Why in Slovenia?
Air Passengers Rights
 Special Eurobarometer European Commission Air Passengers Rights Report Fieldwork: May June 2009 Publication: December 2009 Special Eurobarometer 319 / Wave 71.2 TNS Opinion & Social This survey was requested
August 2008 Euro area external trade deficit 9.3 bn euro 27.2 bn euro deficit for EU27
 STAT/08/143 17 October 2008 August 2008 Euro area external trade deficit 9.3 27.2 deficit for EU27 The first estimate for the euro area 1 (EA15) trade balance with the rest of the world in August 2008
H Marie Skłodowska-Curie Actions (MSCA)
") H2020 Key facts and figures (2014-2020) Number of NL researchers funded by MSCA: EU budget awarded to NL organisations (EUR million): Number of NL organisations in MSCA: 427 268.91 351 In detail, the number
H2020 Key facts and figures (2014-2020) Number of NL researchers funded by MSCA: EU budget awarded to NL organisations (EUR million): Number of NL organisations in MSCA: 427 268.91 351 In detail, the number
STAT/14/ October 2014
 STAT/14/158-21 October 2014 Provision of deficit and debt data for 2013 - second notification Euro area and EU28 government deficit at 2.9% and 3.2% of GDP respectively Government debt at 90.9% and 85.4%
Entrepreneurship in the EU and beyond. Analytical report
 Flash Eurobarometer The Gallup Organization Flash Eurobarometer European Commission Entrepreneurship in the EU and beyond A survey in the EU, EFTA countries, Croatia, Turkey, the US, Japan, South Korea
Traffic Safety Basic Facts Main Figures. Traffic Safety Basic Facts Traffic Safety. Motorways Basic Facts 2016.
 Traffic Safety Basic Facts 2013 - Main Figures Traffic Safety Basic Facts 2015 Traffic Safety Motorways Basic Facts 2016 Motorways General Almost 26.000 people were killed in road accidents on motorways
H Marie Skłodowska-Curie Actions (MSCA)
") H2020 Key facts and figures (2014-2020) Number of FR researchers funded by MSCA: EU budget awarded to FR organisations (EUR million): Number of FR organisations in MSCA: 1 072 311.72 479 In detail, the
H2020 Key facts and figures (2014-2020) Number of FR researchers funded by MSCA: EU budget awarded to FR organisations (EUR million): Number of FR organisations in MSCA: 1 072 311.72 479 In detail, the
H Marie Skłodowska-Curie Actions (MSCA)
") H2020 Key facts and figures (2014-2020) Number of FI researchers funded by MSCA: EU budget awarded to FI organisations (EUR million): Number of FI organisations in MSCA: 155 47.93 89 In detail, the number
H2020 Key facts and figures (2014-2020) Number of FI researchers funded by MSCA: EU budget awarded to FI organisations (EUR million): Number of FI organisations in MSCA: 155 47.93 89 In detail, the number
H Marie Skłodowska-Curie Actions (MSCA)
") H2020 Key facts and figures (2014-2020) Number of PT researchers funded by MSCA: EU budget awarded to PT organisations (EUR million): Number of PT organisations in MSCA: 716 66,67 165 In detail, the number
H2020 Key facts and figures (2014-2020) Number of PT researchers funded by MSCA: EU budget awarded to PT organisations (EUR million): Number of PT organisations in MSCA: 716 66,67 165 In detail, the number
Two years to go to the 2014 European elections European Parliament Eurobarometer (EB/PE 77.4)
") Directorate-General for Communication Public Opinion Monitoring Unit Two years to go to the 2014 European elections European Parliament Eurobarometer (EB/PE 77.4) Brussels, 6 February 2013 FOCUS REPORT
Directorate-General for Communication Public Opinion Monitoring Unit Two years to go to the 2014 European elections European Parliament Eurobarometer (EB/PE 77.4) Brussels, 6 February 2013 FOCUS REPORT
Investment in France and the EU
 Investment in and the EU Natacha Valla March 2017 22/02/2017 1 Change relative to 2008Q1 % of GDP Slow recovery of investment, and with strong heterogeneity Overall Europe s recovery in investment is slow,
EBA REPORT ON HIGH EARNERS
 EBA REPORT ON HIGH EARNERS DATA AS OF END 2017 LONDON - 11/03/2019 1 Data on high earners List of figures 3 Executive summary 4 1. Data on high earners 6 1.1 Background 6 1.2 Data collected on high earners
H Marie Skłodowska-Curie Actions (MSCA)
") H2020 Key facts and figures (2014-2020) Number of SE researchers funded by MSCA: EU budget awarded to SE organisations (EUR million): Number of SE organisations in MSCA: 138 114.71 150 In detail, the number
H2020 Key facts and figures (2014-2020) Number of SE researchers funded by MSCA: EU budget awarded to SE organisations (EUR million): Number of SE organisations in MSCA: 138 114.71 150 In detail, the number
COVER NOTE The Employment Committee Permanent Representatives Committee (Part I) / Council EPSCO Employment Performance Monitor - Endorsement
 / Council EPSCO Employment Performance Monitor - Endorsement") COUNCIL OF THE EUROPEAN UNION Brussels, 15 June 2011 10666/1/11 REV 1 SOC 442 ECOFIN 288 EDUC 107 COVER NOTE from: to: Subject: The Employment Committee Permanent Representatives Committee (Part I) / Council
COUNCIL OF THE EUROPEAN UNION Brussels, 15 June 2011 10666/1/11 REV 1 SOC 442 ECOFIN 288 EDUC 107 COVER NOTE from: to: Subject: The Employment Committee Permanent Representatives Committee (Part I) / Council
H Marie Skłodowska-Curie Actions (MSCA)
") H2020 Key facts and figures (2014-2020) Number of LV researchers funded by MSCA: EU budget awarded to LV organisations (EUR million): Number of LV organisations in MSCA: 35 3.91 11 In detail, the number
H2020 Key facts and figures (2014-2020) Number of LV researchers funded by MSCA: EU budget awarded to LV organisations (EUR million): Number of LV organisations in MSCA: 35 3.91 11 In detail, the number
Country Health Profiles
 State of Health in the EU Country Health Profiles Brussels, November 2017 1 The Country Health Profiles 1. Highlights 2. Health status 3. Risk Factors 4. Health System (description) 5. Performance of Health
Traffic Safety Basic Facts Main Figures. Traffic Safety Basic Facts Traffic Safety. Motorways Basic Facts 2017.
 Traffic Safety Basic Facts 2013 - Main Figures Traffic Safety Basic Facts 2015 Traffic Safety Motorways Basic Facts 2017 Motorways General More than 24.000 people were killed in road accidents on motorways
COMMISSION DECISION of 23 April 2012 on the second set of common safety targets as regards the rail system (notified under document C(2012) 2084)
 2084)") 27.4.2012 Official Journal of the European Union L 115/27 COMMISSION DECISION of 23 April 2012 on the second set of common safety targets as regards the rail system (notified under document C(2012) 2084)
27.4.2012 Official Journal of the European Union L 115/27 COMMISSION DECISION of 23 April 2012 on the second set of common safety targets as regards the rail system (notified under document C(2012) 2084)
Macroeconomic overview SEE and Macedonia
 Macroeconomic overview SEE and Macedonia Zoltan Arokszallasi Chief Analyst, Macro & FX/FI Research Erste Group Bank Erste Investors Breakfast, 29 September, Skopje 02. Oktober SEE shows mixed performance
in focus Statistics T he em ploym ent of senior s in t he Eur opean Union Contents POPULATION AND SOCIAL CONDITIONS 15/2006 Labour market
 T he em ploym ent of senior s in t he Eur opean Union Statistics in focus OULATION AND SOCIAL CONDITIONS 15/2006 Labour market Authors Christel ALIAGA Fabrice ROMANS Contents In 2005, in the EU-25, 22.2
Scenario for the European Insurance and Occupational Pensions Authority s EU-wide insurance stress test in 2016
 17 March 2016 ECB-PUBLIC Scenario for the European Insurance and Occupational Pensions Authority s EU-wide insurance stress test in 2016 Introduction In accordance with its mandate, the European Insurance
The EU's relations with its neighbours
 Special Eurobarometer European Commission The EU's relations with its neighbours A survey of attitudes in the European Union Fieldwork: May-June 2007 Publication: September 2007 Special Eurobarometer 285
Transition from Work to Retirement in EU25
 EUROPEAN CENTRE EUROPÄISCHES ZENTRUM CENTRE EUROPÉEN 1 Asghar Zaidi is Director Research at the European Centre for Social Welfare Policy and Research, Vienna; Michael Fuchs is Researcher at the European
Investment in Ireland and the EU
 Investment in and the EU Debora Revoltella Director Economics Department Dublin April 10, 2017 20/04/2017 1 Real investment: IE v EU country groupings Real investment (2008 = 100) 180 160 140 120 100 80
H Marie Skłodowska-Curie Actions (MSCA)
") H2020 Key facts and figures (2014-2020) Number of AT researchers funded by MSCA: EU budget awarded to AT organisations (EUR million): Number of AT organisations in MSCA: 215 78.57 140 In detail, the number
H2020 Key facts and figures (2014-2020) Number of AT researchers funded by MSCA: EU budget awarded to AT organisations (EUR million): Number of AT organisations in MSCA: 215 78.57 140 In detail, the number
The Future Constitutional Treaty
 Special Eurobarometer European Commission The Future Constitutional Treaty Fieldwork: November 2004 Publication: March 2005 Special Eurobarometer 214 / Wave 62.1 TNS Opinion & Social This survey was requested
Library statistical spotlight
 /9/2 Library of the European Parliament 6 4 2 This document aims to provide a picture of the, in particular by looking at car production trends since 2, at the number of enterprises and the turnover they
Investment in Germany and the EU
 Investment in Germany and the EU Pedro de Lima Head of the Economics Studies Division Economics Department Berlin 19/12/2016 11/01/2017 1 Slow recovery of investment, with strong heterogeneity Overall
Investment and Investment Finance. the EU and the Polish story. Debora Revoltella
 Investment and Investment Finance the EU and the Polish story Debora Revoltella Director - Economics Department EIB Warsaw 27 February 2017 Narodowy Bank Polski European Investment Bank Contents We look
EUROPEAN SMALL CLAIMS PROCEDURE
 Special Eurobarometer 395 EUROPEAN SMALL CLAIMS PROCEDURE SUMMARY Fieldwork: November December 2012 Publication: April 2013 This survey has been requested by the European Commission, Directorate-General
Report on the distribution of direct payments to agricultural producers (financial year 2016)
") Report on the distribution of direct payments to agricultural producers (financial year 2016) Every year, the Commission publishes the distribution of direct payments to farmers by Member State. Figures
Report on the distribution of direct payments to agricultural producers (financial year 2016) Every year, the Commission publishes the distribution of direct payments to farmers by Member State. Figures