Standard Eurobarometer 83 Spring 2015 THE EU BUDGET REPORT
|
|
|
- Augustus Wright
- 5 years ago
- Views:
Transcription


1 Standard Eurobarometer 83 Spring 2015 THE EU BUDGET REPORT Fieldwork: May 2015 This survey has been requested and co-ordinated by the European Commission, Directorate-General for Communication. This document does not represent the point of view of the European Commission. The interpretations and opinions contained in it are solely those of the authors. Standard Eurobarometer 83 / Spring 2015 TNS opinion & social
2 Project title Linguistic Version Catalogue Number Standard Eurobarometer 83 The EU budget EN NA EN-N ISBN DOI / European Union, 2015
3 Standard Eurobarometer 83 Spring 2015 The EU budget Survey conducted by TNS opinion & social at the request of the European Commission, Directorate-General for Communication Survey coordinated by the European Commission, Directorate-General for Communication (DG COMM "Strategy, Corporate Communication Actions and Eurobarometer" Unit)
4 TABLE OF CONTENTS INTRODUCTION... 2 I. EUROPEANS AND THE EUROPEAN UNION BUDGET... 4 II. THE EUROPEAN UNION BUDGET: PERCEPTIONS III. THE EUROPEAN UNION BUDGET: EXPECTATIONS ANNEXES Technical specifications 1
5 INTRODUCTION This Standard Eurobarometer 83 of spring 2015 aims to provide an overview of public perceptions of the European Union budget. It addresses the following points: Do Europeans think that the European Union s political objectives would justify an increase in the EU budget? How do they perceive the EU budget in terms of value for money today? What so they perceive to be the areas in which the European Union budget is primarily spent? What are the expectations of Europeans in terms of spending priorities for the EU budget? Are there significant differences between the perceptions that Europeans have of the European Union budget and their expectations? The full Standard Eurobarometer 83 report consists of five volumes. The first volume presents the state of public opinion in the European Union. Four other volumes present the views of Europeans on other issues: the Europe 2020 strategy; European citizenship; the European Union budget; Europeans and economic statistics. This volume is devoted to the European Union budget. This Standard Eurobarometer 83 survey (EB83) was conducted between 16 and 27 May 2015 in 34 countries and territories 1 : the 28 Member States of the European Union (EU), five candidate countries 2 (the former Yugoslav Republic of Macedonia, Turkey, Montenegro, Serbia and Albania) and the Turkish Cypriot Community in the part of the country not controlled by the government of the Republic of Cyprus. The questions on the EU budget were asked only in the 28 EU Member States. The results of this survey are compared with those of the Standard Eurobarometer survey of spring 2011 (EB75). At that time the European Union had 27 Member States (Croatia having joined the EU in June 2013). The methodology used is that of the Standard Eurobarometer surveys of the Directorate-General for Communication ( Strategy, Corporate Communication Actions and Eurobarometer Unit) 3. A technical note describing how the institutes within the TNS opinion & social network conduct interviews is included in the report s annexes. 1 Please refer to the technical specifications for information on the exact dates of the interviews in each country. 2 The survey was not conducted in Iceland. In March 2015, the Icelandic government requested that Iceland should not be regarded as a candidate country for EU membership
6 This note also specifies the confidence intervals 4, which enable us to assess the accuracy of a survey s results, according to the size of the sample polled in relation to the total size of the population studied. The abbreviations used in this report correspond to: ABBREVIATIONS BE Belgium LV Latvia CZ Czech Republic LU Luxembourg BG Bulgaria HU Hungary DK Denmark MT Malta DE Germany NL The Netherlands EE Estonia AT Austria EL Greece PL Poland ES Spain PT Portugal FR France RO Romania HR Croatia SI Slovenia IE Ireland SK Slovakia IT Italy FI Finland CY Republic of Cyprus* SE Sweden LT Lithuania UK United Kingdom CY (tcc) Turkish Cypriot Community TR Turkey ME Montenegro MK Former Yugoslav Republic of Macedonia ** RS Serbia AL Albania EU28 Euro area European Union weighted average for the 28 Member States BE, FR, IT, LU, DE, AT, ES, PT, IE, NL, FI, EL, EE, SI, CY, MT, SK, LV, LT Noneuro area BG, CZ, DK, HR, HU, PL, RO, SE, UK * Cyprus as a whole is one of the 28 European Union Member States. However, the acquis communautaire has been suspended in the part of the country that is not controlled by the government of the Republic of Cyprus. For practical reasons, only the interviews carried out in the part of the country controlled by the government of the Republic of Cyprus are included in the CY category and in the EU28 average. The interviews carried out in the part of the country that is not controlled by the government of the Republic of Cyprus are included in the CY(tcc) [tcc: Turkish Cypriot Community] category. ** Provisional abbreviation which in no way prejudges the definitive name of this country, which will be agreed once the current negotiations at the United Nations have been completed * * * * * We wish to thank all the people interviewed throughout Europe who took the time to take part in this survey. Without their active participation, this survey would not have been possible. 4 The results tables are annexed. It should be noted that the total of the percentages indicated in the tables in the tables in this report may exceed 100% when the respondents were able to choose several answers to a question. 3
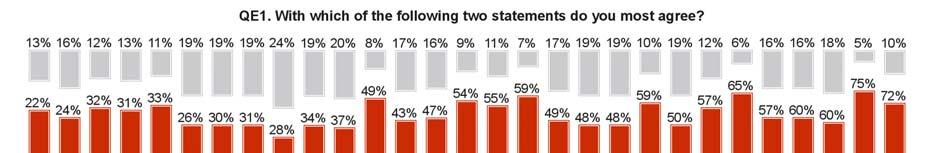
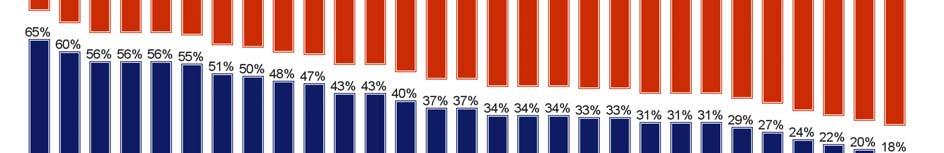
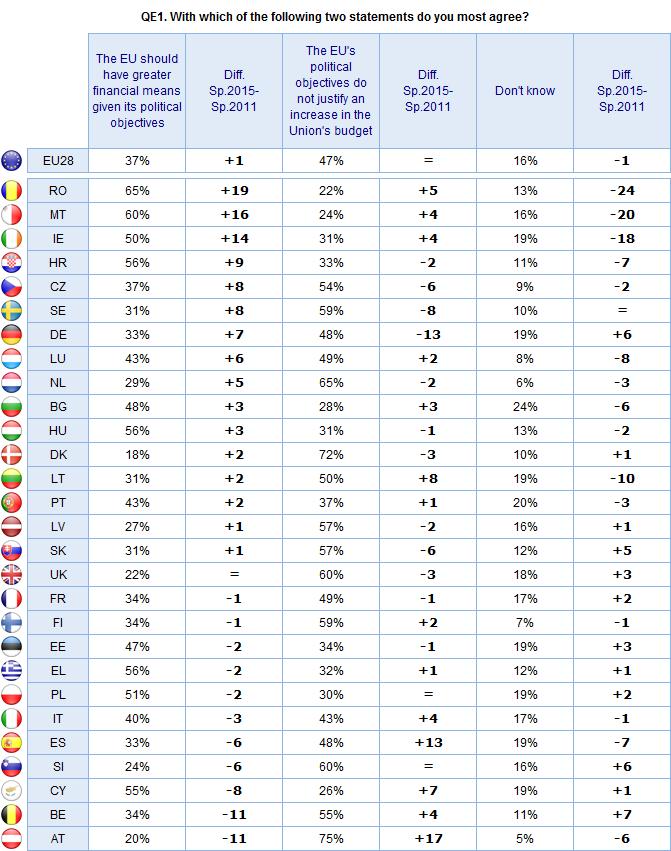
7 I. EUROPEANS AND THE EUROPEAN UNION BUDGET Almost half of Europeans agree that the EU s political objectives do not justify an increase in the Union s budget 5 : 47%, unchanged since the Standard Eurobarometer survey of spring 2011 (EB75). More than a third of Europeans take the opposite view: 37% believe that the EU should have greater financial means given its political objectives, a one percentage point increase since spring 2011, but still the minority view. Lastly, 16% express no opinion (-1 percentage point). A majority of respondents in 17 Member States say that an increase in the European Union budget is not justified (versus 15 in spring ), with the highest levels of opposition in Austria (75%), Denmark (72%) and the Netherlands (65%). However, the view that the EU should have greater financial means given its political objectives is supported by a majority of respondents in 11 countries, most notably in Romania (65%), Malta (60%), Greece (56%), Croatia (56%), Hungary (56%), Cyprus (55%) and Poland (51%). The belief that the EU should have greater financial means in order to meet its political objectives has gained significant ground since spring 2011 in Romania (65%, +19 percentage points), Malta (60%, +16) and Ireland (50%, +14), while support for the opposite view has increased significantly in Austria (75%, +17) and Spain (48%, +13). 5 QE1. With which of the following two statements do you most agree? 6 In spring 2011, the European Union had 27 Member States. It has had 28 members since the entry of Croatia in June
8 5
9 6
.")
10 The impression that the European Union budget gives good value for money for EU citizens has gained ground since the Standard Eurobarometer survey of spring 2011 (31%, +4 percentage points) 7. However, those who support this opinion are still outnumbered by those who believe that it gives poor value for money (43%, -1). More than a quarter of Europeans express no opinion on this subject (26%, -3). A majority of non-euro area respondents believe that the European Union budget gives good value for money for EU citizens (39% for it gives good value for money for EU citizens, versus 37%), whereas only a minority of euro area respondents agree (26% versus 47%). Positive opinions outweigh negative opinions in 11 Member States (compared with six in spring 2011), particularly in countries where a majority of respondents say that an increase in the Union s budget would be justified: Croatia (55%), Malta (53%) and Romania (49%). A majority of respondents are critical of the cost-effectiveness of the European budget in 17 countries, most notably in Austria (64%), where there is strong opposition to an increase in the EU budget, but also in Greece (59%), Belgium (58%), France (54%) and Cyprus (54%). In Greece and Cyprus, a broad majority of respondents believe that the European Union budget should be increased given the Union s political objectives (56% and 55% respectively). 7 QE4. Generally speaking, thinking about the EU budget, would you say that? 7

, Ireland (46%, +17), Lithuania (41%, +14) and Bulgaria")
, Austria (64%, +11) and Spain")
11 Respondents are significantly more likely than in spring 2011 to see the European Union budget as representing good value for money in Malta (53%, +28 percentage points), Romania (49%, +19), Ireland (46%, +17), Lithuania (41%, +14) and Bulgaria (43%, +11), while the opposite view has gained significant ground in Cyprus (54%, +20), Austria (64%, +11) and Spain (49%, +11). 8

12 *NA = Not Asked: this question was not asked in this country in the previous survey * 9
 8. Administrative and personnel costs, buildings continues to be perceived as the European Union s main item of expenditure, unchanged since spring 2011 at 32%.")
, ahead of assistance to EU neighbours, including candidate countries, which is mentioned less often than in spring 2011 (21%, -3).")
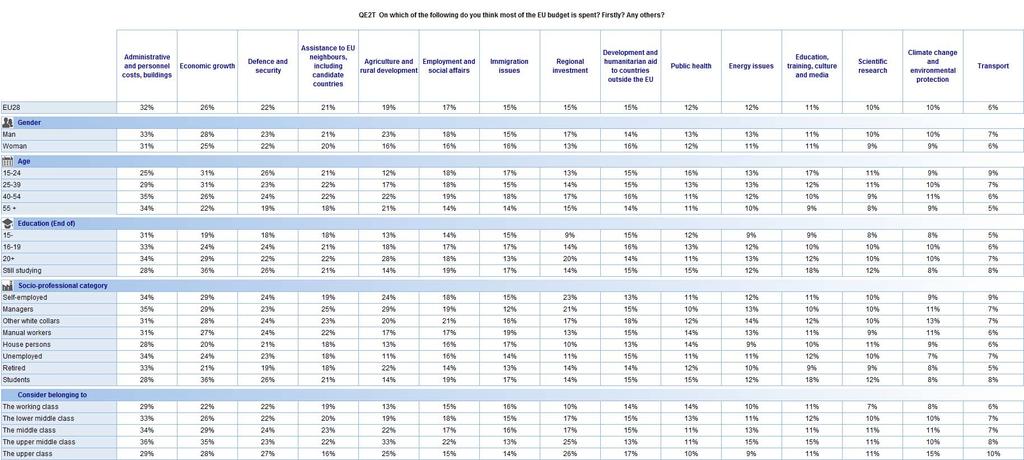
13 II. THE EUROPEAN UNION BUDGET: PERCEPTIONS Respondents were first asked to identify the areas in which they believe most of the European Union budget is spent (firstly, and then any others, giving up to three additional answers) 8. Administrative and personnel costs, buildings continues to be perceived as the European Union s main item of expenditure, unchanged since spring 2011 at 32%. Following an increase of three percentage points, economic growth (26%) has moved from third to second place in the list of items on which Europeans believe most of the European Union budget is spent. Defence and security remains in third place (22%, -1), ahead of assistance to EU neighbours, including candidate countries, which is mentioned less often than in spring 2011 (21%, -3). Next, with scores of between 20% and 15% respondents mentioned: agriculture and rural development (19%, -4); employment and social affairs (17%, +2); immigration issues (15%, +3 since spring 2011 and +7 since autumn 2008); regional investment (15%, +1); and development and humanitarian aid to countries outside the EU (15%, +1). The remaining six items were mentioned by less than 15% of respondents. Maximum four answers 8 QE2T. On which of the following do you think most of the EU budget is spent? Firstly? And then? 10
, ahead of economic growth (11%, +2).")
14 When we limit our analysis to the first answer given, the first two items are unchanged: administrative and personnel costs, buildings remains in first place (17%, +1 percentage point since spring 2011), ahead of economic growth (11%, +2). The ranking is then slightly different: agriculture and rural development is in third place (9%, -1), ahead of assistance to EU neighbours, including candidate countries (8%, -2) and defence and security (8%, unchanged). First answer given Euro area respondents are more likely than non-euro area respondents to believe that most of the EU budget is spent on administrative and personnel costs, buildings (36% versus 23% outside the euro area) and assistance to EU neighbours, including candidate countries (23% versus 16%). Conversely, non-euro area respondents (16%) are more likely than euro area respondents (10%) to mention public health as a priority spending area for the EU budget. Administrative and personnel costs, buildings is perceived as the main area in which the EU allocates its budget in 12 Member States (versus 10 in spring 2011). This item is also ranked in joint first place in the United Kingdom, with economic growth (both 23%). Very high proportions of respondents in Austria (56%), Slovenia (52%) and Finland (52%) mentioned administrative costs. 11
15 Economic growth tops the list of areas to which respondents think that the European Union allocates its budget in six Member States (versus 10 in spring 2011). This item is also ranked in joint first place in Malta, with public health (both 32%), and in Bulgaria, with defence and security (both 26%). Economic growth obtained its highest score in the Netherlands (43%). Defence and security is the most frequently mentioned item in four Member States (compared with only two, Greece and Latvia, in spring 2011): Lithuania (46%), Latvia (35%), Romania (33%) and Estonia (31%). Agriculture and rural development is the most frequently mentioned item in Sweden (52%) and Denmark (45%), whereas this was also the case in Poland in spring Regional investment is seen as the EU s largest budget item in the Czech Republic (31%). 12

16 Maximum four answers 13

17 Six most frequently mentioned items * NA = Not Asked: this question was not asked in this country in the previous survey 14
18 15
 9.")
.")
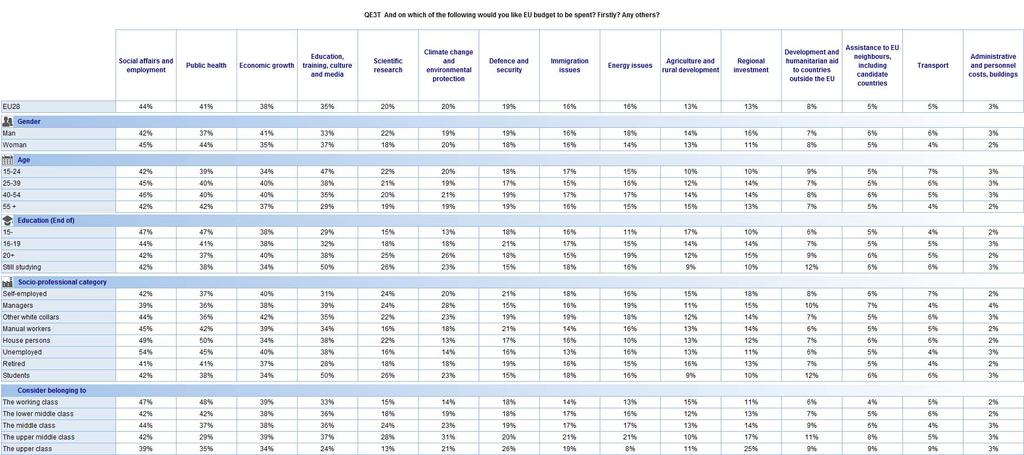
19 III. THE EUROPEAN UNION BUDGET: EXPECTATIONS - Social issues have gained ground among the expected spending priorities for the European Union budget - Respondents were then asked to choose the areas in which they would like the EU budget to be spent (firstly, and then any others, giving up to three additional answers) 9. Employment and social affairs continues to top the list of expectations (44% of total mentions), up two percentage points since the Standard Eurobarometer survey of spring 2011 (EB75) and eight points since autumn It also tops the list when only the first answer given is taken into consideration (19%, +2 percentage points). Public health is now ranked in second place following a five-point rise (41%), ahead of economic growth (38%, -2). Education, training, culture and media has fallen from first 10 to fourth place in the order of expectations for European Union budget spending (35%, -7). Next, respondents mentioned scientific research (20%, unchanged since spring 2011), climate change and environmental protection, (20%, -2 percentage points), defence and security (19%, +5), immigration issues (16%, +4) and energy issues (16%, -6). The other six items were mentioned by less than 15% of respondents. Maximum four answers 9 QE3T. And on which of the following would you like the EU budget to be spent? Firstly? And then? 10 This item is the result of the combination of two items from the spring 2011 survey: Education and training and Culture and media. 16

, ahead of public health")
20 When we limit our analysis to the first answer given, the four most frequently mentioned items are the same, but economic growth (in second place) and public health (in third place) have changed places. First answer given Employment and social affairs, public health and economic growth are the top three areas in which Europeans want the European Union to prioritise its spending, both within and outside the euro area, but with a different ranking in the two groups of countries: In the euro area countries, employment and social affairs are ranked in first place (48%), ahead of public health (40%) and economic growth (40%). Euro area respondents are also more likely to mention education, training, culture and media (38% compared with 30% in the non-euro area countries) as well as scientific research (23% versus 14%) and climate change and environmental protection (22% versus 15%); In the non-euro area countries, public health tops the list of priorities (41%), ahead of employment and social affairs (36%) and economic growth (34%). Employment and social affairs tops the list of priority areas for EU budget spending in 11 Member States. This item is also ranked in joint first place in Austria, with education, training, culture and media (46%), and in Poland, with public health (36%). 17
21 More than six in ten respondents put employment and social affairs at the top of their list of European Union budget priorities in Spain (69%) and Portugal (62%). Public health is seen as the priority in six Member States, led by Cyprus (72%), and also by more than half the respondents in Ireland (57%) and Malta (51%). Though not the top priority, it was also frequently mentioned in Spain (64%), Greece (61%) and Portugal (51%). Economic growth is the most frequently mentioned area in which respondents want the EU to prioritise its budget spending in six Member States, led by Greece (66%), Slovenia (57%), Lithuania (57%) and Bulgaria (54%). Although not the top priority, economic growth was also frequently mentioned in Cyprus (60%) Education, training, culture and media is the leading item in the Netherlands (52%), and climate change and environmental protection was the most frequently mentioned area in Sweden (54%) and Denmark (44%). 18

22 Maximum four answers 19

23 Six most frequently mentioned items * NA = Not Asked: this question was not asked in this country in the previous survey 20
24 21
25 A comparison between the perceptions and expectations of Europeans with regard to the European Union budget reveals that: There is a significant gap between how much of the EU budget Europeans would like (expectations) 11 to see spent on social affairs and employment, health and education and what they believe (perceptions) 12 is currently spent in these areas. Perceptions fall more than 20 percentage points short of expectations for each item of expenditure; These social, employment, health and education issues are perceived as underresourced in comparison with the assistance granted to EU neighbours or the humanitarian aid granted to countries outside the EU 13. For the last two items, expectations are below perceptions. Five percent of respondents would like (expectations) the EU to allocate most of its budget to assistance to EU neighbours, compared with 21% who think (perceptions) that this is how the budget is spent (a 16-point difference). In the case of humanitarian aid to countries outside the EU these proportions are 8% (expectations) and 15% (perceptions), a seven-point difference; There is also a significant gap for economic growth, but in this instance expectations outrun perceptions: 38% of respondents would like this to be a priority area for the EU budget, compared with 26% who think that it already is. This item of expenditure is nevertheless among the top three of both expectations and perceptions; Expectations are more in line with perceptions in the case of defence and security (19% of expectations, versus 22% of perceptions), immigration issues (16% versus 15%) and energy issues (16% versus 12%); Administrative and personnel costs, buildings continues to give rise to the biggest gap between perceptions and expectations: while it is perceived as an area where the EU has prioritised spending (32%), it comes last in terms of expectations (3%) And on which of the following would you like the EU budget to be spent? 12 On which of the following do you think most of the EU budget is spent? 13 With the exception of employment and social affairs (17%), mentioned slightly more frequently than humanitarian aid to countries outside the EU (15%). 14 For information, administrative costs represent less than 6% of the total EU budget (2015 budget). 22


26 Comparison of expectations and perceptions with regard to the European Union budget 23
.")
27 In terms of evolutions since spring 2011, the gap between perceptions and expectations has increased the most for public health (29 percentage points separate expectations, 41%, from perceptions, 12%, compared with 25 points in spring 2011, a 4-point rise). In contrast, the gap has decreased for a total of eight items, most significantly for defence and security (3 percentage points between expectations, 19%, and perceptions, 22%, compared with 9 points in spring 2011, a 6-point fall), energy issues (-5) and economic growth (-5). 24
28 STANDARD EUROBAROMETER 83 The EU budget TECHNICAL SPECIFICATIONS Between the 16 th and the 27 th of May 2015, TNS opinion & social, a consortium created between TNS political & social, TNS UK and TNS opinion, carried out the wave 83.3 of the EUROBAROMETER survey, on request of the EUROPEAN COMMISSION, Directorate-General for Communication, Strategy, Corporate Communication Actions and Eurobarometer unit. The wave 83.3 is the STANDARD EUROBAROMETER 83 survey and covers the population of the respective nationalities of the European Union Member States, resident in each of the Member States and aged 15 years and over. The STANDARD EUROBAROMETER 83 survey has also been conducted in five candidate countries (Turkey, the Former Yugoslav Republic of Macedonia, Montenegro, Serbia and Albania) and in the Turkish Cypriot Community. In these countries, the survey covers the national population of citizens and the population of citizens of all the European Union Member States that are residents in these countries and have a sufficient command of the national languages to answer the questionnaire. The basic sample design applied in all states is a multi-stage, random (probability) one. In each country, a number of sampling points was drawn with probability proportional to population size (for a total coverage of the country) and to population density. In order to do so, the sampling points were drawn systematically from each of the "administrative regional units", after stratification by individual unit and type of area. They thus represent the whole territory of the countries surveyed according to the EUROSTAT NUTS II (or equivalent) and according to the distribution of the resident population of the respective nationalities in terms of metropolitan, urban and rural areas. In each of the selected sampling points, a starting address was drawn, at random. Further addresses (every Nth address) were selected by standard "random route" procedures, from the initial address. In each household, the respondent was drawn, at random (following the "closest birthday rule"). All interviews were conducted face-to-face in people's homes and in the appropriate national language. As far as the data capture is concerned, CAPI (Computer Assisted Personal Interview) was used in those countries where this technique was available. For each country a comparison between the sample and the universe was carried out. The Universe description was derived from Eurostat population data or from national statistics offices. For all countries surveyed, a national weighting procedure, using marginal and intercellular weighting, was carried out based on this Universe description. In all countries, gender, age, region and size of locality were introduced in the iteration procedure. For international weighting (i.e. EU averages), TNS Opinion & Social applies the official population figures as provided by EUROSTAT or national statistic offices. The total population figures for input in this post-weighting procedure are listed below. TS1
29 Readers are reminded that survey results are estimations, the accuracy of which, everything being equal, rests upon the sample size and upon the observed percentage. With samples of about 1,000 interviews, the real percentages vary within the following confidence limits: Statistical Margins due to the sampling process (at the 95% level of confidence) various sample sizes are in rows various observed results are in columns 5% 10% 15% 20% 25% 30% 35% 40% 45% 50% 95% 90% 85% 80% 75% 70% 65% 60% 55% 50% N=50 6,0 8,3 9,9 11,1 12,0 12,7 13,2 13,6 13,8 13,9 N=50 N=500 1,9 2,6 3,1 3,5 3,8 4,0 4,2 4,3 4,4 4,4 N=500 N=1000 1,4 1,9 2,2 2,5 2,7 2,8 3,0 3,0 3,1 3,1 N=1000 N=1500 1,1 1,5 1,8 2,0 2,2 2,3 2,4 2,5 2,5 2,5 N=1500 N=2000 1,0 1,3 1,6 1,8 1,9 2,0 2,1 2,1 2,2 2,2 N=2000 N=3000 0,8 1,1 1,3 1,4 1,5 1,6 1,7 1,8 1,8 1,8 N=3000 N=4000 0,7 0,9 1,1 1,2 1,3 1,4 1,5 1,5 1,5 1,5 N=4000 N=5000 0,6 0,8 1,0 1,1 1,2 1,3 1,3 1,4 1,4 1,4 N=5000 N=6000 0,6 0,8 0,9 1,0 1,1 1,2 1,2 1,2 1,3 1,3 N=6000 N=7000 0,5 0,7 0,8 0,9 1,0 1,1 1,1 1,1 1,2 1,2 N=7000 N=7500 0,5 0,7 0,8 0,9 1,0 1,0 1,1 1,1 1,1 1,1 N=7500 N=8000 0,5 0,7 0,8 0,9 0,9 1,0 1,0 1,1 1,1 1,1 N=8000 N=9000 0,5 0,6 0,7 0,8 0,9 0,9 1,0 1,0 1,0 1,0 N=9000 N= ,4 0,6 0,7 0,8 0,8 0,9 0,9 1,0 1,0 1,0 N=10000 N= ,4 0,6 0,7 0,7 0,8 0,9 0,9 0,9 0,9 0,9 N=11000 N= ,4 0,5 0,6 0,7 0,8 0,8 0,9 0,9 0,9 0,9 N=12000 N= ,4 0,5 0,6 0,7 0,7 0,8 0,8 0,8 0,9 0,9 N=13000 N= ,4 0,5 0,6 0,7 0,7 0,8 0,8 0,8 0,8 0,8 N=14000 N= ,3 0,5 0,6 0,6 0,7 0,7 0,8 0,8 0,8 0,8 N= % 10% 15% 20% 25% 30% 35% 40% 45% 50% 95% 90% 85% 80% 75% 70% 65% 60% 55% 50% TS2
30 ABBR. COUNTRIES INSTITUTES N DATES POPULATION PROPORTION INTERVIEWS FIELDWORK 15+ EU28 BE Belgium TNS Dimarso 1,014 16/05/15 26/05/15 9,263, % BG Bulgaria TNS BBSS 1,063 16/05/15 26/05/15 6,294, % CZ Czech Rep. TNS Aisa 1,021 16/05/15 26/05/15 8,955, % DK Denmark TNS Gallup DK 1,020 16/05/15 26/05/15 4,625, % DE Germany TNS Infratest 1,554 16/05/15 26/05/15 71,283, % EE Estonia TNS Emor 1,001 16/05/15 26/05/15 1,113, % IE Ireland Behaviour & Attitudes 1,018 16/05/15 26/05/15 3,586, % EL Greece TNS ICAP /05/15 26/05/15 8,791, % ES Spain TNS Spain 1,002 16/05/15 26/05/15 39,506, % FR France TNS Sofres /05/15 26/05/15 51,668, % HR Croatia HENDAL 1,008 16/05/15 26/05/15 3,625, % IT Italy TNS Italia 1,028 16/05/15 26/05/15 51,336, % CY Rep. Of Cyprus CYMAR /05/15 26/05/15 724, % LV Latvia TNS Latvia 1,005 16/05/15 26/05/15 1,731, % LT Lithuania TNS LT 1,003 16/05/15 26/05/15 2,535, % LU Luxembourg TNS ILReS /05/15 27/05/15 445, % HU Hungary TNS Hoffmann 1,055 16/05/15 26/05/15 8,477, % MT Malta MISCO /05/15 26/05/15 360, % NL Netherlands TNS NIPO 1,010 16/05/15 26/05/15 13,901, % AT Austria ipr Umfrageforschung 1,032 16/05/15 27/05/15 7,232, % PL Poland TNS Polska /05/15 26/05/15 32,736, % PT Portugal TNS Portugal 1,000 16/05/15 26/05/15 8,512, % RO Romania TNS CSOP 1,007 16/05/15 26/05/15 16,880, % SI Slovenia RM PLUS 1,008 16/05/15 26/05/15 1,760, % SK Slovakia TNS Slovakia 1,051 16/05/15 26/05/15 4,580, % FI Finland TNS Gallup Oy 1,013 16/05/15 26/05/15 4,511, % SE Sweden TNS Sifo 1,037 16/05/15 26/05/15 7,944, % UK United Kingdom TNS UK 1,306 16/05/15 26/05/15 52,104, % TOTAL EU28 27,758 16/05/15 27/05/15 424,491, %* CY(tcc) * It should be noted that the total percentage shown in this table may exceed 100% due to rounding Turkish Cypriot KADEM /05/15 25/05/15 143,226 Community TR Turkey TNS Piar 1,010 16/05/15 27/05/15 54,844,406 MK Former Yugoslav Rep. of Macedonia TNS BRIMA 1,055 16/05/15 23/05/15 1,678,404 ME Montenegro TNS Medium Gallup /05/15 24/05/15 492,265 RS Serbia TNS Medium Gallup 1,015 16/05/15 26/05/15 6,409,693 AL Albania TNS BBSS 1,000 16/05/15 25/05/15 2,221,572 TOTAL 31,868 16/05/15 27/05/15 490,281,338 TS3
of the European Commission. Communication. This document of the authors. Standard Eurobarometer 75 / Spring 2011 TNS opinion & social
 Standard Eurobarometer European Commission EUROBAROMETER 75 SPRING 2011 Europeans and the European Union budget REPORT Standard Eurobarometer 75 / Spring 2011 TNS opinion & social Fieldwork: May 2011 Publication:
Standard Eurobarometer
 Standard Eurobarometer 67 / Spring 2007 Standard Eurobarometer European Commission SPECIAL EUROBAROMETER EUROPEANS KNOWELEDGE ON ECONOMICAL INDICATORS 1 1 This preliminary analysis is done by Antonis PAPACOSTAS
Eco-label Flower week 2006
 Special Eurobarometer European Commission Eco-label Flower week 2006 Fieldwork: November-December 2006 Publication: January 2007 Special Eurobarometer 275 / Wave 66.3 TNS Opinion & Social This survey was
PUBLIC PERCEPTIONS OF VAT
 Special Eurobarometer 424 PUBLIC PERCEPTIONS OF VAT REPORT Fieldwork: October 2014 Publication: March 2015 This survey has been requested by the European Commission, Directorate-General for Taxations and
ENTREPRENEURSHIP IN THE EU AND BEYOND
 Flash Eurobarometer 354 ENTREPRENEURSHIP IN THE EU AND BEYOND COUNTRY REPORT SPAIN Fieldwork: June 2012 This survey has been requested by the European Commission, Directorate-General Enterprise and Industry
Special Eurobarometer 418 SOCIAL CLIMATE REPORT
 Special Eurobarometer 418 SOCIAL CLIMATE REPORT Fieldwork: June 2014 Publication: November 2014 This survey has been requested by the European Commission, Directorate-General for Employment, Social Affairs
Flash Eurobarometer 408 EUROPEAN YOUTH REPORT
 Flash Eurobarometer EUROPEAN YOUTH REPORT Fieldwork: December 2014 Publication: April 2015 This survey has been requested by the European Commission, Directorate-General for Education and Culture and co-ordinated
Flash Eurobarometer 441. Report. European SMEs and the Circular Economy
 European SMEs and the Circular Economy Survey requested by the European Commission, Directorate-General Environment and co-ordinated by the Directorate-General for Communication This document does not
Flash Eurobarometer 398 WORKING CONDITIONS REPORT
 Flash Eurobarometer WORKING CONDITIONS REPORT Fieldwork: April 2014 Publication: April 2014 This survey has been requested by the European Commission, Directorate-General for Employment, Social Affairs
EUROPEAN SMALL CLAIMS PROCEDURE
 Special Eurobarometer 395 EUROPEAN SMALL CLAIMS PROCEDURE SUMMARY Fieldwork: November December 2012 Publication: April 2013 This survey has been requested by the European Commission, Directorate-General
Flash Eurobarometer 470. Report. Work-life balance
 Work-life balance Survey requested by the European Commission, Directorate-General for Justice and Consumers and co-ordinated by the Directorate-General for Communication This document does not represent
COMMISSION STAFF WORKING DOCUMENT Accompanying the document
 EUROPEAN COMMISSION Brussels, 9.10.2017 SWD(2017) 330 final PART 13/13 COMMISSION STAFF WORKING DOCUMENT Accompanying the document REPORT FROM THE COMMISSION TO THE EUROPEAN PARLIAMENT, THE COUNCIL, THE
Active Ageing. Fieldwork: September November Publication: January 2012
 Special Eurobarometer 378 Active Ageing SUMMARY Special Eurobarometer 378 / Wave EB76.2 TNS opinion & social Fieldwork: September November 2011 Publication: January 2012 This survey has been requested
Two years to go to the 2014 European elections European Parliament Eurobarometer (EB/EP 77.4)
") Directorate-General for Communication PUBLIC OPINION MONITORING UNIT Brussels, 23 October 2012. Two years to go to the 2014 European elections European Parliament Eurobarometer (EB/EP 77.4) FOCUS ON THE
Directorate-General for Communication PUBLIC OPINION MONITORING UNIT Brussels, 23 October 2012. Two years to go to the 2014 European elections European Parliament Eurobarometer (EB/EP 77.4) FOCUS ON THE
For further information, please see online or contact
 For further information, please see http://ec.europa.eu/research/sme-techweb online or contact Lieve.VanWoensel@ec.europa.eu Seventh Progress Report on SMEs participation in the 7 th R&D Framework Programme
October 2010 Euro area unemployment rate at 10.1% EU27 at 9.6%
 STAT//180 30 November 20 October 20 Euro area unemployment rate at.1% EU27 at 9.6% The euro area 1 (EA16) seasonally-adjusted 2 unemployment rate 3 was.1% in October 20, compared with.0% in September 4.
Attitudes of Europeans Towards Tourism REPORT
 Flash Eurobarometer Attitudes of Europeans Towards Tourism REPORT Fieldwork: January 22 Publication: March 22 This survey has been requested by the Directorate-General Enterprise and co-ordinated by Directorate-
January 2010 Euro area unemployment rate at 9.9% EU27 at 9.5%
 STAT//29 1 March 20 January 20 Euro area unemployment rate at 9.9% EU27 at 9.5% The euro area 1 (EA16) seasonally-adjusted 2 unemployment rate 3 was 9.9% in January 20, the same as in December 2009 4.
Flash Eurobarometer 458. The euro area
 The euro area Survey requested by the European Commission, Directorate-General for Economic and Financial Affairs and co-ordinated by the Directorate-General for Communication This document does not represent
EUROPEAN COMMISSION EUROSTAT
 EUROPEAN COMMISSION EUROSTAT Directorate F: Social statistics Unit F-3: Labour market Doc.: Eurostat/F3/LAMAS/29/14 WORKING GROUP LABOUR MARKET STATISTICS Document for item 3.2.1 of the agenda LCS 2012
Overview of Eurofound surveys
 Overview of Eurofound surveys Dublin 21 st October 2010 Maija Lyly-Yrjänäinen Eurofound data European Working Conditions Survey 91, 95, 00, 05, 10 European Quality of Life Survey 03, 07, 09, 10 (EB), 11
Special Eurobarometer 459. Report. Climate change
 Climate change Survey requested by the European Commission, Directorate-General for Climate Action and co-ordinated by the Directorate- General for Communication This document does not represent the point
Flash Eurobarometer 458. Report. The euro area
 The euro area Survey requested by the European Commission, Directorate-General for Economic and Financial Affairs and co-ordinated by the Directorate-General for Communication This document does not represent
DATA SET ON INVESTMENT FUNDS (IVF) Naming Conventions
 Naming Conventions") DIRECTORATE GENERAL STATISTICS LAST UPDATE: 10 APRIL 2013 DIVISION MONETARY & FINANCIAL STATISTICS ECB-UNRESTRICTED DATA SET ON INVESTMENT FUNDS (IVF) Naming Conventions The series keys related to Investment
DIRECTORATE GENERAL STATISTICS LAST UPDATE: 10 APRIL 2013 DIVISION MONETARY & FINANCIAL STATISTICS ECB-UNRESTRICTED DATA SET ON INVESTMENT FUNDS (IVF) Naming Conventions The series keys related to Investment
Europeans attitudes towards the issue of sustainable consumption and production. Analytical report
 Flash Eurobarometer 256 The Gallup Organisation Analytical Report Flash EB N o 251 Public attitudes and perceptions in the euro area Flash Eurobarometer European Commission Europeans attitudes towards
PROGRESS TOWARDS THE LISBON OBJECTIVES 2010 IN EDUCATION AND TRAINING
 PROGRESS TOWARDS THE LISBON OBJECTIVES IN EDUCATION AND TRAINING In 7, reaching the benchmarks for continues to pose a serious challenge for education and training systems in Europe, except for the goal
Fieldwork February March 2008 Publication October 2008
 Special Eurobarometer 298 European Commission Consumer protection in the internal market Fieldwork February March 2008 Publication October 2008 Report Special Eurobarometer 298 / Wave 69.1 TNS Opinion
Europeans attitudes towards climate change. Report. Special Eurobarometer 300. Fieldwork March April 2008 Publication September 2008
 Special Eurobarometer 300 EUROPEAN PARLIAMENT European Commission Europeans attitudes towards climate change Fieldwork March April 2008 Publication September 2008 Report Special Eurobarometer 300 / Wave
Flash Eurobarometer N o 189a EU communication and the citizens. Analytical Report. Fieldwork: April 2008 Report: May 2008
 Gallup Flash Eurobarometer N o 189a EU communication and the citizens Flash Eurobarometer European Commission Expectations of European citizens regarding the social reality in 20 years time Analytical
NOTE ON EU27 CHILD POVERTY RATES
 NOTE ON EU7 CHILD POVERTY RATES Research note prepared for Child Poverty Action Group Authors: H. Xavier Jara and Chrysa Leventi Institute for Social and Economic Research (ISER) University of Essex The
E-Communications Household Survey. Summary
 Special Eurobarometer European Commission E-Communications Household Survey Fieldwork November - December 2006 Publication April 2007 Summary Special Eurobarometer 274 / Wave 66.3 TNS Opinion & Social
Taxation trends in the European Union EU27 tax ratio at 39.8% of GDP in 2007 Steady decline in top personal and corporate income tax rates since 2000
 DG TAXUD STAT/09/92 22 June 2009 Taxation trends in the European Union EU27 tax ratio at 39.8% of GDP in 2007 Steady decline in top personal and corporate income tax rates since 2000 The overall tax-to-gdp
May 2009 Euro area external trade surplus 1.9 bn euro 6.8 bn euro deficit for EU27
 STAT/09/106 17 July 2009 May 2009 Euro area external trade surplus 1.9 6.8 deficit for EU27 The first estimate for the euro area 1 (EA16) trade balance with the rest of the world in May 2009 gave a 1.9
PROGRESS TOWARDS THE LISBON OBJECTIVES 2010 IN EDUCATION AND TRAINING
 PROGRESS TOWARDS THE LISBON OBJECTIVES IN EDUCATION AND TRAINING In, reaching the benchmarks for continues to pose a serious challenge for education and training systems in Europe, except for the goal
EUROBAROMETER 71. Fieldwork: June - July 2009 Publication: January 2010
 EUROBAROMETER 66 Standard Eurobarometer Report European Commission EUROBAROMETER 71 Future of Europe Fieldwork: June - July 2009 Publication: January 2010 Standard Eurobarometer 71/ Spring 2009 - TNS Opinion
Eurofound in-house paper: Part-time work in Europe Companies and workers perspective
 Eurofound in-house paper: Part-time work in Europe Companies and workers perspective Presented by: Eszter Sandor Research Officer, Surveys and Trends 26/03/2010 1 Objectives Examine the patterns of part-time
August 2008 Euro area external trade deficit 9.3 bn euro 27.2 bn euro deficit for EU27
 STAT/08/143 17 October 2008 August 2008 Euro area external trade deficit 9.3 27.2 deficit for EU27 The first estimate for the euro area 1 (EA15) trade balance with the rest of the world in August 2008
The Eurostars Programme
 The Eurostars Programme The EU-EUREKA joint funding programme for R&D-performing SMEs What is EUREKA? > 2 > EUREKA is a public network supporting R&D-performing businesses > Established in 1985 by French
COMMISSION STAFF WORKING DOCUMENT Accompanying the document. Report form the Commission to the Council and the European Parliament
 EUROPEAN COMMISSION Brussels, 4.5.2018 SWD(2018) 246 final PART 5/9 COMMISSION STAFF WORKING DOCUMENT Accompanying the document Report form the Commission to the Council and the European Parliament on
Aggregation of periods for unemployment benefits. Report on U1 Portable Documents for mobile workers Reference year 2016
 Aggregation of periods for unemployment benefits Report on U1 Portable Documents for mobile workers Reference year 2016 Frederic De Wispelaere & Jozef Pacolet - HIVA KU Leuven June 2017 EUROPEAN COMMISSION
COMMISSION DECISION of 23 April 2012 on the second set of common safety targets as regards the rail system (notified under document C(2012) 2084)
 2084)") 27.4.2012 Official Journal of the European Union L 115/27 COMMISSION DECISION of 23 April 2012 on the second set of common safety targets as regards the rail system (notified under document C(2012) 2084)
27.4.2012 Official Journal of the European Union L 115/27 COMMISSION DECISION of 23 April 2012 on the second set of common safety targets as regards the rail system (notified under document C(2012) 2084)
January 2009 Euro area external trade deficit 10.5 bn euro 26.3 bn euro deficit for EU27
 STAT/09/40 23 March 2009 January 2009 Euro area external trade deficit 10.5 26.3 deficit for EU27 The first estimate for the euro area 1 (EA16) trade balance with the rest of the world in January 2009
Parlemeter - November 2012 European Parliament Eurobarometer (EB/EP 78.2)
") Directorate-General for Communication Public Opinion Monitoring Unit Parlemeter - November European Parliament Eurobarometer (EB/EP 78.2) ANALYTICAL SYNTHESIS Brussels, 14 February 2013. Coverage: Population:
Directorate-General for Communication Public Opinion Monitoring Unit Parlemeter - November European Parliament Eurobarometer (EB/EP 78.2) ANALYTICAL SYNTHESIS Brussels, 14 February 2013. Coverage: Population:
H Marie Skłodowska-Curie Actions (MSCA)
") H2020 Key facts and figures (2014-2020) Number of FI researchers funded by MSCA: EU budget awarded to FI organisations (EUR million): Number of FI organisations in MSCA: 155 47.93 89 In detail, the number
H2020 Key facts and figures (2014-2020) Number of FI researchers funded by MSCA: EU budget awarded to FI organisations (EUR million): Number of FI organisations in MSCA: 155 47.93 89 In detail, the number
Gender pension gap economic perspective
 Gender pension gap economic perspective Agnieszka Chłoń-Domińczak Institute of Statistics and Demography SGH Part of this research was supported by European Commission 7th Framework Programme project "Employment
H Marie Skłodowska-Curie Actions (MSCA)
") H2020 Key facts and figures (2014-2020) Number of IE researchers funded by MSCA: EU budget awarded to IE organisations (EUR million): Number of IE organisations in MSCA: 253 116,04 116 In detail, the number
H2020 Key facts and figures (2014-2020) Number of IE researchers funded by MSCA: EU budget awarded to IE organisations (EUR million): Number of IE organisations in MSCA: 253 116,04 116 In detail, the number
Growth, competitiveness and jobs: priorities for the European Semester 2013 Presentation of J.M. Barroso,
 Growth, competitiveness and jobs: priorities for the European Semester 213 Presentation of J.M. Barroso, President of the European Commission, to the European Council of 14-1 March 213 Economic recovery
H Marie Skłodowska-Curie Actions (MSCA)
") H2020 Key facts and figures (2014-2020) Number of BE researchers funded by MSCA: EU budget awarded to BE organisations (EUR million): Number of BE organisations in MSCA: 274 161,04 227 In detail, the number
H2020 Key facts and figures (2014-2020) Number of BE researchers funded by MSCA: EU budget awarded to BE organisations (EUR million): Number of BE organisations in MSCA: 274 161,04 227 In detail, the number
Social Protection and Social Inclusion in Europe Key facts and figures
 MEMO/08/625 Brussels, 16 October 2008 Social Protection and Social Inclusion in Europe Key facts and figures What is the report and what are the main highlights? The European Commission today published
H Marie Skłodowska-Curie Actions (MSCA)
") H2020 Key facts and figures (2014-2020) Number of NL researchers funded by MSCA: EU budget awarded to NL organisations (EUR million): Number of NL organisations in MSCA: 427 268.91 351 In detail, the number
H2020 Key facts and figures (2014-2020) Number of NL researchers funded by MSCA: EU budget awarded to NL organisations (EUR million): Number of NL organisations in MSCA: 427 268.91 351 In detail, the number
Fieldwork: November December 2007 Publication: March 2008
 Special Eurobarometer European Commission Attitudes of European citizens towards the environment Fieldwork: November December 2007 Publication: March 2008 Summary Special Eurobarometer 295/ Wave 68.2 TNS
Themes Income and wages in Europe Wages, productivity and the wage share Working poverty and minimum wage The gender pay gap
 5. W A G E D E V E L O P M E N T S At the ETUC Congress in Seville in 27, wage developments in Europe were among the most debated issues. One of the key problems highlighted in this respect was the need
H Marie Skłodowska-Curie Actions (MSCA)
") H2020 Key facts and figures (2014-2020) Number of FR researchers funded by MSCA: EU budget awarded to FR organisations (EUR million): Number of FR organisations in MSCA: 1 072 311.72 479 In detail, the
H2020 Key facts and figures (2014-2020) Number of FR researchers funded by MSCA: EU budget awarded to FR organisations (EUR million): Number of FR organisations in MSCA: 1 072 311.72 479 In detail, the
THE 2015 EU JUSTICE SCOREBOARD
 THE 215 EU JUSTICE SCOREBOARD Communication from the Commission to the European Parliament, the Council, the European Central Bank, the European Economic and Social Committee and the Committee of the Regions
SOLIDARITY THAT SPANS THE GLOBE: EUROPEANS AND DEVELOPMENT AID
 Special Eurobarometer 392 SOLIDARITY THAT SPANS THE GLOBE: EUROPEANS AND DEVELOPMENT AID REPORT Fieldwork: June 2012 Publication: October 2012 This survey has been requested by Directorate-General Development
H Marie Skłodowska-Curie Actions (MSCA)
") H2020 Key facts and figures (2014-2020) Number of PT researchers funded by MSCA: EU budget awarded to PT organisations (EUR million): Number of PT organisations in MSCA: 716 66,67 165 In detail, the number
H2020 Key facts and figures (2014-2020) Number of PT researchers funded by MSCA: EU budget awarded to PT organisations (EUR million): Number of PT organisations in MSCA: 716 66,67 165 In detail, the number
H Marie Skłodowska-Curie Actions (MSCA)
") H2020 Key facts and figures (2014-2020) Number of SE researchers funded by MSCA: EU budget awarded to SE organisations (EUR million): Number of SE organisations in MSCA: 138 114.71 150 In detail, the number
H2020 Key facts and figures (2014-2020) Number of SE researchers funded by MSCA: EU budget awarded to SE organisations (EUR million): Number of SE organisations in MSCA: 138 114.71 150 In detail, the number
LEADER implementation update Leader/CLLD subgroup meeting Brussels, 21 April 2015
 LEADER 2007-2013 implementation update Leader/CLLD subgroup meeting Brussels, 21 April 2015 #LeaderCLLD 2,416 2,416 8.9 Progress on LAG selection in the EU (2007-2013) 3 000 2 500 2 000 2 182 2 239 2 287
H Marie Skłodowska-Curie Actions (MSCA)
") H2020 Key facts and figures (2014-2020) Number of LV researchers funded by MSCA: EU budget awarded to LV organisations (EUR million): Number of LV organisations in MSCA: 35 3.91 11 In detail, the number
H2020 Key facts and figures (2014-2020) Number of LV researchers funded by MSCA: EU budget awarded to LV organisations (EUR million): Number of LV organisations in MSCA: 35 3.91 11 In detail, the number
FIRST REPORT COSTS AND PAST PERFORMANCE
 FIRST REPORT COSTS AND PAST PERFORMANCE DECEMBER 2018 https://eiopa.europa.eu/ PDF ISBN 978-92-9473-131-9 ISSN 2599-8862 doi: 10.2854/480813 EI-AM-18-001-EN-N EIOPA, 2018 Reproduction is authorised provided
Fiscal competitiveness issues in Romania
 Fiscal competitiveness issues in Romania Ionut Dumitru President of the Fiscal Council, Chief Economist Raiffeisen Bank* October 2014 World Bank Doing Business Report Ranking (out of 189 countries) Ease
Macroeconomic overview SEE and Macedonia
 Macroeconomic overview SEE and Macedonia Zoltan Arokszallasi Chief Analyst, Macro & FX/FI Research Erste Group Bank Erste Investors Breakfast, 29 September, Skopje 02. Oktober SEE shows mixed performance
Investment and Investment Finance. the EU and the Polish story. Debora Revoltella
 Investment and Investment Finance the EU and the Polish story Debora Revoltella Director - Economics Department EIB Warsaw 27 February 2017 Narodowy Bank Polski European Investment Bank Contents We look
H Marie Sklodowska-Curie Actions (MSCA)
") H2020 Key facts and figures (2014-2020) Number of FR researchers funded by MSCA: EU budget awarded to FR organisations (EUR million): Number of FR organisations in MSCA: 565 198.92 370 In detail, the number
H2020 Key facts and figures (2014-2020) Number of FR researchers funded by MSCA: EU budget awarded to FR organisations (EUR million): Number of FR organisations in MSCA: 565 198.92 370 In detail, the number
Traffic Safety Basic Facts Main Figures. Traffic Safety Basic Facts Traffic Safety. Motorways Basic Facts 2015.
 Traffic Safety Basic Facts 2013 - Main Figures Traffic Safety Basic Facts 2015 Traffic Safety Motorways Basic Facts 2015 Motorways General Almost 30.000 people were killed in road accidents on motorways
H Marie Skłodowska-Curie Actions (MSCA)
") H2020 Key facts and figures (2014-2020) Number of AT researchers funded by MSCA: EU budget awarded to AT organisations (EUR million): Number of AT organisations in MSCA: 215 78.57 140 In detail, the number
H2020 Key facts and figures (2014-2020) Number of AT researchers funded by MSCA: EU budget awarded to AT organisations (EUR million): Number of AT organisations in MSCA: 215 78.57 140 In detail, the number
Weighting issues in EU-LFS
 Weighting issues in EU-LFS Carlo Lucarelli, Frank Espelage, Eurostat LFS Workshop May 2018, Reykjavik carlo.lucarelli@ec.europa.eu, frank.espelage@ec.europa.eu 1 1. Introduction The current legislation
Investment in Ireland and the EU
 Investment in and the EU Debora Revoltella Director Economics Department Dublin April 10, 2017 20/04/2017 1 Real investment: IE v EU country groupings Real investment (2008 = 100) 180 160 140 120 100 80
December 2010 Euro area annual inflation up to 2.2% EU up to 2.6%
 STAT/11/9 14 January 2011 December 2010 Euro area annual inflation up to 2.2% EU up to 2.6% Euro area 1 annual inflation was 2.2% in December 2010 2, up from 1.9% in November. A year earlier the rate was
Fiscal sustainability challenges in Romania
 Preliminary Draft For discussion only Fiscal sustainability challenges in Romania Bucharest, May 10, 2011 Ionut Dumitru Anca Paliu Agenda 1. Main fiscal sustainability challenges 2. Tax collection issues
EBA REPORT ON HIGH EARNERS
 EBA REPORT ON HIGH EARNERS DATA AS OF END 2017 LONDON - 11/03/2019 1 Data on high earners List of figures 3 Executive summary 4 1. Data on high earners 6 1.1 Background 6 1.2 Data collected on high earners
Report on the distribution of direct payments to agricultural producers (financial year 2016)
") Report on the distribution of direct payments to agricultural producers (financial year 2016) Every year, the Commission publishes the distribution of direct payments to farmers by Member State. Figures
Report on the distribution of direct payments to agricultural producers (financial year 2016) Every year, the Commission publishes the distribution of direct payments to farmers by Member State. Figures
May 2009 Euro area annual inflation down to 0.0% EU down to 0.7%
 STAT/09/88 16 June 2009 May 2009 Euro area annual inflation down to 0.0% EU down to 0.7% Euro area 1 annual inflation was 0.0% in May 2009 2, down from 0.6% in April. A year earlier the rate was 3.7%.
State of play of CAP measure Setting up of Young Farmers in the European Union
 State of play of CAP measure Setting up of Young Farmers in the European Union Michael Gregory EN RD Contact Point Seminar CEJA 20 th September 2010 Measure 112 rationale: Measure 112 - Setting up of young
Fieldwork February March 2008 Publication June 2008
 Special Eurobarometer 297 European Commission Attitudes towards radioactive waste Fieldwork February March 2008 Publication June 2008 Report Special Eurobarometer 297 / Wave 69.1 TNS Opinion & Social This
Entrepreneurship in the EU and beyond. Analytical report
 Flash Eurobarometer The Gallup Organization Flash Eurobarometer European Commission Entrepreneurship in the EU and beyond A survey in the EU, EFTA countries, Croatia, Turkey, the US, Japan, South Korea
Guidelines compliance table
 Guidelines compliance table EBA/GL/2018/01 12 January 2018; Date of application 20 March 2018 Guidelines on uniform disclosures under Article 473a of Regulation (EU) No 575/2013 as regards the transitional
Securing sustainable and adequate social protection in the EU
 Securing sustainable and adequate social protection in the EU Session on Social Protection & Security IFA 12th Global Conference on Ageing 11 June 2014, HICC Hyderabad India Dr Lieve Fransen European Commission
H Marie Skłodowska-Curie Actions (MSCA)
") H2020 Key facts and figures (2014-2020) Number of PT researchers funded by MSCA: EU budget awarded to PT organisations (EUR million): Number of PT organisations in MSCA: 592 54.79 135 In detail, the number
H2020 Key facts and figures (2014-2020) Number of PT researchers funded by MSCA: EU budget awarded to PT organisations (EUR million): Number of PT organisations in MSCA: 592 54.79 135 In detail, the number
Investment in Germany and the EU
 Investment in Germany and the EU Pedro de Lima Head of the Economics Studies Division Economics Department Berlin 19/12/2016 11/01/2017 1 Slow recovery of investment, with strong heterogeneity Overall
Traffic Safety Basic Facts Main Figures. Traffic Safety Basic Facts Traffic Safety. Motorways Basic Facts 2017.
 Traffic Safety Basic Facts 2013 - Main Figures Traffic Safety Basic Facts 2015 Traffic Safety Motorways Basic Facts 2017 Motorways General More than 24.000 people were killed in road accidents on motorways
2 ENERGY EFFICIENCY 2030 targets: time for action
 ENERGY EFFICIENCY 2030 targets: time for action The Coalition for Energy Savings The Coalition for Energy Savings strives to make energy efficiency and savings the first consideration of energy policies
Employment and Social Policy
 Special Eurobarometer 377 European Commission Employment and Social Policy REPORT Special Eurobarometer 377 / Wave TNS opinion & social Fieldwork: September October 2011 Publication: December 2011 This
Investment in France and the EU
 Investment in and the EU Natacha Valla March 2017 22/02/2017 1 Change relative to 2008Q1 % of GDP Slow recovery of investment, and with strong heterogeneity Overall Europe s recovery in investment is slow,
Guidelines compliance table
 compliance table EBA/GL/2018/05 18 July 2018; Date of application 1 January 2019 on fraud reporting under the Payment Services Directive 2 (PSD2) The following competent authorities* or intend to with
Europeans knowledge of economic indicators
 Special Eurobarometer 323 European Commission Europeans knowledge of economic indicators Fieldwork: August - September 2009 Publication: January 2010 Special Eurobarometer 323 / Wave 72.1 TNS Opinion &
Traffic Safety Basic Facts Main Figures. Traffic Safety Basic Facts Traffic Safety. Motorways Basic Facts 2016.
 Traffic Safety Basic Facts 2013 - Main Figures Traffic Safety Basic Facts 2015 Traffic Safety Motorways Basic Facts 2016 Motorways General Almost 26.000 people were killed in road accidents on motorways
The EFTA Statistical Office: EEA - the figures and their use
 The EFTA Statistical Office: EEA - the figures and their use EEA Seminar Brussels, 13 September 2012 1 Statistics Comparable, impartial and reliable statistical data are a prerequisite for a democratic
Guidelines compliance table
 Guidelines compliance table EBA/GL/2017/01 Appendix 1 08 March 2017; Date of application 31 December 2017 (Updated: 14 November 2017) Guidelines on LCR disclosure to complement the disclosure of liquidity
H Marie Skłodowska-Curie Actions (MSCA)
") H2020 Key facts and figures (2014-2020) Number of LT researchers funded by MSCA: EU budget awarded to LT organisations (EUR million): Number of LT organisations in MSCA: 79 5.03 21 In detail, the number
H2020 Key facts and figures (2014-2020) Number of LT researchers funded by MSCA: EU budget awarded to LT organisations (EUR million): Number of LT organisations in MSCA: 79 5.03 21 In detail, the number
Harmonised Index of Consumer Prices (HICP) August 2015
 August 2015") Aug-14 Sep-14 Oct-14 Nov-14 Dec-14 Jan-15 Feb-15 Mar-15 Apr-15 May-15 Jun-15 MONTENEGRO STATISTICAL OFFICE R E L E A S E Broj: 201 Podgorica, 18 September 2015 When using the data please name the source
Aug-14 Sep-14 Oct-14 Nov-14 Dec-14 Jan-15 Feb-15 Mar-15 Apr-15 May-15 Jun-15 MONTENEGRO STATISTICAL OFFICE R E L E A S E Broj: 201 Podgorica, 18 September 2015 When using the data please name the source
New Europeans. Fieldwork : March 2010 April 2010 Publication: April 2011
 Special Eurobarometer European Commission New Europeans Report Fieldwork : March 2010 April 2010 Publication: April 2011 Special Eurobarometer 346 / Wave TNS Opinion & Social This survey was requested
European Employment and Social Policy
 Special Eurobarometer European Commission European Employment and Social Policy Report Fieldwork : May 2009 June 2009 Publication: September 2009 Special Eurobarometer 316 / Wave 71.2 TNS Opinion & Social
HOW RECESSION REFLECTS IN THE LABOUR MARKET INDICATORS
 REPUBLIC OF SLOVENIA HOW RECESSION REFLECTS IN THE LABOUR MARKET INDICATORS Matej Divjak, Irena Svetin, Darjan Petek, Miran Žavbi, Nuška Brnot ??? What is recession?? Why in Europe???? Why in Slovenia?
Social climate. Fieldwork May-June 2009 Publication January 2010
 Special Eurobarometer European Commission Social climate Full report Fieldwork May-June 2009 Publication January 2010 Special Eurobarometer 315 / Wave - European Opinion Research Group EEIG This survey
Library statistical spotlight
 /9/2 Library of the European Parliament 6 4 2 This document aims to provide a picture of the, in particular by looking at car production trends since 2, at the number of enterprises and the turnover they
Recommendations compliance table
 Recommendations compliance table EBA/REC/2017/03 20 December 2017; Date of application 1 July 2018 Recommendations on outsourcing to cloud service providers The following competent authorities* or intend
Country Health Profiles
 State of Health in the EU Country Health Profiles Brussels, November 2017 1 The Country Health Profiles 1. Highlights 2. Health status 3. Risk Factors 4. Health System (description) 5. Performance of Health
in focus Statistics Contents Labour Mar k et Lat est Tr ends 1st quar t er 2006 dat a Em ploym ent r at e in t he EU: t r end st ill up
 Labour Mar k et Lat est Tr ends 1st quar t er 2006 dat a Em ploym ent r at e in t he EU: t r end st ill up Statistics in focus This publication belongs to a quarterly series presenting the European Union
Fieldwork: October 2006 Report: December 2006
 Flash Eurobarometer European Commission Business attitudes towards cross-border sales and consumer protection Summary Fieldwork: October 2006 Report: December 2006 Flash Eurobarometer 186 The Gallup Organization