PUBLIC PERCEPTIONS OF VAT
|
|
|
- Sheila Houston
- 5 years ago
- Views:
Transcription


1 Special Eurobarometer 424 PUBLIC PERCEPTIONS OF VAT REPORT Fieldwork: October 2014 Publication: March 2015 This survey has been requested by the European Commission, Directorate-General for Taxations and Customs Union and co-ordinated by Directorate-General for Communication. This document does not represent the point of view of the European Commission. The interpretations and opinions contained in it are solely those of the authors. Special Eurobarometer 424 / Wave TNS Opinion & Social
2 Project title Linguistic Version Catalogue Number Special Eurobarometer 424 EN KP EN-N ISBN DOI / European Union, 2015
3 Special Eurobarometer 424 Public perceptions of VAT Conducted by TNS Opinion & Social at the request of the Directorate-General for Taxation and Customs Union (DG TAXUD) Survey co-ordinated by the Directorate-General for Communication (DG COMM Strategy, Corporate Communication Actions and Eurobarometer Unit)
4 TABLE OF CONTENTS INTRODUCTION... 2 EXECUTIVE SUMMARY The standard VAT rate Knowledge of the standard VAT rate Importance of VAT as a source of national revenue Perceptions of how the national standard VAT rate compares Reduced VAT rates Awareness of reduced rates Perceptions of the impact reduced VAT rates have on the national public budget Attitudes towards reduced VAT rates Cross border purchase behaviour Purchasing goods or services over the Internet Purchasing goods or services in other EU countries Cross-border purchase behaviour in the European Union Reasons for purchasing goods or services in other EU countries CONCLUSIONS ANNEXES Technical specifications Questionnaire Tables 1
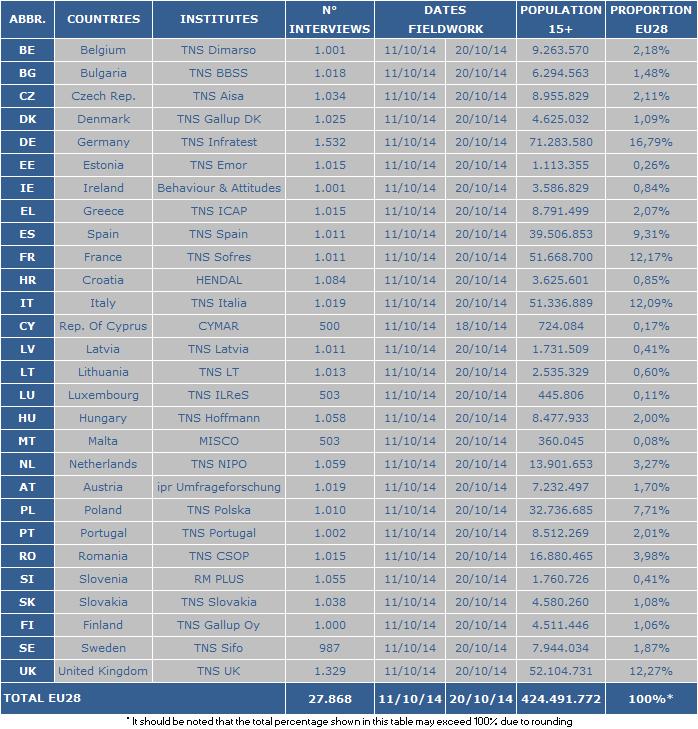
5 INTRODUCTION Value Added Tax (VAT) is an important revenue source for each of the EU28 Member States. VAT rates are set by individual Member States and there is a range of different levels, with the lowest standard VAT rate in Luxembourg (15%) and the highest in Hungary (27%), Denmark (25%), Croatia (25%) and Sweden (25%). In the majority of EU Member States (17) the standard rate of VAT ranges from 18% to 22%. In addition to the standard rate of VAT, each Member State also sets an alternative reduced rate for certain products and services. These reduced rates are different in each Member State, ranging from 5% to 18%. In a number of Member States, VAT is segmented further with super-reduced rates, a parking rate and VAT exemptions. In view of the wide range of different VAT rates set in each Member State, public knowledge and experience of VAT is likely to differ. This survey and its analysis have been commissioned to investigate the knowledge that Europeans have of VAT levels in their country, and to assess the importance citizens attach to VAT as a source of public revenue. It explores their awareness of reduced rates and perceptions of how these may impact the national public budget. It also looks at cross border purchasing behaviour within the EU, with respect to both goods and services bought over the Internet and those purchased while visiting other EU Member States. This survey was carried out by TNS Opinion & Social in the 28 Member States of the European Union between the 11 th and 20 th October Some 27,868 respondents from different social and demographic groups were interviewed face-to-face at home in their mother tongue on behalf of the Directorate-General for Taxation and Customs Union. The methodology used is that of Eurobarometer surveys as carried out by the Directorate- General for Communication ( Strategy, Corporate Communication Actions and Eurobarometer Unit) 1.. A technical note on the manner in which interviews were conducted by the Institutes within the TNS Opinion & Social network is appended to this report. Also included are the interview methods and confidence intervals The results tables are included in the annex. It should be noted that the total of the percentages in the tables of this report may exceed 100% when the respondent was able to give several answers to the question. 2
6 Note: In this report, countries are referred to by their official abbreviation. The abbreviations used in this report correspond to: ABBREVIATIONS BE Belgium LV Latvia BG Bulgaria LU Luxembourg CZ Czech Republic HU Hungary DK Denmark MT Malta DE Germany NL The Netherlands EE Estonia AT Austria EL Greece PL Poland ES Spain PT Portugal FR France RO Romania HR Croatia SI Slovenia IE Ireland SK Slovakia IT Italy FI Finland CY Republic of Cyprus*** SE Sweden LT Lithuania UK The United Kingdom EU28 EU15 NMS13 EURO AREA European Union 28 Member States BE, IT, FR, DE, LU, NL, DK, UK, IE, PT, ES, EL, AT, SE, FI* BG, CZ, EE, HR, CY, LT, LV, MT, HU, PL, RO, SI, SK** BE, FR, IT, LV, LU, DE, AT, ES, PT, IE, NL, FI, EL, EE, SI, CY, MT, SK * EU15 refers to the 15 countries forming the European Union before the enlargements of 2004, 2007 and 2013 ** The NMS13 are the 13 new Member States which joined the European Union during the 2004, 2007 and 2013 enlargements *** Cyprus as a whole is one of the 28 European Union Member States. However, the acquis communautaire has been suspended in the part of the country which is not controlled by the government of the Republic of Cyprus. For practical reasons, only the interviews carried out in the part of the country controlled by the government of the Republic of Cyprus are included in the CY category and in the EU28 average. * * * * * We wish to thank the people throughout Europe who have given their time to take part in this survey. Without their active participation, this study would not have been possible. 3
7 EXECUTIVE SUMMARY Nearly two-thirds (65%) of European citizens were able to correctly cite their national standard VAT rate, 21% gave a wrong answer and 14% did not know or refused to give an answer. With the exception of Finland (49%), the UK (47%), France (41%) and Ireland (31%), a majority of respondents in all Member States knew what their national standard VAT rate is. Over four-fifths (84%) of European citizens thought that VAT is either a very important or fairly important revenue source for public budgets in their country. More than seven in ten respondents (72%) in every Member State said that VAT is an important revenue source for their country. Once informed of the correct rate of VAT in their country, respondents were asked how they thought this compared with the standard rate in other Member States. Nearly half of respondents (48%) believed the VAT rate they pay is higher than in other Member States, 25% thought they pay about the same, and 10% thought it is lower. Around six in ten Europeans (61%) were aware that there are reduced VAT rates in their country for a number of goods and services, compared with 36% who were unaware. A majority of European citizens (56%) thought that the application of reduced VAT rates has a very important or fairly important impact on the public budget; by comparison 31% thought it is either not very important or not at all important. When provided with a series of four statements relating to reduced VAT rates, more than four out of ten respondents (43%) were in favour of abolishing reduced rates and replacing them by three different alternatives, while 39% of respondents were in favour of keeping the system of reduced rates unchanged. The most chosen alternative was lowering the standard VAT rate on all goods and services (24%), followed by a system where only the poorer households receive an annual fixed cash allowance (10%) and lastly a system where every household receives an annual fixed cash allowance (9%). Three in ten Europeans (30%) have purchased goods or services in another EU Member State in the last 12 months (either online or on a trip to another EU country); a similar figure of 29% was reported in a previous survey conducted in
8 Respondents who use the Internet were asked where they have bought their goods or services from: o o o More than half (56%) have made purchases from sellers based in their country (an increase of eight percentage points from 2012); Around a fifth or respondents (19%) have made purchases from sellers based in other EU countries (an increase of four percentage points from 2012); A tenth or respondents (10%) have made purchases from sellers based outside the EU (an increase of one percentage point from 2012). Around one-fifth (22%) of European citizens have purchased goods or services in another Member State during a business trip or holiday, or while on a trip primarily for this purpose (a decline of two percentage points since 2012). o o Just under a fifth of Europeans (19%) have made purchases in another EU country while on holiday or on a business trip (not including travel expenses) - the same result as at the time of the 2012 survey; A tenth or respondents (10%) have made a trip to another EU Member State in order to purchase goods or services (a decline of four percentage points since 2012). Finally, Europeans who have made a purchase in another EU country in the last 12 months were asked to select one or more reasons why they had done so. o o o A majority of respondents (57%) said that they have shopped in another EU country because the prices were lower; Three in ten respondents (30%) said that they have purchased goods or services from another Member State because the choice was bigger; Less than a fifth of respondents (18%) did so because the quality was better. 5
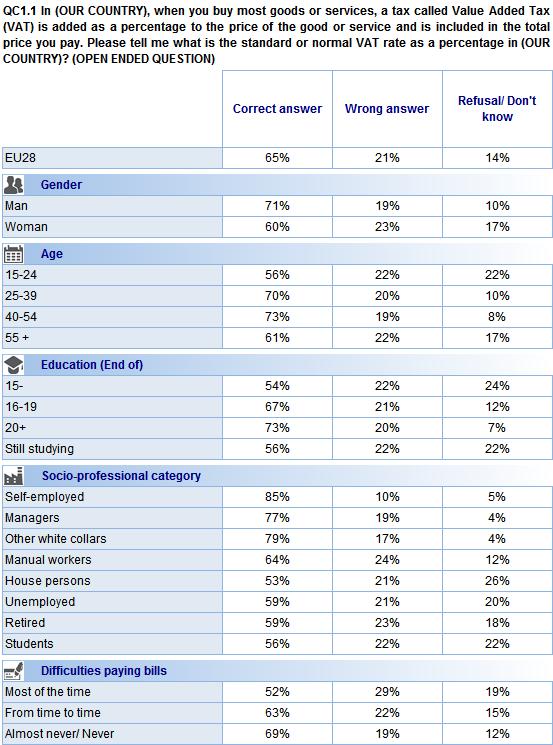
9 1. THE STANDARD VAT RATE This chapter discusses the state of public opinion regarding the standard VAT rate. In particular it details the knowledge Europeans have of their national VAT rate, how important they think VAT is as a source of national revenue and finally, how they think their national rate compares with that of other countries within the EU KNOWLEDGE OF THE STANDARD VAT RATE - Just under two thirds were able to correctly cite their national standard VAT rate - Respondents were asked to cite the standard or normal VAT rate in their country as a percentage 4. Across the EU, almost two-thirds (65%) of respondents were able to correctly cite their national standard VAT rate, while around a fifth (21%) gave the wrong answer. More than a tenth of respondents (14%) did not know or refused to give an answer. 4 QC1.1 In (OUR COUNTRY), when you buy most goods or services, a tax called Value Added Tax (VAT) is added as a percentage to the price of the good or service and is included in the total price you pay. Please tell me what is the standard or normal VAT rate as a percentage in (OUR COUNTRY)? 6
, Austria (88%), Croatia (87%) and Denmark (86%).")
 and Malta (23%). If only correc")
10 With the exception of Finland (49%), the UK (47%), France (41%) and Ireland (31%), a majority of respondents in all Member States were able to answer correctly. Member States where there were high levels of knowledge of the standard VAT rate included Germany (89%), Austria (88%), Croatia (87%) and Denmark (86%). It is worth noting that a fifth or more of respondents in eight Member States were unable to give an answer, with the highest levels of don t know responses recorded in Ireland (29%), the UK and Romania (both 24%) and Malta (23%). If only correct and wrong answers are considered (i.e. excluding don t know ), France (47%) and Ireland (44%) are the only two countries where a majority of respondents do not know the standard VAT rate in their country. The countries where the largest proportions of respondents gave correct answers are Bulgaria (94%), Germany (93%), Portugal (92%), Denmark (91%) and Austria (91%). 7
11 There are some differences in the knowledge of the correct standard VAT rate according to socio-demographic factors: Just over seven in ten men (71%) gave the correct answer compared to 60% of women; Respondents between the ages of (70%) and (73%) were significantly more likely to give the correct answer than those aged between years (56%) and over 55 (61%); Education has a significant impact. Respondents who left full-time education at the age of 20 or over (73%) were much more likely to give a correct answer than those who left school at the age of 15 or under (54%); In terms of occupation, more than three-quarters of the self-employed (85%), other white collars (79%) and managers (77%) gave the correct answer. Students (56%) and house persons (53%) were least likely to give the correct answer; Respondents who never or almost never have difficulties paying their bills (69%) were much more likely to cite the correct standard VAT rate than those who struggled most of the time (52%). 8
12 9
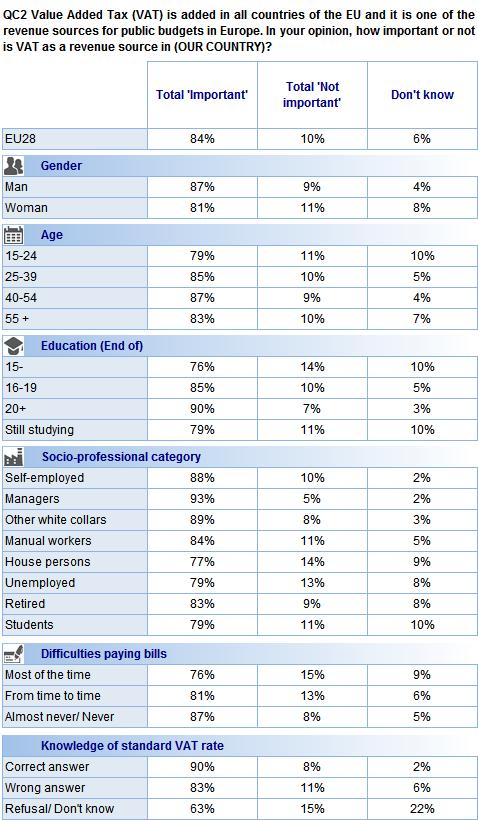
13 1.2. IMPORTANCE OF VAT AS A SOURCE OF NATIONAL REVENUE - More than eight in ten thought VAT is an important source of national revenue - It was explained to respondents that VAT is applied in all countries of the EU and that it is one of the revenue sources for public budgets in Europe. Respondents were then asked how important they think VAT is as a revenue source in their country 5. An overwhelming majority of respondents (84%) thought VAT is an important national revenue source with around one in four (42%) stating that VAT is very important and the same proportion stating that VAT is fairly important. A tenth of respondents (10%) thought VAT is not important while 6% did not know. 5 QC2. Value Added Tax (VAT) is added in all countries of the EU and it is one of the revenue sources for public budgets in Europe. In your opinion, how important or not is VAT as a revenue source in (OUR COUNTRY)? 10
, Finland (92%), Denmark (92%), the Netherlands (92%), Germany (91%) and Belgium (91%).")
14 More than seven in ten (72%) respondents in every Member State said that VAT is an important revenue source for their country. VAT was considered important as a national revenue source by more than nine in ten respondents in Sweden (95%), Finland (92%), Denmark (92%), the Netherlands (92%), Germany (91%) and Belgium (91%). Moreover, more than half the respondents in eight Member States thought that VAT is a very important source of national revenue, with particularly large proportions observed in Sweden (62%), Denmark (60%), and the Netherlands (59%). At the other end of the scale, respondents in Greece were the most likely to say that VAT is not an important national source of revenue (23%). Significant proportions of respondents also stated that VAT is not an important revenue source in Romania (18%), Italy (15%), Slovakia (13%) and Spain (12%). In Bulgaria (16%), Romania and Poland (both 10%), significant proportions of respondents were unable to give an answer. 11
15 According to the socio-demographic results, the respondents most likely to think that VAT was important as a national revenue source were: Men (87%) compared with 81% of women; Those aged (85%) and (87%) compared to those aged 55 and over (83%) who were slightly less likely to think VAT is an important national revenue source. Fewer than eight in ten respondents aged thought that it is important (79%); Respondents with more years of education. Nine in ten respondents who completed their full-time education at the age of 20 or over (90%) thought VAT is an important national revenue source compared to three-quarters of those who finished at the age of 15 or under (76%); Managers (93%), other white collar workers (89%) and the self-employed (88%) compared with all other socio-professional groups (ranging from 77% to 84%); Those who never or almost never struggle to pay their bills (87%) compared with respondents who have difficulties most of the time (76%); Respondents who were able to correctly cite the standard VAT rate in their country were also much more likely to say that VAT was an important source of national revenue (90% compared with 63% of those who gave a wrong answer). 12
16 13
17 1.3. PERCEPTIONS OF HOW THE NATIONAL STANDARD VAT RATE COMPARES - Almost half thought they pay a higher standard VAT rate compared to other EU countries - Respondents were informed of the correct standard VAT rate in their country and were then asked how they thought this compared with the standard rate in other Member States 6. Across the European Union, a relative majority of respondents (48%) believed their country s standard VAT rate is higher than in other Member States, while a quarter (25%) thought their rate is about the same and a tenth (10%) thought their rate is lower. Almost a fifth of respondents were unable to give an answer (17%). 6 QC3. In your opinion, is the standard VAT rate in (OUR COUNTRY) about the same, higher or lower than the standard VAT rate in the other EU Member States overall? 14
, Greece (77%), Croatia (74%) and Hungary (72%) thought that they pay higher rates of VAT than in other EU Member States.")
18 At the national level, the view that the standard VAT rate is higher in the respondent s country than in other EU Member States was the most widely held opinion in 22 Member States. High proportions of respondents in Denmark (88%), Greece (77%), Croatia (74%) and Hungary (72%) thought that they pay higher rates of VAT than in other EU Member States. It is worth mentioning that all of these countries do actually have comparatively high VAT rates (DK: 25%, EL: 23%, HR: 25%, HU: 27%) 7. In Germany (25%), Malta (20%) and Cyprus (18%), sizable proportions of the respondents thought that their standard VAT rate is lower than in other countries. Luxembourg stands out as almost nine in ten (88%) believed that their VAT rate is lower than in other countries. These four countries actually have the lowest VAT rates in the EU (DE: 19%, CY: 19%, MT: 18%, LU: 15%,). Respondents in Slovenia (42%) and Austria (40%) were particularly likely to think that their VAT rate is about the same. However, in Austria, an even larger proportion thought that their VAT rate is higher than in other countries (48%). Sizeable proportions of respondents were unable to give an answer in some Member States, such as Bulgaria (34%), Malta (32%), Estonia (29%), UK (25%) and Cyprus (24%)
 were slightly more likely than women (23%) to think that their national VAT rate is about the same as in other countries; In terms of age, over half of those aged 25-39 (52%) and 40-54")
19 When socio-economic factors are taken into consideration, we find only minor differences in opinion as to whether the standard rate of VAT is the same, higher or lower than in other Member States. Men (27%) were slightly more likely than women (23%) to think that their national VAT rate is about the same as in other countries; In terms of age, over half of those aged (52%) and (52%) believed that their standard VAT rate is higher than in other Member States; this figure is somewhat lower among people aged (45%) and 55+ (44%); Respondents who left full-time education at the age of 20 or over (52%) were much more likely to think that their standard VAT rate is higher than in other countries than those who left education at the age of 15 or under (43%). Those with lower levels of education were much more likely to spontaneously say that they did not know how their national VAT rate compares (27%); Respondents who have difficulties paying bills most of the time (57%) were the most likely to think that their country s standard VAT rate is higher than in other countries. Less than half of those who never or almost never struggle held the same opinion (46%). 16

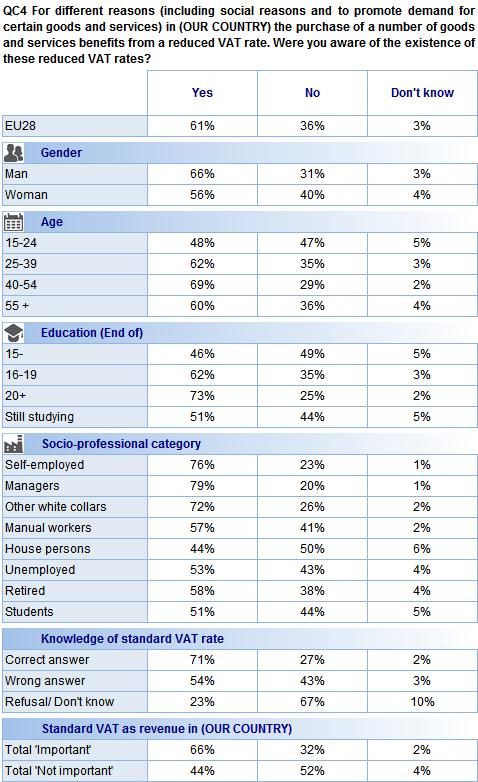
20 2. REDUCED VAT RATES 2.1. AWARENESS OF REDUCED RATES - More than six in ten were aware of the existence of reduced VAT rates - After briefly exploring respondents knowledge and perceptions of the standard VAT rate, the survey then turned to reduced VAT rates. The topic was introduced with a brief summary of the purpose of reduced VAT rates and respondents were then asked if they were aware of the existence of these reduced rates 8. Across the EU, more than six in ten respondents (61%) were aware of reduced VAT rates compared with just over a third who were not aware (36%). 8 QC4. For different reasons (including social reasons and to promote demand for certain goods and services) in (OUR COUNTRY) the purchase of a number of goods and services benefits from a reduced VAT rate. Were you aware of the existence of these reduced VAT rates? 17
. At the other end of the spectrum, more than two-thirds of respondents in Bulgaria said that they were not aware of these reduced rates (68%).")
21 At the national level, at least half of respondents in 22 Member States said that they were aware of reduced VAT rates, the highest levels being recorded in Sweden (85%), the Netherlands (84%) and Germany (78%). At the other end of the spectrum, more than two-thirds of respondents in Bulgaria said that they were not aware of these reduced rates (68%). More than half also said this in Denmark and Slovakia (both 53%). It is worth noting that in these three countries, reduced rates are not widely applied. 18
22 Socio-demographic analysis shows that the following groups were most likely to be aware of reduced VAT rates: Men (66%), compared with 56% of women; Those aged (69%), compared to less than half of respondents aged (48%) said that they were aware of reduced VAT rates; Respondents who left education at 20 or over (73%) compared to respondents who left education at the age of 15 or under (46%). Generally, the longer respondents stayed in education, the more likely they were to say that they were aware of reduced rates; Managers (79%), the self-employed (76%) and other white collar workers (72%), compared to a range of 44% to 58% across other socio-professional groups. Respondents who also correctly stated their country s standard VAT rate were much more likely to say that were aware of reduced VAT rates (71%) compared with 54% of those who gave a wrong answer. Those who thought that VAT is an important source of national revenue were also more likely to say they were aware of reduced VAT rates (66%) compared with 44% of those who thought it is not an important source. 19
23 20
24 2.2. PERCEPTIONS OF THE IMPACT REDUCED VAT RATES HAVE ON THE NATIONAL PUBLIC BUDGET - A majority thought that reduced VAT rates have an important impact on the public budget - Respondents were told that reduced VAT rates reduce the country s public budget, and they were then asked how important they thought the impact of this reduction was 9. At EU level, more than half of respondents (56%) thought that the impact of reduced VAT rates on the public budget is important, and of these 15% said it is very important. By comparison, around a third (31%) thought it is either not very important (26%) or not at all important (5%). Just over one in ten (13%) were unable to give an answer. 9 QC5. The application of reduced VAT rates leads to a reduction in the revenue collected for the public budget in (OUR COUNTRY). In your opinion, how important or not is the impact of reduced VAT rates on the public budget in (OUR COUNTRY)? 21
, Ireland (79%), Malta (77%) and Lithuania (74%).")
25 A majority of respondents in 21 Member States thought that reduced VAT rates have an important impact on the public budget in their country. The countries where respondents were most likely to think that the impact of reduced VAT rates on the public budget is important were Hungary (80%), Ireland (79%), Malta (77%) and Lithuania (74%). At the other end of the scale fewer than three in ten respondents (29%) in Estonia thought that the impact of reduced VAT rates on the public budget is important. Particularly low proportions of respondents who thought it is important were also found in Denmark and Sweden (both 43%) and Germany (39%). It is also worth noting that significant proportions of respondents in Greece (20%) and Cyprus (13%) thought that the impact of reduced VAT rates on the public budget is not at all important. 22

26 According to the socio-demographic analysis, those who spent a longer time in full-time education were more likely to think that the impact of reduced rates on the public budget is important (57%), compared with 53% of those who finished their education at the age of 15 or under. Cross-tabulation with other questions in the survey reveals that: Respondents who thought that VAT is an important source of national revenue were also particularly likely to think that reduced VAT rates have an important impact on the public budget (61%), compared with 37% of those who thought that VAT is not an important source of national revenue; Those who thought that their national VAT rate is the same (61%) or higher (60%) than in other EU countries were more likely to think that the impact of reduced rates on the public budget in their country is important (compared with 53% of those who thought that their national standard VAT rate is lower); Respondents who said they were aware of reduced VAT rates were more likely to say that these rates do not have an important impact on the public budget (35%, compared with 22% of those who were not aware). 23
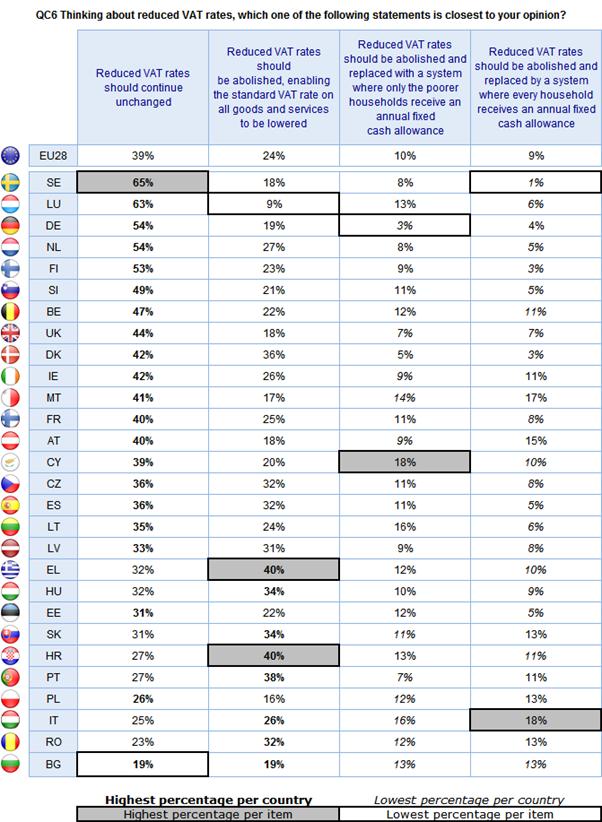
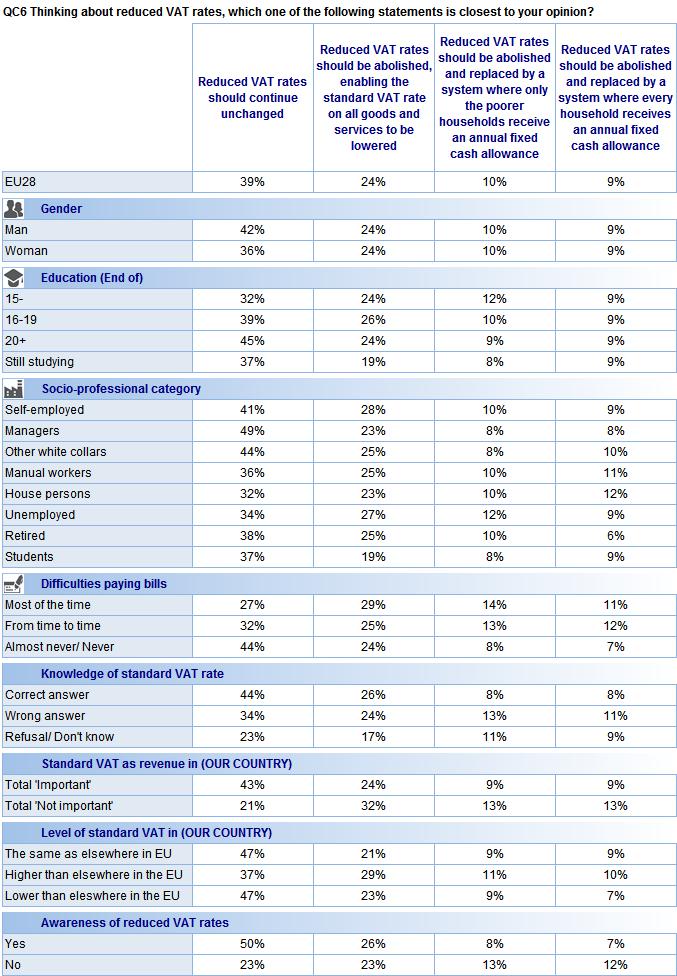
27 2.3. ATTITUDES TOWARDS REDUCED VAT RATES - More than a four out of ten Europeans were in favour of abolishing reduced rates and replacing them by different alternatives, while slightly less than four in ten thought that reduced VAT rates should continue unchanged - Respondents were provided with a series of four statements relating to reduced VAT rates and were then asked which statement was closest to their own opinion [1]. 43% of respondents were in favour of abolishing reduced rates and replacing them by different alternatives, while 39% of respondents were in favour of keeping the system of reduced rates unchanged. The most chosen alternative was lowering the standard VAT rate on all goods and services (24%), followed by a system where only the poorer households receive an annual fixed cash allowance (10%) and lastly a system where every household receives an annual fixed cash allowance (9%). Around one in five were unable to give an answer (18%). [1] QC6. Thinking about reduced VAT rates, which one of the following statements is closest to your opinion? Reduced VAT rates should continue unchanged; Reduced VAT rates should be abolished and replaced by a system where every household receives an annual fixed cash allowance; Reduced VAT rates should be abolished and replaced with a system where only the poorer households receive an annual fixed cash allowance; Reduced VAT rates should be abolished, enabling the standard VAT rate on all goods and services to be lowered; I don t know about/understand/take an interest in these matters (SPONTANEOUS); DK/NA (SPONTANEOUS) 24
28 At the national level, a majority of respondents in Sweden (65%), Luxembourg (63%), Germany (54%), Netherlands (54%) and Finland (53%) thought that reduced VAT rates should continue unchanged. This statement received least support in Italy (25%), Romania (23%) and Bulgaria (19%). The notion that reduced VAT rates should be abolished, enabling the standard VAT rate on all goods and services to be lowered received most support in Greece (40%) and Croatia (40%), while only 16% of respondents in Poland and less than a tenth (9%) Luxembourg held the same view. Less than a tenth of respondents in 10 Member States thought that reduced VAT rates should be abolished and replaced with a system where only the poorer households receive an annual fixed cash allowance. The largest proportions were found in Cyprus (18%), Italy and Lithuania (both 16%), while this statement received least support in Denmark (5%) and Germany (3%). Similarly, less than a fifth of respondents in all countries thought that reduced VAT rates should be abolished and replaced with a system where every household receives an annual fixed cash allowance, and in 15 countries, less than a tenth held this opinion. This statement received the most support in Italy (18%) and Malta (17%) while fewer than 5% of respondents in Germany (4%), Finland and Denmark (both 3%) and Sweden (1%) agreed. 25
29 26
30 A number of differences emerge at the socio-demographic level when each of the statements is analysed. The respondents who were most likely to agree that reduced VAT rates should continue unchanged were: Men (42%), compared with 36% of women; Those who left full-time education at the age of 20 or over (45%), compared with those who left at the age of 15 or under; Managers (49%), other white collar workers (44%) and the self-employed (41%) compared with a range of 32% to 38% across other occupation groups; Respondents who never or almost never have trouble paying their bills (44%), compared with over a quarter of those who have difficulties most of the time (27%); Those who were able to correctly cite their national standard VAT rate (44%), compared with 34% of those who gave an incorrect figure; Respondents who thought that the standard VAT rate is an important source of national revenue (43%) compared with 21% of those who did not; Those who said they were aware of reduced VAT rates (50%) compared with those who said they were not (23%). The respondents who were most likely to think that reduced VAT rates should be abolished, enabling the standard VAT rate on all goods and services to be lowered were: Respondents who struggle with their bills most of the time (29%), compared with those who never or almost never struggle (24%); Those who thought that the standard VAT rate is not an important source of revenue in their country (32%), compared with those who did (24%); Respondents who thought that their national standard VAT rate was higher than in other countries in the EU (29%). No differences emerge for the remaining statements. 27
31 28
32 3. CROSS BORDER PURCHASE BEHAVIOUR Purchasing goods or services over the Internet - The proportion of respondents who shopped online has increased since Respondents who use the Internet were asked if they had ordered any goods or services for private purposes over the Internet in the last year 10. More than half of the respondents who use the Internet (56%) had made purchases from sellers based in their country, an increase of eight percentage points since Just under a fifth (19%) had also made purchases in other EU countries, an increase of four percentage points since The proportion of respondents who had made purchases from sellers based outside the EU remains stable compared to 2012 (10%, +1 percentage point). More than a third of respondents who use the Internet (36%) had not made any online purchases in the last year, a decrease of seven percentage points since the survey conducted in 2012 (43%). Base: respondents who use the Internet (N=21,015) (*) The EU average in 2012 did not include Croatia and Denmark 10 QC7. In the last 12 months, have you bought or ordered any goods or services over the Internet for private purposes from any of the following? (MULTIPLE ANSWERS POSSIBLE)
33 At the national level, respondents with Internet access were most likely to have bought goods or services over the Internet in the Netherlands (84%), Denmark (82%), the UK (81%) and Sweden (80%). Since 2012, there have been increased use of the Internet for shopping online in all Member States, with the largest increases recorded in Hungary (46%, +18 pp), Romania (38%, +16 pp) and Ireland (69%, +15 pp). Respondents were most likely to have made Internet purchases from sellers in their own country in the Netherlands (82%), Sweden (78%), the UK (78%), Denmark (76%) and Germany (71%). Respondents in Portugal (15%), Malta (13%) and Cyprus (7%) were least likely to have done so. Since 2012 the proportions of respondents who have made purchases in their own country have increased by more than ten percentage points in Hungary (33%, +16 pp), the Netherlands (82%, +12 pp) and Romania (29%, +12 pp). The countries where respondents were most likely to have purchased from sellers based in other EU countries are Malta (61%), Luxembourg (59%) and Ireland (47%). They were least likely to have done so in Italy (10%), Romania (10%), Hungary (9%) and the Czech Republic (8%). Since the 2012 survey, purchasing from sellers based in other EU countries has risen most in Estonia (27%, +13 pp), Latvia (28%, +12pp) and Ireland (47%, +11 pp). Malta (34%), Ireland (22%) and Estonia (21%) are the countries where the largest proportions of respondents purchased goods or services from sellers based outside the EU. Conversely, less than five percent of respondents did so in Italy (4%), Poland (4%), Romania (4%) and Bulgaria (2%). Since the previous survey, purchasing from sellers based outside the EU has risen most in Estonia (21%, +12 pp), Ireland (22%, +7 pp) and Latvia (20%, +7 pp). 30

34 Base: respondents who use the Internet (N=21,015) (*) The EU average in 2012 did not include Croatia and Denmark 31

35 A socio-demographic analysis shows that the respondents most likely to shop online were: Those aged (68%) compared with those aged 55 and over (52%) who were the least likely to shop online; Respondents with more years of education. Just above seven in ten respondents (72%) who completed full-time education at the age of 20 or over have shopped online in the last year compared with four in ten (40%) of those who finished their education at the age of 15 or under (76%); Managers (82%) compared to other socio-professional categories (where online shopping ranged from 51% to 64%); Those who never or almost never struggle to pay their bills (68%) compared with respondents who have difficulties most of the time (48%). Base: respondents who use the Internet (N=21,015) 32
36 Purchasing goods or services in other EU countries - The majority of Europeans have not purchased goods or services on trips to other EU countries - Respondents were asked if they had purchased goods or services in other EU countries while on holiday or if they had made a trip to another EU country primarily to purchase goods and services in the last 12 months 12. Across the EU28, just under a fifth (19%) of respondents had purchased goods or services in another EU country while on holiday or on a business trip. The proportion of Europeans shopping while on these types of visits has remained stable since the previous survey conducted in Respondents were slightly less likely than in 2012 to have made trips primarily in order to purchase goods or services: in this survey 10% of respondents have done so (-4 pp). (*) The EU average of 2012 did not include Croatia and Denmark 12 QC8. In the last 12 months, have you? 1. Made a trip to another EU Member State primarily in order to purchase goods or services (trip made for this purpose, for purchasing clothes, electronics, etc.); 2. Purchased goods or services, while on holiday or on a business trip in another EU Member State (excluding expenditures linked to the trip such as travel, accommodation, leisure activities, meals). 33
, Hungary (10%), Spain (9%) and Greece (6%) were least likely to have done so.")
37 At a national level, respondents in Luxembourg (53%), Sweden (50%) and Denmark (49%) were most likely to have purchased goods or services during a holiday or a business trip in another EU Member State. Respondents in Bulgaria (10%), Hungary (10%), Spain (9%) and Greece (6%) were least likely to have done so. The highest increases were recorded in Slovenia (36%, +10 pp), Latvia (31%, +8 pp), Cyprus (32%, +7 pp) and Croatia (20%, +7 pp). Decreases were recorded in nine Member States, most markedly in Austria (30%, -15 pp), Belgium (26%, -6 pp) and the Netherlands (33%, - 4 pp). (*) The EU average of 2012 did not include Croatia and Denmark 34
, Spain (4%) and Hungary (3%) were least likely to have done this.")
38 Respondents in Luxembourg (42%), Slovenia (33%) and Slovakia (32%) were most likely to have made a trip to another EU Member State in the last 12 months primarily in order to make a purchase of goods or services. Respondents in Greece (4%), Spain (4%) and Hungary (3%) were least likely to have done this. The highest increases were recorded in Slovenia (33%, +5 pp), Luxembourg (42%, +4 pp) and Romania (14%, +3 pp). Decreases were recorded in 18 Member States, most markedly in Austria (22%, -22 pp), Belgium (16%, -11 pp) Germany (9%, -8 pp) and Italy (6%, -8 pp). (*) The EU average of 2012 did not include Croatia and Denmark 35

39 To summarise, the chart below shows the combined proportions of people who have made a trip to another EU Member State primarily in order to purchase goods or services and those who have purchased goods or services while on holiday or on a business trip in another EU Member State. The proportion of respondents who have purchased goods or services from another EU Member State remains stable since 2012: 22% of respondents shopped in another EU country in the current survey and 24% of respondents had done so in More than three-quarters (77%) said that they have not shopped in another EU country in the last 12 months, a slight increase since the 2012 survey when 75% had not done so. (*) The EU average of 2012 did not include Croatia and Denmark 36
, Spain (10%) and Greece (8%) were least likely to have shopped in another EU country.")
40 At a national level, respondents in Luxembourg (67%), Denmark (56%) and Sweden (53%) were most likely to have shopped in another EU country, either when making a trip expressly for this purpose or while on holiday or a business trip. Respondents in Hungary (11%), Spain (10%) and Greece (8%) were least likely to have shopped in another EU country. The highest increases were recorded in Latvia (34%, +7 pp), Slovenia (45%, +7 pp), Czech Republic (30%, +6 pp) and Luxembourg (67%, +6 pp). Decreases were recorded in nine Member States, most markedly in Austria (37%, -19 pp), Belgium (32%, -9 pp) and Germany (25%, -6 pp). (*) The EU average of 2012 did not include Croatia and Denmark 37
; Those who stayed in education the longest (31%) or are still studying (32%), compared with respondents who left education at the age of 15 or under (7%); Managers (39%), students")
41 A socio-demographic analysis shows that the respondents most likely to have made a purchase in another EU Member State were: Those aged and (both 29%), compared with respondents aged 55 and over (14%); Those who stayed in education the longest (31%) or are still studying (32%), compared with respondents who left education at the age of 15 or under (7%); Managers (39%), students (32%), the self-employed (29%) and other white collar workers (28%) compared with the other socio-professional categories (ranging from 13%-21%); Respondents who almost never or never have difficulties paying bills (26%) compared with those who have difficulties paying bills most of the time (13%). (*) The EU average of 2012 did not include Croatia and Denmark 38

42 Cross-border purchase behaviour in the European Union - Around a third have bought goods or services from other EU countries, a proportion that has remained stable since To conclude the section on cross-border purchase behaviour, the chart below shows all the respondents who have bought goods or services in another EU Member State in the last 12 months, whether this was over the Internet, during a trip made primarily in order to purchase goods or services or while on holiday or on a business trip 13. Across the EU28, 30% of respondents have bought goods or services in another EU Member State in the last 12 months, while 70% have not. Similar results were found in the 2012 survey, when 29% had done so, compared with 71% who had not. (*) The EU average of 2012 did not include Croatia and Denmark 13 QC7. In the last 12 months have you bought or ordered any goods or services over the Internet for private purposes from any of the following? QC8 In the last 12 months, have you? 1. Made a trip to another EU Member State primarily in order to purchase goods or services (trip made for this purpose, for purchasing clothes, electronics, etc.); 2. Purchased goods or services, while on holiday or on a business trip in another EU Member State (excluding expenditures linked to the trip such as travel, accommodation, leisure activities, meals). 39
43 3.2. REASONS FOR PURCHASING GOODS OR SERVICES IN OTHER EU COUNTRIES - The most likely reason for purchasing goods or services in another EU Member State is the price - This last section looks at the reasons respondents gave for purchasing goods or services from another Member State in the last 12 months 14. A majority of respondents said that they had shopped in another EU country because the prices were lower than in their country (57%). Three in ten respondents (30%) said that they had purchased goods or services from another Member State because the choice was bigger (30%), whilst less than a fifth of respondents did so because the quality was better (18%). A significant proportion of respondents (17%) spontaneously said that they had shopped abroad for other reasons while less than a tenth were unable to give an answer (8%). Base: respondents who bought goods or services from another EU Member State in the last 12 months (N=8,242) 14 Q9. In the last 12 months, have you bought at least one good or service from another EU country for any of the following reasons? The prices were lower than in (OUR COUNTRY); The quality was better than in (OUR COUNTRY); The choice was bigger than in (OUR COUNTRY); Other reasons (SPONTANEOUS); DK/NA (SPONTANEOUS) 40
44 At the national level, price was the most important factor for respondents in 24 Member States. Respondents in Denmark (74%), Greece (71%) and Croatia (70%) were the most likely to say that they had shopped in another Member State because the prices were lower. However, only around four in ten respondents in Portugal (43%), Spain (42%) and Hungary (40%) gave this reason, as did a third of respondents in Bulgaria (32%). The only country where respondents were more likely to say that they had shopped in another EU country because the choice was better as opposed to any other reason was Luxembourg (60%). However, a majority also held this view in Estonia (61%), Malta (58%), Latvia (52%) and Slovenia (51%). At the other end of the scale, around a fifth of respondents in Portugal (22%), France (21%) and the UK (17%) said the same. Respondents in Romania (73%), Bulgaria (58%) and Hungary (48%) were more likely to say that they had shopped in another EU country because the quality was better as opposed to the other reasons. However, this was the minority opinion in 23 of the remaining Member States, most notably in Luxembourg (9%), Denmark (8%), Finland and Sweden (both 7%). It is worth mentioning that at least a fifth of respondents spontaneously said that they had bought goods or services in another Member State for other reasons in Spain (28%), the Netherlands (24%), Germany and Luxembourg (both 20%). 41

45 Base: respondents who bought goods or services from another EU Member State in the last 12 months (N=8,242) 42
 of those aged 15-24 do so, compared with just over half of respondents aged 55 or older (52%); The")
46 The largest differences across the socio-demographic groups are seen for those who said that they had purchased goods or services in another Member States because the prices were lower. Younger respondents in particular were more likely to cite this reason: more than six in ten (61%) of those aged do so, compared with just over half of respondents aged 55 or older (52%); The age at which respondents left full-time education was also salient. Generally the longer respondents had stayed in education, the less likely they were to say that they had shopped in another Member State because the prices were lower (61% of those who left school at the age of 15 or under compared with 55% of those who studied until the age of 20 or over); Difficulties with paying bills was weakly related, and those who struggle most of the time were more likely to say that they had shopped in another Member State because the prices were lower (66%). Base: respondents who bought goods or services from another EU Member State in the last 12 months (N=8,242) 43
47 CONCLUSIONS One of the main objectives of this research was to establish how much European citizens know about Value Added Tax (VAT), understand the importance they attach to VAT as a source of national revenue and gauge their perceptions of their own national VAT rate as compared with other EU countries. Two-thirds (65%) of European citizens were able to correctly cite their national standard VAT rate, while 35% either gave a wrong answer or were unable to answer. With the exception of Finland (49%), the UK (47%), France (41%) and Ireland (31%), a majority of respondents in all Member States were able to correctly state the standard VAT rate in their country. More than eight in ten (84%) European citizens thought that VAT is an important revenue source in their country. This opinion was shared by at least 72% of respondents in every Member State. While the majority thought VAT is an important revenue source, nearly half of respondents (48%) also believed that they pay a higher rate than in other Member States, while 25% thought it is about the same and just 10% thought it is lower. Another key element of this survey was to measure the awareness of reduced rates and perceptions of how these may impact the national public budget. Once again, a majority of European citizens (61%) were aware that reduced rates of VAT are applied in all Member States including in their country to a number of goods and services, while just over a third (36%) were unaware of these different VAT rates. When asked about the impact of reduced VAT rates on the national public budget, a majority of EU citizens (56%) thought that the application of reduced VAT rates leads to a very important or fairly important reduction in revenue. After being provided with a series of four statements relating to reduced VAT rates, this survey found that more than four in ten Europeans (43%) were in favour of abolishing reduced rates and replacing them with different alternatives, while slightly less than four in ten (39%) thought that reduced VAT rates should continue unchanged. The most chosen alternative was lowering the standard VAT rate on all good and services (24%), which was followed by a system where only the poorer households receive an annual fixed cash allowance (10%) and finally a system where every household receives an annual fixed cash allowance (9%). It is worth noting that just under a fifth of respondents (18%) did not know or understand enough to give their opinion about these alternatives to reduced VAT rates. The survey asked respondents about their cross border purchase behaviour for private purposes, both via the Internet (online shopping) and on trips to other Member States. Three in ten of respondents (30%) had purchased goods or services in another EU Member State in the last 12 months, close to the 29% who had done so in the previous survey conducted in
48 Over half of European citizens (56%) who use the Internet had made online purchases of goods and services from sellers based in their own country in the last 12 months, an increase of eight percentage points since Under a fifth or respondents (19%) had made purchases from sellers based in another EU country (+4 pp from 2012). Around a fifth of European citizens (22%, -2 pp since 2012) had made purchases of goods and services for private purposes when visiting other countries, either during a business trip or holiday or when making a trip primarily to purchase goods or services. The reasons why European citizens had chosen to purchase goods or services from another country were also explored. The most frequently mentioned reason was the lower price (57%), followed by greater choice (30%) and better quality (18%). 45
49 ANNEXES
50 TECHNICAL SPECIFICATIONS
51 SPECIAL EUROBAROMETER 424 Public perceptions of VAT TECHNICAL SPECIFICATIONS Between the 11 th and the 20 th of October 2014, TNS opinion & social, a consortium created between TNS political & social, TNS UK and TNS opinion, carried out the wave of the EUROBAROMETER survey, on request of the EUROPEAN COMMISSION, Directorate-General for Communication, Strategy, Corporate Communication Actions and Eurobarometer unit. The Special Eurobarometer 424 is part of the wave and covers the population of the respective nationalities of the European Union Member States, resident in each of the Member States and aged 15 years and over. The basic sample design applied in all states is a multi-stage, random (probability) one. In each country, a number of sampling points was drawn with probability proportional to population size (for a total coverage of the country) and to population density. In order to do so, the sampling points were drawn systematically from each of the "administrative regional units", after stratification by individual unit and type of area. They thus represent the whole territory of the countries surveyed according to the EUROSTAT NUTS II (or equivalent) and according to the distribution of the resident population of the respective nationalities in terms of metropolitan, urban and rural areas. In each of the selected sampling points, a starting address was drawn, at random. Further addresses (every Nth address) were selected by standard "random route" procedures, from the initial address. In each household, the respondent was drawn, at random (following the "closest birthday rule"). All interviews were conducted face-to-face in people's homes and in the appropriate national language. As far as the data capture is concerned, CAPI (Computer Assisted Personal Interview) was used in those countries where this technique was available. For each country a comparison between the sample and the universe was carried out. The Universe description was derived from Eurostat population data or from national statistics offices. For all countries surveyed, a national weighting procedure, using marginal and intercellular weighting, was carried out based on this Universe description. In all countries, gender, age, region and size of locality were introduced in the iteration procedure. For international weighting (i.e. EU averages), TNS Opinion & Social applies the official population figures as provided by EUROSTAT or national statistic offices. The total population figures for input in this post-weighting procedure are listed below. TS1
52 Readers are reminded that survey results are estimations, the accuracy of which, everything being equal, rests upon the sample size and upon the observed percentage. With samples of about 1,000 interviews, the real percentages vary within the following confidence limits: Statistical Margins due to the sampling process (at the 95% level of confidence) various sample sizes are in rows various observed results are in columns 5% 10% 15% 20% 25% 30% 35% 40% 45% 50% 95% 90% 85% 80% 75% 70% 65% 60% 55% 50% N=50 6,0 8,3 9,9 11,1 12,0 12,7 13,2 13,6 13,8 13,9 N=50 N=500 1,9 2,6 3,1 3,5 3,8 4,0 4,2 4,3 4,4 4,4 N=500 N=1000 1,4 1,9 2,2 2,5 2,7 2,8 3,0 3,0 3,1 3,1 N=1000 N=1500 1,1 1,5 1,8 2,0 2,2 2,3 2,4 2,5 2,5 2,5 N=1500 N=2000 1,0 1,3 1,6 1,8 1,9 2,0 2,1 2,1 2,2 2,2 N=2000 N=3000 0,8 1,1 1,3 1,4 1,5 1,6 1,7 1,8 1,8 1,8 N=3000 N=4000 0,7 0,9 1,1 1,2 1,3 1,4 1,5 1,5 1,5 1,5 N=4000 N=5000 0,6 0,8 1,0 1,1 1,2 1,3 1,3 1,4 1,4 1,4 N=5000 N=6000 0,6 0,8 0,9 1,0 1,1 1,2 1,2 1,2 1,3 1,3 N=6000 N=7000 0,5 0,7 0,8 0,9 1,0 1,1 1,1 1,1 1,2 1,2 N=7000 N=7500 0,5 0,7 0,8 0,9 1,0 1,0 1,1 1,1 1,1 1,1 N=7500 N=8000 0,5 0,7 0,8 0,9 0,9 1,0 1,0 1,1 1,1 1,1 N=8000 N=9000 0,5 0,6 0,7 0,8 0,9 0,9 1,0 1,0 1,0 1,0 N=9000 N= ,4 0,6 0,7 0,8 0,8 0,9 0,9 1,0 1,0 1,0 N=10000 N= ,4 0,6 0,7 0,7 0,8 0,9 0,9 0,9 0,9 0,9 N=11000 N= ,4 0,5 0,6 0,7 0,8 0,8 0,9 0,9 0,9 0,9 N=12000 N= ,4 0,5 0,6 0,7 0,7 0,8 0,8 0,8 0,9 0,9 N=13000 N= ,4 0,5 0,6 0,7 0,7 0,8 0,8 0,8 0,8 0,8 N=14000 N= ,3 0,5 0,6 0,6 0,7 0,7 0,8 0,8 0,8 0,8 N= % 10% 15% 20% 25% 30% 35% 40% 45% 50% 95% 90% 85% 80% 75% 70% 65% 60% 55% 50% TS2
53 TS3
Standard Eurobarometer
 Standard Eurobarometer 67 / Spring 2007 Standard Eurobarometer European Commission SPECIAL EUROBAROMETER EUROPEANS KNOWELEDGE ON ECONOMICAL INDICATORS 1 1 This preliminary analysis is done by Antonis PAPACOSTAS
Flash Eurobarometer 398 WORKING CONDITIONS REPORT
 Flash Eurobarometer WORKING CONDITIONS REPORT Fieldwork: April 2014 Publication: April 2014 This survey has been requested by the European Commission, Directorate-General for Employment, Social Affairs
Special Eurobarometer 418 SOCIAL CLIMATE REPORT
 Special Eurobarometer 418 SOCIAL CLIMATE REPORT Fieldwork: June 2014 Publication: November 2014 This survey has been requested by the European Commission, Directorate-General for Employment, Social Affairs
Standard Eurobarometer 83 Spring 2015 THE EU BUDGET REPORT
 Standard Eurobarometer 83 Spring 2015 THE EU BUDGET REPORT Fieldwork: May 2015 This survey has been requested and co-ordinated by the European Commission, Directorate-General for Communication. http://ec.europa.eu/public_opinion/index_en.htm
Flash Eurobarometer 408 EUROPEAN YOUTH REPORT
 Flash Eurobarometer EUROPEAN YOUTH REPORT Fieldwork: December 2014 Publication: April 2015 This survey has been requested by the European Commission, Directorate-General for Education and Culture and co-ordinated
Eco-label Flower week 2006
 Special Eurobarometer European Commission Eco-label Flower week 2006 Fieldwork: November-December 2006 Publication: January 2007 Special Eurobarometer 275 / Wave 66.3 TNS Opinion & Social This survey was
Flash Eurobarometer 470. Report. Work-life balance
 Work-life balance Survey requested by the European Commission, Directorate-General for Justice and Consumers and co-ordinated by the Directorate-General for Communication This document does not represent
Flash Eurobarometer 458. Report. The euro area
 The euro area Survey requested by the European Commission, Directorate-General for Economic and Financial Affairs and co-ordinated by the Directorate-General for Communication This document does not represent
Flash Eurobarometer 458. The euro area
 The euro area Survey requested by the European Commission, Directorate-General for Economic and Financial Affairs and co-ordinated by the Directorate-General for Communication This document does not represent
Fieldwork February March 2008 Publication October 2008
 Special Eurobarometer 298 European Commission Consumer protection in the internal market Fieldwork February March 2008 Publication October 2008 Report Special Eurobarometer 298 / Wave 69.1 TNS Opinion
Flash Eurobarometer 441. Report. European SMEs and the Circular Economy
 European SMEs and the Circular Economy Survey requested by the European Commission, Directorate-General Environment and co-ordinated by the Directorate-General for Communication This document does not
Special Eurobarometer 459. Report. Climate change
 Climate change Survey requested by the European Commission, Directorate-General for Climate Action and co-ordinated by the Directorate- General for Communication This document does not represent the point
Europeans attitudes towards the issue of sustainable consumption and production. Analytical report
 Flash Eurobarometer 256 The Gallup Organisation Analytical Report Flash EB N o 251 Public attitudes and perceptions in the euro area Flash Eurobarometer European Commission Europeans attitudes towards
of the European Commission. Communication. This document of the authors. Standard Eurobarometer 75 / Spring 2011 TNS opinion & social
 Standard Eurobarometer European Commission EUROBAROMETER 75 SPRING 2011 Europeans and the European Union budget REPORT Standard Eurobarometer 75 / Spring 2011 TNS opinion & social Fieldwork: May 2011 Publication:
Flash Eurobarometer 386 THE EURO AREA REPORT
 Eurobarometer THE EURO AREA REPORT Fieldwork: October 2013 Publication: November 2013 This survey has been requested by the European Commission, Directorate-General for Economic and Financial Affairs and
ENTREPRENEURSHIP IN THE EU AND BEYOND
 Flash Eurobarometer 354 ENTREPRENEURSHIP IN THE EU AND BEYOND COUNTRY REPORT SPAIN Fieldwork: June 2012 This survey has been requested by the European Commission, Directorate-General Enterprise and Industry
SOLIDARITY THAT SPANS THE GLOBE: EUROPEANS AND DEVELOPMENT AID
 Special Eurobarometer 392 SOLIDARITY THAT SPANS THE GLOBE: EUROPEANS AND DEVELOPMENT AID REPORT Fieldwork: June 2012 Publication: October 2012 This survey has been requested by Directorate-General Development
Attitudes of Europeans Towards Tourism REPORT
 Flash Eurobarometer Attitudes of Europeans Towards Tourism REPORT Fieldwork: January 22 Publication: March 22 This survey has been requested by the Directorate-General Enterprise and co-ordinated by Directorate-
Employment and Social Policy
 Special Eurobarometer 377 European Commission Employment and Social Policy REPORT Special Eurobarometer 377 / Wave TNS opinion & social Fieldwork: September October 2011 Publication: December 2011 This
EUROPEAN SMALL CLAIMS PROCEDURE
 Special Eurobarometer 395 EUROPEAN SMALL CLAIMS PROCEDURE SUMMARY Fieldwork: November December 2012 Publication: April 2013 This survey has been requested by the European Commission, Directorate-General
October 2010 Euro area unemployment rate at 10.1% EU27 at 9.6%
 STAT//180 30 November 20 October 20 Euro area unemployment rate at.1% EU27 at 9.6% The euro area 1 (EA16) seasonally-adjusted 2 unemployment rate 3 was.1% in October 20, compared with.0% in September 4.
Active Ageing. Fieldwork: September November Publication: January 2012
 Special Eurobarometer 378 Active Ageing SUMMARY Special Eurobarometer 378 / Wave EB76.2 TNS opinion & social Fieldwork: September November 2011 Publication: January 2012 This survey has been requested
Europeans knowledge of economic indicators
 Special Eurobarometer 323 European Commission Europeans knowledge of economic indicators Fieldwork: August - September 2009 Publication: January 2010 Special Eurobarometer 323 / Wave 72.1 TNS Opinion &
January 2010 Euro area unemployment rate at 9.9% EU27 at 9.5%
 STAT//29 1 March 20 January 20 Euro area unemployment rate at 9.9% EU27 at 9.5% The euro area 1 (EA16) seasonally-adjusted 2 unemployment rate 3 was 9.9% in January 20, the same as in December 2009 4.
Flash Eurobarometer N o 189a EU communication and the citizens. Analytical Report. Fieldwork: April 2008 Report: May 2008
 Gallup Flash Eurobarometer N o 189a EU communication and the citizens Flash Eurobarometer European Commission Expectations of European citizens regarding the social reality in 20 years time Analytical
Taxation trends in the European Union EU27 tax ratio at 39.8% of GDP in 2007 Steady decline in top personal and corporate income tax rates since 2000
 DG TAXUD STAT/09/92 22 June 2009 Taxation trends in the European Union EU27 tax ratio at 39.8% of GDP in 2007 Steady decline in top personal and corporate income tax rates since 2000 The overall tax-to-gdp
New Europeans. Fieldwork : March 2010 April 2010 Publication: April 2011
 Special Eurobarometer European Commission New Europeans Report Fieldwork : March 2010 April 2010 Publication: April 2011 Special Eurobarometer 346 / Wave TNS Opinion & Social This survey was requested
Fieldwork February March 2008 Publication June 2008
 Special Eurobarometer 297 European Commission Attitudes towards radioactive waste Fieldwork February March 2008 Publication June 2008 Report Special Eurobarometer 297 / Wave 69.1 TNS Opinion & Social This
PROGRESS TOWARDS THE LISBON OBJECTIVES 2010 IN EDUCATION AND TRAINING
 PROGRESS TOWARDS THE LISBON OBJECTIVES IN EDUCATION AND TRAINING In 7, reaching the benchmarks for continues to pose a serious challenge for education and training systems in Europe, except for the goal
0pinions on organised, cross-border crime and corruption
 Special Eurobarometer European Commission 0pinions on organised, cross-border crime and corruption Fieldwork: November - December 2005 Publication: March 2006 Special Eurobarometer 245 / Wave 64.3 TNS
Parlemeter - November 2012 European Parliament Eurobarometer (EB/EP 78.2)
") Directorate-General for Communication Public Opinion Monitoring Unit Parlemeter - November European Parliament Eurobarometer (EB/EP 78.2) ANALYTICAL SYNTHESIS Brussels, 14 February 2013. Coverage: Population:
Directorate-General for Communication Public Opinion Monitoring Unit Parlemeter - November European Parliament Eurobarometer (EB/EP 78.2) ANALYTICAL SYNTHESIS Brussels, 14 February 2013. Coverage: Population:
Two years to go to the 2014 European elections European Parliament Eurobarometer (EB/EP 77.4)
") Directorate-General for Communication PUBLIC OPINION MONITORING UNIT Brussels, 23 October 2012. Two years to go to the 2014 European elections European Parliament Eurobarometer (EB/EP 77.4) FOCUS ON THE
Directorate-General for Communication PUBLIC OPINION MONITORING UNIT Brussels, 23 October 2012. Two years to go to the 2014 European elections European Parliament Eurobarometer (EB/EP 77.4) FOCUS ON THE
PROGRESS TOWARDS THE LISBON OBJECTIVES 2010 IN EDUCATION AND TRAINING
 PROGRESS TOWARDS THE LISBON OBJECTIVES IN EDUCATION AND TRAINING In, reaching the benchmarks for continues to pose a serious challenge for education and training systems in Europe, except for the goal
Fieldwork November - December 2009 Publication June 2010
 Special Eurobarometer 337 European Commission Geographical and labour market mobility Report Fieldwork November - December 2009 Publication June 2010 Special Eurobarometer 337 / Wave TNS Opinion & Social
DATA SET ON INVESTMENT FUNDS (IVF) Naming Conventions
 Naming Conventions") DIRECTORATE GENERAL STATISTICS LAST UPDATE: 10 APRIL 2013 DIVISION MONETARY & FINANCIAL STATISTICS ECB-UNRESTRICTED DATA SET ON INVESTMENT FUNDS (IVF) Naming Conventions The series keys related to Investment
DIRECTORATE GENERAL STATISTICS LAST UPDATE: 10 APRIL 2013 DIVISION MONETARY & FINANCIAL STATISTICS ECB-UNRESTRICTED DATA SET ON INVESTMENT FUNDS (IVF) Naming Conventions The series keys related to Investment
Social Protection and Social Inclusion in Europe Key facts and figures
 MEMO/08/625 Brussels, 16 October 2008 Social Protection and Social Inclusion in Europe Key facts and figures What is the report and what are the main highlights? The European Commission today published
COMMISSION STAFF WORKING DOCUMENT Accompanying the document
 EUROPEAN COMMISSION Brussels, 9.10.2017 SWD(2017) 330 final PART 13/13 COMMISSION STAFF WORKING DOCUMENT Accompanying the document REPORT FROM THE COMMISSION TO THE EUROPEAN PARLIAMENT, THE COUNCIL, THE
Fieldwork: October 2006 Report: December 2006
 Flash Eurobarometer European Commission Business attitudes towards cross-border sales and consumer protection Summary Fieldwork: October 2006 Report: December 2006 Flash Eurobarometer 186 The Gallup Organization
August 2008 Euro area external trade deficit 9.3 bn euro 27.2 bn euro deficit for EU27
 STAT/08/143 17 October 2008 August 2008 Euro area external trade deficit 9.3 27.2 deficit for EU27 The first estimate for the euro area 1 (EA15) trade balance with the rest of the world in August 2008
May 2009 Euro area external trade surplus 1.9 bn euro 6.8 bn euro deficit for EU27
 STAT/09/106 17 July 2009 May 2009 Euro area external trade surplus 1.9 6.8 deficit for EU27 The first estimate for the euro area 1 (EA16) trade balance with the rest of the world in May 2009 gave a 1.9
Europeans attitudes towards climate change. Report. Special Eurobarometer 300. Fieldwork March April 2008 Publication September 2008
 Special Eurobarometer 300 EUROPEAN PARLIAMENT European Commission Europeans attitudes towards climate change Fieldwork March April 2008 Publication September 2008 Report Special Eurobarometer 300 / Wave
Themes Income and wages in Europe Wages, productivity and the wage share Working poverty and minimum wage The gender pay gap
 5. W A G E D E V E L O P M E N T S At the ETUC Congress in Seville in 27, wage developments in Europe were among the most debated issues. One of the key problems highlighted in this respect was the need
Flash Eurobarometer N o 189a EU communication and the citizens. Analytical report. Fieldwork: February 2008 Publication: July 2008
 Gallup Flash Eurobarometer N o 189a EU communication and the citizens Flash Eurobarometer European Commission Business attitudes towards cross-border and consumer protection Analytical report Fieldwork:
January 2009 Euro area external trade deficit 10.5 bn euro 26.3 bn euro deficit for EU27
 STAT/09/40 23 March 2009 January 2009 Euro area external trade deficit 10.5 26.3 deficit for EU27 The first estimate for the euro area 1 (EA16) trade balance with the rest of the world in January 2009
NOTE ON EU27 CHILD POVERTY RATES
 NOTE ON EU7 CHILD POVERTY RATES Research note prepared for Child Poverty Action Group Authors: H. Xavier Jara and Chrysa Leventi Institute for Social and Economic Research (ISER) University of Essex The
FIRST REPORT COSTS AND PAST PERFORMANCE
 FIRST REPORT COSTS AND PAST PERFORMANCE DECEMBER 2018 https://eiopa.europa.eu/ PDF ISBN 978-92-9473-131-9 ISSN 2599-8862 doi: 10.2854/480813 EI-AM-18-001-EN-N EIOPA, 2018 Reproduction is authorised provided
European Employment and Social Policy
 Special Eurobarometer European Commission European Employment and Social Policy Report Fieldwork : May 2009 June 2009 Publication: September 2009 Special Eurobarometer 316 / Wave 71.2 TNS Opinion & Social
Taylor & Francis Open Access Survey Open Access Mandates
 Taylor & Francis Open Access Survey Open Access Mandates Annex C European Union November 2014 November 2014 0 The results presented in this report are based on research carried out on behalf of Taylor
Growth, competitiveness and jobs: priorities for the European Semester 2013 Presentation of J.M. Barroso,
 Growth, competitiveness and jobs: priorities for the European Semester 213 Presentation of J.M. Barroso, President of the European Commission, to the European Council of 14-1 March 213 Economic recovery
Gender pension gap economic perspective
 Gender pension gap economic perspective Agnieszka Chłoń-Domińczak Institute of Statistics and Demography SGH Part of this research was supported by European Commission 7th Framework Programme project "Employment
Safer Internet. Fieldwork Dec Jan 2006 Publication May 2006
 Special Eurobarometer European Commission Safer Internet Fieldwork Dec 2005 - Jan 2006 Publication May 2006 Special Eurobarometer 250 / Wave 64.4 TNS Opinion & Social This survey was requested by Directorate
Overview of Eurofound surveys
 Overview of Eurofound surveys Dublin 21 st October 2010 Maija Lyly-Yrjänäinen Eurofound data European Working Conditions Survey 91, 95, 00, 05, 10 European Quality of Life Survey 03, 07, 09, 10 (EB), 11
Country Health Profiles
 State of Health in the EU Country Health Profiles Brussels, November 2017 1 The Country Health Profiles 1. Highlights 2. Health status 3. Risk Factors 4. Health System (description) 5. Performance of Health
Fiscal sustainability challenges in Romania
 Preliminary Draft For discussion only Fiscal sustainability challenges in Romania Bucharest, May 10, 2011 Ionut Dumitru Anca Paliu Agenda 1. Main fiscal sustainability challenges 2. Tax collection issues
Library statistical spotlight
 /9/2 Library of the European Parliament 6 4 2 This document aims to provide a picture of the, in particular by looking at car production trends since 2, at the number of enterprises and the turnover they
Special Eurobarometer 465. Gender Equality 2017
 Summary Gender Equality 01 Gender Pay Gap Survey requested by the European Commission, Directorate-General for Justice and Consumers and co-ordinated by the Directorate-General for Communication This document
Eurofound in-house paper: Part-time work in Europe Companies and workers perspective
 Eurofound in-house paper: Part-time work in Europe Companies and workers perspective Presented by: Eszter Sandor Research Officer, Surveys and Trends 26/03/2010 1 Objectives Examine the patterns of part-time
Vocational Training. Fieldwork October-November 2004 Publication August 2005
 Special Eurobarometer European Commission Vocational Training Fieldwork October-November 2004 Publication August 2005 Special Eurobarometer 216 / Wave 62..1 TNS Opinion & Social This survey was requested
EUROBAROMETER 71. Fieldwork: June - July 2009 Publication: January 2010
 EUROBAROMETER 66 Standard Eurobarometer Report European Commission EUROBAROMETER 71 Future of Europe Fieldwork: June - July 2009 Publication: January 2010 Standard Eurobarometer 71/ Spring 2009 - TNS Opinion
Securing sustainable and adequate social protection in the EU
 Securing sustainable and adequate social protection in the EU Session on Social Protection & Security IFA 12th Global Conference on Ageing 11 June 2014, HICC Hyderabad India Dr Lieve Fransen European Commission
COMMISSION STAFF WORKING DOCUMENT Accompanying the document. Report form the Commission to the Council and the European Parliament
 EUROPEAN COMMISSION Brussels, 4.5.2018 SWD(2018) 246 final PART 5/9 COMMISSION STAFF WORKING DOCUMENT Accompanying the document Report form the Commission to the Council and the European Parliament on
Traffic Safety Basic Facts Main Figures. Traffic Safety Basic Facts Traffic Safety. Motorways Basic Facts 2015.
 Traffic Safety Basic Facts 2013 - Main Figures Traffic Safety Basic Facts 2015 Traffic Safety Motorways Basic Facts 2015 Motorways General Almost 30.000 people were killed in road accidents on motorways
Fiscal competitiveness issues in Romania
 Fiscal competitiveness issues in Romania Ionut Dumitru President of the Fiscal Council, Chief Economist Raiffeisen Bank* October 2014 World Bank Doing Business Report Ranking (out of 189 countries) Ease
LEADER implementation update Leader/CLLD subgroup meeting Brussels, 21 April 2015
 LEADER 2007-2013 implementation update Leader/CLLD subgroup meeting Brussels, 21 April 2015 #LeaderCLLD 2,416 2,416 8.9 Progress on LAG selection in the EU (2007-2013) 3 000 2 500 2 000 2 182 2 239 2 287
COMMISSION DECISION of 23 April 2012 on the second set of common safety targets as regards the rail system (notified under document C(2012) 2084)
 2084)") 27.4.2012 Official Journal of the European Union L 115/27 COMMISSION DECISION of 23 April 2012 on the second set of common safety targets as regards the rail system (notified under document C(2012) 2084)
27.4.2012 Official Journal of the European Union L 115/27 COMMISSION DECISION of 23 April 2012 on the second set of common safety targets as regards the rail system (notified under document C(2012) 2084)
Aggregation of periods for unemployment benefits. Report on U1 Portable Documents for mobile workers Reference year 2016
 Aggregation of periods for unemployment benefits Report on U1 Portable Documents for mobile workers Reference year 2016 Frederic De Wispelaere & Jozef Pacolet - HIVA KU Leuven June 2017 EUROPEAN COMMISSION
December 2010 Euro area annual inflation up to 2.2% EU up to 2.6%
 STAT/11/9 14 January 2011 December 2010 Euro area annual inflation up to 2.2% EU up to 2.6% Euro area 1 annual inflation was 2.2% in December 2010 2, up from 1.9% in November. A year earlier the rate was
November 5, Very preliminary work in progress
 November 5, 2007 Very preliminary work in progress The forecasting horizon of inflationary expectations and perceptions in the EU Is it really 2 months? Lars Jonung and Staffan Lindén, DG ECFIN, Brussels.
STAT/14/ October 2014
 STAT/14/158-21 October 2014 Provision of deficit and debt data for 2013 - second notification Euro area and EU28 government deficit at 2.9% and 3.2% of GDP respectively Government debt at 90.9% and 85.4%
Traffic Safety Basic Facts Main Figures. Traffic Safety Basic Facts Traffic Safety. Motorways Basic Facts 2017.
 Traffic Safety Basic Facts 2013 - Main Figures Traffic Safety Basic Facts 2015 Traffic Safety Motorways Basic Facts 2017 Motorways General More than 24.000 people were killed in road accidents on motorways
Social climate. Fieldwork May-June 2009 Publication January 2010
 Special Eurobarometer European Commission Social climate Full report Fieldwork May-June 2009 Publication January 2010 Special Eurobarometer 315 / Wave - European Opinion Research Group EEIG This survey
Investment in France and the EU
 Investment in and the EU Natacha Valla March 2017 22/02/2017 1 Change relative to 2008Q1 % of GDP Slow recovery of investment, and with strong heterogeneity Overall Europe s recovery in investment is slow,
May 2009 Euro area annual inflation down to 0.0% EU down to 0.7%
 STAT/09/88 16 June 2009 May 2009 Euro area annual inflation down to 0.0% EU down to 0.7% Euro area 1 annual inflation was 0.0% in May 2009 2, down from 0.6% in April. A year earlier the rate was 3.7%.
H Marie Skłodowska-Curie Actions (MSCA)
") H2020 Key facts and figures (2014-2020) Number of IE researchers funded by MSCA: EU budget awarded to IE organisations (EUR million): Number of IE organisations in MSCA: 253 116,04 116 In detail, the number
H2020 Key facts and figures (2014-2020) Number of IE researchers funded by MSCA: EU budget awarded to IE organisations (EUR million): Number of IE organisations in MSCA: 253 116,04 116 In detail, the number
Traffic Safety Basic Facts Main Figures. Traffic Safety Basic Facts Traffic Safety. Motorways Basic Facts 2016.
 Traffic Safety Basic Facts 2013 - Main Figures Traffic Safety Basic Facts 2015 Traffic Safety Motorways Basic Facts 2016 Motorways General Almost 26.000 people were killed in road accidents on motorways
H Marie Skłodowska-Curie Actions (MSCA)
") H2020 Key facts and figures (2014-2020) Number of BE researchers funded by MSCA: EU budget awarded to BE organisations (EUR million): Number of BE organisations in MSCA: 274 161,04 227 In detail, the number
H2020 Key facts and figures (2014-2020) Number of BE researchers funded by MSCA: EU budget awarded to BE organisations (EUR million): Number of BE organisations in MSCA: 274 161,04 227 In detail, the number
Report on the distribution of direct payments to agricultural producers (financial year 2016)
") Report on the distribution of direct payments to agricultural producers (financial year 2016) Every year, the Commission publishes the distribution of direct payments to farmers by Member State. Figures
Report on the distribution of direct payments to agricultural producers (financial year 2016) Every year, the Commission publishes the distribution of direct payments to farmers by Member State. Figures
Harmonised Index of Consumer Prices (HICP) August 2015
 August 2015") Aug-14 Sep-14 Oct-14 Nov-14 Dec-14 Jan-15 Feb-15 Mar-15 Apr-15 May-15 Jun-15 MONTENEGRO STATISTICAL OFFICE R E L E A S E Broj: 201 Podgorica, 18 September 2015 When using the data please name the source
Aug-14 Sep-14 Oct-14 Nov-14 Dec-14 Jan-15 Feb-15 Mar-15 Apr-15 May-15 Jun-15 MONTENEGRO STATISTICAL OFFICE R E L E A S E Broj: 201 Podgorica, 18 September 2015 When using the data please name the source
Investment in Ireland and the EU
 Investment in and the EU Debora Revoltella Director Economics Department Dublin April 10, 2017 20/04/2017 1 Real investment: IE v EU country groupings Real investment (2008 = 100) 180 160 140 120 100 80
H Marie Skłodowska-Curie Actions (MSCA)
") H2020 Key facts and figures (2014-2020) Number of NL researchers funded by MSCA: EU budget awarded to NL organisations (EUR million): Number of NL organisations in MSCA: 427 268.91 351 In detail, the number
H2020 Key facts and figures (2014-2020) Number of NL researchers funded by MSCA: EU budget awarded to NL organisations (EUR million): Number of NL organisations in MSCA: 427 268.91 351 In detail, the number
Transition from Work to Retirement in EU25
 EUROPEAN CENTRE EUROPÄISCHES ZENTRUM CENTRE EUROPÉEN 1 Asghar Zaidi is Director Research at the European Centre for Social Welfare Policy and Research, Vienna; Michael Fuchs is Researcher at the European
Entrepreneurship in the EU and beyond. Analytical report
 Flash Eurobarometer The Gallup Organization Flash Eurobarometer European Commission Entrepreneurship in the EU and beyond A survey in the EU, EFTA countries, Croatia, Turkey, the US, Japan, South Korea
H Marie Skłodowska-Curie Actions (MSCA)
") H2020 Key facts and figures (2014-2020) Number of FR researchers funded by MSCA: EU budget awarded to FR organisations (EUR million): Number of FR organisations in MSCA: 1 072 311.72 479 In detail, the
H2020 Key facts and figures (2014-2020) Number of FR researchers funded by MSCA: EU budget awarded to FR organisations (EUR million): Number of FR organisations in MSCA: 1 072 311.72 479 In detail, the
HOW RECESSION REFLECTS IN THE LABOUR MARKET INDICATORS
 REPUBLIC OF SLOVENIA HOW RECESSION REFLECTS IN THE LABOUR MARKET INDICATORS Matej Divjak, Irena Svetin, Darjan Petek, Miran Žavbi, Nuška Brnot ??? What is recession?? Why in Europe???? Why in Slovenia?
EUROSTAT SUPPLEMENTARY TABLE FOR REPORTING GOVERNMENT INTERVENTIONS TO SUPPORT FINANCIAL INSTITUTIONS
 EUROPEAN COMMISSION EUROSTAT Directorate D: Government Finance Statistics (GFS) and Quality Unit D1: Excessive deficit procedure and methodology Unit D2: Excessive deficit procedure (EDP) 1 Unit D3: Excessive
H Marie Skłodowska-Curie Actions (MSCA)
") H2020 Key facts and figures (2014-2020) Number of FI researchers funded by MSCA: EU budget awarded to FI organisations (EUR million): Number of FI organisations in MSCA: 155 47.93 89 In detail, the number
H2020 Key facts and figures (2014-2020) Number of FI researchers funded by MSCA: EU budget awarded to FI organisations (EUR million): Number of FI organisations in MSCA: 155 47.93 89 In detail, the number
H Marie Skłodowska-Curie Actions (MSCA)
") H2020 Key facts and figures (2014-2020) Number of PT researchers funded by MSCA: EU budget awarded to PT organisations (EUR million): Number of PT organisations in MSCA: 716 66,67 165 In detail, the number
H2020 Key facts and figures (2014-2020) Number of PT researchers funded by MSCA: EU budget awarded to PT organisations (EUR million): Number of PT organisations in MSCA: 716 66,67 165 In detail, the number
Europeans and the Common Agricultural Policy
 Special Eurobarometer European Commission Europeans and the Common Agricultural Policy Fieldwork October - November 2005 Publication January 2006 Special Eurobarometer 242 / Wave 64.2 - TNS Opinion & Social
EUROSTAT SUPPLEMENTARY TABLE FOR REPORTING GOVERNMENT INTERVENTIONS TO SUPPORT FINANCIAL INSTITUTIONS
 EUROPEAN COMMISSION EUROSTAT Directorate D: Government Finance Statistics (GFS) and Quality Unit D1: Excessive deficit procedure and methodology Unit D2: Excessive deficit procedure (EDP) 1 Unit D3: Excessive
State of play of CAP measure Setting up of Young Farmers in the European Union
 State of play of CAP measure Setting up of Young Farmers in the European Union Michael Gregory EN RD Contact Point Seminar CEJA 20 th September 2010 Measure 112 rationale: Measure 112 - Setting up of young
H Marie Skłodowska-Curie Actions (MSCA)
") H2020 Key facts and figures (2014-2020) Number of SE researchers funded by MSCA: EU budget awarded to SE organisations (EUR million): Number of SE organisations in MSCA: 138 114.71 150 In detail, the number
H2020 Key facts and figures (2014-2020) Number of SE researchers funded by MSCA: EU budget awarded to SE organisations (EUR million): Number of SE organisations in MSCA: 138 114.71 150 In detail, the number
EBA REPORT ON HIGH EARNERS
 EBA REPORT ON HIGH EARNERS DATA AS OF END 2017 LONDON - 11/03/2019 1 Data on high earners List of figures 3 Executive summary 4 1. Data on high earners 6 1.1 Background 6 1.2 Data collected on high earners
H Marie Skłodowska-Curie Actions (MSCA)
") H2020 Key facts and figures (2014-2020) Number of LV researchers funded by MSCA: EU budget awarded to LV organisations (EUR million): Number of LV organisations in MSCA: 35 3.91 11 In detail, the number
H2020 Key facts and figures (2014-2020) Number of LV researchers funded by MSCA: EU budget awarded to LV organisations (EUR million): Number of LV organisations in MSCA: 35 3.91 11 In detail, the number
Employment of older workers Research Note no. 5/2015
 Research Note no. 5/2015 E. Őzdemir, T. Ward M. Fuchs, S. Ilinca, O. Lelkes, R. Rodrigues, E. Zolyomi February - 2016 EUROPEAN COMMISSION Directorate-General for Employment, Social Affairs and Inclusion
Development Aid in times of economic turmoil
 Special Eurobarometer European Commission Development Aid in times of economic turmoil Fieldwork: May 2009 June 2009 Publication: October 2009 Special Eurobarometer 318 / Wave 71.2 TNS Opinion & Social
Guidelines compliance table
 Guidelines compliance table EBA/GL/2018/01 12 January 2018; Date of application 20 March 2018 Guidelines on uniform disclosures under Article 473a of Regulation (EU) No 575/2013 as regards the transitional
in focus Statistics Contents Labour Mar k et Lat est Tr ends 1st quar t er 2006 dat a Em ploym ent r at e in t he EU: t r end st ill up
 Labour Mar k et Lat est Tr ends 1st quar t er 2006 dat a Em ploym ent r at e in t he EU: t r end st ill up Statistics in focus This publication belongs to a quarterly series presenting the European Union
THE 2015 EU JUSTICE SCOREBOARD
 THE 215 EU JUSTICE SCOREBOARD Communication from the Commission to the European Parliament, the Council, the European Central Bank, the European Economic and Social Committee and the Committee of the Regions
The EFTA Statistical Office: EEA - the figures and their use
 The EFTA Statistical Office: EEA - the figures and their use EEA Seminar Brussels, 13 September 2012 1 Statistics Comparable, impartial and reliable statistical data are a prerequisite for a democratic
EUROPEAN COMMISSION EUROSTAT
 EUROPEAN COMMISSION EUROSTAT Directorate F: Social statistics Unit F-3: Labour market Doc.: Eurostat/F3/LAMAS/29/14 WORKING GROUP LABOUR MARKET STATISTICS Document for item 3.2.1 of the agenda LCS 2012