GENERAL FUND REVENUES AND EXPENDITURES FY Through June % of Budget Year
|
|
|
- Charlotte Byrd
- 6 years ago
- Views:
Transcription


1
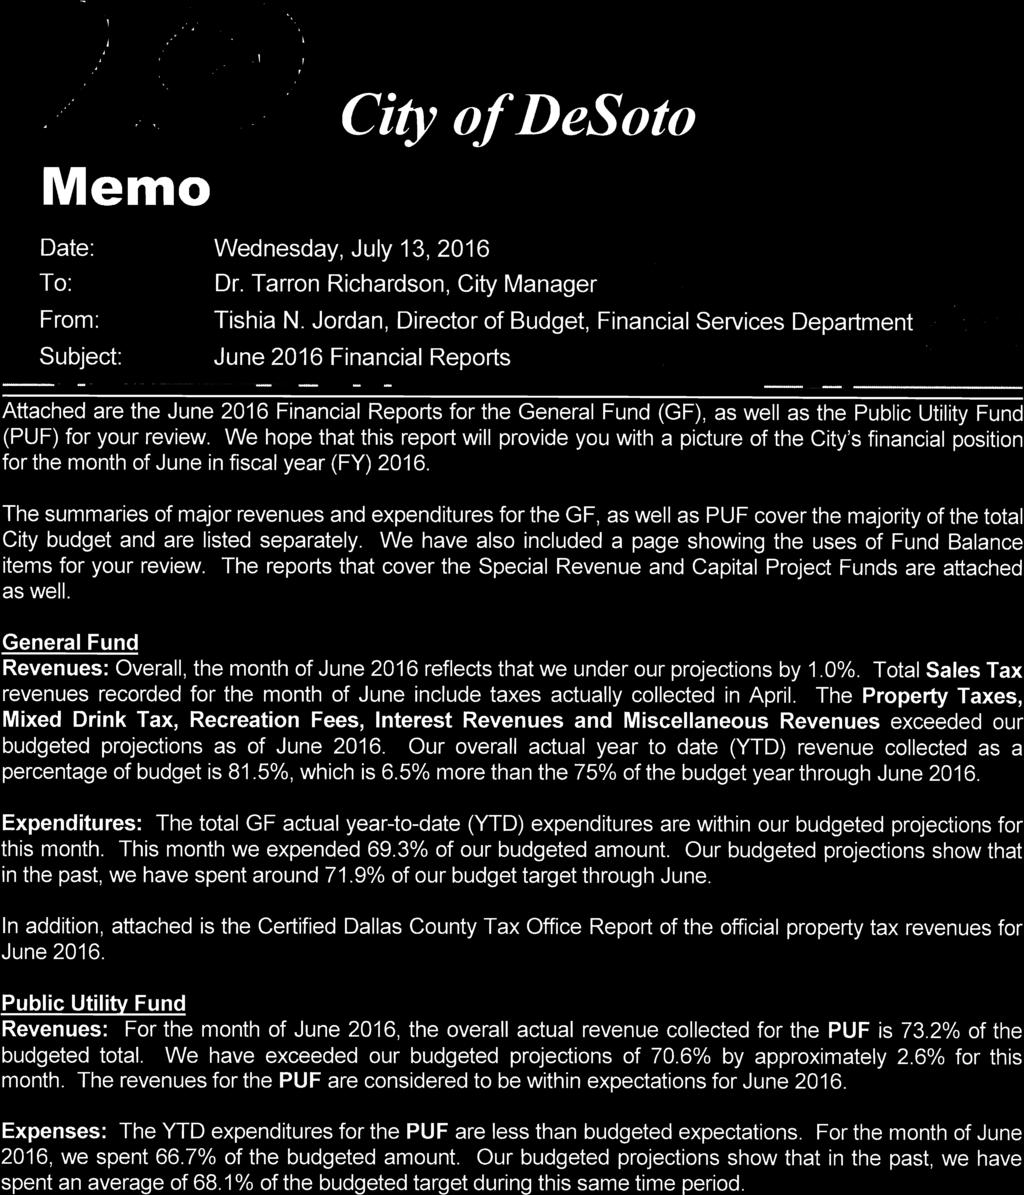
2 GENERAL FUND REVENUES AND EXPENDITURES Current Actual Projected YTD Budget Final Amended Month Current YTD YTD Projected Actual YTD% Projected % REVENUES Budget Actuals Amount Amount Variance of Budget of Budget PROPERTY TAXES $16,341,002 $228,110 $16,693,071 $16,095,887 $597, % 98.5% SALES TAXES $6,950,000 $624,936 $3,779,975 $4,334,020 ($554,045) 54.4% 62.4% MIXED DRINK TAX $31,000 $0 $20,578 $15,550 $5, % 50.2% FRANCHISE FEES $4,005,719 $94,475 $2,311,997 $2,343,346 ($31,349) 57.7% 58.5% LICENSES & PERMITS $904,150 $123,971 $858,957 $975,578 ($116,621) 95.0% 107.9% INTERGOVERNMENTAL $444,807 $3,164 $239,444 $292,594 ($53,150) 53.8% 65.8% CHARGES FOR SERVICES $1,478,000 $159,882 $978,715 $1,100,519 ($121,804) 66.2% 74.5% RECREATION FEES $244,550 $49,402 $181,461 $175,831 $5, % 71.9% FINES & FORFEITURES $1,395,000 $94,376 $1,048,825 $1,175,148 ($126,323) 75.2% 84.2% INTEREST REVENUES $45,400 $9,187 $34,977 $14,519 $20, % 32.0% ADMINISTRATIVE FEE REIMBURSE $1,871,837 $155,986 $1,403,878 $1,403,878 $0 75.0% 75.0% MISCELLANEOUS $409,046 $9,568 $256,600 $211,957 $44, % 51.8% INTERFUND TRANSFERS $36,300 $833 $33,800 $25,497 $8, % 70.2% TOTAL REVENUES $34,156,811 $1,553,890 $27,842,278 $28,164,324 ($322,046) 81.5% 82.5% EXPENDITURES CITY COUNCIL 311,012 $20,652 $199,914 $210,431 ($10,517) 64.3% 67.7% CITY MANAGER/GEN ADMIN 1,060,893 72, ,522 $778,059 11, % 73.3% FINANCIAL SERVICES 1,201,861 87, ,659 $849,956 (90,297) 63.2% 70.7% INFORMATION TECHNOLOGY 900,188 85, ,628 $618,429 73, % 68.7% HUMAN RESOURCES 565,170 35, ,916 $382,281 3, % 67.6% DEVELOPMENT SERVICES 6,418, ,652 4,327,055 $4,476,429 (149,374) 67.4% 69.7% PARKS AND LEISURE SERVICES 2,770, ,351 1,736,458 $1,884,461 (148,003) 62.7% 68.0% MUNICIPAL COURT 545,139 34, ,339 $377,999 (45,660) 61.0% 69.3% LIBRARY SERVICES 1,017,432 87, ,143 $695,923 (23,780) 66.1% 68.4% POLICE 9,251, ,335 6,700,746 $6,722,306 (21,560) 72.4% 72.7% REGIONAL JAIL 350,000 29, ,500 $261, % 74.8% FIRE 7,523, ,700 5,349,885 $5,477,342 (127,457) 71.1% 72.8% SWRCC-REGIONAL DISPATCH 527,000 43, ,250 $393,669 1, % 74.7% NON-DEPARTMENTAL 1,757,250 28,141 1,088,108 $1,445,162 (357,054) 61.9% 82.2% OPERATING EXPENDITURES: $34,200,686 $2,357,909 $23,691,123 $24,574,107 ($882,984) 69.3% 71.9% Revenue Expenditures ($43,875) ($804,019) $4,151,155 USES OF FUND BALANCE 1,267,206 99, ,945 TOTAL EXPENDITURES $35,467,892 $2,457,470 $24,517,068
3 CITY OF DESOTO USES OF FUND BALANCE Amended Current Month Actual YTD OBJECT EXPENDITURES Budget FY Actuals Amount USES OF FUND BALANCE FICA EXP.-EMPLOYER $0 $206 $9, WORKER'S COMPENSATION $0 $8 $ TMRS-EMPLOYER $0 $0 $12, FINAL BENEFIT PAY EXPENSE $118,767 $0 $117, REPAIR & MAINTENANCE $60,000 $0 $ CONSULTANT SERVICES $167,000 $32,580 $68, CLAIMS/LITIGATION EXP. $40,614 $0 $40, SUMMER INTERN PROGRAM $12,500 $2,698 $2, BUSINESS GRANTS $28,325 $1,569 $11, CAPITAL OUTLAY $90,000 $0 $ TRANS TO 108-STABILIZATION FD $250,000 $20,833 $187, TRANS TO 412 ELECTRONIC EQUIP $500,000 $41,667 $375,000 TOTAL USES OF FUND BALANCE $1,267,206 $99,561 $825,945
4
5 PUBLIC UTILITY FUND REVENUES AND EXPENDITURES REVENUES Current Actual Projected YTD Budget Final Amended Month YTD YTD Projected Actual YTD% Projected % Budget Actuals Amount Amount Variance of Budget of Budget Water Sales $9,462,805 $760,062 $6,421,393 $6,188,674 $232, % 65.4% Service Fees $64,500 $4,456 $42,406 $36,752 $5, % 57.0% Water Connections $70,000 $5,900 $41,810 $67,934 ($26,124) 59.7% 97.0% Senior Discount-Water ($91,000) ($8,343) ($73,851) ($65,569) ($8,282) 81.2% 72.1% Sewer Service $8,952,742 $845,664 $7,003,207 $6,780,628 $222, % 75.7% Sewer Connections $24,000 $1,750 $10,430 $13,692 ($3,262) 43.5% 57.1% Senior Discount-Sewer ($89,000) ($8,160) ($72,153) ($63,192) ($8,961) 81.1% 71.0% Penalty Fees $346,000 $28,840 $257,440 $259,486 ($2,046) 74.4% 75.0% Miscellaneous $27,000 $1,679 $109,567 $33,870 $75, % 125.4% Interest Earnings $28,000 $391 $8,678 $11,683 ($3,005) 31.0% 41.7% TOTAL REVENUES $18,795,047 $1,632,239 $13,748,927 $13,263,958 $484, % 70.6% EXPENDITURES Customer Accounts $1,794, ,742 $1,141,855 $1,225,482 (83,627) 63.6% 68.3% Field Operations $12,585,181 1,148,336 $8,086,335 $8,498,018 (411,683) 64.3% 67.5% Non Departmental $4,479, ,217 $3,345,924 $3,110, , % 69.4% TOTAL EXPENDITURES $18,858,953 $1,648,295 $12,574,114 $ 12,833,715 (259,601) 66.7% 68.1% Revenue Over (Under) Expenditures $ (63,906) $ (16,056) $ 1,174,813
6 OTHER FUNDS - FINANCIAL SUMMARY Beginning Annual Current Actual Annual Current Actual Ending Fund Fund Revenue Month To-Date Expenditure Month To-Date Balance Nbr FUND NAME Balance Budget Revenues Revenues Budget Expenditures Expenditures To Date OTHER ENTERPRISE FUNDS 503 WATER METER REPLACEMENT FUND 541, ,000 30, , ,000 40, , , WATER/SEWER EQUIP REPLACE FUND 545, , , ,537 42, , , STORM DRAINAGE UTILITY FUND 680,137 1,492, ,413 1,141,729 1,123,052 75, ,709 1,067, SANITATION ENTERPRISE FUND 1,861,565 4,088, ,196 3,030,300 4,004, ,299 2,731,647 2,160,218 HOTEL OCCUPANCY TAX FUND 221 HOTEL OCCUPANCY TAX FUND 1,339, ,200 61, ,966 1,271,792 53, ,980 1,498,538 OTHER SPECIAL REVENUE FUNDS 108 STABILIZATION FUND-DESOTO 1,334, ,000 20, , ,522, SW REGIONAL COMM. CENTER FUND 495,231 2,935, ,763 2,087,912 3,067, ,082 2,275, , CITY JAIL OPERATIONS 383,250 1,084,930 89, ,554 1,117,765 84, , , POLICE DEPT.-STATE SEIZED FUND 1,407 1, , POLICE DEPT.- FED SEIZED FUNDS 521,569 40,200 10, , ,635 18, , , YOUTH SPORTS ASSOC-BASEBALL 4,000 33, , , JUVENILE CASE MANAGER FUND 76,580 30,150 1,980 21,433 61,494 4,201 32,650 65, MUNICIPAL COURT TECHNOLOGY 63,120 25,100 1,584 17,203 15,730-9,856 70, MUNICIPAL COURT SECURITY FUND 191,512 20,250 1,188 13,006 80,447 1,268 37, , RECREATION REVOLVING FUND 264, ,900 43, , ,649 54, , , FIRE TRAINING FUND 240, ,100 35, , ,341 21, , , POLICE GRANT FUND 36,495 70,479-19,082 56,784 5,141 32,557 23, ENERGY MANAGEMENT FUND 534,555 2,103, ,378 1,578,611 1,938, ,999 1,093,484 1,019, SENIOR CENTER 35,649 10, ,076 10, ,098 32, YOUTH SPORTS ASSOC-SOCCER 2, , HISTORICAL FOUNDATION 4, , YOUTH SPORTS ASSOC-FOOTBALL 19,735 35,200 13,980 15,509 33,670-9,885 25, YOUTH SPORTS ASSOC-BASKETBALL 5,999 36,100-28,805 36,000 (2,507) 34, HEALTH FACILITIES DEVEL CORP 18, , HOUSING FINANCE CORP 211, ,000-20, , INDUSTRIAL DEVEL. AUTHORITY 29, , YOUTH SPORTS-GIRLS SOFTBALL 3,655 2,570-2,740 2, , CDBG GRANT FUND - 229,784-42, ,684 4,250 35,825 6, LIBRARY REVENUE FUND 26,110 13,110 1,423 16,794 10, ,316 36,588 DEBT SERVICE FUNDS 305 BOND DEBT SERVICE FUND 2,829,318 7,542,285 73,817 7,750,139 7,506, ,314,992 4,264,465 MAINTENANCE/REPLACEMENT FUNDS 401 FIRE PPE REPLACEMENT 85,234 63,250-63,126 12,235-5, , FIRE EQUIP. REPLACEMENT FUND 124,571 1, ,401-31,529 93, FURNITURE REPLACEMENT FUND 3,296 30,000-30,012 30,000-30,000 3, COMMAND VEHICLE FIRE 60,498 1, ,200-14,000 46, PARK MAINTENANCE 144,685 26,200 2,167 19,630 29,500 2,489 5, , POOL MAINTENANCE FUND 24,578 21,125 1,750 15,790 16,400 1,543 11,110 29, POLICE EQUIPMENT REPLACE FUND 24, , , , ,473 51, FACILITY MAINTENANCE 271, ,326 49, , ,793 24, , , ELECTRON.EQUIP.REPLACE.FUND 773, ,933 60, , , ,100 1,212, SWRCC-EQUIPMENT REPLACE FUND 19,538 50,000 4,167 37,530 44,494-5,579 51, CAPITAL IMPR.-OTHER PUBL WKS 223, ,689 52, , , , , EQUIPMENT REPLACEMENT FUND 1,463,977 1,090, ,081,400 1,545,406 2,704 1,046,039 1,499, WATER METER REPLACEMENT FUND 541, ,000 30, , ,000 40, , , WATER/SEWER EQUIP REPLACE FUND 545, , , ,537 42, , , DRAINAGE EQUIP REPLACE FUND - 26,000-26,000 26,000-24,309 1, SANITATION EQUIP REPLACE FUND 23,503 84,800 7,067 63,672 34, ,175 PARK DEVELOPMENT CORPORATION 118 PARK DEVELOPMENT CORP. FUND 682, ,650 52, , , , , DEBT SERVICE PARKS DEVELOPMENT 118, , , , , ,150
7 CAPITAL PROJECT FUNDS - FINANCIAL SUMMARY Beginning Annual Current Actual Annual Current Actual Ending Fund Fund Revenue Month To-Date Expenditure Month To-Date Balance Nbr FUND NAME Balance Budget Revenues Revenues Budget Expenditures Expenditures To Date OTHER CAPITAL PROJECTS 417 PARK LAND DEDICATION 134,592 10,300-77,135 50, , CAPITAL IMPR.-OTHER PUBL WKS 223, ,689 52, , , , , GENERAL CAPITAL IMPROVEMENTS 1,753, , , ,686 5, ,886 1,891,770 STREET IMPROVEMENTS BOND ISSUANCE PROJECTS 489 STREET IMPROVEMENTS-GO BONDS 124,782 2, , , STREET IMPROVEMENTS-CO BONDS 3,623,475 4,623,317 1,122 8,276 7,765,989 22, ,631 3,190, BOND ISSUANCE PROJECTS 705 FIRE STATION IMPROVEMENTS 969,322 3,150, ,896 4,116,879 33, , , PARK IMPROVEMENTS 1,002, , ,231 1,024,750-6, ,724 CAPITAL PROJECTS - ENTERPRISE FUNDS 508 CIP-WATER & SEWER FUND 10,008,849 3,082,809 99, ,566 12,713,362 16,769 1,038,033 9,864, DRAINAGE IMPROVEMENTS FUND 1,648, ,021 47, ,792 1,086, ,217 1,869,998
GENERAL FUND REVENUES AND EXPENDITURES FY Through March % of Budget Year
 GENERAL FUND REVENUES AND EXPENDITURES Current Actual Projected YTD Budget Final Amended Month Current YTD YTD Projected Actual YTD% Projected % REVENUES Budget Actuals Amount Amount Variance of Budget
City of DeSoto. Memo. Date: Wednesday, December 9, 2015
 Date: Wednesday, December 9, 2015 To: From: Subject: City of DeSoto Memo Dr. Tarron Richardson, City Manager Tishia N. Jordan, Assistant Director, Financial Services November 2015 Financial Reports Attached
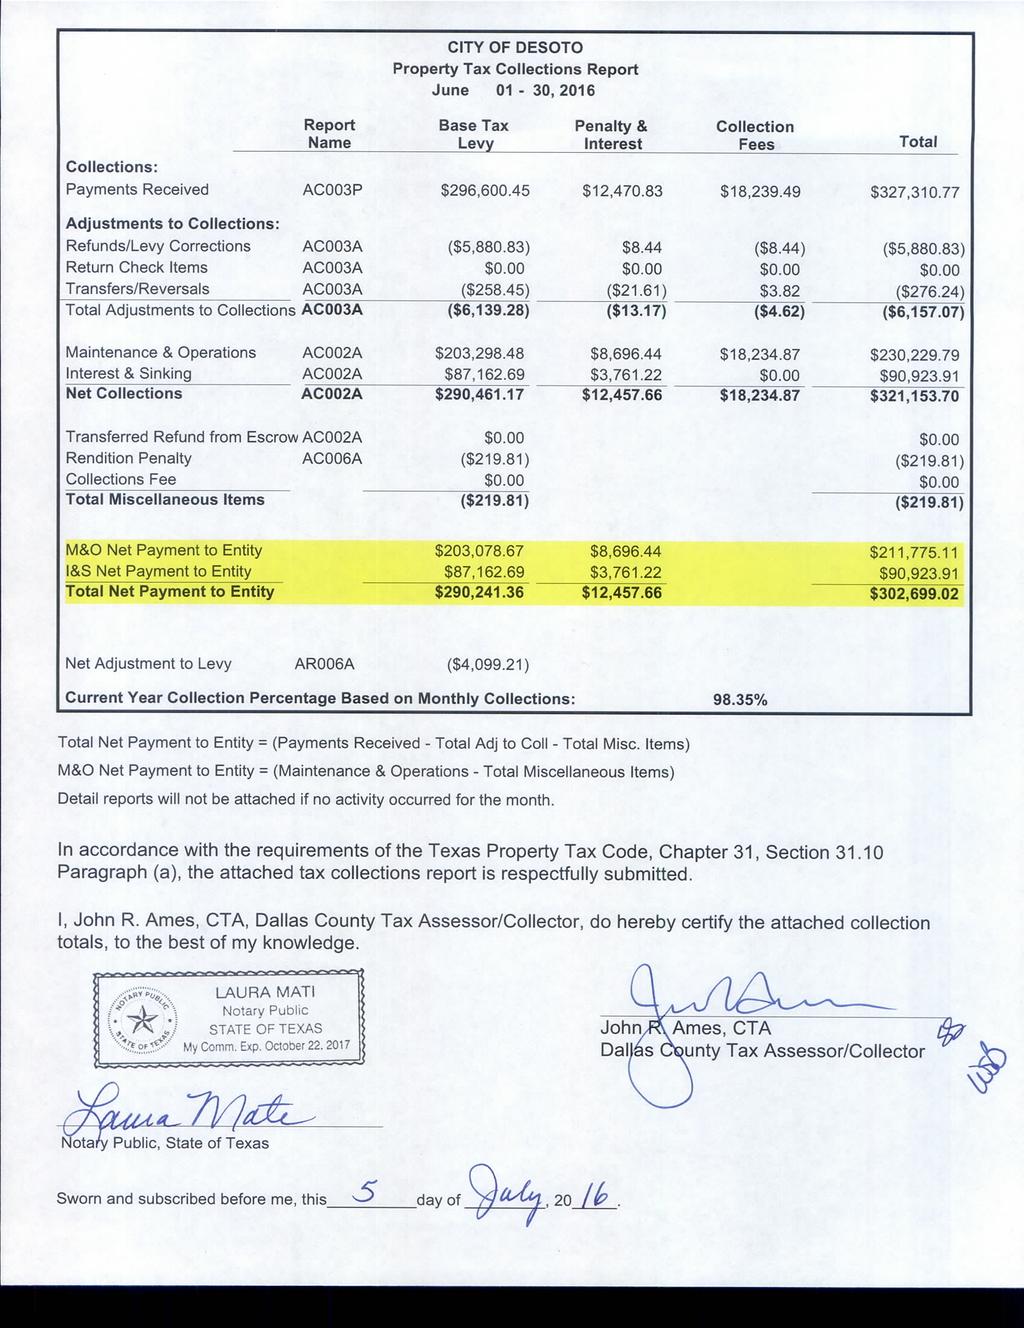
City of DeSoto. Memo. In addition, attached is the Certified Dallas County Tax Office Report of the official property tax revenues for March 2017.
 Date: To: From: Subject: City of DeSoto Memo Wednesday, April 12, 2017 Dr. Tarran Richardson, City Manager~ / Tishia N. Jordan, Director of Budget t:lff'/-f March 2017 Financial Reports Attached are the
GENERAL FUND REVENUES AND EXPENDITURES FY Through May % of Budget Year
 GENERAL FUND REVENUES AND EXPENDITURES Through May 2018 Current Actual Projected YTD Budget Final Amended Month Current YTD YTD Projected Actual YTD% Projected % REVENUES Budget Actuals Amount Amount Variance
GENERAL FUND REVENUES AND EXPENDITURES FY Through April % of Budget Year
 GENERAL FUND REVENUES AND EXPENDITURES Current Actual Projected YTD Budget Final Amended Month Current YTD YTD Projected Actual YTD% Projected % REVENUES Budget Actuals Amount Amount Variance of Budget
City of DeSoto. Memo. Date: VVednesday, August11, 2011 ~~ Dr. Tarron Richardson, City Manager t/ To: Eden a Atmore, Assistant Director of Finance
 Memo Date: To: From: Subject: City of DeSoto VVednesday, August11, 2011 ~~ Dr. Tarron Richardson, City Manager t/ Eden a Atmore, Assistant Director of Finance July 2011 Financial Reports Attached are the
City ofdesoto. Tishia N. Jordan, Assistant Finance DirectorM'1 May 2015 Financial Reports
 Memo Date: To: From: Subject: City ofdesoto Wednesday, June 10, 2015 Dr. Tarron Richardson, City Manager o. J Tishia N. Jordan, Assistant Finance DirectorM'1 May 2015 Financial Reports Attached are the
CITY OF EAST POINT SUMMARY OF REVENUES & EXPENDITURES FOR THE PERIOD ENDING
 SUMMARY OF S & EXPENDITURES FOR THE PERIOD ENDING Nov 30th 2017 Nov17 FY 2018 FY 2018 % of YTD ACTUAL BUDGET VARIANCE Budget FUND 100 General Fund Taxation $ 7,857,111 $ 26,103,235 $ (18,246,124) 30% Licenses
CITY OF EAST POINT SUMMARY OF REVENUES & EXPENDITURES FOR THE PERIOD ENDING
 SUMMARY OF S & EXPENDITURES FOR THE PERIOD ENDING Sept 30th 2017 Sep17 FY 2018 FY 2018 % of YTD ACTUAL BUDGET VARIANCE Budget FUND 100 General Fund Taxation $ 3,415,289 $ 26,103,235 $ (22,687,946) 13%
 INFORMATION ITEMS December 31, 2014 For the first quarter of FY 2014-2015, the General Fund has collected 31% of revenues, primarily due to property taxes (42% collected through December). Expenditures
City of Concordia, KS Monthly Financial Report August 31, 2013
 City of Concordia, KS Monthly Financial Report August 31, 2013 BUDGETED FUNDS Beginning Ending Encumbrances Subtract Cash Balance Unencumbered Cash Unencumbered and Accounts Accounts August 31, Funds Cash
FY BEGINNING BALANCE FY PLANNED REVENUES
 BEGINNING BALANCE REVENUES EXPENDITURES ENDING BALANCE $182,017,646 $1,351,193,000 $1,351,193,000 Aviation 14,216,560 144,132,819 144,132,819 14,216,560 Convention and Event Services 33,234,399 108,647,915
April 30, 2015 For the first seven months of FY , the General Fund has collected 78% of revenues, primarily due to property taxes. Expenditur
 April 30, 2015 For the first seven months of FY 2014-2015, the General Fund has collected 78% of revenues, primarily due to property taxes. Expenditures are 55% of budget. The Fire Department has spent
January 31, 2015 For the first four months of FY , the General Fund has collected 55% of revenues, primarily due to property taxes (75% colle
 January 31, 2015 For the first four months of FY 2014-2015, the General Fund has collected 55% of revenues, primarily due to property taxes (75% collected through January). Expenditures through Janauary
FY Projected Changes in Fund Balance
 FY 2009-10 Projected Changes in Fund Balance FY 2009-10 FY 2009-10 FY 2009-10 FY 2009-10 BEGINNING ADOPTED ADOPTED ENDING FUND BALANCE REVENUES EXPENDITURES BALANCE GENERAL FUND 47,000,757 994,491,287
9.C.2.a. Attachment: FY 2016 Budget [Revision 1] (1727 : FY2016 Budget) Packet Pg. 75
![9.C.2.a. Attachment: FY 2016 Budget [Revision 1] (1727 : FY2016 Budget) Packet Pg. 75](/thumbs/88/117495514.jpg "9.C.2.a. Attachment: FY 2016 Budget [Revision 1] (1727 : FY2016 Budget) Packet Pg. 75") Packet Pg. 75 Packet Pg. 76 Packet Pg. 77 GENERAL FUND BUDGET SUMMARY REVENUES, OTHER SOURCES, EXPENDITURES, OTHER USES AND FUND BALANCE FY 2016 Initial Budget 2014 2014 2015 Actuals FY 2016 Initial Budget
Packet Pg. 75 Packet Pg. 76 Packet Pg. 77 GENERAL FUND BUDGET SUMMARY REVENUES, OTHER SOURCES, EXPENDITURES, OTHER USES AND FUND BALANCE FY 2016 Initial Budget 2014 2014 2015 Actuals FY 2016 Initial Budget
CITY OF MAUSTON GENERAL FUND SUMMARY SCHEDULE OF REVENUES AND EXPENDITURES
 GENERAL FUND Taxes General Property Taxes $ 1,934,140 $ 1,688,759 $ 1,696,679 $ 1,720,679 $ 1,720,771 $ 21,321 $ 1,742,000 Payment in Lieu of Taxes 125,492 137,264 124,568 147,748 150,707 (1,000) 146,748
City of Roanoke Preliminary Operating and Capital Budget FY
 Roanoke City of Roanoke Preliminary Operating and Capital Budget FY 2016-17 108 S. Oak Street, Roanoke, TX 76262 www.roanoketexas.com Presented by: Scott Campbell, City Manager Vicki Rodriquez, Director
Interim Statements % of Year Collected/Expended = %
 GENERAL FUND Revised Nov18 Remaining % Collected/ Nov17 Variance Taxes General Property 8,764,017 3,779,568 4,984,449 43.13% 5,813,975 (2,034,407) General Sales and Use 5,300,000 2,005,425 3,294,575 37.84%
CITY OF PALM BAY, FLORIDA MONTHLY FINANCIAL REPORT (UNAUDITED) MARCH Financial Report Summary
 MARCH Financial Report Summary") (UNAUDITED) The City of Palm Bay, Florida s (the City ) monthly financial report presents an overview and analysis of the City s financial activities during the month of. March is the sixth month of the
(UNAUDITED) The City of Palm Bay, Florida s (the City ) monthly financial report presents an overview and analysis of the City s financial activities during the month of. March is the sixth month of the
MEMORANDUM Finance Department
 MEMORANDUM Finance Department INVESTMENT REPORT A significant reduction in November s investment income is due to the LGIP withholding earnings to offset Pool B s potential for loss. The LGIP is transferring
FY PROPOSED ANNUAL BUDGET
 CITY OF ENNIS, TX FY 2016-2017 PROPOSED ANNUAL BUDGET PREPARED BY THE ADMINISTRATION DEPARTMENT RANDALL SCOTT DIXON, CITY MANAGER REVISED 08/19/2016 CITY OF ENNIS SUMMARY OF DEDUCTIONS BY FUND FY2016-17
The City of Springfield groups funds into two broad fund categories: Governmental Funds Proprietary Funds
 City Fund Types The City of Springfield groups funds into two broad fund categories: Governmental Funds Proprietary Funds Funds are further categorized into six generic fund types: Debt Service Funds Capital
Name. Basic Form Instructions
 Adopted Budget Form for: Cities, Towns & Counties Name Perry City Fiscal Year Ended 6/30/2018 1. As required by Utah statutes, budget forms submitted must present a balanced budget, meaning budgeted expenditures
State of Kansas City. Water & Sewer Utility Fund 14 1,352,556 Gas Utility Fund 15 58,000
 CERTIFICATE 2016 To the Clerk of Cloud, State of Kansas We, the undersigned, officers of of Concordia certify that: (1) the hearing mentioned in the attached publication was held; (2) after the Budget
Interim Statements % of Year Expended = 25.00%
 GENERAL FUND Revised Sep16 Remaining %Collected/ Sep15 Variance Taxes General Property 11,549,666 228,899 11,320,767 1.98% 270,280 (41,381) General Sales and Use 5,050,000 894,952 4,155,048 17.72% 874,595
FARR WEST CITY Tentative Revised Budget
 GENERAL FUND - SUMMARY REVENUES GENERAL FUND Taxes $ 1,263,000 $ 1,216,000 $ 1,217,000 $ 1,030,324 $ 986,005 Licenses & Permits 250,000 153,000 258,000 156,518 99,662 Intergovernmental Revenues 198,000
Interim Statements % of Year Collected/Expended = 66.67%
 GENERAL FUND Revised Feb18 Remaining % Collected/ Feb17 Variance Taxes General Property 11,726,352 10,902,891 823,461 92.98% 10,583,381 319,510 General Sales and Use 5,200,000 3,390,485 1,809,515 65.20%
Interim Statements % of Year Collected/Expended = 83.33%
 GENERAL FUND Revised Apr17 Remaining % Collected/ Apr16 Variance Taxes General Property 11,549,666 11,264,933 284,733 97.53% 11,101,887 163,046 General Sales and Use 5,050,000 3,960,664 1,089,336 78.43%
Overall Expenditure Summary
 Overall Expenditure Summary 2014 2015 2016 2016 2016 2017 Fund Actual Actual Budget YTD Projected Budget General 8,281,509 7,659,790 8,355,387 5,296,723 7,792,185 8,184,357 CRA 341,547 268,980 717,000
04/03/ :16 AM User: DAN DB: Bath
 04/03/ 08:16 AM Fund 101 - General Fund 101-000-401.000 Current Property Taxes 101-000-403.000 Police & Fire Taxes 101-000-407.000 Property Tax Collection Fees 101-000-423.000 Trailer Taxes 101-000-445.000
New Mexico Department of Finance and Administration Local Government Division Property Valuation Estimate
 New Mexico Department of Finance and Administration Local Government Division Property Valuation Estimate COUNTY: Colfax County Fiscal Year: 2017-2018 ROUNDED TO NEAREST DOLLAR (A) (B) (C) (D) PROPERTY
Second Quarter Financial Statements
 Second Quarter Financial Statements For the six months ended 03.31.2014 Prepared by the Finance Department Quarterly Financial Statements for six months ended 03.31.2014 Quarterly Financial Statements
COLUMBIA COUNTY BOARD OF COUNTY COMMISSIONERS FINAL BUDGET FISCAL YEAR PREPARED BY BEN SCOTT COUNTY MANAGER
 COLUMBIA COUNTY BOARD OF COUNTY COMMISSIONERS FINAL FISCAL YEAR 2016-2017 PREPARED BY BEN SCOTT COUNTY MANAGER SEPTEMBER 15, 2016 COLUMBIA COUNTY BOARD OF COUNTY COMMISSIONERS TABLE OF CONTENTS PAGE OPERATING
Revenue vs Expense for April 2017
 General Fund Sales Tax $6,900,000.00 $2,237,099.61 32.42% County Sales Tax $2,000,000.00 $658,271.51 32.91% Payment of ACT 9 Taxes $22,000.00 $0.00 0.00% Pay in Lieu of Taxes - Util $1,500,000.00 $433,159.26
State of Kansas City. Water & Sewer Utility Fund 15 1,686,031 Gas Utility Fund 16 54,820
 CERTIFICATE 2015 To the Clerk of Cloud, State of Kansas We, the undersigned, officers of of Concordia certify that: (1) the hearing mentioned in the attached publication was held; (2) after the Budget
City of Roanoke Preliminary Operating and Capital Budget FY
 City of Roanoke Preliminary Operating and Capital Budget FY 2015-16 Presented by: City Manager Scott Campbell Director of Fiscal and Administrative Services Vicki Rodriquez 108 S. Oak Street, Roanoke TX,
City of Oak Ridge North Monthly Trend Report of Revenues and Expenditures
 City of Oak Ridge North Monthly Trend Report of Revenues and Expenditures Amended October November December January February March April May June FY 2017 YTD Total % GENERAL REVENUES 00 51010 Curr Coll-Prop
CITY OF DES MOINES, IOWA COMBINING BALANCE SHEET SCHEDULE ALL GENERAL FUND ACCOUNTS June 30, 2008
 COMBINING BALANCE SHEET SCHEDULE ALL GENERAL FUND ACCOUNTS June 30, 2008 ASSETS TORT GENERAL LIABILITY TOTALS Cash and pooled cash investments $ 10,936,777 $ --- $ 10,936,777 Taxes receivable 49,564,325
SOUTH WEBER CITY CORPORATION REVENUES WITH COMPARISON TO BUDGET FOR THE 1 MONTHS ENDING JULY 31, 2017 GENERAL FUND
 REVENUES WITH COMPARISON TO BUDGET GENERAL FUND PERIOD ACTUAL YTD ACTUAL BUDGET UNEARNED PCNT TAXES 10-31-100 CURRENT YEAR PROPERTY TAXES.00.00 320,000.00 320,000.00.0 10-31-120 PRIOR YEAR PROPERTY TAXES
Revenue vs Expense for February 2019
 General Fund Sales Tax $7,000,000.00 $1,227,630.12 17.54% County Sales Tax $2,100,000.00 $358,756.42 17.08% Payment of ACT 9 Taxes $50,000.00 $0.00 0.00% Pay in Lieu of Taxes - Util $1,600,000.00 $237,073.45
YTD REVENUE to EXPENDITURES and BUDGET COMPARISON (In Millions) $39.992
 $39.992") CITY OF FARMINGTON MEMORANDUM TO: Mayor, Council, and City Manager FROM: Andy Mason, Administrative Services Director DATE: March 22, 2016 SUBJECT: February FY2016 Monthly Financial Report Attached is
CITY OF FARMINGTON MEMORANDUM TO: Mayor, Council, and City Manager FROM: Andy Mason, Administrative Services Director DATE: March 22, 2016 SUBJECT: February FY2016 Monthly Financial Report Attached is
Best Practices for Treasurers 2018 Summer Specialized Training RESPONSIBILITIES OF THE TREASURER
 Best Practices for Treasurers 2018 Summer Specialized Training RESPONSIBILITIES OF THE TREASURER BEFORE THE BOARD MEETING 1. Prepare some claims for payment (clerk may also do these), attach bills to claims,
City Fund Types. Special Revenue Funds
 City Fund Types The City of Springfield groups funds into two broad fund categories: Governmental, and Proprietary Fund Category. Funds are further categorized into six generic fund types: General Fund
PROJECTED CHANGES IN FUND BALANCE
 PROJECTED CHANGES IN FUND BALANCE Beginning Balance Revenues Expenditures Ending Balance General Fund $160,617,192 $1,276,420,942 $1,276,420,942 $165,304,067 Enterprise Funds Aviation 9,988,733 127,028,405
CITY OF HAILEY REVENUES WITH COMPARISON TO BUDGET FOR THE 1 MONTHS ENDING OCTOBER 31, 2018 GENERAL FUND
 REVENUES WITH COMPARISON TO BUDGET GENERAL FUND PERIOD ACTUAL YTD ACTUAL BUDGET UNEARNED PCNT GENERAL FUND REVENUE 100-00-31009 SALES TAX REVENUE THROUGH COUN.00.00 2,569,002.00 2,569,002.00.0 100-00-31910
Monthly Snapshot Financial Management Report March 2012 March Sales Tax, Use Tax, and Lodgers Tax Collections March sales tax collections showed an in
 Monthly Snapshot Financial Management Report March 2012 March Sales Tax, Use Tax, and Lodgers Tax Collections March sales tax collections showed an increase over 2011. Collections were up 6.7% over March
FYE 12/31/16 FYE 12/31/16
 Pulaski County, Georgia Budget General Fund PROPERTY TAX - CURRENT YEAR 2,800,000 LEGISLATIVE 199,397 TIMBER TAX - CURRENT YEAR 35,000 ELECTIONS 59,781 PROPERTY TAX - PRIOR YEARS 125,000 FINANCIAL ADMINISTRATION
Debt Service Funds Overview
 Debt Service Funds Overview Irving issues longterm debt to finance major capital purchases; most often to improve or expand city facilities and infrastructure, but also for major capital equipment such
Revenue vs Expense for December 2017
 General Fund Revenue vs Expense for December 2017 Sales Tax $6,900,000.00 $6,869,780.06 99.56% County Sales Tax $2,000,000.00 $2,017,372.46 100.87% Payment of ACT 9 Taxes $22,000.00 $42,085.50 191.30%
QUARTERLY FINANCIAL REPORT
 QUARTERLY FINANCIAL REPORT Fourth Quarter to Actuals Trend Analysis This document has been prepared by the Finance department. Please direct any inquiries to the Director, Reginald Lindsey at 913-573-5292
City of Oak Ridge North Monthly Trend Report of Revenues and Expenditures - PRELIMINARY AS OF 10/18/16
 GENERAL REVENUES 00 51010 Curr Coll-Prop Tax 732,068.00 732,068.00 $ 17,877.67 $ 36,685.85 $ 241,071.65 $ 200,437.59 $ 186,988.70 $ 8,922.90 $ 11,502.16 $ 4,634.11 $ 16,804.58 $ (37,997.68) $ 3,569.33
STATE BOARD OF ADMINISTRATION (SBA) LOCAL GOVERNMENT SURPLUS TRUST FUNDS INVESTMENT POOL
 LOCAL GOVERNMENT SURPLUS TRUST FUNDS INVESTMENT POOL") INVESTMENT REPORT On December 31 st, the Town s funds were in the Florida Local Government Surplus Trust Funds Investment Pool (Florida Prime), TD Bank, and SunTrust, with the majority at SunTrust. A new
INVESTMENT REPORT On December 31 st, the Town s funds were in the Florida Local Government Surplus Trust Funds Investment Pool (Florida Prime), TD Bank, and SunTrust, with the majority at SunTrust. A new
11/01/ :50 PM. REVENUE AND EXPENDITURE REPORT FOR BATH TOWNSHIP Page: 1/22 User: DAN DB: Bath PERIOD ENDING 10/31/2017
 11/01/ 02:50 PM REVENUE AND EXPENDITURE REPORT FOR BATH TOWNSHIP Page: 1/22 DB: Bath PERIOD ENDING Fund 101 - General Fund 101-000-401.000 Current Property Taxes 101-000-403.000 Police & Fire Taxes 101-000-407.000
Where The Money Comes From - All Funds $104,271,868
 Where The Money Comes From - All $104,271,868 Fines and Forfeitures 1.2% Miscellaneous 5.5% Property Tax 15.5% Charge for 38.6% Intergovernmental 3.4% Licenses and Permits 0.4% Franchise Fees 3.7% Gross
General Fund Overview. General Fund Summary General Fund Revenues General Fund Expenditures
 General Fund Overview General Fund Summary General Fund Revenues General Fund Expenditures 113 GENERAL FUND SUMMARY BEGINNING FUND BALANCE $ 4,973,719 $ 5,515,205 $ 4,170,154 $ 7,012,255 $ 6,202,700 REVENUE
Fiscal Year Proposed Annual Budget
 Fiscal Year 2017 18 Proposed Annual Budget FUND General $ 14,431,889 $ 14,875,896 $ 17,241,548 $ 16,199,841 Debt Service 6,972,348 3,846,082 3,846,082 3,841,820 Economic Development 8,653,771 2,647,587
CITY OF GREER ANNUAL OPERATING AND CAPITAL IMPROVEMENTS BUDGET TABLE OF CONTENTS. Budget Ordinance. Chart of Revenues 1. Mayor and Council 4
 CITY OF GREER ANNUAL OPERATING AND CAPITAL IMPROVEMENTS BUDGET TABLE OF CONTENTS Budget Ordinance General Fund Budget Summary I V GENERAL FUND Chart of Revenues 1 Mayor and Council 4 City Administration
REVENUE WORKSHEET REPORT
 Page 1 GENERAL FUND 10-3001-0000 TAX PENALTIES & INTEREST 9,999.24 8,00 10-3001-0002 LOCAL OPTION SALES TAX 464,053.11 490,00 460,00 10-3001-0003 PRIVILEGE LICENSES 12,052.39 10-3001-0004 VEHICLE LICENSES
City of Justin NOVEMBER
 City of Justin MONTHLY FINANCIAL REPORT NOVEMBER - 2018 1 Revenues: Sales tax revenue is up 14.5% from this time prior year and November s sales tax collections increased 2.4% from November 2017. The City
FINANCE DEPARTMENT Monthly Financial Report
 CITY OF 31 San Jose CAPITAL OF SILICON VALLEY FINANCE DEPARTMENT Monthly Financial Report Financial Results for the Month Ended June 3, 218 Fiscal Year 217-218 ( UNAUDITED) Finance Department, City of
City of Roanoke Annual Budget FY
 City of Roanoke Annual Budget FY 201314 Presented by: City Manager Scott Campbell Director of Fiscal and Administrative Services Vicki Rodriquez 108 S. Oak Street, Roanoke TX, 76262 www.roanoketexas.com
CITY OF DES MOINES, IOWA COMBINING BALANCE SHEET SCHEDULE ALL GENERAL FUND ACCOUNTS June 30, 2016
 COMBINING BALANCE SHEET SCHEDULE ALL GENERAL FUND ACCOUNTS June 30, 2016 ASSETS GENERAL OTHER TOTALS Cash and investments $ 26,678,708 $ 2,599,415 $ 29,278,123 Taxes receivable 57,769,078 --- 57,769,078
CITY OF DES MOINES, IOWA COMBINING BALANCE SHEET SCHEDULE ALL GENERAL FUND ACCOUNTS June 30, 2017
 COMBINING BALANCE SHEET SCHEDULE ALL GENERAL FUND ACCOUNTS June 30, 2017 ASSETS GENERAL OTHER TOTALS Cash and investments $ 26,565,414 $ 2,345,357 $ 28,910,771 Taxes receivable 58,841,748 --- 58,841,748
CITY OF DES MOINES, IOWA COMBINING BALANCE SHEET SCHEDULE ALL GENERAL FUND ACCOUNTS June 30, 2018
 COMBINING BALANCE SHEET SCHEDULE ALL GENERAL FUND ACCOUNTS June 30, 2018 ASSETS GENERAL OTHER TOTALS Cash and investments $ 29,719,524 $ 2,222,625 $ 31,942,149 Taxes receivable 63,134,478 --- 63,134,478
CITY OF BELLINGHAM MONTHLY FINANCIAL REPORT JULY 2018 JULY IS THE SEVENTH MONTH OF THE YEAR 58.33% COMPLETE
 CITY OF BELLINGHAM MONTHLY FINANCIAL REPORT JULY 2018 JULY IS THE SEVENTH MONTH OF THE YEAR 58.33% COMPLETE Reporting Contents Citywide Page 1 General Fund Page 2 Street Fund Page 3 Water Fund Page 4 Wastewater
City of Doraville. FYE 2014 Amended Budget As of June 9, Approved Budget. FYE 2013 Actual
 FYE Fund 100 General Fund Taxes 6,442,722 5,998,686 6,408,667 6,705,167 296,500 Licenses and Permits 282,176 234,000 203,000 280,000 77,000 Intergovernmental Revenues 96,009 113,469 65,066 88,164 23,098
Third Quarter Financial Statements
 Third Quarter Financial Statements For the nine months ended 06-30-2017 Prepared by the Finance Department Quarterly Financial Statements for the nine months ended 06.30.2017 Quarterly Financial Statements
City of Roanoke. Preliminary Operating and Capital Budget FY S. Oak Street, Roanoke, TX
 City of Roanoke Preliminary Operating and Capital Budget FY 2018-19 108 S. Oak Street, Roanoke, TX 76262 www.roanoketexas.com Presented by: Scott Campbell, City Manager Vicki Rodriquez, Director of Fiscal
Monthly Financials May 31, 2016
 Monthly Financials May 31, 2016 Combining All Fund Revenue, & Other Uses Monthly Financials Table of Contents Budget Comparison 1 Bank Account Balances 2 Summary of Government wide Statement of, and Other
Salt lake City. FISCAL YEAR Budget Summary
 Salt lake City FISCAL YEAR 2012-13 Budget Summary Introduction Preparing a budget for Salt Lake City is a collaborative undertaking that requires the resources of multiple departments and a diverse group
CITY OF PALM DESERT BUDGETARY COMPARISON SCHEDULE BY DEPARTMENT GENERAL FUND. For the year ended June 30, 2013
 The General Fund is used to account for all financial resources traditionally associated with government, except those required to be accounted for in another fund. It is the primary operating fund that
Town of Eatonville. Annual Budget FY 2017
 Town of Eatonville Annual Budget FY 2017 TOWN OFFICIALS Mayor Eddie Cole Councilman Theo Washington Councilwoman Angela Thomas Vice Mayor Rodney Daniels Page 2 of 38 ORGANIZATIONAL CHART Citizens of Eatonville
General Fund 10-Year Financial Forecast FY through FY
 General Fund 10-Year Financial Forecast FY 2017-18 through FY 2026-27 INTRODUCTION The City of Concord has been using a 10-year general fund financial forecast since FY 1995-96. The use of the Forecast
TOWN BUDGET FOR Town of Cuba in. County of Allegany. Villages within or partly Within Town. Village of. Village of CERTIFICATION OF TOWN CLERK
 TOWN FOR 2016 Town of Cuba in County of Allegany Villages within or partly Within Town Village of Village of CERTIFICATION OF TOWN CLERK I, Nancy Orcutt, Town Clerk, certify that the following is a true
Proposed Budget. City of Seagraves. This budget includes a proposed tax rate of Tel Hill
 Proposed Budget 2017 2018 This budget includes a proposed tax rate of 0.863000 City of Seagraves Tel 806-387-2593 309 Hill www.cityofseagraves.com Fax 806-387-2595 Seagraves, TX 79359 Table of Contents
MEMORANDUM Finance Department
 INVESTMENT REPORT MEMORANDUM Finance Department On December 31 st, the Town s funds were in the Florida Local Government Surplus Trust Funds Investment Pool (Florida Prime and Fund B), TD Bank, and SunTrust,
FISCAL YEAR FINANCIAL REPORT Quarter Ended June 30, 2015
 FISCAL YEAR 2014-2015 FINANCIAL REPORT Quarter Ended June 30, 2015 To: From: City Manager, Mayor and City Council Rebecca Underhill, Finance Director Subject: Financial Report for Quarter Ended June 30,
CITY OF HAILEY REVENUES WITH COMPARISON TO BUDGET FOR THE 1 MONTHS ENDING OCTOBER 01, 2017 GENERAL FUND
 REVENUES WITH COMPARISON TO BUDGET GENERAL FUND PERIOD ACTUAL YTD ACTUAL BUDGET UNEARNED PCNT GENERAL FUND REVENUE 100-00-31001 PROPERTY TAXES FROM COUNTY.00.00 2,449,925.00 2,449,925.00.0 100-00-31009
CITY OF CULVER CITY FY Mid-Year Presentation
 CITY OF CULVER CITY FY 2018-2019 Mid-Year Presentation TONIGHT S PRESENTATION 1 2 3 4 FY 2017/2018 Summary Mid-Year FY 2018/2019 Proposed Mid-Year Budget Adj. Review of Financial Forecast CITY OF CULVER
Financial Worksheet - Budget 2017 Village of Aquilla Budget Year 2016
 Fund Classification: 2013 Special Revenue Fund Name: Gas Tax Fund Balance 1/1 $12,705.74 $20,680.95 $26,313.26 $20,313.26 Other - and Permits $18,225.21 $17,682.31 $19,000.00 $19,000.00 Total Revenue $18,225.21
City of Jefferson Projected Revenues and Other Sources General Fund. Millage Rate
 City of Jefferson Projected Revenues and Other Sources General Fund FY20I2 Source of Revenue CHANGE Millage Rate 6.398 6.398 6.398 Current Real & Personal $ 2,696,267 $ 2,500,000 $ 2,500,000 0.00% Motor
All Fund revenue and expenditure amounts do not include internal service fund budgets or transfers.
 Where the Money Comes From All $110,691,504 Fines and Forfeitures Miscellaneous Property Tax 1.4% 5.3% 15.0% Charge for 42.0% Gross Receipts 30.1% Where the Money Goes $118,633,465 Franchise Intergovernmental
CITY OF RIO GRANDE CITY MUNICIPAL BUDGET FOR FISCAL YEAR
 MUNICIPAL BUDGET FOR FISCAL YEAR 2014 2015 This budget will raise more revenue from property taxes than last year s budget by an amount of $50,167, which is a 2.38% increase from last year s budget. The
MEMORANDUM Finance Department
 INFRASTRUCTURE SURTAX FUND MEMORANDUM Finance Department The Infrastructure Surtax (Penny Tax) was separated out from the General Fund during the fiscal year end process to provide greater transparency.
THE CITY OF FREDERICK
 THE CITY OF FREDERICK FISCAL YEAR 2012 BUDGET UPDATE Prepared by the Department of Finance M. Katherine Barkdoll, CPA Director of Budget and Purchasing Gerald D. Kolbfleisch, CPFO Director of Finance Member
Village of Carpentersville Fund Financial Performance Summary As of January 31, 2017 YTD
 To: From: Subject: Memorandum J Mark Rooney, Village Manager Hitesh Desai, Finance Director Katrina Hanna, Assistant Finance Director December 2016 Monthly Staff and Financial Report Date: February 21,
Council Communication August 2, 2016, Business Meeting
 Council Communication August 2, 2016, Business Meeting 4th Quarterly Financial Report of the 2015-17 Biennium FROM: Lee Tuneberg, Administrative Services/Finance Director, tuneberl@ashland.or.us BACKGROUND
City of Cumberland. FY 2017 Budget Summary June 21, /21/2016
 City of Cumberland FY 2017 Budget Summary June 21, 2016 1 Table of Contents Page Assessable Real Property Tax Base 3 Capital Expenditure Summary 4 Capital Expenditure Detail 5 Debt Service Requirements
TOWN BUDGET FOR Town of Cuba in. County of Allegany. Villages within or partly Within Town. Village of. Village of CERTIFICATION OF TOWN CLERK
 TOWN FOR 2018 Town of Cuba in County of Allegany Villages within or partly Within Town Village of Village of CERTIFICATION OF TOWN CLERK I, Nancy Orcutt, Town Clerk, certify that the following is a true
SALT LAKE CITY BUDGET SUMMARY. Fiscal Year
 INTRODUCTION Preparing a budget for Salt Lake City is a collaborative undertaking that requires the resources of multiple departments and a diverse group of professionals all dedicated to making Salt Lake
THE CITY OF FREDERICK
 THE CITY OF FREDERICK FISCAL YEAR 2011 BUDGET UPDATE Prepared by the Department of Finance M. Katherine Barkdoll, CPA Director of Budget and Purchasing Gerald D. Kolbfleisch, CPFO Director of Finance Member
PUBLIC FACILITIES ELEMENT
 PUBLIC FACILITIES ELEMENT E l C e n t r o G e n e r a l P l a n This Implementation Program provides actions to implement the adopted policies and plans identified in the Public Facilities Element. The
How to Read the Budget
 How to Read the Budget Identifies the overall mission of the department or division Describes the actions to be taken to fulfill the general goal, including services, programs or projects to be completed
Please find attached the Financial Forecast Report based on information through January 2018.
 Memorandum DATE March 15, 2018 CITY OF DALLAS TO Honorable Members of the Government Performance & Financial Management Committee: Jennifer S. Gates (Chair), Scott Griggs (Vice Chair), Sandy Greyson, Lee
City of Orangeburg City of Orangeburg City of Orangeburg City of Orangeburg City of Orangeburg
 City of Orangeburg Monthly Financial Report FY 2010 2011 For Month Ending June 30, 2011 City of Orangeburg City of Orangeburg City of Orangeburg City of City of Orangeburg City of Financial Management
CITY OF BRISTOL FY 2018 Approved Operating Budget Percentage of Budget by Fund
 CITY OF BRISTOL Approved Operating Percentage of by Fund General Fund 90.85% Capital Projects Fund 3.21% Special Revenue Funds 5.94% ALL FUNDS TOTAL: $211,161,945 Note: The approved 2018 Operating for
Quarterly Financial Report 3rd Quarter Ending March 31, 2018
 Quarterly Financial Report 3rd Quarter Ending March 31, 2018 OVERVIEW This financial report summarizes the City s financial position for the fiscal year through the third quarter ending March 31, 2018
2019 Operating Budget. City of Racine, Wisconsin
 2019 Operating Budget City of Racine, Wisconsin 1 Property Tax Levy Total proposed Property tax levy for 2019: $54,322,250 2018 Budgeted levy: $54,322,250 Increase: $0 Increase as Percent of Total: 0.00%
Municipal Budget. City of Seagraves. This budget includes a proposed tax rate of Tel Hill
 This budget will raise more revenue from property taxes than last year's budget by an amount of $49,069.00 which is a 9.04 percent increase from last year's budget. Municipal Budget 2018 2019 This budget