In my presenta7on I will be looking at informa7on that helps to portray where we are today, the path we ve traveled in the last decade and a half, and
|
|
|
- Alfred Thompson
- 5 years ago
- Views:
Transcription
1 I am pleased to be with you this morning to share a demographer s perspec7ve on the characteris7cs and dynamics of the workforce in the Food and Beverage Manufacturing industries. Thank you to NYATEP, the Workforce Development Ins7tute and Cornell Coopera7ve Extension for organizing and planning this event, and to Onondaga Community College for hos7ng us. I am providing a statewide overview of the workforce in New York State from the bakers and candy makers in New York City to the juice processors and yogurt makers in Upstate New York. This is the proverbial view from 10,000 feet. Following this conference and gaining from what we learn today, our team will be assembling a data book with workforce informa7on by economic development region. My presenta7on draws upon data produced by my colleagues in the New York State Department of Labor, the U.S. Bureau of Labor Sta7s7cs, and the U.S. Census Bureau and I owe them a debt of gra7tude. A data analyst is not worth much without data to analyze. Data that are of high quality and 7mely. 1
2 In my presenta7on I will be looking at informa7on that helps to portray where we are today, the path we ve traveled in the last decade and a half, and look ahead to where we ll likely be in I will present informa7on on the number of jobs; characteris7cs of workers; where those workers come from; and trends in the supply of workers in general the workforce from which employers in Food and Beverage Manufacturing are drawing their employees. The workforce includes those directly engaged in the processing of food and beverages as well others in the sector who play suppor7ng roles and are in related posi7ons. 2
3 This is a graph depic7ng the annual average number of jobs in New York State in the Food and Beverage Manufacturing Industries. This line represents 60,000 jobs. Each column represents the average number of jobs during that year. The first column on the lez is for the year 2000, while the last column on the right is the preliminary es7mate for The low- point in employment shown in this graph is for 2009 during the recent Great Recession. You can see that employment in Food and Beverage Manufacturing has returned to pre- recession levels and now exceeds the previous peak in AND the number of jobs is approaching the previous high levels of employment in 2000 and Annual Averages even out seasonal fluctua7ons that occur over the course of a year. A review of the monthly data reveals a turbulent labor market with a great deal of seasonal fluctua7ons. The hiring and training tasks are far more challenging that what this picture portrays. Source: New York State Department of Labor, Quarterly Census of Employment and Wages, developed through a coopera7ve program between the State of New York and the U. S. Bureau of Labor Sta7s7cs. 3
4 In this graph I have set up an index for Food & Beverage Manufacturing and all other Manufacturing industries excluding Food & Beverage that is based on employment in the year The trend since 2000 in all other manufacturing represented by the Blue line has been downward to 2010 and flafened out since at approximately 60 percent of the level in There has been no rebound. Employment in Food & Manufacturing also declined since 2000 but at a far slower rate than all other manufacturing, bofoming out in 2009, and then a robust rebound since and coming close by 2014 to the level in Source: New York State Department of Labor, Quarterly Census of Employment and Wages, developed through a coopera7ve program between the State of New York and the U. S. Bureau of Labor Sta7s7cs. 4

5 The New York State Department of Labor prepared projec7ons of employment for all sectors of the economy between 2012 and In this graph I have used their projec7ons to extend the historical series, 2000 to 2014, to the year Over the next 7 years, the Department of Labor projects that the Food & Beverage Manufacturing sectors will con7nue to grow, adding over 4,500 addi7onal jobs. Finding, training and hiring the workers to fill those posi7ons is in large part what this conference is about. Who are the workers currently employed in Food & Beverage Manufacturing? Associated with these data on JOBS are workers with characteris7cs of their own. Knowing who they are should be helpful in developing the workforce that is needed today and tomorrow. Source: New York State Department of Labor, Quarterly Census of Employment and Wages, developed through a coopera7ve program between the State of New York and the U. S. Bureau of Labor Sta7s7cs. New York State Department of Labor, Division of Research and Sta7s7cs, Long- Term Industry Employment Projec7ons 5
6 Here is a composite picture of the average food and beverage manufacturing employee. They are: Male; 43 years old; with a High School diploma and no addi7onal years of educa7on; They were born in New York State And the most frequent occupa7on is Baker The average worker exists, but there is far more diversity in this workforce than is captured by the average. Source: U.S. Census Bureau, Quarterly Workforce Indicators 6

7 36% of the workforce are females, which is greater than the 31% in all manufacturing Source: U.S. Census Bureau, Quarterly Workforce Indicators 7

8 There are workers across a wide range of ages, with the most frequent being aged years old represen7ng 1- out- of- 4. 2/3rds of the workers are in the prime working age range of 25 to 54 years of age. Compared with workers in all manufacturing industries the Food & Beverage industries have a substan7ally greater propor7on of workers under the age of 35. Source: U.S. Census Bureau, Quarterly Workforce Indicators 8
9 The racial composi7on of the workforce is slightly more Black that all Manufacturing Source: U.S. Census Bureau, Quarterly Workforce Indicators 9

10 And more Hispanic Source: U.S. Census Bureau, Quarterly Workforce Indicators 10

11 The informa7on on educa7onal afainment of workers aged 25+ shows that the Food & Beverage Workforce differs from All of Manufacturing in that a lower propor7on have a Bachelor s degree or advanced degree, and a higher propor7on have less than a High School educa7on. The educa7on data do not gauge post- secondary technical training or on- the- job training and appren7ceships which we ll hear more about. These data do not dis7nguish between a person who flunked out of their freshman year of college and someone who has a 2- year technical degree. There clearly is a need for more detailed data to befer plan for workforce development. Such efforts are being made and others here likely have more insight regarding this. Source: U.S. Census Bureau, Quarterly Workforce Indicators 11

12 We ve been moving towards the pipeline for workers in Food & Beverage Manufacturing and vola7lity of the workforce. In this graph I am comparing the number of New Hires to Stable Workers in Food & Beverage Manufacturing with the propor7on in All of Manufacturing. New Hires are workers who have been hired and did not work for the employer during the previous year. This dis7nguishes New Hires from those who were on lay- off status and have been Recalled. Stable Workers are those workers who have been with the Employer for at least a year. It is temp7ng that think that New Hires + Stable Workers = Total Workers. They don t because of the dynamic nature of New Hires who may only remain employed for less than a full quarter. Therefore the number of New Hires + Stable Workers is greater than Total Workers. For every 10 Stable Workers over the course of a year, there have been almost 6 New Hires in Food & Beverage Manufacturing. Compared to 3.4 to 10 in All Manufacturing. The turnover of new employees in Food & Beverage Manufacturing is substan7ally greater than in Manufacturing in general. Source: U.S. Census Bureau, Quarterly Workforce Indicators 12
13 Foreign Born persons are an important source of workers for Food & Beverage Manufacturing. 7 out of 10 workers are na7ve born and 3 of 10 were born abroad. Source: U.S. Census Bureau, American Community Survey, Public Use Microdata. Tabula7ons by Cornell Program on Applied Demographics. 13
14 Of the na7ve born over half were born in New York State. The next most frequent birthplace is Puerto Rico, who are US Ci7zens by birth and included in the 7 of 10 na7ve born displayed in the previous slide. The border states of Pennsylvania and New Jersey come next with less than 2% of the workers, followed by California and Florida- - #1 and #3 largest states also with robust Food and Beverage Manufacturing economies. Source: U.S. Census Bureau, American Community Survey, Public Use Microdata. Tabula7ons by Cornell Program on Applied Demographics. 14

15 Recall that 3 out of 10 workers in Food and Beverage Manufacturing are foreign born. Mexico is the place of birth for most of the Foreign born. The Caribbean, Central and South America are well represented. China is a major contributor and the only country outside the Western Hemisphere. Source: U.S. Census Bureau, American Community Survey, Public Use Microdata. Tabula7ons by Cornell Program on Applied Demographics. 15
16 Source: U.S. Census Bureau, American Community Survey, Public Use Microdata. Tabula7ons by Cornell Program on Applied Demographics. 16
17 How many speak Spanish? 21,642 of 34,364 who speak another language at home speak Spanish, that is 63% 2/3rds of those Source: U.S. Census Bureau, American Community Survey, Public Use Microdata. Tabula7ons by Cornell Program on Applied Demographics. 17
18 Source: U.S. Census Bureau, American Community Survey, Public Use Microdata. Tabula7ons by Cornell Program on Applied Demographics. 18
19 Almost half the New Hires are females yet fewer than 2 out of 10 Stable Workers are females Source: U.S. Census Bureau, Quarterly Workforce Indicators 19

20 Younger workers under the age of 35 are far more common among the New Hires, while older workers over 45 years of age are approximately half the stable workforce. Source: U.S. Census Bureau, Quarterly Workforce Indicators 20
21 The differences between New Hires and Stable Workers is less than in the previous characteris7cs. That said, Blacks are a greater propor7on of the New Hires than the Stable Workers. Source: U.S. Census Bureau, Quarterly Workforce Indicators 21
22 Very slight differences for Hispanic workers. Source: U.S. Census Bureau, Quarterly Workforce Indicators 22

23 and also very small differences based on educa7onal afainment for the New Hires and Stable Workers aged 25 and older. Source: U.S. Census Bureau, Quarterly Workforce Indicators 23
24 Popula7on Persons aged 16+ who are not in the military, and not in an ins7tu7on such as a prison, mental hospital, or nursing home. This is the Civilian Non- Ins7tu7onal Popula7on aged 16+ Labor Force - comprises persons are employed full and part- 7me and persons who are ac7vely seeking employment. Labor Force Par7cipa7on Rate is the propor7on of the Popula7on who are in the Labor Force. To project the size of the Labor Force in the future, requires that we project the Popula7on and the Labor Force Par7cipa7on Rate. This is best done by breaking the popula7on into cohorts by Age and Sex. 24

25 Here is the Labor Force Par7cipa7on Rate for Females and Males by Age Group, based on the U.S. Census Bureau s American Community Survey and responses gathered over the period January 2009 through December Except in the Age Group 16 to 24, Males had higher par7cipa7on rates than females. Note that the prime working ages are 25 to 34, 35 to 44, and 45 to 54. Then as the popula7on ages the labor force par7cipa7on rate declines for males and females. Source: U.S. Census Bureau, American Community Survey, Public Use Microdata. Tabula7ons by Cornell Program on Applied Demographics. 25

26 In this slide I combine males and females and compare Labor Force Par7cipa7on Rates by Age Group between 2000 data from the long form of the decennial census and the period and data from the American Community Survey. The data are comparable although there were important differences in methods of collec7on. The Bureau of Labor Sta7s7cs reported that na7onally the Labor Force Par7cipa7on rates declined between 2000 and 2010, yet for these data the rates increased except for the youngest workers. In the midst of a recession higher propor7ons of youth enroll in post- secondary educa7on. A third source, the Census Bureau s Current Popula7on Survey, processed by the New York State Department of Labor reported a slight overall decline in the Labor Force Par7cipa7on Rate between 2000 and Which trend should we go with for projec7ons of the 2020 Workforce that is, the Total Supply of Workers from which all employers will be hiring. Source: U.S. Census Bureau, American Community Survey, Public Use Microdata. Tabula7ons by Cornell Program on Applied Demographics. U.S. Census Bureau, 2000 Census of Popula7on and Housing, Public Use Microdata Sample. Tabula7ons by Cornell Program on Applied Demographics. 26
27 For today s presenta7on, I chose to return to the Labor Force Par7cipa7on Rates reported in These are likely to be higher than other forecasts and will produce a larger poten7al Labor Force. Source: Program on Applied Demographics, Cornell University 27
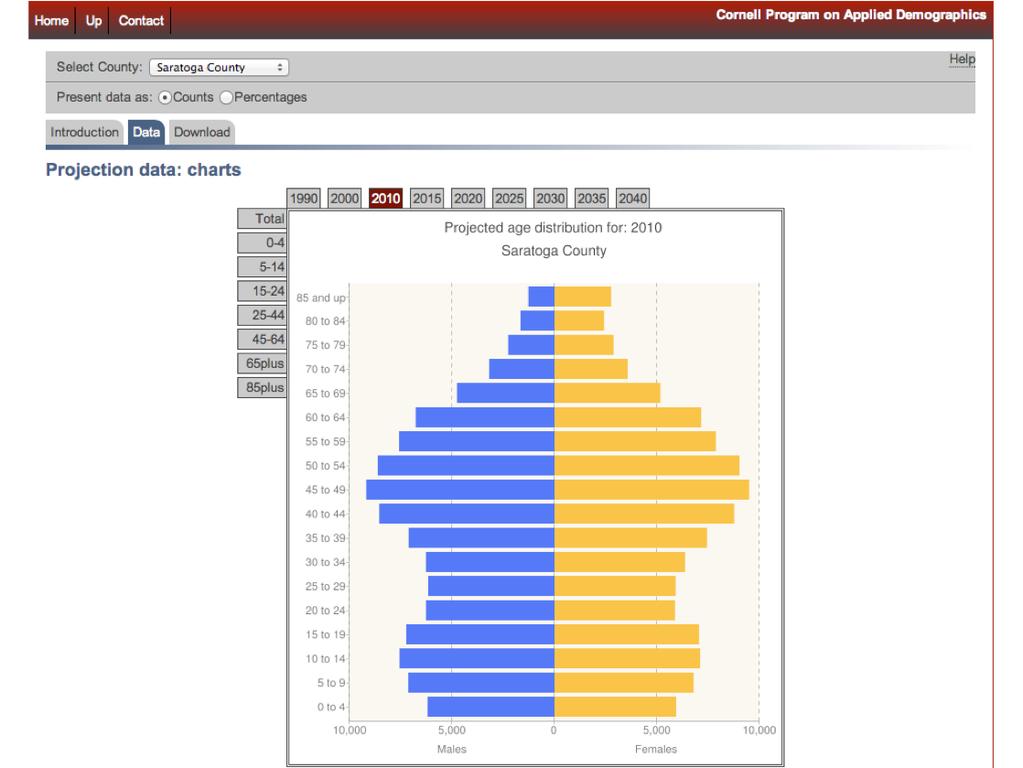
28 Turning to the Popula7on component of the projec7on of future Labor Force, here is a graph represen7ng New York State s popula7on in 2010 the most recent census of popula7on. The Male popula7on is represented by the Blue bars on the lez hand side and Females by the Gold bars on the right hand side. The popula7on is further broken out by 5- year age groups with the youngest at the bofom and the oldest at the top. Baby Boomers born 1946 to : Aged 27 to : Aged 37 to : Aged 47 to : Aged 57 to 74 Source: U.S. Census Bureau, 2010 Census of Popula7on and Housing, Summary File 1. Program on Applied Demographics, Cornell University 28

29 Source: U.S. Census Bureau, 1990 Census of Popula7on and Housing, Summary Tabula7on File 1. Program on Applied Demographics, Cornell University 29
30 Source: U.S. Census Bureau, 2000 Census of Popula7on and Housing, Summary File 1. Program on Applied Demographics, Cornell University 30

31 Source: U.S. Census Bureau, 2010 Census of Popula7on and Housing, Summary File 1. Program on Applied Demographics, Cornell University 31
32 Source: Program on Applied Demographics, Cornell University 32

33 The workforce in New York State in 2020 will be older and smaller than in previous periods. This will require a coordinated effort to more effec7vely u7lize this precious resource. Source: Program on Applied Demographics, Cornell University 33
34 34
35 35
36 36
37 37
38 38
39 39
40 40
41 41
Methodology behind the Federal Reserve Bank of Atlanta s Labor Force Participation Dynamics
 February 14, 219 Methodology behind the Federal Reserve Bank of Atlanta s Labor Force Participation Dynamics https://www.frbatlanta.org/chcs/labor-force-participation-dynamics By Ellyn Terry The methodology
Baby Boomers and Ac/ve Ageing: What is the Future for South Australia?
 Baby Boomers and Ac/ve Ageing: What is the Future for South Australia? Dr Helen Feist Ac/ng Director Australian Popula/on and Migra/on Research Centre University of Adelaide 20 th August, 2015 Who are
Labor Force Participation Rates by Age and Gender and the Age and Gender Composition of the U.S. Civilian Labor Force and Adult Population
 May 8, 2018 No. 449 Labor Force Participation Rates by Age and Gender and the Age and Gender Composition of the U.S. Civilian Labor Force and Adult Population By Craig Copeland, Employee Benefit Research
Keeping Seniors Connected to the Labor Market:
 Keeping Seniors Connected to the Labor Market: Trends, Challenges, and Benefits IPMA-HR International Training Conference October 3, 2007 Keeping Seniors Connected to the Labor Market Demographic Trends
Lecture Notes Module 1: Health Care and Health Care Policy. Slide 1: Introduc0on
 Lecture Notes Module 1: Health Care and Health Care Policy Slide 1: Introduc0on This presenta,on is intended to provide a brief introduc,on to the cri,cal issues facing the United States health care system
Demographic Trends: The 2mes they are a changin Highlights from the 2011 Census and Na2onal Household Survey
 Demographic Trends: The 2mes they are a changin Highlights from the 2011 Census and Na2onal Household Survey Dr. Doug Norris Senior Vice- President and Chief Demographer Presented to MRIA O/awa Chapter
Population & Demographic Analysis
 Population & Demographic Analysis The United States Census Bureau conducts a nationwide census every ten years. This census compiles information relating to the socio-economic characteristics of the entire
Florida Demographic In-Depth Analysis
 Florida Demographic In-Depth Analysis Taxation & Budget Reform Commission Presented by: The Florida Legislature Office of Economic and Demographic Research 850.487.1402 http://edr.state.fl.us Economy Population
Opting out of the labor force and does the unemployment rate still matter?
 Opting out of the labor force and does the unemployment rate still matter? Michael W. Horrigan, Ph.D. Associate Commissioner Office of Employment and Unemployment Statistics March 24, 2018 NAWB Pre-conference
OVERVIEW OF THE SAN DIEGO REGION Current Conditions and Future Trends
 OVERVIEW OF THE SAN DIEGO REGION Current Conditions and Future Trends Why do we need a Regional Comprehensive Plan? Let s examine the facts. It helps to look at some objective statistical information that
State of Delaware Office of Management and Budget Human Resource Management
 State of Delaware Office of Management and Budget Human Resource Management A Summary of the State of Delaware Workforce for Fiscal Year 2006 March 2007 TABLE OF CONTENTS OVERVIEW Page 3 WORKFORCE DEMOGRAPHICS
Population and Labor Force Projections for New Jersey: 2008 to 2028
 Population and Labor Force Projections for New Jersey: 2008 to 2028 by Sen-Yuan Wu, Division of Labor Market and Demographic Research Similar to other northern states, New Jersey has had slower population
Oregon Population Forecast Program Regional Forecast Meeting - September 23, 2014
 Oregon Population Forecast Program Regional Forecast Meeting - September 23, 2014 Presentation by Population Forecast Program Team CURRY COUNTY Oregon Population Forecast Program Project Team Xiaomin Ruan,
Rifle city Demographic and Economic Profile
 Rifle city Demographic and Economic Profile Community Quick Facts Population (2014) 9,289 Population Change 2010 to 2014 156 Place Median HH Income (ACS 10-14) $52,539 State Median HH Income (ACS 10-14)
MEMORANDUM. Gloria Macdonald, Jennifer Benedict Nevada Division of Health Care Financing and Policy (DHCFP)
") MEMORANDUM To: From: Re: Gloria Macdonald, Jennifer Benedict Nevada Division of Health Care Financing and Policy (DHCFP) Bob Carey, Public Consulting Group (PCG) An Overview of the in the State of Nevada
MEMORANDUM To: From: Re: Gloria Macdonald, Jennifer Benedict Nevada Division of Health Care Financing and Policy (DHCFP) Bob Carey, Public Consulting Group (PCG) An Overview of the in the State of Nevada
CRS Report for Congress Received through the CRS Web
 Order Code RL33387 CRS Report for Congress Received through the CRS Web Topics in Aging: Income of Americans Age 65 and Older, 1969 to 2004 April 21, 2006 Patrick Purcell Specialist in Social Legislation
The Province of Prince Edward Island Employment Trends and Data Poverty Reduction Action Plan Backgrounder
 The Province of Prince Edward Island Employment Trends and Data Poverty Reduction Action Plan Backgrounder 5/17/2018 www.princeedwardisland.ca/poverty-reduction $000's Poverty Reduction Action Plan Backgrounder:
Florida: Demographic Trends
 Florida: Demographic Trends September 26, 2011 Presented by: The Florida Legislature Office of Economic and Demographic Research 850.487.1402 http://edr.state.fl.us Population Growth Recovering Population
Retirement Intentions 2006
 Survey of Western Australian public sector employees 45 years and older Department of the Premier and Cabinet Government of Western Australia Survey of Western Australian public sector employees 45 years
Texas: Demographically Different
 FEDERAL RESERVE BANK OF DALLAS ISSUE 3 99 : Demographically Different A s the st century nears, demographic changes are reshaping the U.S. economy. The largest impact is coming from the maturing of baby
Utah s Long Run Demographic Trends: Evolving Community Contexts
 Utah s Long Run Demographic Trends: Evolving Community Contexts Pamela S. Perlich, Ph.D. Director, Demographic Research Kem C. Gardner Policy Institute, University of Utah GROWTH Intermountain States Population:
Women in the Labor Force: A Databook
 Cornell University ILR School DigitalCommons@ILR Federal Publications Key Workplace Documents 9-2007 Women in the Labor Force: A Databook Bureau of Labor Statistics Follow this and additional works at:
Additional Slack in the Economy: The Poor Recovery in Labor Force Participation During This Business Cycle
 No. 5 Additional Slack in the Economy: The Poor Recovery in Labor Force Participation During This Business Cycle Katharine Bradbury This public policy brief examines labor force participation rates in
2017 ECONOMIC AND WORKFORCE PROFILE Winnebago County
 2017 ECONOMIC AND WORKFORCE PROFILE Winnebago County STATE OF WISCONSIN DETI-17957-WIN-P (R. 3/2018) Percentage of Total Popula on, Ages 65 and Older Wisconsin now has more people employed and more private
Women in the Labor Force: A Databook
 Cornell University ILR School DigitalCommons@ILR Federal Publications Key Workplace Documents 2-2013 Women in the Labor Force: A Databook Bureau of Labor Statistics Follow this and additional works at:
Ravenna s most significant growth occurred before Between 1960 and 1980 the city s population declined by 8.5%.
 DRAFT Ravenna Comprehensive Plan Draft May 2008 1 A Profile of Ravenna This section examines demographic trends that will affect Ravenna. The analysis examines population and demographic dynamics, including
2017 ECONOMIC AND WORKFORCE PROFILE Walworth County
 2017 ECONOMIC AND WORKFORCE PROFILE Walworth County STATE OF WISCONSIN DETI-17957-WLW-P (R. 3/2018) Percentage of Total Popula on, Ages 65 and Older Wisconsin now has more people employed and more private
2017 ECONOMIC AND WORKFORCE PROFILE Clark County
 2017 ECONOMIC AND WORKFORCE PROFILE Clark County STATE OF WISCONSIN DETI-17957-CLK-P (R. 3/2018) Percentage of Total Popula on, Ages 65 and Older Wisconsin now has more people employed and more private
Measuring Inequality and Poverty in the United States: Challenges and Opportuni;es in the Interna;onal Context
 Measuring Inequality and Poverty in the United States: Challenges and Opportuni;es in the Interna;onal Context Trudi Renwick Assistant Division Chief Economic Characteris9cs Social, Economic and Housing
2017 ECONOMIC AND WORKFORCE PROFILE Florence County
 2017 ECONOMIC AND WORKFORCE PROFILE Florence County STATE OF WISCONSIN DETI-17957-FLO-P (R. 3/2018) Percentage of Total Popula on, Ages 65 and Older Wisconsin now has more people employed and more private
BUDGET BACKGROUNDER PLANNING FOR CALIFORNIA S FUTURE: THE STATE S POPULATION IS GROWING, AGING, AND BECOMING MORE DIVERSE.
 BUDGET BACKGROUNDER NOBVEMBER 2005 M A K I N G D O L L A R S M A K E S E N S E PLANNING FOR CALIFORNIA S FUTURE: THE STATE S POPULATION IS GROWING, AGING, AND BECOMING MORE DIVERSE Introduction California
EMPLOYEE TENURE IN 2014
 For release 10:00 a.m. (EDT) Thursday, September 18, 2014 USDL-14-1714 Technical information: (202) 691-6378 cpsinfo@bls.gov www.bls.gov/cps Media contact: (202) 691-5902 PressOffice@bls.gov EMPLOYEE TENURE
2017 ECONOMIC AND WORKFORCE PROFILE Waukesha County
 2017 ECONOMIC AND WORKFORCE PROFILE Waukesha County STATE OF WISCONSIN DETI-17957-WAK-P (R. 3/2018) Percentage of Total Popula on, Ages 65 and Older Wisconsin now has more people employed and more private
2017 ECONOMIC AND WORKFORCE PROFILE Dodge County
 2017 ECONOMIC AND WORKFORCE PROFILE Dodge County STATE OF WISCONSIN DETI-17957-DOD-P (R. 3/2018) Percentage of Total Popula on, Ages 65 and Older Wisconsin now has more people employed and more private
2000s, a trend. rates and with. workforce participation as. followed. 2015, 50 th
 Labor Force Participat tion Trends in Michigan and the United States Executive Summary Labor force participation rates in the United States have been on the gradual decline since peaking in the early 2000s,
Methods and Data for Developing Coordinated Population Forecasts
 Methods and Data for Developing Coordinated Population Forecasts Prepared by Population Research Center College of Urban and Public Affairs Portland State University March 2017 Table of Contents Introduction...
Papers presented at the ICES-III, June 18-21, 2007, Montreal, Quebec, Canada
 Future Developments In the Bureau of Labor Statistics Business Employment Dynamics Data By Kristin Fairman and Sheryl Konigsberg Division of Administrative Statistics and Labor Turnover Bureau of Labor
2017 ECONOMIC AND WORKFORCE PROFILE Washington County
 2017 ECONOMIC AND WORKFORCE PROFILE Washington County STATE OF WISCONSIN DETI-17957-WGT-P (R. 3/2018) Percentage of Total Popula on, Ages 65 and Older Wisconsin now has more people employed and more private
Women in the Labor Force: A Databook
 Cornell University ILR School DigitalCommons@ILR Federal Publications Key Workplace Documents 12-2011 Women in the Labor Force: A Databook Bureau of Labor Statistics Follow this and additional works at:
AARP WORKFORCE PROFILES:
 AARP WORKFORCE PROFILES: Selected Characteristics of U.S. Workers and Non Workers Age 40+ Michigan BACKGROUND Undoubtedly, the aging of the 77 million baby boomers those individuals born between 1946 and
AARP WORKFORCE PROFILES:
 AARP WORKFORCE PROFILES: Selected Characteristics of U.S. Workers and Non Workers Age 40+ Ohio BACKGROUND Undoubtedly, the aging of the 77 million baby boomers those individuals born between 1946 and 1964
2017 ECONOMIC AND WORKFORCE PROFILE Sauk County
 2017 ECONOMIC AND WORKFORCE PROFILE Sauk County STATE OF WISCONSIN DETI-17957-SAK-P (R. 3/2018) Percentage of Total Popula on, Ages 65 and Older Wisconsin now has more people employed and more private
Women in the Labor Force: A Databook
 Cornell University ILR School DigitalCommons@ILR Federal Publications Key Workplace Documents 12-2010 Women in the Labor Force: A Databook Bureau of Labor Statistics Follow this and additional works at:
2017 ECONOMIC AND WORKFORCE PROFILE Kewaunee County
 2017 ECONOMIC AND WORKFORCE PROFILE Kewaunee County STATE OF WISCONSIN DETI-17957-KEW-P (R. 3/2018) Percentage of Total Popula on, Ages 65 and Older Wisconsin now has more people employed and more private
Metro Houston Population Forecast
 Metro Houston Population Forecast Projections to 2050 Prepared by the Greater Houston Partnership Research Department Data from Texas Demographic Center www.houston.org April 2017 Greater Houston Partnership
Demographic Trends and the Older Workforce
 Demographic Trends and the Older Workforce November 10, 2004 Linda Barrington, Ph.D. The Conference Board www.conference-board.org THE CONFERENCE BOARD Finding solutions together Councils Conferences Symposium
WHO S LEFT TO HIRE? WORKFORCE AND UNEMPLOYMENT ANALYSIS PREPARED BY BENJAMIN FRIEDMAN JANUARY 23, 2019
 JANUARY 23, 2019 WHO S LEFT TO HIRE? WORKFORCE AND UNEMPLOYMENT ANALYSIS PREPARED BY BENJAMIN FRIEDMAN 13805 58TH STREET NORTH CLEARNWATER, FL, 33760 727-464-7332 Executive Summary: Pinellas County s unemployment
Clay County Comprehensive Plan
 2011-2021 Clay County Comprehensive Plan Chapter 1: Demographic Overview Clay County Comprehensive Plan Demographic Overview Population Trends This section examines historic and current population trends
AARP WORKFORCE PROFILES:
 AARP WORKFORCE PROFILES: Selected Characteristics of U.S. Workers and Non Workers Age 40+ West Virginia BACKGROUND Undoubtedly, the aging of the 77 million baby boomers those individuals born between 1946
People Who Are Not in the Labor Force: Why Aren't They Working?
 Cornell University ILR School DigitalCommons@ILR Federal Publications Key Workplace Documents 12-2015 People Who Are Not in the Labor Force: Why Aren't They Working? Steven F. Hipple Bureau of Labor Statistics
2017 ECONOMIC AND WORKFORCE PROFILE Vernon County
 2017 ECONOMIC AND WORKFORCE PROFILE Vernon County STATE OF WISCONSIN DETI-17957-VRN-P (R. 3/2018) Percentage of Total Popula on, Ages 65 and Older Wisconsin now has more people employed and more private
2017 ECONOMIC AND WORKFORCE PROFILE Green Lake County
 2017 ECONOMIC AND WORKFORCE PROFILE Green Lake County STATE OF WISCONSIN DETI-17957-GRL-P (R. 3/2018) Percentage of Total Popula on, Ages 65 and Older Wisconsin now has more people employed and more private
The Minneapolis Minimum Wage Increase Baseline Report
 The Minneapolis Minimum Wage Increase Baseline Report Loukas Karabarbounis, Jeremy Lise, and Anusha Nath September 13, 2018 Karabarbounis: University of Minnesota, Federal Reserve Bank of Minneapolis,
THE ECONOMY AND POPULATION OF THE SOUTHEASTERN WISCONSIN REGION
 THE ECONOMY AND POPULATION OF THE SOUTHEASTERN WISCONSIN REGION NEWSLETTER JANUARY214 The reports were developed under the guidance of the SEWRPC Advisory Committee on Regional Population and Economic
POLICY PAGE. 900 Lydia Street Austin, Texas PH: / FAX:
 POLICY PAGE Center for Public Policy Priorities 9 Lydia Street Austin, Texas 7872 PH: 512.32.222 / FAX: 512.32.227 www.cppp.org September 26 For More Information: Don Baylor, baylor@cppp.org No. 269 THE
TOP EMPLOYERS ARMY 12.2% NAVY 10.9% AIR FORCE 8.4% JUSTICE 5.9% AGRICULTURE 3.8% OTHER 18.3% CLERICAL
 Federal Workforce 2019 The federal government employs about 2 million people who provide a wide array of critical services to the American public, from defending our national security to responding to
Adults in Their Late 30s Most Concerned More Americans Worry about Financing Retirement
 1 PEW SOCIAL & DEMOGRAPHIC TRENDS Adults in Their Late 30s Most Concerned By Rich Morin and Richard Fry Despite a slowly improving economy and a three-year-old stock market rebound, Americans today are
2017 ECONOMIC AND WORKFORCE PROFILE Dane County
 2017 ECONOMIC AND WORKFORCE PROFILE Dane County STATE OF WISCONSIN DETI-17957-DAN-P (R. 3/2018) Percentage of Total Popula on, Ages 65 and Older Wisconsin now has more people employed and more private
2017 ECONOMIC AND WORKFORCE PROFILE Wood County
 2017 ECONOMIC AND WORKFORCE PROFILE Wood County STATE OF WISCONSIN DETI-17957-WOD-P (R. 3/2018) Percentage of Total Popula on, Ages 65 and Older Wisconsin now has more people employed and more private
BROWARD COUNTY LABOR FORCE
 BROWARD COUNTY LABOR FORCE Broward County s has a workforce of 978,000 people, including 54,000 self-employed. Twenty-three percent of residents commute to a job outside Broward County and five percent
Program on Applied Demographics
 Labor Force Trends in New York State: An Economic Development Region Analysis Elizabeth Womack Program on Applied Demographics Cornell University November 2017 Program on Applied Demographics http://pad.human.cornell.edu
Minnesota Energy Industry
 Energy Industry Jobs Q3 2000 Q3 2001 Q3 2002 Q3 2003 Q3 2004 Q3 2005 Q3 2006 Q3 2007 Q3 2008 Q3 2009 Q3 2010 Q3 2011 Q3 Q3 Q3 Q3 Q3 2016 Minnesota Energy Consortium April 13, 2017 Cameron Macht DEED Labor
The Health of Jefferson County: 2010 Demographic Update
 The Health of : 2010 Demographic Update BACKGROUND How people live the sociodemographic context of their lives influences their health. People who have lower incomes may not have the resources to meet
Veterans in Texas: A Demographic Study
 s in Texas: A Demographic Study Texas Workforce Investment Council December 2012 The Mission of the Texas Workforce Investment Council Assisting the Governor and the Legislature with strategic planning
Regional Prosperity Initiative: Labor Market Information Supplement
 Regional Prosperity Initiative: Labor Market Information Supplement Prepared For: (Region 6) (Genesee, Huron, Lapeer, Sanilac, Shiawassee, St. Clair, and Tuscola) Prepared By: State of Michigan Department
SPECIAL REPORT. TD Economics THE WORRISOME DECLINE IN THE U.S. PARTICIPATION RATE
 SPECIAL REPORT TD Economics THE WORRISOME DECLINE IN THE U.S. PARTICIPATION RATE Highlights The U.S. participation rate has declined significantly over the last few years, dragging the U.S. the labor force
The Labor Force Participation Puzzle
 The Labor Force Participation Puzzle May 23, 2013 by David Kelly of J.P. Morgan Funds Slow growth and mediocre job creation have been common themes used to describe the U.S. economy in recent years, as
A Summary of The Texas Challenge in the Twenty- First Century: Implications of Population Change for the Future of Texas
 A Summary of The Texas Challenge in the Twenty- First Century: Implications of Population Change for the Future of Texas The Center for Demographic and Socioeconomic Research and Education by Steve H.
NEW STATE AND REGIONAL POPULATION PROJECTIONS FOR NEW SOUTH WALES
 NEW STATE AND REGIONAL POPULATION PROJECTIONS FOR NEW SOUTH WALES Tom Wilson The New South Wales Department of Planning recently published state and regional population projections for 06 to 36. This paper
In contrast to its neighbors and to Washington County as a whole the population of Addison grew by 8.5% from 1990 to 2000.
 C. POPULATION The ultimate goal of a municipal comprehensive plan is to relate the town s future population with its economy, development and environment. Most phases and policy recommendations of this
Patterns of Unemployment
 Patterns of Unemployment By: OpenStaxCollege Let s look at how unemployment rates have changed over time and how various groups of people are affected by unemployment differently. The Historical U.S. Unemployment
2018 Trustee & Employee Diversity Update. June 2018
 2018 Trustee & Employee Diversity Update June 2018 Highlights at a Glance Established DEI Task Force & Steering Committee DEI Transparency: posted demographic data publicly Defined diversity, equity and
Shingle Creek. Minneapolis neighborhood profile. About this area. Trends in the area. Neighborhood in Minneapolis. October 2011
 neighborhood profile October 2011 About this area The neighborhood is bordered by 53rd Avenue North, Humboldt Avenue North, 49th Avenue North, and Xerxes Avenue North. It is home to Olson Middle School.
2017 ECONOMIC AND WORKFORCE PROFILE Buffalo County
 2017 ECONOMIC AND WORKFORCE PROFILE Buffalo County STATE OF WISCONSIN DETI-17957-BUF-P (R. 3/2018) Percentage of Total Popula on, Ages 65 and Older Wisconsin now has more people employed and more private
Price County DETI PRI-P P (N. 3/2016)
") Price County DETI-17957-PRI-P P (N. 3/2016) Average Household Income By County Na onal and State Economic Outlook Robust economic growth a er the Great Recession remains an cipated. The recession ended
Price County DETI-17957-PRI-P P (N. 3/2016) Average Household Income By County Na onal and State Economic Outlook Robust economic growth a er the Great Recession remains an cipated. The recession ended
Investment Company Institute and the Securities Industry Association. Equity Ownership
 Investment Company Institute and the Securities Industry Association Equity Ownership in America, 2005 Investment Company Institute and the Securities Industry Association Equity Ownership in America,
EBRI Databook on Employee Benefits Chapter 6: Employment-Based Retirement Plan Participation
 EBRI Databook on Employee Benefits Chapter 6: Employment-Based Retirement Plan Participation UPDATED July 2014 This chapter looks at the percentage of American workers who work for an employer who sponsors
Rocky Mountain ECONOMIST: Labor force participation rates have fallen sharply THE
 THE Rocky Mountain ECONOMIST: Economic information for Colorado, New Mexico and Wyoming 1 st Quarter 201 4 Effect of Aging on Labor Force Participation Rates in the Mountain States by Alison Felix, Economist
2018:IIQ Nevada Unemployment Rate Demographics Report*
 2018:IIQ Nevada Unemployment Rate Demographics Report* Department of Employment, Training & Rehabilitation Research and Analysis Bureau Don Soderberg, Director Dennis Perea, Deputy Director David Schmidt,
Burnett County DETI BNT-P (N. 3/2016)
") Burnett County DETI-17957-BNT-P (N. 3/2016) Average Household Income By County Na onal and State Economic Outlook Robust economic growth a er the Great Recession remains an cipated. The recession ended
Burnett County DETI-17957-BNT-P (N. 3/2016) Average Household Income By County Na onal and State Economic Outlook Robust economic growth a er the Great Recession remains an cipated. The recession ended
Economic Activity Index ( FAFAA-EAI ) October, November and December 2016
 October, November and December 2016") Economic Activity Index ( FAFAA-EAI ) October, November and December 2016 About the interpreta>on of the FAFAA-EAI The FAFAA-EAI is an indicator of general economic ac>vity, not a direct measurement of
Economic Activity Index ( FAFAA-EAI ) October, November and December 2016 About the interpreta>on of the FAFAA-EAI The FAFAA-EAI is an indicator of general economic ac>vity, not a direct measurement of
Sussex Demographic and Labor Market Trends
 Sussex Demographic and Labor Market Trends Ed Simon (302) 672-6845 edward.simon@state.de.us October 2012 Introduction Statistical Update Economic and labor market update for 2012 Is Sussex doing better?
Rock County Workforce Profile 2011
 Rock County Workforce Profile 2011 Proportional Population Change by Minor Civil Division 2000 2010 Source: US Census Bureau, 2000 Census and WI Dept. of Administration Demographic Services, January 2010
TECHNICAL REPORT NO. 11 (5 TH EDITION) THE POPULATION OF SOUTHEASTERN WISCONSIN PRELIMINARY DRAFT SOUTHEASTERN WISCONSIN REGIONAL PLANNING COMMISSION
 THE POPULATION OF SOUTHEASTERN WISCONSIN PRELIMINARY DRAFT SOUTHEASTERN WISCONSIN REGIONAL PLANNING COMMISSION") TECHNICAL REPORT NO. 11 (5 TH EDITION) THE POPULATION OF SOUTHEASTERN WISCONSIN PRELIMINARY DRAFT 208903 SOUTHEASTERN WISCONSIN REGIONAL PLANNING COMMISSION KRY/WJS/lgh 12/17/12 203905 SEWRPC Technical
TECHNICAL REPORT NO. 11 (5 TH EDITION) THE POPULATION OF SOUTHEASTERN WISCONSIN PRELIMINARY DRAFT 208903 SOUTHEASTERN WISCONSIN REGIONAL PLANNING COMMISSION KRY/WJS/lgh 12/17/12 203905 SEWRPC Technical
Perspectives on the Youth Labour Market in Canada
 Perspectives on the Youth Labour Market in Canada Presentation to the Financial Management Institute of Canada November 16 René Morissette Research Manager Analytical Studies Branch While unemployment
2017 ECONOMIC AND WORKFORCE PROFILE Brown County
 2017 ECONOMIC AND WORKFORCE PROFILE Brown County STATE OF WISCONSIN DETI-17957-BRW-P (R. 3/2018) Percentage of Total Popula on, Ages 65 and Older Wisconsin now has more people employed and more private
Ins&tute for Fiscal Studies
 Living standards since the recession Paul Johnson Prepared for UCL economics society, 12/11/2013 Institute for Fiscal Studies Big picture Na&onal income is s&ll below its 2007 level This is extraordinary
Charles Sturt An Overview
 Charles Sturt An Overview Evolution of the City and Moving Forward Charles Sturt is one of the oldest local government areas in the State. Our eastern boundaries border on the Adelaide city area, while
Health Insurance Coverage: 2001
 Health Insurance Coverage: 200 Consumer Income Issued September 2002 P60-220 Reversing 2 years of falling uninsured rates, the share of the population without health insurance rose in 200. An estimated
Unemployment Rates - May 2011
 June 3, 2011 DATA BRIEF: Black Employment and Unemployment in May 2011 by Sylvia Allegretto, Ary Amerikaner, and Steven Pitts The unemployment rate for Blacks was 16.2% last month. This is according to
The Relationship Between Income and Health Insurance, p. 2 Retirement Annuity and Employment-Based Pension Income, p. 7
 E B R I Notes E M P L O Y E E B E N E F I T R E S E A R C H I N S T I T U T E February 2005, Vol. 26, No. 2 The Relationship Between Income and Health Insurance, p. 2 Retirement Annuity and Employment-Based
2017:IVQ Nevada Unemployment Rate Demographics Report*
 2017:IVQ Nevada Unemployment Rate Demographics Report* Department of Employment, Training & Rehabilitation Research and Analysis Bureau Don Soderberg, Director Dennis Perea, Deputy Director David Schmidt,
WORKFORCE INVESTMENT ACT Title I-B Adults and Dislocated Workers July 2002-June 2003
 WORKFORCE INVESTMENT ACT Title I-B Adults and Dislocated Workers July 2002-June 2003 OLDER WORKER FLOWS THROUGH CORE, INTENSIVE, AND TRAINING SERVICES, AND EMPLOYMENT STATUS AND EARNINGS FIRST QUARTER
2017 ECONOMIC AND WORKFORCE PROFILE Douglas County
 2017 ECONOMIC AND WORKFORCE PROFILE Douglas County STATE OF WISCONSIN DETI-17957-DOU-P (R. 3/2018) Percentage of Total Popula on, Ages 65 and Older Wisconsin now has more people employed and more private
Transitions. Population and Economic Trends for Colorado and Garfield County
 Transitions Population and Economic Trends for Colorado and Garfield County Elizabeth Garner State Demography Office Colorado Department of Local Affairs Summer 2016 www.colorado.gov/demography Main Points
Enhancing Economic Security for the Latino Community
 Enhancing Economic Security for the Latino Community March 21, 2012 Presented at a Symposium Honoring the Center for Policy Research on Aging s 15 th Anniversary Aging in a Minority-Majority Nation: Interracial
2017:IIIQ Nevada Unemployment Rate Demographics Report*
 2017:IIIQ Nevada Unemployment Rate Demographics Report* Department of Employment, Training & Rehabilitation Research and Analysis Bureau Don Soderberg, Director Dennis Perea, Deputy Director Bill Anderson,
2017 ECONOMIC AND WORKFORCE PROFILE Grant County
 2017 ECONOMIC AND WORKFORCE PROFILE Grant County STATE OF WISCONSIN DETI-17957-GRT-P (R. 3/2018) Percentage of Total Popula on, Ages 65 and Older Wisconsin now has more people employed and more private
Economics. Unemployment. Labor Force Statistics. In this chapter, look for the answers to these questions: N. Gregory Mankiw
 C H A P T E R 28 Unemployment P R I N C I P L E S O F Economics N. Gregory Mankiw Premium PowerPoint Slides by Ron Cronovich 2009 South-Western, a part of Cengage Learning, all rights reserved In this
University of Minnesota
 neighborhood profile October 2011 About this area The University neighborhood is bordered by 11th Avenue Southeast, University Avenue, 15th Avenue Southeast, the railroad tracks, Oak Street, and the Mississippi