2017 ECONOMIC AND WORKFORCE PROFILE Sauk County
|
|
|
- Julian Snow
- 6 years ago
- Views:
Transcription


1 2017 ECONOMIC AND WORKFORCE PROFILE Sauk County STATE OF WISCONSIN DETI SAK-P (R. 3/2018)

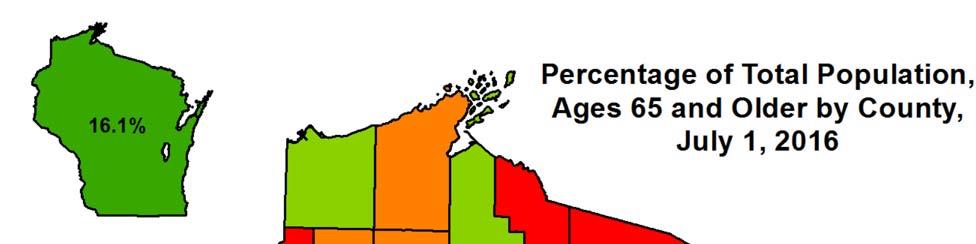
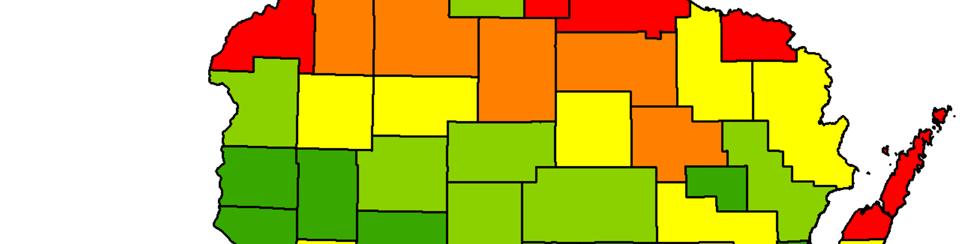
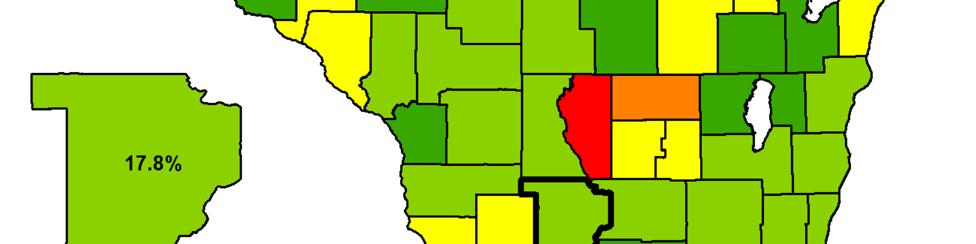
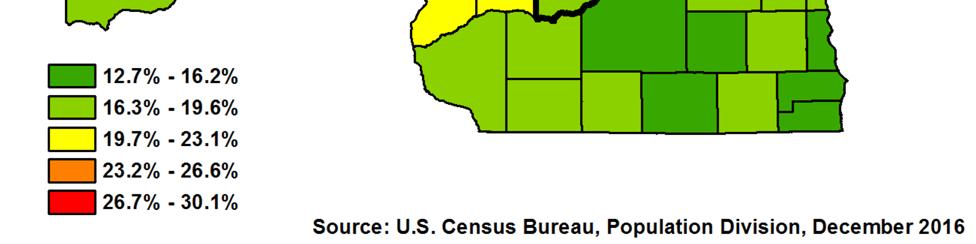
2 Percentage of Total Popula on, Ages 65 and Older
3 Wisconsin now has more people employed and more private sector jobs than at any me in its history. As of this wri ng, the state added 56,100 jobs during 2016 and Employment increased in almost all industry sectors, with prominent gains in construc on, manufacturing, and healthcare. Wisconsin s unemployment rate is near lows not seen in a genera on, decreasing from 4.3 percent in January 2016 to 3.2 percent in December 2017, on a seasonally adjusted basis. Wisconsin faces a worker quan ty challenge. The number of re ring Baby Boomers nearly match the influx of new workers, resul ng in a slow growing workforce and placing constraints on the ability by employers across all industries to hire talent. Many businesses report that the lack of available workers has hindered expansion and, in some cases, even curtailed their ability to meet current product orders. The blue line, orange line graph to the right illustrates the situa on in Wisconsin and other upper Midwest states. While Wisconsin's popula on will con nue to grow over the next twenty years, the workforce faces serious constraints. The labor force par cipa on rate (LFPR), defined as the labor force (sum of employed and unemployed) divided by the total popula on ages 16 and older, measures the popula on's engagement in the workforce and serves as an indicator in determining how Wisconsin's workforce will be constrained. The overall LFPR peaked in the late 1990s and has been trending lower ever since. The LFPR of peaks across Source: Local Area Unemployment Sta s cs, Bureau of Labor Sta s cs the age cohort at over ninety percent and decreases rapidly into the single digits by age seventy. Baby Boomers have and con nue to exit with respect to their LFPR. The mass of Baby Boomers has moved into the work lifecycle stage of declining LFPRs, with the tail end of the cohort turning 55 in Source: Bureau of Labor Sta s cs A recent development is the change in the labor force par cipa on rate trend. The LFPR of older workers (those aged 55 years and older) has turned upwards, resul ng in fla ening of the overall LFPR. More boomers are staying in the workforce longer, which may portend higher workforce growth over the coming years. Due to the size of the Baby Boomer cohort and the sensi vity of the LFPR to workforce growth rates, a rela vely small change in the LFPR of older workers would significantly boost the number in the workforce. 1


4 Popula on and Demographics Source: Demographic Services Center, Wisconsin Department of Administra on Sauk County added an estimated 211 residents from April 2010 to January With 62,187 people, Sauk County is the 25 th most populous county in Wisconsin out of 72 counties. Sauk County's 0.3% population growth rate over the period is smaller than Wisconsin's (1.5%) and the United States' (4.8%) growth rates. Population change is driven by two factors: natural change and migration. A natural increase of the population occurs when there are more births than deaths, while an increase from migration arises when more people enter than exit. Sauk County's growth comes from natural increase (1.6%); it experienced negative net migration ( 1.3%). Sauk County s natural increase rate is similar to the state's and is lower than the nation's 2.8% increase. The county s negative net migration rate is lower than the state s negative rate of 0.3% and the United States' positive 1.9% Components of Popula on Change rate. The table above lists Sauk County s ten most populous municipalities as of January Interestingly, the Town of Dellona is the only one not on the Baraboo or Wisconsin River. Only two of the ten shown decreased in population over the period, one being the largest city, Baraboo. The city that added the most residents is Reedsburg (103). The municipalities that make up the top ten are geographically spread throughout Sauk County. The graph on the following page shows monthly unemployment rates for Sauk County, Wisconsin and the U.S. since January Sauk County s rate Source: Demographic Services Center, Wisconsin Department of Administra on 2
5 Labor Force Dynamics rose through Source: Local Area Unemployment Sta s cs, Bureau of Labor Sta s cs the early 2000s recession, then declined slightly for a few years, and then rose minimally ahead of the Great Recession. Amidst the recession, Sauk County's unemployment rate peaked at 11.0% in February 2010, posting similar values to both the state and nation. Post recession, Sauk's unemployment rate has consistently tracked below the nation's rate. The same is true for its relationship to the state since mid The recovery period has seen Sauk County's not seasonally adjusted unemployment rate drop all the way down to 2.5% in May The chart to the left breaks down the labor force of Sauk County into its two components: employed and unemployed. Since 2010, the number of employed year overyear increased every year except 2012 and The number of unemployed has decreased every year. The labor force in aggregate decreased every year except 2011 and Source: Local Area Unemployment Sta s cs, Bureau of Labor Sta s cs Sauk County's five largest job sectors in 2016 were Leisure and Hospitality; Trade, Transportation, and Utilities; Manufacturing; Education and Health; and Public Administra 3
6 Industry Employment and Wages tion. It is home to several waterpark resorts. Leisure and Hospitality comprised 22% of Sauk County's total jobs and Manufacturing 22% of total payroll. Many sectors lost net jobs from 2015; Professional and Business Services added the most (131). Not all employment is covered by the Quarterly Census of Employment and Wages (QCEW) program; notable exclusions include unincorporated self employed and small agricultural employers. Sauk County s annual average wage of $36,791 in 2016 is about 20% lower than the statewide average of $46,031 and is a 1.4% increase from Sauk County s highest paying sector in 2016 was Construction, with an annual average wage of $56,799. The next highest paying sectors were Financial Activities ($54,940), Professional and Business Services ($48,835), Manufacturing ($48,731), and Education and Health ($43,772). Leisure and Hospitality and Natural Resources are the two sectors that have annual aver age wages above the statewide average. Despite this, Leisure and Hospitality is the lowest paying of Sauk County's sectors. It should be noted that the QCEW does not factor in full or part time sta tus when annual average wag es are calculated, so the high prevalence of part time work ers in Leisure and Hospitality 4
7 Employment Projec ons contributes to making this number not representative of the wage to be expected for a full time worker. The table above presents ten year regional employment projections by industry sector for the South Central Workforce Development Area (WDA), which includes Columbia, Dane, Dodge, Jefferson, Marquette, and Sauk Counties. The change in the number of jobs from 2014 to 2024 represents projected net job growth over the period. In 2016, Dane County had the lion's share of the region s jobs (72%). Sauk and Dodge had nearly 8% each, Jefferson 7%, Columbia almost 5%, and Marquette less than 1%. Ten year regional employment growth of 8% is projected to exceed statewide job growth of 6% with South Central experiencing average annual growth of around 0.8% or 4,200 jobs per year. All South Central WDA sectors are projected to have net positive job growth over the ten year period. Education and Health Services is projected to contribute about 26% to total net job growth, followed by Professional and Business Services (15%), Leisure and Hospitality (12%), Information (12%), and Trade, Transportation, and Utilities (8%). The expansion of the Information sector is expected to continue with massive growth of 35%. Other double digit projected growth sectors are Construction (15%), Professional and Business Services (11%), and Leisure and Hospitality (11%). Looking across the state, the South Central WDA has a larger projected job growth from than any of the other ten WDAs in both numeric and percentage terms. The Informa on sector is projected to grow in only two of Wisconsin's 11 WDAs: South Central and North Central. Sub sectors within Informa on range from So ware Publishers to Newspaper and Book Publishers; this may help to explain the varying statewide performances. South Central is one of four WDAs projected to have double digit growth in Construc on, with the others being Waukesha Ozaukee Washington (WOW), West Central, and Western. Leisure and Hospitality growth in South Central ranks 2 nd (Southeast) and Professional and Business Services growth ranks 3 rd (West Central, WOW). 5
8 Employment ProjecƟons Source: Office of Economic Advisors, Wisconsin Department of Workforce Development, September 2015 The table above shows projected job growth and openings by occupational group through 2024 for the South Central WDA. Like industries, all occupational groups are projected to grow. Rates range from Computer and Mathematical (26%) to Office and Administrative Support and Farming, Fishing, and Forestry (1%). An aging workforce and employee turnover contributes to the finding that a projected 73% of total annual average open ings come from replacement needs; the remaining 27% come from new jobs (growth openings). South Central's growth share of openings is the highest among the 11 WDAs. Two occupational groups in South Central are pro jected to have more growth openings than replacement, Computer and Mathematical and Personal Care and Service. The occupational group projected to add the most jobs over the period in South Central is Computer and Mathe matical (5,768 jobs), followed by Food Preparation and Serving (4,543 jobs) and Personal Care and Service (4,531 jobs). Food Preparation and Serving is expected to have the most annual openings (1,857), followed by Office and Administrative Support (1,762) and Sales and Related (1,558). Of these openings across the three groups, almost 82% of them are of the replacement variety. The occupational group with the least amount of projected annual average openings is Legal (78), with Farming, Fishing, and Forestry (230) and Community and Social Ser vice (232) having more. Annual average openings as a share of projected 2024 employment ranges from 2% to 6


9 4.5% for all occupational groups. The chart above provides a visual breakdown of the ages of workers by industry in the South Central WDA. As can be seen, considerable age variation exists across industries. The industry with the greatest share of workers under age 25 by a considerable margin is Leisure and Hospitality, with 36.1% of workers not yet a quarter century old. This is significantly larger than the All Industries under age 25 share of 13.8%. Leisure and Hospitality in all WDAs across the state is the industry that has the highest share of workers under 25. High school and college students commonly work in restaurants and hotels. An incredible four out of ten workers in Information in South Central are age and 62.4% are under 35. The next highest share for Information under age 35 is 36.2% (West Central). The wide ranging sub sector composition within Information was referenced earlier in this report. Except for Leisure and Hospitality, all South Central industries have 56% to 72% of their workers age This age range is considered the "prime age" of labor force participation. The industry with the highest share of workers age 55 and over is Public Administration, with nearly three in ten workers at or above what some consider a traditional retirement age. Next is Natural Resources with 27.8% and Manufacturing with 25.3%. The baby boomer exodus from the workforce will affect these industries particularly hard, though recent data shows older Americans are working longer into their golden years. South Central has the 2 nd lowest share of its workforce age 55 and over (22.2%), with only Milwaukee County lower (22.0%); the Northwest WDA has the highest share of older workers (28.8%). For More Informa on: Tom Pethan Regional Economist South Central WDA Phone: (608) tom.pethan@dwd.wisconsin.gov 7
2017 ECONOMIC AND WORKFORCE PROFILE Dodge County
 2017 ECONOMIC AND WORKFORCE PROFILE Dodge County STATE OF WISCONSIN DETI-17957-DOD-P (R. 3/2018) Percentage of Total Popula on, Ages 65 and Older Wisconsin now has more people employed and more private
2017 ECONOMIC AND WORKFORCE PROFILE Dane County
 2017 ECONOMIC AND WORKFORCE PROFILE Dane County STATE OF WISCONSIN DETI-17957-DAN-P (R. 3/2018) Percentage of Total Popula on, Ages 65 and Older Wisconsin now has more people employed and more private
2017 ECONOMIC AND WORKFORCE PROFILE Waukesha County
 2017 ECONOMIC AND WORKFORCE PROFILE Waukesha County STATE OF WISCONSIN DETI-17957-WAK-P (R. 3/2018) Percentage of Total Popula on, Ages 65 and Older Wisconsin now has more people employed and more private
2017 ECONOMIC AND WORKFORCE PROFILE Douglas County
 2017 ECONOMIC AND WORKFORCE PROFILE Douglas County STATE OF WISCONSIN DETI-17957-DOU-P (R. 3/2018) Percentage of Total Popula on, Ages 65 and Older Wisconsin now has more people employed and more private
2017 ECONOMIC AND WORKFORCE PROFILE Washington County
 2017 ECONOMIC AND WORKFORCE PROFILE Washington County STATE OF WISCONSIN DETI-17957-WGT-P (R. 3/2018) Percentage of Total Popula on, Ages 65 and Older Wisconsin now has more people employed and more private
2017 ECONOMIC AND WORKFORCE PROFILE Walworth County
 2017 ECONOMIC AND WORKFORCE PROFILE Walworth County STATE OF WISCONSIN DETI-17957-WLW-P (R. 3/2018) Percentage of Total Popula on, Ages 65 and Older Wisconsin now has more people employed and more private
2017 ECONOMIC AND WORKFORCE PROFILE Kewaunee County
 2017 ECONOMIC AND WORKFORCE PROFILE Kewaunee County STATE OF WISCONSIN DETI-17957-KEW-P (R. 3/2018) Percentage of Total Popula on, Ages 65 and Older Wisconsin now has more people employed and more private
2017 ECONOMIC AND WORKFORCE PROFILE Winnebago County
 2017 ECONOMIC AND WORKFORCE PROFILE Winnebago County STATE OF WISCONSIN DETI-17957-WIN-P (R. 3/2018) Percentage of Total Popula on, Ages 65 and Older Wisconsin now has more people employed and more private
2017 ECONOMIC AND WORKFORCE PROFILE Brown County
 2017 ECONOMIC AND WORKFORCE PROFILE Brown County STATE OF WISCONSIN DETI-17957-BRW-P (R. 3/2018) Percentage of Total Popula on, Ages 65 and Older Wisconsin now has more people employed and more private
2017 ECONOMIC AND WORKFORCE PROFILE Grant County
 2017 ECONOMIC AND WORKFORCE PROFILE Grant County STATE OF WISCONSIN DETI-17957-GRT-P (R. 3/2018) Percentage of Total Popula on, Ages 65 and Older Wisconsin now has more people employed and more private
2017 ECONOMIC AND WORKFORCE PROFILE Florence County
 2017 ECONOMIC AND WORKFORCE PROFILE Florence County STATE OF WISCONSIN DETI-17957-FLO-P (R. 3/2018) Percentage of Total Popula on, Ages 65 and Older Wisconsin now has more people employed and more private
2017 ECONOMIC AND WORKFORCE PROFILE Monroe County
 2017 ECONOMIC AND WORKFORCE PROFILE Monroe County STATE OF WISCONSIN DETI-17957-MON-P (R. 3/2018) Percentage of Total Popula on, Ages 65 and Older Wisconsin now has more people employed and more private
2017 ECONOMIC AND WORKFORCE PROFILE Green Lake County
 2017 ECONOMIC AND WORKFORCE PROFILE Green Lake County STATE OF WISCONSIN DETI-17957-GRL-P (R. 3/2018) Percentage of Total Popula on, Ages 65 and Older Wisconsin now has more people employed and more private
2017 ECONOMIC AND WORKFORCE PROFILE Buffalo County
 2017 ECONOMIC AND WORKFORCE PROFILE Buffalo County STATE OF WISCONSIN DETI-17957-BUF-P (R. 3/2018) Percentage of Total Popula on, Ages 65 and Older Wisconsin now has more people employed and more private
2017 ECONOMIC AND WORKFORCE PROFILE Wood County
 2017 ECONOMIC AND WORKFORCE PROFILE Wood County STATE OF WISCONSIN DETI-17957-WOD-P (R. 3/2018) Percentage of Total Popula on, Ages 65 and Older Wisconsin now has more people employed and more private
2017 ECONOMIC AND WORKFORCE PROFILE Vernon County
 2017 ECONOMIC AND WORKFORCE PROFILE Vernon County STATE OF WISCONSIN DETI-17957-VRN-P (R. 3/2018) Percentage of Total Popula on, Ages 65 and Older Wisconsin now has more people employed and more private
2017 ECONOMIC AND WORKFORCE PROFILE Clark County
 2017 ECONOMIC AND WORKFORCE PROFILE Clark County STATE OF WISCONSIN DETI-17957-CLK-P (R. 3/2018) Percentage of Total Popula on, Ages 65 and Older Wisconsin now has more people employed and more private
2017 ECONOMIC AND WORKFORCE PROFILE Pierce County
 2017 ECONOMIC AND WORKFORCE PROFILE Pierce County STATE OF WISCONSIN DETI-17957-PRC-P (R. 3/2018) Percentage of Total Popula on, Ages 65 and Older Wisconsin now has more people employed and more private
2017 ECONOMIC AND WORKFORCE PROFILE St. Croix County
 2017 ECONOMIC AND WORKFORCE PROFILE St. Croix County STATE OF WISCONSIN DETI-17957-STC-P (R. 3/2018) Percentage of Total Popula on, Ages 65 and Older Wisconsin now has more people employed and more private
2017 ECONOMIC AND WORKFORCE PROFILE Barron County
 2017 ECONOMIC AND WORKFORCE PROFILE Barron County STATE OF WISCONSIN DETI-17957-BRN-P (R. 3/2018) Percentage of Total Popula on, Ages 65 and Older Wisconsin now has more people employed and more private
2017 ECONOMIC AND WORKFORCE PROFILE Chippewa County
 2017 ECONOMIC AND WORKFORCE PROFILE Chippewa County STATE OF WISCONSIN DETI-17957-CHP-P (R. 3/2018) Percentage of Total Popula on, Ages 65 and Older Wisconsin now has more people employed and more private
Columbia County DETI COL-P (N. 3/2016)
") Columbia County DETI-17957-COL-P (N. 3/2016) Average Household Income By County Na onal and State Economic Outlook Robust economic growth a er the Great Recession remains an cipated. The recession ended
Columbia County DETI-17957-COL-P (N. 3/2016) Average Household Income By County Na onal and State Economic Outlook Robust economic growth a er the Great Recession remains an cipated. The recession ended
Dane County DETI DAN-P DAN (N. 3/2016)
") Dane County DETI-17957-DAN-P DAN (N. 3/2016) Average Household Income By County Na onal and State Economic Outlook Robust economic growth a er the Great Recession remains an cipated. The recession ended
Dane County DETI-17957-DAN-P DAN (N. 3/2016) Average Household Income By County Na onal and State Economic Outlook Robust economic growth a er the Great Recession remains an cipated. The recession ended
Burnett County DETI BNT-P (N. 3/2016)
") Burnett County DETI-17957-BNT-P (N. 3/2016) Average Household Income By County Na onal and State Economic Outlook Robust economic growth a er the Great Recession remains an cipated. The recession ended
Burnett County DETI-17957-BNT-P (N. 3/2016) Average Household Income By County Na onal and State Economic Outlook Robust economic growth a er the Great Recession remains an cipated. The recession ended
Price County DETI PRI-P P (N. 3/2016)
") Price County DETI-17957-PRI-P P (N. 3/2016) Average Household Income By County Na onal and State Economic Outlook Robust economic growth a er the Great Recession remains an cipated. The recession ended
Price County DETI-17957-PRI-P P (N. 3/2016) Average Household Income By County Na onal and State Economic Outlook Robust economic growth a er the Great Recession remains an cipated. The recession ended
Racine County DETI RAC-P (N. 3/2016)
") Racine County DETI-17957-RAC-P (N. 3/2016) Average Household Income By County Na onal and State Economic Outlook Robust economic growth a er the Great Recession remains an cipated. The recession ended
Racine County DETI-17957-RAC-P (N. 3/2016) Average Household Income By County Na onal and State Economic Outlook Robust economic growth a er the Great Recession remains an cipated. The recession ended
Kenosha County DETI KEN-P (N. 3/2016)
") Kenosha County DETI-17957-KEN-P (N. 3/2016) Average Household Income By County Na onal and State Economic Outlook Robust economic growth a er the Great Recession remains an cipated. The recession ended
Kenosha County DETI-17957-KEN-P (N. 3/2016) Average Household Income By County Na onal and State Economic Outlook Robust economic growth a er the Great Recession remains an cipated. The recession ended
Rock County DETI RCK-P (N. 3/2016)
") Rock County DETI-17957-RCK-P (N. 3/2016) 2015 Rock County Economic and Workforce Profile Na onal and State Economic Outlook Robust economic growth a er the Great Recession remains an cipated. The recession
Rock County DETI-17957-RCK-P (N. 3/2016) 2015 Rock County Economic and Workforce Profile Na onal and State Economic Outlook Robust economic growth a er the Great Recession remains an cipated. The recession
Jackson County DETI JAK-P (N. 3/2016)
") Jackson County DETI-17957-JAK-P (N. 3/2016) 2015 Jackson County Economic and Workforce Profile Na onal and State Economic Outlook Robust economic growth a er the Great Recession remains an cipated. The
Jackson County DETI-17957-JAK-P (N. 3/2016) 2015 Jackson County Economic and Workforce Profile Na onal and State Economic Outlook Robust economic growth a er the Great Recession remains an cipated. The
Outagamie County DETI OUT-P (N. 3/2016)
") Outagamie County DETI-17957-OUT-P (N. 3/2016) Average Household Income By County Na onal and State Economic Outlook Robust economic growth a er the Great Recession remains an cipated. The recession ended
Outagamie County DETI-17957-OUT-P (N. 3/2016) Average Household Income By County Na onal and State Economic Outlook Robust economic growth a er the Great Recession remains an cipated. The recession ended
Eau Claire County DETI ECL-P ECL (N. 3/2016)
") Eau Claire County DETI-17957-ECL-P ECL (N. 3/2016) Average Household Income By County Na onal and State Economic Outlook Robust economic growth a er the Great Recession remains an cipated. The recession
Eau Claire County DETI-17957-ECL-P ECL (N. 3/2016) Average Household Income By County Na onal and State Economic Outlook Robust economic growth a er the Great Recession remains an cipated. The recession
Environmental Justice Task Force
 Attachment 5 Year 2050 Population and Economic Forecasts #211068v1 Environmental Justice Task Force April 16, 2013 1 Introduction Population and economic projections serve as a basis for updating the regional
Burnett County Workforce Profile
 Percentage of working-age population aged 60 years and older in 2020 23.2% - 30.0% 30.1% - 40.0% 40.1% - 49.3% State average 29.4% Office of Economic Advisors OEA-10599-P Beverly Gehrke 15618 Windrose
County Economic Profile Lee County, MS extension.msstate.edu/economic profiles
 County Economic Profile Lee County, MS extension.msstate.edu/economic profiles Demographics* Lee Mississippi United States Total Popula on, 2017 (Popula on Es mates) 84,933 2,984,100 325,719,178 Percent
Community and Economic Development
 192 193 194 195 196 197 198 199 2 21 22 23 24 2-1 Lycoming County Comprehensive Plan Update 218 Community and Economic Development At a Glance Over the last ten years, has experienced a decline in population,
Papers presented at the ICES-III, June 18-21, 2007, Montreal, Quebec, Canada
 Future Developments In the Bureau of Labor Statistics Business Employment Dynamics Data By Kristin Fairman and Sheryl Konigsberg Division of Administrative Statistics and Labor Turnover Bureau of Labor
County Economic Profile Copiah County, MS extension.msstate.edu/economic profiles
 County Economic Profile Copiah County, MS extension.msstate.edu/economic profiles Demographics* Copiah Mississippi United States Total Popula on, 2017 (Popula on Es mates) 28,516 2,984,100 325,719,178
County Economic Profile Jasper County, MS extension.msstate.edu/economic profiles
 County Economic Profile Jasper County, MS extension.msstate.edu/economic profiles Demographics* Jasper Mississippi United States Total Popula on, 2017 (Popula on Es mates) 16,582 2,984,100 325,719,178
County Economic Profile Marion County, MS extension.msstate.edu/economic profiles
 County Economic Profile Marion County, MS extension.msstate.edu/economic profiles Demographics* Marion Mississippi United States Total Popula on, 2017 (Popula on Es mates) 25,069 2,984,100 325,719,178
County Economic Profile Leflore County, MS extension.msstate.edu/economic profiles
 County Economic Profile Leflore County, MS extension.msstate.edu/economic profiles Demographics* Leflore Mississippi United States Total Popula on, 2017 (Popula on Es mates) 29,223 2,984,100 325,719,178
County Economic Profile Monroe County, MS extension.msstate.edu/economic profiles
 County Economic Profile Monroe County, MS extension.msstate.edu/economic profiles Demographics* Monroe Mississippi United States Total Popula on, 2017 (Popula on Es mates) 35,872 2,984,100 325,719,178
Marshall & Lyon County Economic Update
 Marshall & Lyon County Economic Update Cameron Macht, Regional Analyst Minnesota Department of Employment and Economic Development 320-231-5174 ext. 7535 cameron.macht@state.mn.us www.deed.state.mn.us/lmi
County Economic Profile Tunica County, MS extension.msstate.edu/economic profiles
 County Economic Profile Tunica County, MS extension.msstate.edu/economic profiles Demographics* Tunica Mississippi United States Total Popula on, 2017 (Popula on Es mates) 10,024 2,984,100 325,719,178
County Economic Profile Coahoma County, MS extension.msstate.edu/economic profiles
 County Economic Profile Coahoma County, MS extension.msstate.edu/economic profiles Demographics* Coahoma Mississippi United States Total Popula on, 2017 (Popula on Es mates) 23,154 2,984,100 325,719,178
County Economic Profile Bolivar County, MS extension.msstate.edu/economic profiles
 County Economic Profile Bolivar County, MS extension.msstate.edu/economic profiles Demographics* Bolivar Mississippi United States Total Popula on, 2017 (Popula on Es mates) 31,945 2,984,100 325,719,178
County Economic Profile Lamar County, MS extension.msstate.edu/economic profiles
 County Economic Profile Lamar County, MS extension.msstate.edu/economic profiles Demographics* Lamar Mississippi United States Total Popula on, 2017 (Popula on Es mates) 61,374 2,984,100 325,719,178 Percent
County Economic Profile Clarke County, MS extension.msstate.edu/economic profiles
 County Economic Profile Clarke County, MS extension.msstate.edu/economic profiles Demographics* Clarke Mississippi United States Total Popula on, 2017 (Popula on Es mates) 15,828 2,984,100 325,719,178
2. Demographics. Population and Households
 2. Demographics This analysis describes the existing demographics in. It will be used to identify the major demographic trends that may have an effect on public policy in in the next decade. Demographic
Economy Overview. Eagle County, CO. Emsi Q Data Set
 Eagle County, CO Emsi Q4 2018 Data Set www.economicmodeling.com Contents. Economy........ Overview......................................................................................... 1... Historic.......&..
County Economic Profile Smith County, MS extension.msstate.edu/economic profiles
 County Economic Profile Smith County, MS extension.msstate.edu/economic profiles Demographics* Smith Mississippi United States Total Popula on, 2017 (Popula on Es mates) 16,078 2,984,100 325,719,178 Percent
Rock County Workforce Profile 2011
 Rock County Workforce Profile 2011 Proportional Population Change by Minor Civil Division 2000 2010 Source: US Census Bureau, 2000 Census and WI Dept. of Administration Demographic Services, January 2010
NEWS RELEASE For further information contact Economic Research Director Bret Mayborne,
 Metropolitan Milwaukee Association of Commerce NEWS RELEASE For further information contact Economic Research Director Bret Mayborne, 414.287.4122 2018 Review & Latest Monthly Economic Trends February
Economy Overview. Summit County, CO. Emsi Q Data Set
 Summit County, CO Emsi Q4 2018 Data Set www.economicmodeling.com Contents. Economy........ Overview......................................................................................... 1... Historic.......&..
La Crosse County, WI
 La Crosse County, WI Mississippi River Regional Planning Commission 1707 Main Street, Suite 435 La Crosse, Wisconsin 54601 Emsi Q4 2018 Data Set www.economicmodeling.com Contents. Economy........ Overview.........................................................................................
THE RHODE ISLAND ECONOMIC OUTLOOK AND FORECAST: MATCHING SKILLS TO JOBS
 THE RHODE ISLAND ECONOMIC OUTLOOK AND FORECAST: MATCHING SKILLS TO JOBS Through April of 2012, Rhode Island continued to have the second highest unemployment rate in the United States with 62,178 people
Massachusetts Outlook,
 Massachusetts Outlook, 2016-2020 Highlights The state s economic growth will be pulled by two forces in opposite directions. Constraining growth will be a slower increase in the availability of workers
Economy Overview. Pitkin County, CO. Emsi Q Data Set
 Pitkin County, CO Emsi Q4 2018 Data Set www.economicmodeling.com Contents. Economy........ Overview......................................................................................... 1... Historic.......&..
BROWARD COUNTY LABOR FORCE
 BROWARD COUNTY LABOR FORCE Broward County s has a workforce of 978,000 people, including 54,000 self-employed. Twenty-three percent of residents commute to a job outside Broward County and five percent
Regional Economics 6-1. Northwest Regional Comprehensive Plan Regional Economics
 Regional Economics Northwest Regional Economy Economic information specifically for the Northwest Region of Wisconsin is provided in this chapter. The following data and related analysis addresses population,
Guernsey Economic Overview
 Guernsey Economic Overview Issue date: 19 May 17 The Guernsey Economic Overview brings together the most recent official Guernsey sta s cs and provides an overview of economic condi ons in Guernsey and
Colorado and Eagle County
 Colorado and Eagle County Population and Economic Transitions Vail Symposium 2017 Elizabeth Garner State Demography Office Colorado Department of Local Affairs Demography.dola.colorado.gov Ideas Demographics
14 Coun es. Economy Overview. West Virginia Department of Commerce Capitol Complex, Bldg. 6, Room 525 Charleston, West Virginia 25305
 14 Coun es West Virginia Department of Commerce Capitol Complex, Bldg. 6, Room 525 Charleston, West Virginia 25305 Emsi Q4 2018 Data Set www.economicmodeling.com Contents. Economy........ Overview.........................................................................................
Outlook for the Wisconsin Economy. Noah Williams
 An Noah University of Wisconsin-Madison Center for Research On the Wisconsin Economy (CROWE) https://crowe.wisc.edu CROWE: Brief Introduction Center for Research on the Wisconsin Economy (CROWE) recently
My name is Don Meseck, Regional Labor Economist, assigned to the Labor Market and Performance Analysis Branch (LMPA), Washington State Employment
, Washington State Employment") My name is Don Meseck, Regional Labor Economist, assigned to the Labor Market and Performance Analysis Branch (LMPA), Washington State Employment Security Department. I provide economic analysis services
My name is Don Meseck, Regional Labor Economist, assigned to the Labor Market and Performance Analysis Branch (LMPA), Washington State Employment Security Department. I provide economic analysis services
O awa County, MI. Economy Overview. Michigan Economic Development Corpora on. 300 N. Washington Square, Lower Level Lansing, Michigan 48913
 O awa County, MI Michigan Economic Development Corpora on 300 N. Washington Square, Lower Level Lansing, Michigan 48913 Emsi Q4 2018 Data Set www.economicmodeling.com Contents. Economy........ Overview.........................................................................................
New Bru nswick Regiona l Prof i les H IGHLIGHTS AN D U PDATES. Northeast Economic Region
 New Bru nswick Regiona l Prof i les H IGHLIGHTS AN D U PDATES Northeast Economic Region New Brunswick Regional Profiles: Highlights and Updates Northeast Economic Region Province of New Brunswick PO 6000,
Regional Prosperity Initiative: Labor Market Information Supplement
 Regional Prosperity Initiative: Labor Market Information Supplement Prepared For: (Region 6) (Genesee, Huron, Lapeer, Sanilac, Shiawassee, St. Clair, and Tuscola) Prepared By: State of Michigan Department
The Province of Prince Edward Island Employment Trends and Data Poverty Reduction Action Plan Backgrounder
 The Province of Prince Edward Island Employment Trends and Data Poverty Reduction Action Plan Backgrounder 5/17/2018 www.princeedwardisland.ca/poverty-reduction $000's Poverty Reduction Action Plan Backgrounder:
PROPERTY VALUES AND TAXES IN SOUTHEAST WISCONSIN
 PROPERTY VALUES AND TAXES IN SOUTHEAST WISCONSIN September 2017 Rob Henken, President Maddie Keyes, Research Intern Jeff Schmidt, Data & Technology Director Sponsored by: T a b l e o f C o n t e n t s
December 2012 County Unemployment
 Calumet Lafayette Pierce Ozaukee Winnebago Eau Claire Waukesha Trempealeau Outagamie Brown Washington 14.0% 12.0% 10.0% 8.0% 6.0% 4.0% 2.0% 0.0% December 2012 County Unemployment Florence Manitowoc Taylor
Maine s Labor Market Recovery: Far From Complete by Joel Johnson and Garrett Martin
 April 1, 2014 Maine s Labor Market Recovery: Far From Complete by Joel Johnson and Garrett Martin Nearly five years after the end of the worst recession since the 1930s, Maine s economic recovery is still
Economy Overview. Grand County, CO. Emsi Q Data Set
 Grand County, CO Emsi Q4 2018 Data Set www.economicmodeling.com Contents. Economy........ Overview......................................................................................... 1... Historic.......&..
Employment in Central Oregon: January, 2015
 FOR IMMEDIATE RELEASE: March 10, 2015 CONTACT INFORMATION: Damon Runberg, Regional Economist Damon.M.Runberg@oregon.gov (541) 388-6442 Employment in Central Oregon: January, 2015 Central Oregon finished
Polk County Labor Market Review
 Polk County Labor Market Review Polk County has a labor force of approximately 281,000 with 265,000 of them employed as of June 2016. The labor force reversed the 2014 2015 trend by growing 0.22% between
Economy Overview. Esmeralda County, NV. Emsi Q Data Set
 Esmeralda County, NV Emsi Q3 2018 Data Set www.economicmodeling.com Economy Overview 795 403 $43.1K Popula on (2017) Jobs (2017) Median Household Income (2016) Popula on grew by 26 over the last 5 years
Camden County, MO. Economy Overview. Michele Kroll, Community Development Specialist,
 Camden County, MO Michele Kroll, Community Development Specialist, krollm@missouri.edu Emsi Q1 2018 Data Set www.economicmodeling.com Contents. Economy........ Overview.........................................................................................
2000s, a trend. rates and with. workforce participation as. followed. 2015, 50 th
 Labor Force Participat tion Trends in Michigan and the United States Executive Summary Labor force participation rates in the United States have been on the gradual decline since peaking in the early 2000s,
Metro Milwaukee Economic Trends August, 2008
 Metro Milwaukee Economic Trends August, 2008 Prepared by: Economic Research Division October 7, 2008 www.mmac.org www.mmac.org Metro Milwaukee Economic Trends Page 1 August Economic Trends A weak trend
Tessa Conroy, Matt Kures, and Steven Deller
 WIndicators Labor Shortage: Signs and Symptoms Volume 1, Number 5 Tessa Conroy, Matt Kures, and Steven Deller In Wisconsin, the labor market has been the focus of recent public and political discourse,
Rocky Mountain ECONOMIST: Labor force participation rates have fallen sharply THE
 THE Rocky Mountain ECONOMIST: Economic information for Colorado, New Mexico and Wyoming 1 st Quarter 201 4 Effect of Aging on Labor Force Participation Rates in the Mountain States by Alison Felix, Economist
Pennington County, SD
 Pennington County, SD 730 E. Watertown Street, Suite 102 Rapid City, South Dakota 57701 Emsi Q2 2018 Data Set www.economicmodeling.com Contents. Economy........ Overview.........................................................................................
2017 Regional Indicators Summary
 2017 Regional Indicators Summary Regional Indicators Regional indicators are a specific set of data points that help gauge the relative health of the region in a number of areas. These include economy,
State of Ohio Workforce. 2 nd Quarter
 To Strengthen Ohio s Families through the Delivery of Integrated Solutions to Temporary Challenges State of Ohio Workforce 2 nd Quarter 2 0 1 2 Quarterly Report on the State of Ohio s Workforce Reference
Florida: An Economic Overview
 Florida: An Economic Overview July 23, 2010 Presented by: The Florida Legislature Office of Economic and Demographic Research 850.487.1402 http://edr.state.fl.us Economy Lost Ground in 2008 Florida s growth
Miller County, MO. Economy Overview. Michele Kroll, Community Development Specialist,
 Miller County, MO Michele Kroll, Community Development Specialist, krollm@missouri.edu Emsi Q1 2018 Data Set www.economicmodeling.com Contents. Economy........ Overview.........................................................................................
Sussex Demographic and Labor Market Trends
 Sussex Demographic and Labor Market Trends Ed Simon (302) 672-6845 edward.simon@state.de.us October 28, 2009 Introduction Statistical Update Changing economic and labor market conditions Impact on population
Outlook for the Wisconsin Economy. Noah Williams
 Outlook for the Wisconsin Economy Noah University of Wisconsin-Madison Center for Research On the Wisconsin Economy (CROWE) https://crowe.wisc.edu The State of the Wisconsin Economy Tight labor market:
Ravenna s most significant growth occurred before Between 1960 and 1980 the city s population declined by 8.5%.
 DRAFT Ravenna Comprehensive Plan Draft May 2008 1 A Profile of Ravenna This section examines demographic trends that will affect Ravenna. The analysis examines population and demographic dynamics, including
TECHNICAL REPORT NO. 11 (5 TH EDITION) THE POPULATION OF SOUTHEASTERN WISCONSIN PRELIMINARY DRAFT SOUTHEASTERN WISCONSIN REGIONAL PLANNING COMMISSION
 THE POPULATION OF SOUTHEASTERN WISCONSIN PRELIMINARY DRAFT SOUTHEASTERN WISCONSIN REGIONAL PLANNING COMMISSION") TECHNICAL REPORT NO. 11 (5 TH EDITION) THE POPULATION OF SOUTHEASTERN WISCONSIN PRELIMINARY DRAFT 208903 SOUTHEASTERN WISCONSIN REGIONAL PLANNING COMMISSION KRY/WJS/lgh 12/17/12 203905 SEWRPC Technical
TECHNICAL REPORT NO. 11 (5 TH EDITION) THE POPULATION OF SOUTHEASTERN WISCONSIN PRELIMINARY DRAFT 208903 SOUTHEASTERN WISCONSIN REGIONAL PLANNING COMMISSION KRY/WJS/lgh 12/17/12 203905 SEWRPC Technical
Indicators of the Kansas Economy
 Governor s Council of Economic Advisors Indicators of the Kansas Economy A Review of Economic Trends and the Kansas Economy 1000 S.W. Jackson St. Suite 100 Topeka, KS 66612-1354 Phone: (785) 296-0967 Fax:
Rifle city Demographic and Economic Profile
 Rifle city Demographic and Economic Profile Community Quick Facts Population (2014) 9,289 Population Change 2010 to 2014 156 Place Median HH Income (ACS 10-14) $52,539 State Median HH Income (ACS 10-14)
Employment in Central Oregon: June 2015
 FOR IMMEDIATE RELEASE: July 21, 2015 CONTACT INFORMATION: Damon Runberg, Regional Economist Damon.M.Runberg@oregon.gov (541) 706-0779 Employment in Central Oregon: June 2015 There were no significant changes
Allegan County, MI. Economy Overview. Michigan Economic Development Corpora on. 300 N. Washington Square, Lower Level Lansing, Michigan 48913
 Allegan County, MI Michigan Economic Development Corpora on 300 N. Washington Square, Lower Level Lansing, Michigan 48913 Emsi Q4 2018 Data Set www.economicmodeling.com Contents. Economy........ Overview.........................................................................................
Program on Applied Demographics
 Labor Force Trends in New York State: An Economic Development Region Analysis Elizabeth Womack Program on Applied Demographics Cornell University November 2017 Program on Applied Demographics http://pad.human.cornell.edu
Twin Cities Minnesota Economic and Business Conditions Report, Second Quarter 2014
 St. Cloud State University therepository at St. Cloud State Twin Cities Minnesota Economic and Business Conditions Report Minnesota Regional Economic and Business Conditions Report 10- Twin Cities Minnesota
REGIONAL SUMMARIES. Nonfarm employment grew in the second quarter. Non-farm jobs totaled 56,900 in June, up from 55,500 in June 2016.
 Second Quarter 2017 Quarterly narrative An independent economic analysis of four Arkansas metro areas: Central Arkansas Northwest Arkansas The Fort Smith region Jonesboro metro REGIONAL SUMMARIES Fort
E APPENDIX METHODOLOGY FOR LAND USE PROJECTIONS IN THE BOSTON REGION INTRODUCTION
 E APPENDIX METHODOLOGY FOR LAND USE PROJECTIONS IN THE BOSTON REGION INTRODUCTION The Metropolitan Area Planning Council (MAPC), the region s land use planning agency, is responsible for preparing detailed
Florida: An Economic Overview Focusing on County Differences
 Florida: An Economic Overview Focusing on County Differences House Commerce Committee Presentation January 8, 2019 Presented by: The Florida Legislature Office of Economic and Demographic Research 850.487.1402
NEW ORLEANS REGIONAL COUNCIL FOR BUSINESS ECONOMICS
 Monthly Non-Farm Employment Jan. 2008 Apr Jul Jan.2009 Jan. 2010 Jan.2011 Jan.2012 Jan.2013 Jan.2014 Jan. 2015 Jan. 2016 Jan.2017 2017 THE NEW ORLEANS REGIONAL ECONOMIC INDEX NEW ORLEANS REGIONAL COUNCIL
Maine's Economic Forecast: Modest Growth Ahead
 Maine Policy Review Volume 2 Issue 3 1993 Maine's Economic Forecast: Modest Growth Ahead Laurie LaChance Follow this and additional works at: https://digitalcommons.library.umaine.edu/mpr Part of the Growth