2017 ECONOMIC AND WORKFORCE PROFILE Brown County
|
|
|
- Joseph Tobias Douglas
- 6 years ago
- Views:
Transcription


1 2017 ECONOMIC AND WORKFORCE PROFILE Brown County STATE OF WISCONSIN DETI BRW-P (R. 3/2018)

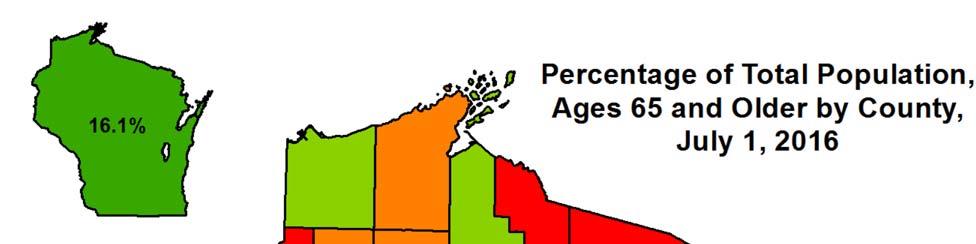
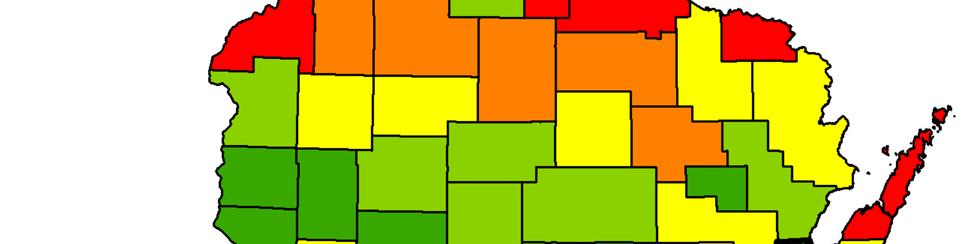
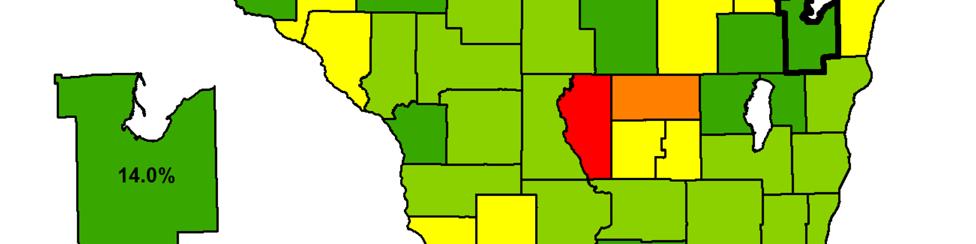
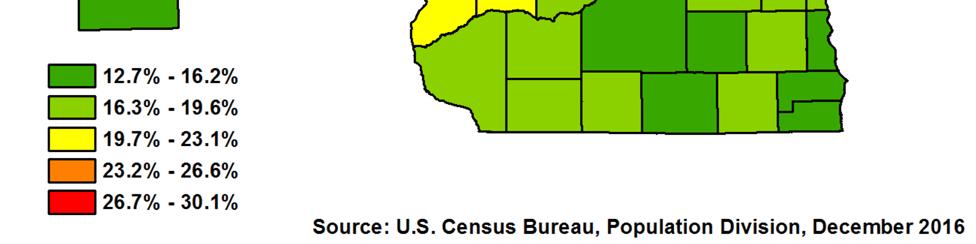
2 Percentage of Total Popula on, Ages 65 and Older
3 Wisconsin now has more people employed and more private sector jobs than at any me in its history. As of this wri ng, the state added 56,100 jobs during 2016 and Employment increased in almost all industry sectors, with prominent gains in construc on, manufacturing, and healthcare. Wisconsin s unemployment rate is near lows not seen in a genera on, decreasing from 4.3 percent in January 2016 to 3.2 percent in December 2017, on a seasonally adjusted basis. Wisconsin faces a worker quan ty challenge. The number of re ring Baby Boomers nearly match the influx of new workers, resul ng in a slow growing workforce and placing constraints on the ability by employers across all industries to hire talent. Many businesses report that the lack of available workers has hindered expansion and, in some cases, even curtailed their ability to meet current product orders. The blue line, orange line graph to the right illustrates the situa on in Wisconsin and other upper Midwest states. While Wisconsin's popula on will con nue to grow over the next twenty years, the workforce faces serious constraints. The labor force par cipa on rate (LFPR), defined as the labor force (sum of employed and unemployed) divided by the total popula on ages 16 and older, measures the popula on's engagement in the workforce and serves as an indicator in determining how Wisconsin's workforce will be constrained. The overall LFPR peaked in the late 1990s and has been trending lower ever since. The LFPR of peaks across Source: Local Area Unemployment Sta s cs, Bureau of Labor Sta s cs the age cohort at over ninety percent and decreases rapidly into the single digits by age seventy. Baby Boomers have and con nue to exit with respect to their LFPR. The mass of Baby Boomers has moved into the work lifecycle stage of declining LFPRs, with the tail end of the cohort turning 55 in Source: Bureau of Labor Sta s cs A recent development is the change in the labor force par cipa on rate trend. The LFPR of older workers (those aged 55 years and older) has turned upwards, resul ng in fla ening of the overall LFPR. More boomers are staying in the workforce longer, which may portend higher workforce growth over the coming years. Due to the size of the Baby Boomer cohort and the sensi vity of the LFPR to workforce growth rates, a rela vely small change in the LFPR of older workers would significantly boost the number in the workforce. 1


4 Popula on and Demographics Source: Demographic Services Center, Wisconsin Department of Administra on Popula on growth for the na on outpaced the rate of growth for both the state of Wisconsin and Brown County. During this me period, Brown County's popula on grew by 9,890 residents. Within the county, over 60% of the popula on growth was accounted for by four municipali es: Green Bay, Howard, Hobart, and Ledgeview. With a few excep ons, the general trend in Brown County was that as the popula ons of larger and more established municipali es grew slowly, smaller ones experienced growth rates that outpaced the state and na on. Within the ten largest municipali es, Allouez was the only one to experience a popula on decrease. The two components of popula on change shown here are natural increase and net migra on. Natural increase is defined as the difference between the number of Components of Popula on Change births and the number of deaths in the county. Brown County boasts a rela vely strong birth rate of 3.6%, which is double the rate for the state and nearly a full percentage point greater than the na on. This can be partly explained by the fact that Brown County is a rela vely younger county compared to the most others in Wisconsin. With a median age of 36.8 years, Brown County is the 10th youngest county in the state out of 72. (ACS, ). The other component of popula on change, net migra on, is defined as the difference between the number of people who move into the county and the number of people who leave. In contrast to the Source: Demographic Services Center, Wisconsin Department of Administra on 2
, the county's net migra on rate is less than one sixth the rate for the na on.")
5 Labor Force Dynamics high natural increase rate, Source: Local Area Unemployment Sta s cs, Bureau of Labor Sta s cs Brown County's net migra on rate was only 0.3%. While that figure is greater than the state's rate (which was nega ve), the county's net migra on rate is less than one sixth the rate for the na on. We begin our discussion of labor force dynamics with a look at historical unemployment rates da ng back to It is important to note that this unemployment data is not seasonally adjusted, which means that regular employment changes over the course of the year have not been accounted for. As a result, this chart shows considerable vola lity within each year. Source: Local Area Unemployment Sta s cs, Bureau of Labor Sta s cs Unemployment trends in Brown County tend to closely follow changes in the state and na on. The common theme of the past seven years has been a gradual economic recovery followed by a steady reduc on of the county's unemployment rate. As of September 2017, the county's rate of 2.7% is lower than at any other point over the last 15 years. While the growing economy plays a large role in the declining unemployment rate, the changing demo 3

6 Industry Employment and Wages graphic situa on and the exodus of the baby boomers from the labor force is also responsible for the current low rates. Interac ons between economics and demographics can also be seen on the graph at the bo om of the last page, which shows the labor force components in the county for each year da ng back to On the employment side, this chart tells the same story as the previous one. Over the course of the recovery a er the 2001 recession, employment bo omed out at 127,065 workers in 2002 and peaked at 132,919 workers just before the Great Re cession. From 2010 to 2016, total employment increased by 9,175 to 135,509 workers. As can be seen by looking over the tops of the stacked bars on the graph, the general labor force trend since 2009 has been gradual growth during the post recessionary recovery. One important ob serva on to make here is that the county's labor force grew significantly more quickly over the seven year period from than the seven year period from While the labor force has been on an upward trend a er 2010, the county's labor force was lower in 2016 than it was in This can at least be partly explained by the fact that the many of the 4
7 Employment Projec ons baby boomers are either re red or within a few years of re rement. Even as the economy con nues to grow, this demographic reality has exerted downward pressure on labor force growth. The combina on of economic recovery and demographic shi s has placed significant pressure on businesses to find and maintain a skilled workforce not only in the short term but also for at least the next decade. Our a en on now shi s to informa on on the distribu on of employment and wages across different industries in Brown County. All industries employment in the county increased by 2,368 employees. This growth rate was greater than the state's employment growth rate of 1.2% over the same period. The Educa on & Health sector added the most jobs in 2016 with 1,338 new workers, or 57% of all new employment. The Professional & Business Services sector was the only one to lose jobs. Four industries accounted for 73% of total payroll: Manufacturing, Professional & Business Services, Educa on & Health, and Trade, Transporta on, & U li es. The table on the bo om of the last page shows annual average wages by industry in Brown County. Employers in several of Brown County s industry sectors con nue to pay wages that either meet or exceed state averages. The county annual average wage of $47,138 is 2.4% above the state average and increased by 0.7% over the past year. Average annual wages grew by over 2% in only three industries: Natural Resources, Leisure & Hospitality, and Other Services. Regarding the Leisure & Hospitality industry, the difference between local and state wages can be partly explained by the higher share of workers in Brown County working at or close to full me as compared to other areas of the state. It is also important to note that wages in this sector are strongly influenced by the presence and success of the Green Bay Packers. While there is much to be gained from understanding past trends, DWD also produces projec ons of industry and occupa on employment into the future. The data presented above and on the next page has been produced as part of the Department s two year long range employment projec ons cycle. The current ten year forecast examines employment over the period between 2014 and These projec ons are presented for the eleven county 5
8 Employment ProjecƟons Source: Office of Economic Advisors, Wisconsin Department of Workforce Development, September 2015 Bay Area Workforce Development Area, which includes more than just the area directly impacted by the Brown County economy. Industry employment in Brown County does comprise 36.8% of employment in the region. However, employment and economic dynamics are similar enough within all parts of the region to comment on general trends. Employment across all industries is expected to grow by 6% over the ten year period, or slightly over 26,000 workers. The most significant numerical growth is expected in the Educa on and Health Services (6,829) and Professional and Business Services (4,256) industry sectors. This is equal to 8 and 10 percent period growth re spec vely. The Bay Area WDA accounted for nearly 15% of total statewide employment in 2014 and is expected to add 14.1% of the state's total new jobs by Over 50% of the expected new jobs in the Bay Area WDA are con centrated in three industries: Educa on and Health Services (26%), Professional and Business Services (16%), and Leisure and Hospitality (12%). The fastest growing sectors are Professional and Business Services (10%), Oth er Services (10%), Financial Ac vi es (9%), and Self Employed and Unpaid Family Workers (9%). As illustrated by DWD's occupa on projec ons, large numbers of baby boomers are expected to re re within 6


9 the next few years, which is why projected replacement openings exceed the number of openings expected to occur as a result of job growth by a factor of almost 4 to 1. This phenomenon is occurring not only in the Bay Area region, but throughout the state and na onal economies as well. The largest number of job openings are projected in the Office and Administra ve Support, Food Prepara on and Servings, and Sales and Related occupa on groups. Large numbers of replacement openings are projected in those occupa ons that are not expected to grow significantly. This is especially common in occupa ons with older workforces and large numbers of an cipated re rements during the projec on period, as well as low wage occupa ons such as Food Service and Prepara on, which tend to have younger workforces but higher rates of employee turnover. Turning our a en on now to the age distribu on of the WDA s major industry sectors, we see that several dominant industry sectors are predominately staffed by mature workers. This is especially true in the Manufacturing, Educa on & Health, Financial Ac vi es, and Public Administra on sectors. The age distribu on of workers in any given industry sector is determined by the availability of entry level posi ons within the sector, which are generally more a rac ve to younger workers, and the premium paid for long tenures in a par cular firm or sector, which tends to result in a preponderance of older workers in those sectors with the highest wage premiums. The challenge presented in this distribu on is how young workers can effec vely transi on from high turnover to high wage industries. For More Informa on: Ryan Long Regional Economist Bay Area WDA Phone: (920) ryan.long@dwd.wisconsin.gov 7
2017 ECONOMIC AND WORKFORCE PROFILE Florence County
 2017 ECONOMIC AND WORKFORCE PROFILE Florence County STATE OF WISCONSIN DETI-17957-FLO-P (R. 3/2018) Percentage of Total Popula on, Ages 65 and Older Wisconsin now has more people employed and more private
2017 ECONOMIC AND WORKFORCE PROFILE Kewaunee County
 2017 ECONOMIC AND WORKFORCE PROFILE Kewaunee County STATE OF WISCONSIN DETI-17957-KEW-P (R. 3/2018) Percentage of Total Popula on, Ages 65 and Older Wisconsin now has more people employed and more private
2017 ECONOMIC AND WORKFORCE PROFILE Winnebago County
 2017 ECONOMIC AND WORKFORCE PROFILE Winnebago County STATE OF WISCONSIN DETI-17957-WIN-P (R. 3/2018) Percentage of Total Popula on, Ages 65 and Older Wisconsin now has more people employed and more private
2017 ECONOMIC AND WORKFORCE PROFILE Green Lake County
 2017 ECONOMIC AND WORKFORCE PROFILE Green Lake County STATE OF WISCONSIN DETI-17957-GRL-P (R. 3/2018) Percentage of Total Popula on, Ages 65 and Older Wisconsin now has more people employed and more private
2017 ECONOMIC AND WORKFORCE PROFILE Walworth County
 2017 ECONOMIC AND WORKFORCE PROFILE Walworth County STATE OF WISCONSIN DETI-17957-WLW-P (R. 3/2018) Percentage of Total Popula on, Ages 65 and Older Wisconsin now has more people employed and more private
2017 ECONOMIC AND WORKFORCE PROFILE Waukesha County
 2017 ECONOMIC AND WORKFORCE PROFILE Waukesha County STATE OF WISCONSIN DETI-17957-WAK-P (R. 3/2018) Percentage of Total Popula on, Ages 65 and Older Wisconsin now has more people employed and more private
2017 ECONOMIC AND WORKFORCE PROFILE Douglas County
 2017 ECONOMIC AND WORKFORCE PROFILE Douglas County STATE OF WISCONSIN DETI-17957-DOU-P (R. 3/2018) Percentage of Total Popula on, Ages 65 and Older Wisconsin now has more people employed and more private
2017 ECONOMIC AND WORKFORCE PROFILE Wood County
 2017 ECONOMIC AND WORKFORCE PROFILE Wood County STATE OF WISCONSIN DETI-17957-WOD-P (R. 3/2018) Percentage of Total Popula on, Ages 65 and Older Wisconsin now has more people employed and more private
2017 ECONOMIC AND WORKFORCE PROFILE Grant County
 2017 ECONOMIC AND WORKFORCE PROFILE Grant County STATE OF WISCONSIN DETI-17957-GRT-P (R. 3/2018) Percentage of Total Popula on, Ages 65 and Older Wisconsin now has more people employed and more private
2017 ECONOMIC AND WORKFORCE PROFILE Washington County
 2017 ECONOMIC AND WORKFORCE PROFILE Washington County STATE OF WISCONSIN DETI-17957-WGT-P (R. 3/2018) Percentage of Total Popula on, Ages 65 and Older Wisconsin now has more people employed and more private
2017 ECONOMIC AND WORKFORCE PROFILE Buffalo County
 2017 ECONOMIC AND WORKFORCE PROFILE Buffalo County STATE OF WISCONSIN DETI-17957-BUF-P (R. 3/2018) Percentage of Total Popula on, Ages 65 and Older Wisconsin now has more people employed and more private
2017 ECONOMIC AND WORKFORCE PROFILE Monroe County
 2017 ECONOMIC AND WORKFORCE PROFILE Monroe County STATE OF WISCONSIN DETI-17957-MON-P (R. 3/2018) Percentage of Total Popula on, Ages 65 and Older Wisconsin now has more people employed and more private
2017 ECONOMIC AND WORKFORCE PROFILE Clark County
 2017 ECONOMIC AND WORKFORCE PROFILE Clark County STATE OF WISCONSIN DETI-17957-CLK-P (R. 3/2018) Percentage of Total Popula on, Ages 65 and Older Wisconsin now has more people employed and more private
2017 ECONOMIC AND WORKFORCE PROFILE Pierce County
 2017 ECONOMIC AND WORKFORCE PROFILE Pierce County STATE OF WISCONSIN DETI-17957-PRC-P (R. 3/2018) Percentage of Total Popula on, Ages 65 and Older Wisconsin now has more people employed and more private
2017 ECONOMIC AND WORKFORCE PROFILE Vernon County
 2017 ECONOMIC AND WORKFORCE PROFILE Vernon County STATE OF WISCONSIN DETI-17957-VRN-P (R. 3/2018) Percentage of Total Popula on, Ages 65 and Older Wisconsin now has more people employed and more private
2017 ECONOMIC AND WORKFORCE PROFILE Dodge County
 2017 ECONOMIC AND WORKFORCE PROFILE Dodge County STATE OF WISCONSIN DETI-17957-DOD-P (R. 3/2018) Percentage of Total Popula on, Ages 65 and Older Wisconsin now has more people employed and more private
2017 ECONOMIC AND WORKFORCE PROFILE St. Croix County
 2017 ECONOMIC AND WORKFORCE PROFILE St. Croix County STATE OF WISCONSIN DETI-17957-STC-P (R. 3/2018) Percentage of Total Popula on, Ages 65 and Older Wisconsin now has more people employed and more private
2017 ECONOMIC AND WORKFORCE PROFILE Dane County
 2017 ECONOMIC AND WORKFORCE PROFILE Dane County STATE OF WISCONSIN DETI-17957-DAN-P (R. 3/2018) Percentage of Total Popula on, Ages 65 and Older Wisconsin now has more people employed and more private
2017 ECONOMIC AND WORKFORCE PROFILE Sauk County
 2017 ECONOMIC AND WORKFORCE PROFILE Sauk County STATE OF WISCONSIN DETI-17957-SAK-P (R. 3/2018) Percentage of Total Popula on, Ages 65 and Older Wisconsin now has more people employed and more private
2017 ECONOMIC AND WORKFORCE PROFILE Chippewa County
 2017 ECONOMIC AND WORKFORCE PROFILE Chippewa County STATE OF WISCONSIN DETI-17957-CHP-P (R. 3/2018) Percentage of Total Popula on, Ages 65 and Older Wisconsin now has more people employed and more private
2017 ECONOMIC AND WORKFORCE PROFILE Barron County
 2017 ECONOMIC AND WORKFORCE PROFILE Barron County STATE OF WISCONSIN DETI-17957-BRN-P (R. 3/2018) Percentage of Total Popula on, Ages 65 and Older Wisconsin now has more people employed and more private
Columbia County DETI COL-P (N. 3/2016)
") Columbia County DETI-17957-COL-P (N. 3/2016) Average Household Income By County Na onal and State Economic Outlook Robust economic growth a er the Great Recession remains an cipated. The recession ended
Columbia County DETI-17957-COL-P (N. 3/2016) Average Household Income By County Na onal and State Economic Outlook Robust economic growth a er the Great Recession remains an cipated. The recession ended
Dane County DETI DAN-P DAN (N. 3/2016)
") Dane County DETI-17957-DAN-P DAN (N. 3/2016) Average Household Income By County Na onal and State Economic Outlook Robust economic growth a er the Great Recession remains an cipated. The recession ended
Dane County DETI-17957-DAN-P DAN (N. 3/2016) Average Household Income By County Na onal and State Economic Outlook Robust economic growth a er the Great Recession remains an cipated. The recession ended
Racine County DETI RAC-P (N. 3/2016)
") Racine County DETI-17957-RAC-P (N. 3/2016) Average Household Income By County Na onal and State Economic Outlook Robust economic growth a er the Great Recession remains an cipated. The recession ended
Racine County DETI-17957-RAC-P (N. 3/2016) Average Household Income By County Na onal and State Economic Outlook Robust economic growth a er the Great Recession remains an cipated. The recession ended
Kenosha County DETI KEN-P (N. 3/2016)
") Kenosha County DETI-17957-KEN-P (N. 3/2016) Average Household Income By County Na onal and State Economic Outlook Robust economic growth a er the Great Recession remains an cipated. The recession ended
Kenosha County DETI-17957-KEN-P (N. 3/2016) Average Household Income By County Na onal and State Economic Outlook Robust economic growth a er the Great Recession remains an cipated. The recession ended
Rock County DETI RCK-P (N. 3/2016)
") Rock County DETI-17957-RCK-P (N. 3/2016) 2015 Rock County Economic and Workforce Profile Na onal and State Economic Outlook Robust economic growth a er the Great Recession remains an cipated. The recession
Rock County DETI-17957-RCK-P (N. 3/2016) 2015 Rock County Economic and Workforce Profile Na onal and State Economic Outlook Robust economic growth a er the Great Recession remains an cipated. The recession
Burnett County DETI BNT-P (N. 3/2016)
") Burnett County DETI-17957-BNT-P (N. 3/2016) Average Household Income By County Na onal and State Economic Outlook Robust economic growth a er the Great Recession remains an cipated. The recession ended
Burnett County DETI-17957-BNT-P (N. 3/2016) Average Household Income By County Na onal and State Economic Outlook Robust economic growth a er the Great Recession remains an cipated. The recession ended
Price County DETI PRI-P P (N. 3/2016)
") Price County DETI-17957-PRI-P P (N. 3/2016) Average Household Income By County Na onal and State Economic Outlook Robust economic growth a er the Great Recession remains an cipated. The recession ended
Price County DETI-17957-PRI-P P (N. 3/2016) Average Household Income By County Na onal and State Economic Outlook Robust economic growth a er the Great Recession remains an cipated. The recession ended
Eau Claire County DETI ECL-P ECL (N. 3/2016)
") Eau Claire County DETI-17957-ECL-P ECL (N. 3/2016) Average Household Income By County Na onal and State Economic Outlook Robust economic growth a er the Great Recession remains an cipated. The recession
Eau Claire County DETI-17957-ECL-P ECL (N. 3/2016) Average Household Income By County Na onal and State Economic Outlook Robust economic growth a er the Great Recession remains an cipated. The recession
Outagamie County DETI OUT-P (N. 3/2016)
") Outagamie County DETI-17957-OUT-P (N. 3/2016) Average Household Income By County Na onal and State Economic Outlook Robust economic growth a er the Great Recession remains an cipated. The recession ended
Outagamie County DETI-17957-OUT-P (N. 3/2016) Average Household Income By County Na onal and State Economic Outlook Robust economic growth a er the Great Recession remains an cipated. The recession ended
Jackson County DETI JAK-P (N. 3/2016)
") Jackson County DETI-17957-JAK-P (N. 3/2016) 2015 Jackson County Economic and Workforce Profile Na onal and State Economic Outlook Robust economic growth a er the Great Recession remains an cipated. The
Jackson County DETI-17957-JAK-P (N. 3/2016) 2015 Jackson County Economic and Workforce Profile Na onal and State Economic Outlook Robust economic growth a er the Great Recession remains an cipated. The
Guernsey Economic Overview
 Guernsey Economic Overview Issue date: 19 May 17 The Guernsey Economic Overview brings together the most recent official Guernsey sta s cs and provides an overview of economic condi ons in Guernsey and
Quarterly Labour Market Report. November 2017
 Quarterly Labour Market Report November 2017 MBIE 3518 November 2017 Ministry of Business, Innovation and Employment (MBIE) Hikina Whakatutuki - Lifting to make successful MBIE develops and delivers policy,
County Economic Profile Lee County, MS extension.msstate.edu/economic profiles
 County Economic Profile Lee County, MS extension.msstate.edu/economic profiles Demographics* Lee Mississippi United States Total Popula on, 2017 (Popula on Es mates) 84,933 2,984,100 325,719,178 Percent
Economy Overview. Eagle County, CO. Emsi Q Data Set
 Eagle County, CO Emsi Q4 2018 Data Set www.economicmodeling.com Contents. Economy........ Overview......................................................................................... 1... Historic.......&..
County Economic Profile Copiah County, MS extension.msstate.edu/economic profiles
 County Economic Profile Copiah County, MS extension.msstate.edu/economic profiles Demographics* Copiah Mississippi United States Total Popula on, 2017 (Popula on Es mates) 28,516 2,984,100 325,719,178
County Economic Profile Marion County, MS extension.msstate.edu/economic profiles
 County Economic Profile Marion County, MS extension.msstate.edu/economic profiles Demographics* Marion Mississippi United States Total Popula on, 2017 (Popula on Es mates) 25,069 2,984,100 325,719,178
County Economic Profile Jasper County, MS extension.msstate.edu/economic profiles
 County Economic Profile Jasper County, MS extension.msstate.edu/economic profiles Demographics* Jasper Mississippi United States Total Popula on, 2017 (Popula on Es mates) 16,582 2,984,100 325,719,178
County Economic Profile Clarke County, MS extension.msstate.edu/economic profiles
 County Economic Profile Clarke County, MS extension.msstate.edu/economic profiles Demographics* Clarke Mississippi United States Total Popula on, 2017 (Popula on Es mates) 15,828 2,984,100 325,719,178
County Economic Profile Monroe County, MS extension.msstate.edu/economic profiles
 County Economic Profile Monroe County, MS extension.msstate.edu/economic profiles Demographics* Monroe Mississippi United States Total Popula on, 2017 (Popula on Es mates) 35,872 2,984,100 325,719,178
County Economic Profile Leflore County, MS extension.msstate.edu/economic profiles
 County Economic Profile Leflore County, MS extension.msstate.edu/economic profiles Demographics* Leflore Mississippi United States Total Popula on, 2017 (Popula on Es mates) 29,223 2,984,100 325,719,178
County Economic Profile Bolivar County, MS extension.msstate.edu/economic profiles
 County Economic Profile Bolivar County, MS extension.msstate.edu/economic profiles Demographics* Bolivar Mississippi United States Total Popula on, 2017 (Popula on Es mates) 31,945 2,984,100 325,719,178
County Economic Profile Tunica County, MS extension.msstate.edu/economic profiles
 County Economic Profile Tunica County, MS extension.msstate.edu/economic profiles Demographics* Tunica Mississippi United States Total Popula on, 2017 (Popula on Es mates) 10,024 2,984,100 325,719,178
County Economic Profile Coahoma County, MS extension.msstate.edu/economic profiles
 County Economic Profile Coahoma County, MS extension.msstate.edu/economic profiles Demographics* Coahoma Mississippi United States Total Popula on, 2017 (Popula on Es mates) 23,154 2,984,100 325,719,178
County Economic Profile Lamar County, MS extension.msstate.edu/economic profiles
 County Economic Profile Lamar County, MS extension.msstate.edu/economic profiles Demographics* Lamar Mississippi United States Total Popula on, 2017 (Popula on Es mates) 61,374 2,984,100 325,719,178 Percent
Quarterly Labour Market Report. August 2018
 Quarterly Labour Market Report August 2018 Ministry of Business, Innovation and Employment (MBIE) Hikina Whakatutuki - Lifting to make successful MBIE develops and delivers policy, services, advice and
County Economic Profile Smith County, MS extension.msstate.edu/economic profiles
 County Economic Profile Smith County, MS extension.msstate.edu/economic profiles Demographics* Smith Mississippi United States Total Popula on, 2017 (Popula on Es mates) 16,078 2,984,100 325,719,178 Percent
Economy Overview. Summit County, CO. Emsi Q Data Set
 Summit County, CO Emsi Q4 2018 Data Set www.economicmodeling.com Contents. Economy........ Overview......................................................................................... 1... Historic.......&..
Quarterly Labour Market Report. August 2017
 Quarterly Labour Market Report August 2017 MB14363 August 2017 Ministry of Business, Innovation and Employment (MBIE) Hikina Whakatutuki - Lifting to make successful MBIE develops and delivers policy,
Economy Overview. Pitkin County, CO. Emsi Q Data Set
 Pitkin County, CO Emsi Q4 2018 Data Set www.economicmodeling.com Contents. Economy........ Overview......................................................................................... 1... Historic.......&..
2012 ALBANY COUNTY EXECUTIVE BUDGET
 2012 ALBANY COUNTY EXECUTIVE BUDGET INTRODUCTION AND HIGHLIGHTS Economic Forecast MICHAEL G. BRESLIN County Execu ve INTRODUCTION This sec on of the budget provides a survey of economic indicators and
The Advisors Inner Circle Fund II
 The Advisors Inner Circle Fund II A Class Shares PROSPECTUS June 1, 2018 Frost Total Return Bond Fund (FAJEX) Frost Credit Fund (FCFBX) Investment Adviser: Frost Investment Advisors, LLC The U.S. Securi
Economy Overview. Grand County, CO. Emsi Q Data Set
 Grand County, CO Emsi Q4 2018 Data Set www.economicmodeling.com Contents. Economy........ Overview......................................................................................... 1... Historic.......&..
Miller County, MO. Economy Overview. Michele Kroll, Community Development Specialist,
 Miller County, MO Michele Kroll, Community Development Specialist, krollm@missouri.edu Emsi Q1 2018 Data Set www.economicmodeling.com Contents. Economy........ Overview.........................................................................................
La Crosse County, WI
 La Crosse County, WI Mississippi River Regional Planning Commission 1707 Main Street, Suite 435 La Crosse, Wisconsin 54601 Emsi Q4 2018 Data Set www.economicmodeling.com Contents. Economy........ Overview.........................................................................................
Pennington County, SD
 Pennington County, SD 730 E. Watertown Street, Suite 102 Rapid City, South Dakota 57701 Emsi Q2 2018 Data Set www.economicmodeling.com Contents. Economy........ Overview.........................................................................................
14 Coun es. Economy Overview. West Virginia Department of Commerce Capitol Complex, Bldg. 6, Room 525 Charleston, West Virginia 25305
 14 Coun es West Virginia Department of Commerce Capitol Complex, Bldg. 6, Room 525 Charleston, West Virginia 25305 Emsi Q4 2018 Data Set www.economicmodeling.com Contents. Economy........ Overview.........................................................................................
O awa County, MI. Economy Overview. Michigan Economic Development Corpora on. 300 N. Washington Square, Lower Level Lansing, Michigan 48913
 O awa County, MI Michigan Economic Development Corpora on 300 N. Washington Square, Lower Level Lansing, Michigan 48913 Emsi Q4 2018 Data Set www.economicmodeling.com Contents. Economy........ Overview.........................................................................................
Economy Overview. Esmeralda County, NV. Emsi Q Data Set
 Esmeralda County, NV Emsi Q3 2018 Data Set www.economicmodeling.com Economy Overview 795 403 $43.1K Popula on (2017) Jobs (2017) Median Household Income (2016) Popula on grew by 26 over the last 5 years
Camden County, MO. Economy Overview. Michele Kroll, Community Development Specialist,
 Camden County, MO Michele Kroll, Community Development Specialist, krollm@missouri.edu Emsi Q1 2018 Data Set www.economicmodeling.com Contents. Economy........ Overview.........................................................................................
Allegan County, MI. Economy Overview. Michigan Economic Development Corpora on. 300 N. Washington Square, Lower Level Lansing, Michigan 48913
 Allegan County, MI Michigan Economic Development Corpora on 300 N. Washington Square, Lower Level Lansing, Michigan 48913 Emsi Q4 2018 Data Set www.economicmodeling.com Contents. Economy........ Overview.........................................................................................
Superior Trade Zone. Economy Overview. Lake Superior Community Partnership. 501 S. Front Street Marque e, Michigan 49855
 Superior Trade Zone Lake Superior Community Partnership 501 S. Front Street Marque e, Michigan 49855 Emsi Q3 2018 Data Set www.economicmodeling.com Contents. Economy........ Overview.........................................................................................
Bucks County, PA. Economy Overview. Bucks County Workforce Development Board, Inc Veterans Highway Bristol, Pennsylvania 19007
 Bucks County, PA Bucks County Workforce Development Board, Inc. 1268 Veterans Highway Bristol, Pennsylvania 19007 Emsi Q4 2018 Data Set www.economicmodeling.com Contents. Economy........ Overview.........................................................................................
Economy Overview. Monroe County, WI. Emsi Q Data Set
 Monroe County, WI Emsi Q4 2017 Data Set www.economicmodeling.com Contents. Economy........ Overview......................................................................................... 1... Historic.......&..
3 New Hampshire ZIPs
 3 New Hampshire ZIPs New Hampshire Economic Development 172 Pembroke Rd Concord, New Hampshire 03301 Emsi Q4 2018 Data Set www.economicmodeling.com Contents. Economy........ Overview.........................................................................................
Population by Year. Ray County, Missouri 23,712 23,541. Population by Age. Ray County, Missouri 27% 27% 22%
 emographics, popula on has decreased by 3 percent since 2 and its popula on now stands at 22,754. or more informa on on Ray County, please visit www.raycountymo.com. Popula on by Year Population by Year
2 North San Joaquin Valley Index. Prepared by: Jeffrey A. Michael and Thomas E. Pogue
 Prepared by: Jeffrey A. Michael and Thomas E. Pogue This report has been prepared by the Center for Business and Policy Research at the University of the Pacific. This publica on was supported by JP Morgan
Palo Pinto County, TX
 Palo Pinto County, TX Emsi Q3 2018 Data Set www.economicmodeling.com Contents. Economy........ Overview......................................................................................... 1... Historic.......&..
Economy Overview. Greater Lima Region. Emsi Q Data Set
 Greater Lima Region Emsi Q3 2017 Data Set www.economicmodeling.com Contents. Economy........ Overview......................................................................................... 1... Historic.......&..
The Fron er Line. GLI Benchmarks. Thought Leadership and insights from Fron er Advisors. Issue 103, March 2015
 Thought Leadership and insights from Fron er Advisors GLI Benchmarks Issue 103, March 2015 Fron er Advisors has been at the forefront of ins tu onal investment advice in Australia for over two decades
Economic and Market Review Fourth Quarter 2017
 Redstone Advisors Tax law is like the world s biggest game of chess with all sorts of weird conundrums about ethics and civics and consent of the governed built in. David Foster Wallace Financial markets
Economy Overview. Ellis County, TX. Emsi Q Data Set
 Ellis County, TX Emsi Q3 2018 Data Set www.economicmodeling.com Contents. Economy........ Overview......................................................................................... 1... Historic.......&..
Economy Overview. Hunt County, TX. Emsi Q Data Set
 Hunt County, TX Emsi Q4 2018 Data Set www.economicmodeling.com Contents. Economy........ Overview......................................................................................... 1... Historic.......&..
Economy Overview. Collin County, TX. Emsi Q Data Set
 Collin County, TX Emsi Q3 2018 Data Set www.economicmodeling.com Contents. Economy........ Overview......................................................................................... 1... Historic.......&..
Economy Overview. Denton County, TX. Emsi Q Data Set
 Denton County, TX Emsi Q1 2018 Data Set www.economicmodeling.com Contents. Economy........ Overview......................................................................................... 1... Historic.......&..
Industry Snapshot. Workforce Alliance of the North Bay. Emsi Q Data Set. September Emsi Q Data Set
 Industry Snapshot Emsi Q3 2018 Data Set September 2018 Workforce Alliance of the North Bay 1546 First Street Napa, California 94559 (707) 253-4697 Emsi Q3 2018 Data Set www.economicmodeling.com Page 1/7
Highest Ranked Industries Top 10 Industries (2-Digit) in PVCC Service Region
 in PVCC Service Region") Highest Ranked Industries Top 10 Industries (2-Digit) in PVCC Service Region Emsi Q2 2018 Data Set June 2018 Piedmont Virginia Community College 501 College Drive Charlo esville, Virginia 22902 Emsi Q2
Highest Ranked Industries Top 10 Industries (2-Digit) in PVCC Service Region Emsi Q2 2018 Data Set June 2018 Piedmont Virginia Community College 501 College Drive Charlo esville, Virginia 22902 Emsi Q2
Deputy Finance Director Recruitment
 Deputy Finance Director Recruitment The City of Cape Girardeau, serving a growing popula on of 39,000, is succession planning for their Finance Director. The city is located between St. Louis and Memphis
WORKFORCE RESULTS. October 1 December 31, 2013 Second Quarter, Program Year 2013
 WORKFORCE RESULTS October 1 December 31, 2013 Second Quarter, Program Year 2013 WORKFORCE RESULTS Submi ed By: The Department of Workforce Services provides this overview of performance for the period
Rifle city Demographic and Economic Profile
 Rifle city Demographic and Economic Profile Community Quick Facts Population (2014) 9,289 Population Change 2010 to 2014 156 Place Median HH Income (ACS 10-14) $52,539 State Median HH Income (ACS 10-14)
Rocky Mountain ECONOMIST: Labor force participation rates have fallen sharply THE
 THE Rocky Mountain ECONOMIST: Economic information for Colorado, New Mexico and Wyoming 1 st Quarter 201 4 Effect of Aging on Labor Force Participation Rates in the Mountain States by Alison Felix, Economist
Credit Reports and Scores
 Credit Reports and Scores Advanced Level The Importance of a Credit History for Obtaining Credit Credit refers to borrowing. You have used credit if you receive money, goods, or services in exchange for
Economy Overview. Navarro County, TX. Emsi Q Data Set
 Economy Overview Navarro County, TX Emsi Q3 2017 Data Set www.economicmodeling.com Economy Overview Contents. Economy........ Overview.........................................................................................
The Labor Force Participation Puzzle
 The Labor Force Participation Puzzle May 23, 2013 by David Kelly of J.P. Morgan Funds Slow growth and mediocre job creation have been common themes used to describe the U.S. economy in recent years, as
Industry Snapshot. Finance and Insurance
 Industry Snapshot Finance and Insurance Emsi Q2 2018 Data Set April 2018 Workforce Solutions for North Central Texas is an equal opportunity employer/program. Auxiliary aids and services are available
The Province of Prince Edward Island Employment Trends and Data Poverty Reduction Action Plan Backgrounder
 The Province of Prince Edward Island Employment Trends and Data Poverty Reduction Action Plan Backgrounder 5/17/2018 www.princeedwardisland.ca/poverty-reduction $000's Poverty Reduction Action Plan Backgrounder:
CHAPTER I. Contextual background on Moldova. A. Historical and poli cal context. Table 2: General facts about Moldova
 CHAPTER I Contextual background on Moldova A. Historical and poli cal context Moldova is a small, landlocked country situated towards the east of the UNECE region, bordering Romania and Ukraine. It has
City of Guelph. Financial Condi on Assessment. September 24, 2015
 City of Guelph Financial Condi on Assessment September 24, 2015 62 Table of Contents Exeuctive Summary Introduction 1 Trend Analysis 2 Peer Analysis 2 Questions to Consider 3 Key Indicators 4 Section 1
Rock County Workforce Profile 2011
 Rock County Workforce Profile 2011 Proportional Population Change by Minor Civil Division 2000 2010 Source: US Census Bureau, 2000 Census and WI Dept. of Administration Demographic Services, January 2010
In fiscal year 2016, for the first time since 2009, the
 Summary In fiscal year 216, for the first time since 29, the federal budget deficit increased in relation to the nation s economic output. The Congressional Budget Office projects that over the next decade,
which looks like a credit card, but is electronically connected to the cardholder s bank account.
 U C C T C Y F A L 1.4.1.F1 Credit is derived from the La n word credo meaning I believe. Credit is when goods, services, or money is received in exchange for a promise to pay a definite sum of money at
Tessa Conroy, Matt Kures, and Steven Deller
 WIndicators Labor Shortage: Signs and Symptoms Volume 1, Number 5 Tessa Conroy, Matt Kures, and Steven Deller In Wisconsin, the labor market has been the focus of recent public and political discourse,
Industry Snapshot. Health Care
 Industry Snapshot Health Care Emsi Q2 2018 Data Set April 2018 Workforce Solutions for North Central Texas is an equal opportunity employer/program. Auxiliary aids and services are available upon request
Burnett County Workforce Profile
 Percentage of working-age population aged 60 years and older in 2020 23.2% - 30.0% 30.1% - 40.0% 40.1% - 49.3% State average 29.4% Office of Economic Advisors OEA-10599-P Beverly Gehrke 15618 Windrose
Occupa on Overview. Bakersfield College. Emsi Q Data Set. September Emsi Q Data Set
 Occupa on Overview Emsi Q3 2017 Data Set September 2017 Bakersfield College 1801 Panorama Drive Bakersfield, California 93305 661.395.4921 Emsi Q3 2017 Data Set www.economicmodeling.com Page 1/10 Parameters
The Boomers Have Already Been Overtaken By the Millennials
 The Boomers Have Already Been Overtaken By the Millennials November 14, 2016 by Urban Carmel of The Fat Pitch Summary: Demographics is a key driver of economic growth. Most people focus on the aging of
Table of Contents. Long Range Financial Plan 27. Report Introduction 1
 Table of Contents Report Introduction 1 Water/Wastewater Long Range Financial Planning 2 Principles of Financial Sustainability 4 Importance of a Long Range Financial Plan 5 General Approach to Preparing
Monthly Financial Status Report
 Prepared by the Financial Services Department Key Revenue Indicators Overview The ad valorem tax revenues are derived from taxes levied on Property Tax real property, personal property and state assessed
Putting Maine Job Growth in Context, Report for Labor Commissioner Jeanne Paquette, May, 2014
 Maine State Library Maine State Documents Center for Workforce Research and Information Documents Labor 9-4-2014 Putting Maine Job Growth in Context, Report for Labor Commissioner Jeanne Paquette, May,
Monthly Financial Status Report
 Prepared by the Financial Services Department Key Revenue Indicators Overview The ad valorem tax revenues are derived from taxes levied on Property Tax real property, personal property and state assessed