2017 ECONOMIC AND WORKFORCE PROFILE Pierce County
|
|
|
- Verity Reynolds
- 6 years ago
- Views:
Transcription


1 2017 ECONOMIC AND WORKFORCE PROFILE Pierce County STATE OF WISCONSIN DETI PRC-P (R. 3/2018)

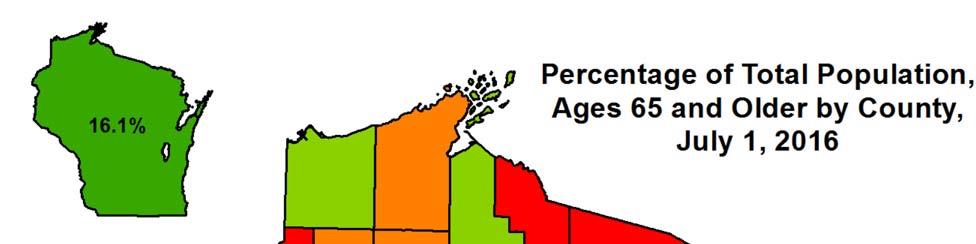
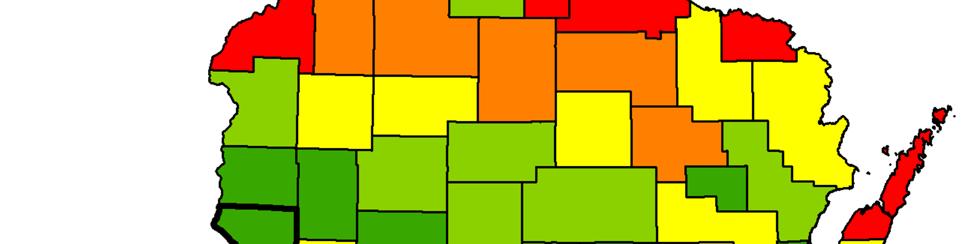
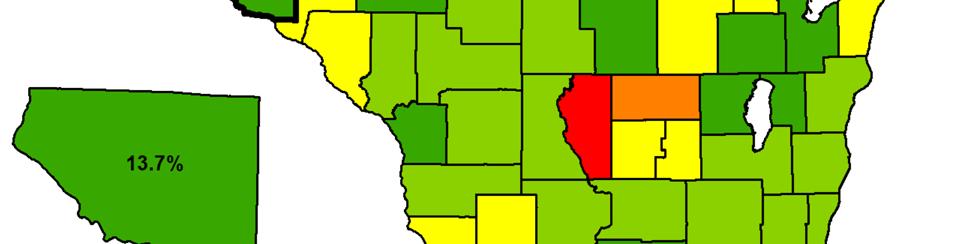
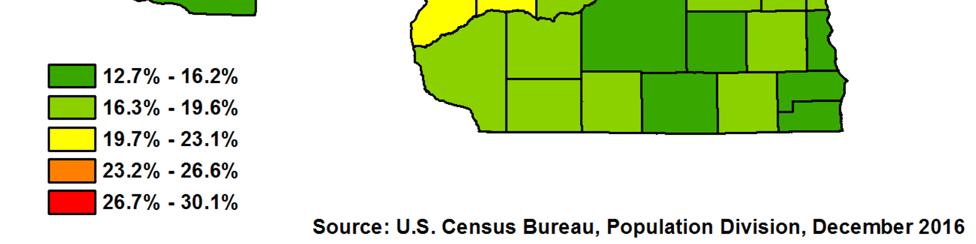
2 Percentage of Total Popula on, Ages 65 and Older
3 Wisconsin now has more people employed and more private sector jobs than at any me in its history. As of this wri ng, the state added 56,100 jobs during 2016 and Employment increased in almost all industry sectors, with prominent gains in construc on, manufacturing, and healthcare. Wisconsin s unemployment rate is near lows not seen in a genera on, decreasing from 4.3 percent in January 2016 to 3.2 percent in December 2017, on a seasonally adjusted basis. Wisconsin faces a worker quan ty challenge. The number of re ring Baby Boomers nearly match the influx of new workers, resul ng in a slow growing workforce and placing constraints on the ability by employers across all industries to hire talent. Many businesses report that the lack of available workers has hindered expansion and, in some cases, even curtailed their ability to meet current product orders. The blue line, orange line graph to the right illustrates the situa on in Wisconsin and other upper Midwest states. While Wisconsin's popula on will con nue to grow over the next twenty years, the workforce faces serious constraints. The labor force par cipa on rate (LFPR), defined as the labor force (sum of employed and unemployed) divided by the total popula on ages 16 and older, measures the popula on's engagement in the workforce and serves as an indicator in determining how Wisconsin's workforce will be constrained. The overall LFPR peaked in the late 1990s and has been trending lower ever since. The LFPR of peaks across Source: Local Area Unemployment Sta s cs, Bureau of Labor Sta s cs the age cohort at over ninety percent and decreases rapidly into the single digits by age seventy. Baby Boomers have and con nue to exit with respect to their LFPR. The mass of Baby Boomers has moved into the work lifecycle stage of declining LFPRs, with the tail end of the cohort turning 55 in Source: Bureau of Labor Sta s cs A recent development is the change in the labor force par cipa on rate trend. The LFPR of older workers (those aged 55 years and older) has turned upwards, resul ng in fla ening of the overall LFPR. More boomers are staying in the workforce longer, which may portend higher workforce growth over the coming years. Due to the size of the Baby Boomer cohort and the sensi vity of the LFPR to workforce growth rates, a rela vely small change in the LFPR of older workers would significantly boost the number in the workforce. 1


4 Popula on and Demographics Source: Demographic Services Center, Wisconsin Department of Administra on Pierce County added 301 residents from April 2010 to January 2016, growing at a rate of 0.7%, slower than the statewide growth rate of 1.5%. However, Pierce s ll ranked the 34th fastest growing among the state s 72 coun es. Net migra on, which is defined as people moving into the county minus those leaving, was actually nega ve for the period studied, as it was in just over a third of Wisconsin coun es over the last five years. Popula on change due to net migra on was 1.3% from 2010 to 2016, up from a 1.5% drop in the trend in the last county profile, sugges ng more recent trends have been towards net in migra on rather than out migra on. Growth due to natural increase (as seen on the graph below) was 2.0% in Pierce County, higher than the statewide percent gain. This highlights the low median age in the county. Pierce County s median age of 35.9 is ranked the 7th lowest in the state (ACS, ). Components of Popula on Change The City of River Falls, home to the University of Wisconsin River Falls, is the largest popula on center in Pierce County. The city gained 69 residents from 2010 to 2016, growing at a rate of 0.6% The municipali es that experienced the most growth tended to be near the Minnesota border, a con nua on of a common trend. Commu ng drives the county s growth as workers deal with ever longer drive mes to achieve their desired lifestyle, rais Source: Demographic Services Center, Wisconsin Department of Administra on 2
5 Labor Force Dynamics ing their families in Pierce. Source: Local Area Unemployment Sta s cs, Bureau of Labor Sta s cs The graph above compares Pierce County s monthly unemployment rate to the state and na on. Pierce s rate of 2.8% in May 2017 is quite low historically speaking, although not as low as during the booming economy of the late 1990s. While a growing economy is par ally responsible for today s low unemployment rates, the trend of slow labor force growth (or even declines in some coun es) due to baby boomers leaving the labor force also impacts the rates. Source: Local Area Unemployment Sta s cs, Bureau of Labor Sta s cs You can see this concept displayed on the graph to the le. The labor force consists of the employed and unemployed (represented as the sum of stacked bars in the graph), so the trend will be along the top edge of the bars. Pierce s labor force has seen significantly slower growth this decade than the early 2000s, a trend likely to con nue into at least the next decade. Pierce s younger popula on may blunt some of the impact that re ring baby boomers will have on the area s labor force, but it s important to remember that many of 3


6 Industry Employment and Wages those younger workers are already employed in the Twin Ci es. This is a be er situa on than many Wisconsin coun es face; it tends to be easier to get people already living in a county to work there in return for a shorter commute, rather than luring workers from other coun es or states. Pierce County saw job growth of roughly 1.6% (160 jobs), from 2015 to 2016, ranking it 21st among the state s 72 coun es, by percent change. Pierce s all industry wage was 77.7% of the statewide level, similar to past trends Educa on and health services, by far the largest industry super sector of employment listed in Pierce County, lost 30 jobs from 2015 to Wages in educa on and health are 74.5% of the statewide average; the healthcare industry in smaller rural coun es tend to have lower con centra ons of highly paid spe cialists, a factor that normally lowers average healthcare wages outside of more urban areas. Wages in the educa on sector were much closer to the statewide average, proba bly due to the presence of UW River Falls. Manufacturing is the third largest super sector of em ployment (a er trade, trans porta on, and u li es) in 4
7 Employment Projec ons Pierce County, though it is actually the second largest in terms of total payroll, due to rela vely high average wages. Manufacturing gained 15 jobs from 2015 to 2016, with employment stable amongst the various manufacturing sub sectors. Computer and electronic product manufacturing, and food manufacturing were the top manufacturing sub sectors in the county by employment. Wages in this super sector are about 88% of the statewide average, and up a couple percent points from last profile. While studying past trends is useful, DWD also produces projec ons of industry and occupa on employment into the future. The industry and occupa onal employment projec ons in this profile are for the nine county West Central Wisconsin Workforce Development Area, produced every two years, following Bureau of Labor Sta s cs methodology. While this region includes more than just Pierce County, which accounts for about 5% of employment in the region, employment and economic dynamics are similar enough throughout the region to comment on general trends. Employment across all industries is expected to grow by about 6% over the ten year period, or almost 14,000 workers. This projec on only forecasts levels of filled posi ons rather than poten al demand. This further illustrates the issues associated with the aging popula on while growth in the labor force is slowing, and in some coun es even declining, job growth is expected to con nue. So while businesses are already having difficulty filling the job openings vacated by re rees, increasing difficulty will be felt filling new openings as well, which could even end up constraining job growth by limi ng expansions. Solu ons to this issue will be different for each business, but will likely include a combina on of possibili es like talent pipeline development (examples include the Wisconsin Fast Forward training grants, and business alliances aimed at marke ng specific careers), increased focus on talent a rac on and reten on, engaging under u lized workforces (like those with barriers to workforce entry), increased automa on, and retaining re rees in nonconven onal work arrangements to name a few. 5
8 Employment ProjecƟons Source: Office of Economic Advisors, Wisconsin Department of Workforce Development, September 2015 The most significant numerical growth is expected in Educa on and Health Services (3,353, 6% growth rate), and Professional and Business Services (2,272, 13.5% growth rate). Another super sector with strong an cipated growth is the Construc on sector (1,085, 15.7%). While industry projec ons have their uses, a more func onal approach is projected occupa onal growth. An examina on of projected occupa onal employment growth reveals a possible explana on for the moderate growth rates an cipated in a number of the region s largest industry sectors. We first see that the most signifi cant occupa onal growth can be observed in a number of occupa onal categories largely concentrated in the Health Services sector, including Healthcare Prac oners, Healthcare Support, and Personal Care and Services workers. Significant growth is also an cipated in many other occupa onal sectors, suppor ng the narra ve of long range stability in many of the region s largest industries. The other trend that is also illustrated is that of labor constraints as openings created due to replacement needs outnumber those generated by new growth by over three to one in the region. This is the reason for the increased importance placed on the availability and skill sets of young workers entering the region s workforce. It s vitally important to realize that slow growth or declines in employment don t necessarily reflect on the health of those industries. Employment declines may be due to factors such as increased automa on and produc vity. There will be many openings simply due to re re ments! 6


9 Further illustra ng the impact of aging demographics, the graph above depicts the job base by major industry sector outlining the age distribu on of its job holders in the West Central region. The age distribu ons vary widely from industry to industry, easily observed from the graph. Occupa onal composi on within an area is a complex factor, influenced first by overall labor availability, then individual job holders life stage, experience, educa on/training, etc. This tends to correspond to age. For example, younger inexperienced workers, like many of the region s students, tend to work in entry level jobs. These entry jobs are more prominent in industries such as the leisure and hospitality sector. Other industries, such as the educa on and health care sector, require workers to have completed a higher level of formal educa on or training and so they have a rela vely low share of the youngest working cohorts. Typically, higher educa on levels tend to correspond to older age groups who have invested the me necessary to achieve those advanced educa onal levels. O en when examining age/labor force issues, we focus too broadly on labor force entry and exit data, to tell us how many workers are available. While useful, this ignores the dynamics within the workforce, which is not a homogenous popula on. Data such as age by industry can give us ac onable informa on like which industry will have the most upcoming re rements, promp ng a need for recruitment and succession planning. For More Informa on: Sco Hodek Regional Economist West Central WDA Phone: (715) sco.hodek@dwd.wisconsin.gov 7
2017 ECONOMIC AND WORKFORCE PROFILE Clark County
 2017 ECONOMIC AND WORKFORCE PROFILE Clark County STATE OF WISCONSIN DETI-17957-CLK-P (R. 3/2018) Percentage of Total Popula on, Ages 65 and Older Wisconsin now has more people employed and more private
2017 ECONOMIC AND WORKFORCE PROFILE St. Croix County
 2017 ECONOMIC AND WORKFORCE PROFILE St. Croix County STATE OF WISCONSIN DETI-17957-STC-P (R. 3/2018) Percentage of Total Popula on, Ages 65 and Older Wisconsin now has more people employed and more private
2017 ECONOMIC AND WORKFORCE PROFILE Wood County
 2017 ECONOMIC AND WORKFORCE PROFILE Wood County STATE OF WISCONSIN DETI-17957-WOD-P (R. 3/2018) Percentage of Total Popula on, Ages 65 and Older Wisconsin now has more people employed and more private
2017 ECONOMIC AND WORKFORCE PROFILE Chippewa County
 2017 ECONOMIC AND WORKFORCE PROFILE Chippewa County STATE OF WISCONSIN DETI-17957-CHP-P (R. 3/2018) Percentage of Total Popula on, Ages 65 and Older Wisconsin now has more people employed and more private
2017 ECONOMIC AND WORKFORCE PROFILE Barron County
 2017 ECONOMIC AND WORKFORCE PROFILE Barron County STATE OF WISCONSIN DETI-17957-BRN-P (R. 3/2018) Percentage of Total Popula on, Ages 65 and Older Wisconsin now has more people employed and more private
2017 ECONOMIC AND WORKFORCE PROFILE Florence County
 2017 ECONOMIC AND WORKFORCE PROFILE Florence County STATE OF WISCONSIN DETI-17957-FLO-P (R. 3/2018) Percentage of Total Popula on, Ages 65 and Older Wisconsin now has more people employed and more private
2017 ECONOMIC AND WORKFORCE PROFILE Green Lake County
 2017 ECONOMIC AND WORKFORCE PROFILE Green Lake County STATE OF WISCONSIN DETI-17957-GRL-P (R. 3/2018) Percentage of Total Popula on, Ages 65 and Older Wisconsin now has more people employed and more private
2017 ECONOMIC AND WORKFORCE PROFILE Kewaunee County
 2017 ECONOMIC AND WORKFORCE PROFILE Kewaunee County STATE OF WISCONSIN DETI-17957-KEW-P (R. 3/2018) Percentage of Total Popula on, Ages 65 and Older Wisconsin now has more people employed and more private
2017 ECONOMIC AND WORKFORCE PROFILE Winnebago County
 2017 ECONOMIC AND WORKFORCE PROFILE Winnebago County STATE OF WISCONSIN DETI-17957-WIN-P (R. 3/2018) Percentage of Total Popula on, Ages 65 and Older Wisconsin now has more people employed and more private
2017 ECONOMIC AND WORKFORCE PROFILE Douglas County
 2017 ECONOMIC AND WORKFORCE PROFILE Douglas County STATE OF WISCONSIN DETI-17957-DOU-P (R. 3/2018) Percentage of Total Popula on, Ages 65 and Older Wisconsin now has more people employed and more private
2017 ECONOMIC AND WORKFORCE PROFILE Brown County
 2017 ECONOMIC AND WORKFORCE PROFILE Brown County STATE OF WISCONSIN DETI-17957-BRW-P (R. 3/2018) Percentage of Total Popula on, Ages 65 and Older Wisconsin now has more people employed and more private
2017 ECONOMIC AND WORKFORCE PROFILE Waukesha County
 2017 ECONOMIC AND WORKFORCE PROFILE Waukesha County STATE OF WISCONSIN DETI-17957-WAK-P (R. 3/2018) Percentage of Total Popula on, Ages 65 and Older Wisconsin now has more people employed and more private
2017 ECONOMIC AND WORKFORCE PROFILE Washington County
 2017 ECONOMIC AND WORKFORCE PROFILE Washington County STATE OF WISCONSIN DETI-17957-WGT-P (R. 3/2018) Percentage of Total Popula on, Ages 65 and Older Wisconsin now has more people employed and more private
2017 ECONOMIC AND WORKFORCE PROFILE Walworth County
 2017 ECONOMIC AND WORKFORCE PROFILE Walworth County STATE OF WISCONSIN DETI-17957-WLW-P (R. 3/2018) Percentage of Total Popula on, Ages 65 and Older Wisconsin now has more people employed and more private
2017 ECONOMIC AND WORKFORCE PROFILE Grant County
 2017 ECONOMIC AND WORKFORCE PROFILE Grant County STATE OF WISCONSIN DETI-17957-GRT-P (R. 3/2018) Percentage of Total Popula on, Ages 65 and Older Wisconsin now has more people employed and more private
2017 ECONOMIC AND WORKFORCE PROFILE Buffalo County
 2017 ECONOMIC AND WORKFORCE PROFILE Buffalo County STATE OF WISCONSIN DETI-17957-BUF-P (R. 3/2018) Percentage of Total Popula on, Ages 65 and Older Wisconsin now has more people employed and more private
2017 ECONOMIC AND WORKFORCE PROFILE Monroe County
 2017 ECONOMIC AND WORKFORCE PROFILE Monroe County STATE OF WISCONSIN DETI-17957-MON-P (R. 3/2018) Percentage of Total Popula on, Ages 65 and Older Wisconsin now has more people employed and more private
2017 ECONOMIC AND WORKFORCE PROFILE Vernon County
 2017 ECONOMIC AND WORKFORCE PROFILE Vernon County STATE OF WISCONSIN DETI-17957-VRN-P (R. 3/2018) Percentage of Total Popula on, Ages 65 and Older Wisconsin now has more people employed and more private
2017 ECONOMIC AND WORKFORCE PROFILE Dodge County
 2017 ECONOMIC AND WORKFORCE PROFILE Dodge County STATE OF WISCONSIN DETI-17957-DOD-P (R. 3/2018) Percentage of Total Popula on, Ages 65 and Older Wisconsin now has more people employed and more private
2017 ECONOMIC AND WORKFORCE PROFILE Sauk County
 2017 ECONOMIC AND WORKFORCE PROFILE Sauk County STATE OF WISCONSIN DETI-17957-SAK-P (R. 3/2018) Percentage of Total Popula on, Ages 65 and Older Wisconsin now has more people employed and more private
2017 ECONOMIC AND WORKFORCE PROFILE Dane County
 2017 ECONOMIC AND WORKFORCE PROFILE Dane County STATE OF WISCONSIN DETI-17957-DAN-P (R. 3/2018) Percentage of Total Popula on, Ages 65 and Older Wisconsin now has more people employed and more private
Eau Claire County DETI ECL-P ECL (N. 3/2016)
") Eau Claire County DETI-17957-ECL-P ECL (N. 3/2016) Average Household Income By County Na onal and State Economic Outlook Robust economic growth a er the Great Recession remains an cipated. The recession
Eau Claire County DETI-17957-ECL-P ECL (N. 3/2016) Average Household Income By County Na onal and State Economic Outlook Robust economic growth a er the Great Recession remains an cipated. The recession
Columbia County DETI COL-P (N. 3/2016)
") Columbia County DETI-17957-COL-P (N. 3/2016) Average Household Income By County Na onal and State Economic Outlook Robust economic growth a er the Great Recession remains an cipated. The recession ended
Columbia County DETI-17957-COL-P (N. 3/2016) Average Household Income By County Na onal and State Economic Outlook Robust economic growth a er the Great Recession remains an cipated. The recession ended
Outagamie County DETI OUT-P (N. 3/2016)
") Outagamie County DETI-17957-OUT-P (N. 3/2016) Average Household Income By County Na onal and State Economic Outlook Robust economic growth a er the Great Recession remains an cipated. The recession ended
Outagamie County DETI-17957-OUT-P (N. 3/2016) Average Household Income By County Na onal and State Economic Outlook Robust economic growth a er the Great Recession remains an cipated. The recession ended
Dane County DETI DAN-P DAN (N. 3/2016)
") Dane County DETI-17957-DAN-P DAN (N. 3/2016) Average Household Income By County Na onal and State Economic Outlook Robust economic growth a er the Great Recession remains an cipated. The recession ended
Dane County DETI-17957-DAN-P DAN (N. 3/2016) Average Household Income By County Na onal and State Economic Outlook Robust economic growth a er the Great Recession remains an cipated. The recession ended
Burnett County DETI BNT-P (N. 3/2016)
") Burnett County DETI-17957-BNT-P (N. 3/2016) Average Household Income By County Na onal and State Economic Outlook Robust economic growth a er the Great Recession remains an cipated. The recession ended
Burnett County DETI-17957-BNT-P (N. 3/2016) Average Household Income By County Na onal and State Economic Outlook Robust economic growth a er the Great Recession remains an cipated. The recession ended
Rock County DETI RCK-P (N. 3/2016)
") Rock County DETI-17957-RCK-P (N. 3/2016) 2015 Rock County Economic and Workforce Profile Na onal and State Economic Outlook Robust economic growth a er the Great Recession remains an cipated. The recession
Rock County DETI-17957-RCK-P (N. 3/2016) 2015 Rock County Economic and Workforce Profile Na onal and State Economic Outlook Robust economic growth a er the Great Recession remains an cipated. The recession
Racine County DETI RAC-P (N. 3/2016)
") Racine County DETI-17957-RAC-P (N. 3/2016) Average Household Income By County Na onal and State Economic Outlook Robust economic growth a er the Great Recession remains an cipated. The recession ended
Racine County DETI-17957-RAC-P (N. 3/2016) Average Household Income By County Na onal and State Economic Outlook Robust economic growth a er the Great Recession remains an cipated. The recession ended
Price County DETI PRI-P P (N. 3/2016)
") Price County DETI-17957-PRI-P P (N. 3/2016) Average Household Income By County Na onal and State Economic Outlook Robust economic growth a er the Great Recession remains an cipated. The recession ended
Price County DETI-17957-PRI-P P (N. 3/2016) Average Household Income By County Na onal and State Economic Outlook Robust economic growth a er the Great Recession remains an cipated. The recession ended
Kenosha County DETI KEN-P (N. 3/2016)
") Kenosha County DETI-17957-KEN-P (N. 3/2016) Average Household Income By County Na onal and State Economic Outlook Robust economic growth a er the Great Recession remains an cipated. The recession ended
Kenosha County DETI-17957-KEN-P (N. 3/2016) Average Household Income By County Na onal and State Economic Outlook Robust economic growth a er the Great Recession remains an cipated. The recession ended
Jackson County DETI JAK-P (N. 3/2016)
") Jackson County DETI-17957-JAK-P (N. 3/2016) 2015 Jackson County Economic and Workforce Profile Na onal and State Economic Outlook Robust economic growth a er the Great Recession remains an cipated. The
Jackson County DETI-17957-JAK-P (N. 3/2016) 2015 Jackson County Economic and Workforce Profile Na onal and State Economic Outlook Robust economic growth a er the Great Recession remains an cipated. The
Guernsey Economic Overview
 Guernsey Economic Overview Issue date: 19 May 17 The Guernsey Economic Overview brings together the most recent official Guernsey sta s cs and provides an overview of economic condi ons in Guernsey and
Economy Overview. Eagle County, CO. Emsi Q Data Set
 Eagle County, CO Emsi Q4 2018 Data Set www.economicmodeling.com Contents. Economy........ Overview......................................................................................... 1... Historic.......&..
Quarterly Labour Market Report. November 2017
 Quarterly Labour Market Report November 2017 MBIE 3518 November 2017 Ministry of Business, Innovation and Employment (MBIE) Hikina Whakatutuki - Lifting to make successful MBIE develops and delivers policy,
Economy Overview. Esmeralda County, NV. Emsi Q Data Set
 Esmeralda County, NV Emsi Q3 2018 Data Set www.economicmodeling.com Economy Overview 795 403 $43.1K Popula on (2017) Jobs (2017) Median Household Income (2016) Popula on grew by 26 over the last 5 years
2012 ALBANY COUNTY EXECUTIVE BUDGET
 2012 ALBANY COUNTY EXECUTIVE BUDGET INTRODUCTION AND HIGHLIGHTS Economic Forecast MICHAEL G. BRESLIN County Execu ve INTRODUCTION This sec on of the budget provides a survey of economic indicators and
Quarterly Labour Market Report. August 2017
 Quarterly Labour Market Report August 2017 MB14363 August 2017 Ministry of Business, Innovation and Employment (MBIE) Hikina Whakatutuki - Lifting to make successful MBIE develops and delivers policy,
Economy Overview. Pitkin County, CO. Emsi Q Data Set
 Pitkin County, CO Emsi Q4 2018 Data Set www.economicmodeling.com Contents. Economy........ Overview......................................................................................... 1... Historic.......&..
Quarterly Labour Market Report. August 2018
 Quarterly Labour Market Report August 2018 Ministry of Business, Innovation and Employment (MBIE) Hikina Whakatutuki - Lifting to make successful MBIE develops and delivers policy, services, advice and
Economy Overview. Monroe County, WI. Emsi Q Data Set
 Monroe County, WI Emsi Q4 2017 Data Set www.economicmodeling.com Contents. Economy........ Overview......................................................................................... 1... Historic.......&..
La Crosse County, WI
 La Crosse County, WI Mississippi River Regional Planning Commission 1707 Main Street, Suite 435 La Crosse, Wisconsin 54601 Emsi Q4 2018 Data Set www.economicmodeling.com Contents. Economy........ Overview.........................................................................................
14 Coun es. Economy Overview. West Virginia Department of Commerce Capitol Complex, Bldg. 6, Room 525 Charleston, West Virginia 25305
 14 Coun es West Virginia Department of Commerce Capitol Complex, Bldg. 6, Room 525 Charleston, West Virginia 25305 Emsi Q4 2018 Data Set www.economicmodeling.com Contents. Economy........ Overview.........................................................................................
Economy Overview. Summit County, CO. Emsi Q Data Set
 Summit County, CO Emsi Q4 2018 Data Set www.economicmodeling.com Contents. Economy........ Overview......................................................................................... 1... Historic.......&..
which looks like a credit card, but is electronically connected to the cardholder s bank account.
 U C C T C Y F A L 1.4.1.F1 Credit is derived from the La n word credo meaning I believe. Credit is when goods, services, or money is received in exchange for a promise to pay a definite sum of money at
Camden County, MO. Economy Overview. Michele Kroll, Community Development Specialist,
 Camden County, MO Michele Kroll, Community Development Specialist, krollm@missouri.edu Emsi Q1 2018 Data Set www.economicmodeling.com Contents. Economy........ Overview.........................................................................................
Miller County, MO. Economy Overview. Michele Kroll, Community Development Specialist,
 Miller County, MO Michele Kroll, Community Development Specialist, krollm@missouri.edu Emsi Q1 2018 Data Set www.economicmodeling.com Contents. Economy........ Overview.........................................................................................
County Economic Profile Lee County, MS extension.msstate.edu/economic profiles
 County Economic Profile Lee County, MS extension.msstate.edu/economic profiles Demographics* Lee Mississippi United States Total Popula on, 2017 (Popula on Es mates) 84,933 2,984,100 325,719,178 Percent
County Economic Profile Copiah County, MS extension.msstate.edu/economic profiles
 County Economic Profile Copiah County, MS extension.msstate.edu/economic profiles Demographics* Copiah Mississippi United States Total Popula on, 2017 (Popula on Es mates) 28,516 2,984,100 325,719,178
County Economic Profile Jasper County, MS extension.msstate.edu/economic profiles
 County Economic Profile Jasper County, MS extension.msstate.edu/economic profiles Demographics* Jasper Mississippi United States Total Popula on, 2017 (Popula on Es mates) 16,582 2,984,100 325,719,178
WORKFORCE RESULTS. October 1 December 31, 2013 Second Quarter, Program Year 2013
 WORKFORCE RESULTS October 1 December 31, 2013 Second Quarter, Program Year 2013 WORKFORCE RESULTS Submi ed By: The Department of Workforce Services provides this overview of performance for the period
County Economic Profile Marion County, MS extension.msstate.edu/economic profiles
 County Economic Profile Marion County, MS extension.msstate.edu/economic profiles Demographics* Marion Mississippi United States Total Popula on, 2017 (Popula on Es mates) 25,069 2,984,100 325,719,178
Pennington County, SD
 Pennington County, SD 730 E. Watertown Street, Suite 102 Rapid City, South Dakota 57701 Emsi Q2 2018 Data Set www.economicmodeling.com Contents. Economy........ Overview.........................................................................................
County Economic Profile Leflore County, MS extension.msstate.edu/economic profiles
 County Economic Profile Leflore County, MS extension.msstate.edu/economic profiles Demographics* Leflore Mississippi United States Total Popula on, 2017 (Popula on Es mates) 29,223 2,984,100 325,719,178
County Economic Profile Monroe County, MS extension.msstate.edu/economic profiles
 County Economic Profile Monroe County, MS extension.msstate.edu/economic profiles Demographics* Monroe Mississippi United States Total Popula on, 2017 (Popula on Es mates) 35,872 2,984,100 325,719,178
Economy Overview. Grand County, CO. Emsi Q Data Set
 Grand County, CO Emsi Q4 2018 Data Set www.economicmodeling.com Contents. Economy........ Overview......................................................................................... 1... Historic.......&..
County Economic Profile Tunica County, MS extension.msstate.edu/economic profiles
 County Economic Profile Tunica County, MS extension.msstate.edu/economic profiles Demographics* Tunica Mississippi United States Total Popula on, 2017 (Popula on Es mates) 10,024 2,984,100 325,719,178
County Economic Profile Coahoma County, MS extension.msstate.edu/economic profiles
 County Economic Profile Coahoma County, MS extension.msstate.edu/economic profiles Demographics* Coahoma Mississippi United States Total Popula on, 2017 (Popula on Es mates) 23,154 2,984,100 325,719,178
County Economic Profile Bolivar County, MS extension.msstate.edu/economic profiles
 County Economic Profile Bolivar County, MS extension.msstate.edu/economic profiles Demographics* Bolivar Mississippi United States Total Popula on, 2017 (Popula on Es mates) 31,945 2,984,100 325,719,178
County Economic Profile Lamar County, MS extension.msstate.edu/economic profiles
 County Economic Profile Lamar County, MS extension.msstate.edu/economic profiles Demographics* Lamar Mississippi United States Total Popula on, 2017 (Popula on Es mates) 61,374 2,984,100 325,719,178 Percent
O awa County, MI. Economy Overview. Michigan Economic Development Corpora on. 300 N. Washington Square, Lower Level Lansing, Michigan 48913
 O awa County, MI Michigan Economic Development Corpora on 300 N. Washington Square, Lower Level Lansing, Michigan 48913 Emsi Q4 2018 Data Set www.economicmodeling.com Contents. Economy........ Overview.........................................................................................
CHAPTER I. Contextual background on Moldova. A. Historical and poli cal context. Table 2: General facts about Moldova
 CHAPTER I Contextual background on Moldova A. Historical and poli cal context Moldova is a small, landlocked country situated towards the east of the UNECE region, bordering Romania and Ukraine. It has
County Economic Profile Clarke County, MS extension.msstate.edu/economic profiles
 County Economic Profile Clarke County, MS extension.msstate.edu/economic profiles Demographics* Clarke Mississippi United States Total Popula on, 2017 (Popula on Es mates) 15,828 2,984,100 325,719,178
Allegan County, MI. Economy Overview. Michigan Economic Development Corpora on. 300 N. Washington Square, Lower Level Lansing, Michigan 48913
 Allegan County, MI Michigan Economic Development Corpora on 300 N. Washington Square, Lower Level Lansing, Michigan 48913 Emsi Q4 2018 Data Set www.economicmodeling.com Contents. Economy........ Overview.........................................................................................
County Economic Profile Smith County, MS extension.msstate.edu/economic profiles
 County Economic Profile Smith County, MS extension.msstate.edu/economic profiles Demographics* Smith Mississippi United States Total Popula on, 2017 (Popula on Es mates) 16,078 2,984,100 325,719,178 Percent
Bucks County, PA. Economy Overview. Bucks County Workforce Development Board, Inc Veterans Highway Bristol, Pennsylvania 19007
 Bucks County, PA Bucks County Workforce Development Board, Inc. 1268 Veterans Highway Bristol, Pennsylvania 19007 Emsi Q4 2018 Data Set www.economicmodeling.com Contents. Economy........ Overview.........................................................................................
The Fundamentals of Investing Vocabulary List
 Page 14 2.4.4.E1 The Fundamentals of Investing Vocabulary List TERM DEFINITION 1 Bond A form of lending to a company or the government (city, state, or federal) 2 Brokerage firm Facilitates the buying
Community Bankers for Compliance 2019
 Community Bankers for Compliance 2019 Providing prac cal and user friendly compliance techniques rela ng to all areas of compliance. Sponsored By:, IN February 12 & 13, 2019 May 7 & 8, 2019 August 6 &
Deputy Finance Director Recruitment
 Deputy Finance Director Recruitment The City of Cape Girardeau, serving a growing popula on of 39,000, is succession planning for their Finance Director. The city is located between St. Louis and Memphis
Superior Trade Zone. Economy Overview. Lake Superior Community Partnership. 501 S. Front Street Marque e, Michigan 49855
 Superior Trade Zone Lake Superior Community Partnership 501 S. Front Street Marque e, Michigan 49855 Emsi Q3 2018 Data Set www.economicmodeling.com Contents. Economy........ Overview.........................................................................................
Economy Overview. Ellis County, TX. Emsi Q Data Set
 Ellis County, TX Emsi Q3 2018 Data Set www.economicmodeling.com Contents. Economy........ Overview......................................................................................... 1... Historic.......&..
Credit Card Offer Scavenger Hunt
 Page 11 1.4.1.A1 Credit Card Offer Scavenger Hunt Total Points Earned Name 16 Total Points Possible Date Percentage Class Step 1: Find and highlight each of the vocabulary words in the table below in the
China UN Prac-cal Manual on Transfer Pricing for Developing Countries Chapter 10.3 (May, 2013)
") China UN Prac-cal Manual on Transfer Pricing for Developing Countries Chapter 10.3 (May, 2013) Richard T. Ainsworth Director, Graduate Tax Program, BU School of Law October 24, 2014 Room 209 What has been
China UN Prac-cal Manual on Transfer Pricing for Developing Countries Chapter 10.3 (May, 2013) Richard T. Ainsworth Director, Graduate Tax Program, BU School of Law October 24, 2014 Room 209 What has been
The Advisors Inner Circle Fund II
 The Advisors Inner Circle Fund II A Class Shares PROSPECTUS June 1, 2018 Frost Total Return Bond Fund (FAJEX) Frost Credit Fund (FCFBX) Investment Adviser: Frost Investment Advisors, LLC The U.S. Securi
Burnett County Workforce Profile
 Percentage of working-age population aged 60 years and older in 2020 23.2% - 30.0% 30.1% - 40.0% 40.1% - 49.3% State average 29.4% Office of Economic Advisors OEA-10599-P Beverly Gehrke 15618 Windrose
Palo Pinto County, TX
 Palo Pinto County, TX Emsi Q3 2018 Data Set www.economicmodeling.com Contents. Economy........ Overview......................................................................................... 1... Historic.......&..
Industry Snapshot. Workforce Alliance of the North Bay. Emsi Q Data Set. September Emsi Q Data Set
 Industry Snapshot Emsi Q3 2018 Data Set September 2018 Workforce Alliance of the North Bay 1546 First Street Napa, California 94559 (707) 253-4697 Emsi Q3 2018 Data Set www.economicmodeling.com Page 1/7
Economy Overview. Collin County, TX. Emsi Q Data Set
 Collin County, TX Emsi Q3 2018 Data Set www.economicmodeling.com Contents. Economy........ Overview......................................................................................... 1... Historic.......&..
3 New Hampshire ZIPs
 3 New Hampshire ZIPs New Hampshire Economic Development 172 Pembroke Rd Concord, New Hampshire 03301 Emsi Q4 2018 Data Set www.economicmodeling.com Contents. Economy........ Overview.........................................................................................
Credit Reports and Scores
 Credit Reports and Scores Advanced Level The Importance of a Credit History for Obtaining Credit Credit refers to borrowing. You have used credit if you receive money, goods, or services in exchange for
Economy Overview. Hunt County, TX. Emsi Q Data Set
 Hunt County, TX Emsi Q4 2018 Data Set www.economicmodeling.com Contents. Economy........ Overview......................................................................................... 1... Historic.......&..
UPSTATE NEW YORK REGIONAL NO. 1, ISSUE NO Baby-Boom Retirements and Emerging Labor Market Pressures Richard Deitz
 UPSTATE NEW YORK REGIONAL REVIEW VOLUME NO. 1, ISSUE NO. 1 2006 Baby-Boom Retirements and Emerging Labor Market Pressures Richard Deitz As the baby-boom generation begins to retire, employers in upstate
Economy Overview. Greater Lima Region. Emsi Q Data Set
 Greater Lima Region Emsi Q3 2017 Data Set www.economicmodeling.com Contents. Economy........ Overview......................................................................................... 1... Historic.......&..
NORTH CAROLINA EDUCATION LOTTERY POPULAR ANNUAL FINANCIAL REPORT FISCAL YEAR ENDED JUNE 30, 2015
 NORTH CAROLINA EDUCATION LOTTERY POPULAR ANNUAL FINANCIAL REPORT FISCAL YEAR ENDED JUNE 30, 2015 ABOUT THE POPULAR ANNUAL FINANCIAL REPORT The North Carolina Educa on Lo ery (NCEL) finance division is
2 North San Joaquin Valley Index. Prepared by: Jeffrey A. Michael and Thomas E. Pogue
 Prepared by: Jeffrey A. Michael and Thomas E. Pogue This report has been prepared by the Center for Business and Policy Research at the University of the Pacific. This publica on was supported by JP Morgan
The Many Factors that Affect the Success of Regulatory Mechanisms Designed to Foster Investments in Energy Efficiency
 The Many Factors that Affect the Success of Regulatory Mechanisms Designed to Foster Investments in Energy Efficiency Jay Zarnikau Fron-er Associates and UT- Aus-n LBJ School of Public Affairs and Division
Table of Contents. Long Range Financial Plan 27. Report Introduction 1
 Table of Contents Report Introduction 1 Water/Wastewater Long Range Financial Planning 2 Principles of Financial Sustainability 4 Importance of a Long Range Financial Plan 5 General Approach to Preparing
Economic and Market Review Fourth Quarter 2017
 Redstone Advisors Tax law is like the world s biggest game of chess with all sorts of weird conundrums about ethics and civics and consent of the governed built in. David Foster Wallace Financial markets
Population by Year. Ray County, Missouri 23,712 23,541. Population by Age. Ray County, Missouri 27% 27% 22%
 emographics, popula on has decreased by 3 percent since 2 and its popula on now stands at 22,754. or more informa on on Ray County, please visit www.raycountymo.com. Popula on by Year Population by Year
Economy Overview. Denton County, TX. Emsi Q Data Set
 Denton County, TX Emsi Q1 2018 Data Set www.economicmodeling.com Contents. Economy........ Overview......................................................................................... 1... Historic.......&..
Communica on with Local Communi es. Hiring Local Manpower and Resources. Office Open in Belgrade
 Defining and adopting the Stakeholder Engagement Plan (SEP) Rakita has defined the Stakeholder Engagement Plan (SEP), which represents the base-line for communica on and cooperaon with target audiences
Occupa on Overview. Bakersfield College. Emsi Q Data Set. September Emsi Q Data Set
 Occupa on Overview Emsi Q3 2017 Data Set September 2017 Bakersfield College 1801 Panorama Drive Bakersfield, California 93305 661.395.4921 Emsi Q3 2017 Data Set www.economicmodeling.com Page 1/10 Parameters
City of Guelph. Financial Condi on Assessment. September 24, 2015
 City of Guelph Financial Condi on Assessment September 24, 2015 62 Table of Contents Exeuctive Summary Introduction 1 Trend Analysis 2 Peer Analysis 2 Questions to Consider 3 Key Indicators 4 Section 1
BREAKING BARRIERS YOUTH EMPLOYMENT TRENDS. Quarterly Employment Report. November 2018
 BREAKING BARRIERS Quarterly Employment Report November 2018 VIEW REPORT ARCHIVE Young people access financial services at roughly half the rate of adults. This impacts on their ability to grow an asset
Economy Overview. Navarro County, TX. Emsi Q Data Set
 Economy Overview Navarro County, TX Emsi Q3 2017 Data Set www.economicmodeling.com Economy Overview Contents. Economy........ Overview.........................................................................................
Texas: Demographically Different
 FEDERAL RESERVE BANK OF DALLAS ISSUE 3 99 : Demographically Different A s the st century nears, demographic changes are reshaping the U.S. economy. The largest impact is coming from the maturing of baby
Emergency Loan Packet For University Employees
 Emergency Loan Packet For University Employees Instruc ons 1. Complete forms 1, 2, and 3 (Consent Form, Condi ons and Applica on, Memorandum to Supervisor) and have supervisor sign Form 3: Memorandum to
Review & Retain Important Informa on regarding Changes to Merrill Lynch Re rement Accounts Not Enrolled in a Merrill Lynch Investment Advisory Program
 Date: May 2017 Review & Retain Important Informa on regarding Changes to Merrill Lynch Re rement Accounts Not Enrolled in a Merrill Lynch Investment Advisory Program We are wri ng to update you on planned
Parent Informa on Worksheet Yale Law School Financial Aid Applica on and Scholarship Tool (FAAST)
") -2018 Parent Informa on Worksheet Yale Law School Financial Aid Applica on and Scholarship Tool (FAAST) FAAST : Asked Ques ons Q Why is parent data required? As a need based financial aid ins tu on, it
-2018 Parent Informa on Worksheet Yale Law School Financial Aid Applica on and Scholarship Tool (FAAST) FAAST : Asked Ques ons Q Why is parent data required? As a need based financial aid ins tu on, it
Industry Snapshot. Health Care
 Industry Snapshot Health Care Emsi Q2 2018 Data Set April 2018 Workforce Solutions for North Central Texas is an equal opportunity employer/program. Auxiliary aids and services are available upon request
YOUR INSURED FUNDS WHERE CAN I FIND MORE INFORMATION? Call toll-free , op on 2
 WHERE CAN I FIND MORE INFORMATION? Call toll-free 1-800-755-1030, op on 2 Read more about NCUA Share Insurance at: MyCreditUnion.gov/shareinsurance Calculate share insurance coverage Use NCUA s Share Insurance