2017 ECONOMIC AND WORKFORCE PROFILE Grant County
|
|
|
- Rosalyn Green
- 5 years ago
- Views:
Transcription


1 2017 ECONOMIC AND WORKFORCE PROFILE Grant County STATE OF WISCONSIN DETI GRT-P (R. 3/2018)

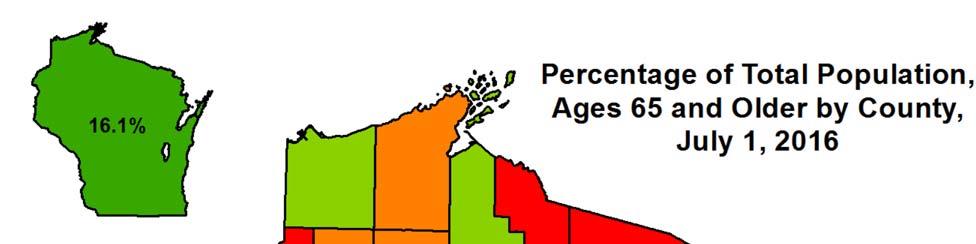
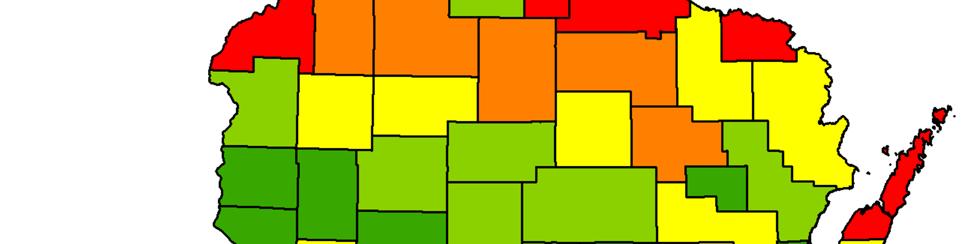
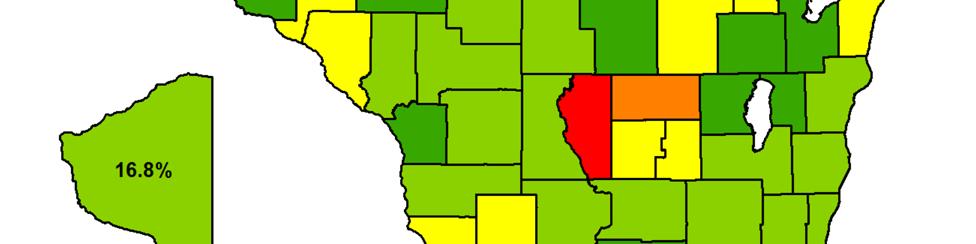
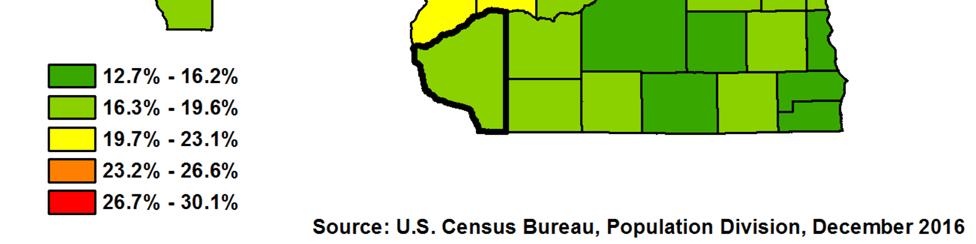
2 Percentage of Total Popula on, Ages 65 and Older
3 Wisconsin now has more people employed and more private sector jobs than at any me in its history. As of this wri ng, the state added 56,100 jobs during 2016 and Employment increased in almost all industry sectors, with prominent gains in construc on, manufacturing, and healthcare. Wisconsin s unemployment rate is near lows not seen in a genera on, decreasing from 4.3 percent in January 2016 to 3.2 percent in December 2017, on a seasonally adjusted basis. Wisconsin faces a worker quan ty challenge. The number of re ring Baby Boomers nearly match the influx of new workers, resul ng in a slow growing workforce and placing constraints on the ability by employers across all industries to hire talent. Many businesses report that the lack of available workers has hindered expansion and, in some cases, even curtailed their ability to meet current product orders. The blue line, orange line graph to the right illustrates the situa on in Wisconsin and other upper Midwest states. While Wisconsin's popula on will con nue to grow over the next twenty years, the workforce faces serious constraints. The labor force par cipa on rate (LFPR), defined as the labor force (sum of employed and unemployed) divided by the total popula on ages 16 and older, measures the popula on's engagement in the workforce and serves as an indicator in determining how Wisconsin's workforce will be constrained. The overall LFPR peaked in the late 1990s and has been trending lower ever since. The LFPR of peaks across Source: Local Area Unemployment Sta s cs, Bureau of Labor Sta s cs the age cohort at over ninety percent and decreases rapidly into the single digits by age seventy. Baby Boomers have and con nue to exit with respect to their LFPR. The mass of Baby Boomers has moved into the work lifecycle stage of declining LFPRs, with the tail end of the cohort turning 55 in Source: Bureau of Labor Sta s cs A recent development is the change in the labor force par cipa on rate trend. The LFPR of older workers (those aged 55 years and older) has turned upwards, resul ng in fla ening of the overall LFPR. More boomers are staying in the workforce longer, which may portend higher workforce growth over the coming years. Due to the size of the Baby Boomer cohort and the sensi vity of the LFPR to workforce growth rates, a rela vely small change in the LFPR of older workers would significantly boost the number in the workforce. 1


4 Popula on and Demographics Source: Demographic Services Center, Wisconsin Department of Administra on Grant County added an es mate of 1,899 residents from April 2010 to January 2016, ranking it as the 27th largest county in the state. The rate of increase 3.7 percent, is higher than the state increase of 1.5 percent, but just shy of the na on s rate of growth of 4.8 percent. The table above lists Grant County s ten most populous municipali es as of January Grant County s popula on is rela vely concentrated in the City of Pla eville, which accounts for 24.1 percent of the county s popula on. Together, the ten largest municipali es account for 59.4 percent of the county s popula on. Grant County is home to one of Wisconsin s state prisons, a facility for adult male offenders located in Boscobel. Wisconsin Secure Program Facility (WSPF) was opened in November of 1999 and as of July 1, 2016 there were 465 inmates housed at WSPF. WSPF employs more than 260 individuals. Prisoners and oth Components of Popula on Change er ins tu onalized persons are counted in the popula on numbers reported above, however they are not tallied for unemployment rate computa on purposes. Popula on change is driven by two factors: natural change and migra on. A natural increase of the popula on occurs when there are more births than deaths. Migra on affects net popula on change in an area posi vely when the number of people moving into the area is larger than the number of people moving out. In the case of Grant County, growth comes from both factors. As shown in the chart to the right, Grant s natural increase was 0.6 percent and migra on was 3.1 percent. While the na on s migra on rate was 2.8 percent. Source: Demographic Services Center, Wisconsin Department of Administra on 2
5 Labor Force Dynamics The chart above Source: Local Area Unemployment Sta s cs, Bureau of Labor Sta s cs plots the monthly rates of unemployment for Grant County, Wisconsin and the US over the last 17 years. The rate of unemployment climbed during the early 2000s recession to levels that were, on average, lower for the na on and higher for the state, rela ve to the previous (1990s) recession. The recovery a er the early 2000s recession was a rela vely weak recovery in terms of job crea on. As the chart shows, the employment recovery between 2003 and 2007 did not result in a significant decline in the unemployment rate. This is explained by a low rate of job crea on in the early phase of the upturn. This increase in job crea on was interrupted by the Great Recession, which was characterized by a rapid contrac on of jobs across regions, industrial sectors and demographic groups. Source: Local Area Unemployment Sta s cs, Bureau of Labor Sta s cs The dynamics of unemployment in Grant County compared to the state and na on have followed state and na onal trends in general, although fluctua ng more intensely during the first phase of the "great recession." The labor force is the sum of employed and unemployed. The chart to the le shows the annual labor force in Grant County. 3


6 Industry Employment and Wages Jobs and wages are the lifeblood of any economy. The more well paying jobs in a region, the be er the prospects for its economy; and the more diverse the county s industry sectors, the more insulated it is from major losses. The largest industry sectors in Grant County are educa on and health, and trade, transporta on, and u li es, with employment shares of 26.8 and 19.8 percent, and payroll shares of 30.3 and 16.2 percent, respec vely. The table at the bo om shows the average annual wages by sector in Grant County and Wisconsin, including the county s share of annual wages by industry rela ve to the state and the annual change in Grant County. Grant County s annual average wage was $35,802 in 2016, which represents 77.8 percent of the statewide average of $46,031. The highest paying sector in 2016 was financial ac vi es, with an average wage of $49,139. Financial ac vi es is followed by manufacturing, with an average annual wage of $48,204 and construc on ($42,223). Grant County s lowest paying sector in 2016 was leisure and hospitality, with an average annual wage of $10,581, 62.2 percent of the statewide aver age. Many jobs in the leisure and hospitality industry are entry level and part me and/ or seasonal. 4
7 Employment Projec ons In addi on to looking at the current state of the economy in Grant County, it is useful to look at projec ons of how employment in the area is expected to change. What follows are projec ons of employment changes by industry sector and by occupa on. Please note that these projec ons are for the collec ve coun es of Grant, Green, Iowa, Lafaye e, Richland, and Rock. Together, these six coun es form the Southwest Wisconsin Workforce Development Area (WDA). These projec ons use informa on from the Quarterly Census of Employment and Wages (QCEW) program, including unpublished data from the Bureau of Labor Sta s cs (BLS) as well as data from the Census Bureau s Current Popula on Survey (CPS). While these projec ons consider an cipated changes in Wisconsin's economy, please note that unan cipated events may affect the accuracy of the projec on. In 2014, the area s three largest industry sectors by jobs were the Educa on & Health Services; Trade, Transporta on, & U li es; and Manufacturing. Together, these sectors represented 56.7 percent of jobs in 2014 and are expected to be the three largest industries in The Educa on & Health Services sector is projected to gain more jobs than the other two leading sectors. Overall, these three sectors are projected to add 5,554 jobs by 2024, a 3.7 percent increase from The share of total jobs by industry sector is projected to change li le through The Manufacturing sector's numerical growth of 559 appears to be somewhat nominal given the size of the region however readers should note that while the numerical growth manufacturing employment is slight, there will be many opportuni es for a new genera on of workers in manufacturing because re rements in the sector are going to outpace employment declines due to economic and demographic shi s. This will con nue into the foreseeable future. The Educa on & Health Services sector is projected to have the largest numeric gain in jobs with 3,554 addi onal jobs in 2024, a 9.4 percent gain from The Educa on & Health Services sector is one of three sectors in the WDA with growth rates in excess of nine percent. All sectors, except for Government and Informa on, are projected to gain jobs by
8 Employment ProjecƟons Source: Office of Economic Advisors, Wisconsin Department of Workforce Development, September 2015 In 2014, the area's largest occupa on group was Office & Administra ve Support with 20,956 jobs, 13.8 percent of total employment. Of the twenty two occupa on groups, the top five together accounted for 51.8 percent of jobs. All five of these groups are projected to remain in the top five in 2024 and their share of total employment is projected to decline slightly, to 50.5 percent of jobs. The share of total jobs by occupa onal group is projected to change li le through However, four of the top five groups, Office & Administra ve Support; Produc on; Educa on, Training & Library and Sales & Related, are projected to experience slight declines in employment share. The Healthcare Prac oners group is projected to have the largest gain in share, with a rise from 4.7 percent to 5.2 percent over the projec on period. The largest numeric increase in jobs will occur in the Healthcare Prac oners with a net increase of 1,193 jobs by 2024, a 17 percent gain. The Personal Care & Services group is projected to have the largest propor onal gain, increasing by 20 percent over the period. The Arts, Entertainment & Media occupa on group is projected to experience the most nominal of decreases in employment by 2024, sheading nine jobs. All other occupa on groups are projected to add jobs. The graph on the top of the next page displays Southwest Wisconsin WDA's job base by major industry sector and outlines the age distribu on of its job holders. The graph examines job holders age based upon jobs located in the eight county area without regard to where the worker lives. 6


9 Readers may no ce that the age bands can be quite different industry to industry. Two factors that shape this composi on are labor availability and the occupa onal composi on within the industries. Labor availability is dictated by the overarching age composi on of the popula on and the likelihood of par cipa on in the labor force. The highest par cipa on is likely to occur between the ages of the mid twen es to late fi ies/early six es. Industry age is determined by labor availability and occupa onal composi on. For all industries combined, the largest group of workers are in the age group. Over me, the share of the workforce in this cohort will shrink as baby boomers age. The aging demographics will lead to growth in the and age cohorts as shares of total popula on. Age composi on, however, varies between industries based on occupa onal composi on. Occupa onal composi on is influenced by numerous factors such as a job holder s life stage, experience, educa on, and training. In short, industries that heavily rely on entry level occupa ons will be younger than industries made up of occupa ons that require highly educated workers with years of experiences. In terms of an aged workforce, coming in first, second, and third are Public Administra on (56.5 percent 45 or older), Financial Ac vi es (52.9 percent 45 or older) and Educa on & Health (51.9 percent 45 or older). The large share of older workers may have been par ally caused by the great recession and its a ermath. The recession made layoffs necessary, and layoffs are o en determined by seniority. However, the aging workforce is primarily caused by an aging popula on. Therefore, a rela vely old labor force may become an issue. For More Informa on: William Brockmiller Regional Economist Southwest WDA Phone: (608) william.brockmiller@dwd.wisconsin.gov 7
2017 ECONOMIC AND WORKFORCE PROFILE Monroe County
 2017 ECONOMIC AND WORKFORCE PROFILE Monroe County STATE OF WISCONSIN DETI-17957-MON-P (R. 3/2018) Percentage of Total Popula on, Ages 65 and Older Wisconsin now has more people employed and more private
2017 ECONOMIC AND WORKFORCE PROFILE Buffalo County
 2017 ECONOMIC AND WORKFORCE PROFILE Buffalo County STATE OF WISCONSIN DETI-17957-BUF-P (R. 3/2018) Percentage of Total Popula on, Ages 65 and Older Wisconsin now has more people employed and more private
2017 ECONOMIC AND WORKFORCE PROFILE Vernon County
 2017 ECONOMIC AND WORKFORCE PROFILE Vernon County STATE OF WISCONSIN DETI-17957-VRN-P (R. 3/2018) Percentage of Total Popula on, Ages 65 and Older Wisconsin now has more people employed and more private
2017 ECONOMIC AND WORKFORCE PROFILE Douglas County
 2017 ECONOMIC AND WORKFORCE PROFILE Douglas County STATE OF WISCONSIN DETI-17957-DOU-P (R. 3/2018) Percentage of Total Popula on, Ages 65 and Older Wisconsin now has more people employed and more private
2017 ECONOMIC AND WORKFORCE PROFILE Walworth County
 2017 ECONOMIC AND WORKFORCE PROFILE Walworth County STATE OF WISCONSIN DETI-17957-WLW-P (R. 3/2018) Percentage of Total Popula on, Ages 65 and Older Wisconsin now has more people employed and more private
2017 ECONOMIC AND WORKFORCE PROFILE Brown County
 2017 ECONOMIC AND WORKFORCE PROFILE Brown County STATE OF WISCONSIN DETI-17957-BRW-P (R. 3/2018) Percentage of Total Popula on, Ages 65 and Older Wisconsin now has more people employed and more private
2017 ECONOMIC AND WORKFORCE PROFILE Florence County
 2017 ECONOMIC AND WORKFORCE PROFILE Florence County STATE OF WISCONSIN DETI-17957-FLO-P (R. 3/2018) Percentage of Total Popula on, Ages 65 and Older Wisconsin now has more people employed and more private
2017 ECONOMIC AND WORKFORCE PROFILE Winnebago County
 2017 ECONOMIC AND WORKFORCE PROFILE Winnebago County STATE OF WISCONSIN DETI-17957-WIN-P (R. 3/2018) Percentage of Total Popula on, Ages 65 and Older Wisconsin now has more people employed and more private
2017 ECONOMIC AND WORKFORCE PROFILE Waukesha County
 2017 ECONOMIC AND WORKFORCE PROFILE Waukesha County STATE OF WISCONSIN DETI-17957-WAK-P (R. 3/2018) Percentage of Total Popula on, Ages 65 and Older Wisconsin now has more people employed and more private
2017 ECONOMIC AND WORKFORCE PROFILE Kewaunee County
 2017 ECONOMIC AND WORKFORCE PROFILE Kewaunee County STATE OF WISCONSIN DETI-17957-KEW-P (R. 3/2018) Percentage of Total Popula on, Ages 65 and Older Wisconsin now has more people employed and more private
2017 ECONOMIC AND WORKFORCE PROFILE Wood County
 2017 ECONOMIC AND WORKFORCE PROFILE Wood County STATE OF WISCONSIN DETI-17957-WOD-P (R. 3/2018) Percentage of Total Popula on, Ages 65 and Older Wisconsin now has more people employed and more private
2017 ECONOMIC AND WORKFORCE PROFILE Green Lake County
 2017 ECONOMIC AND WORKFORCE PROFILE Green Lake County STATE OF WISCONSIN DETI-17957-GRL-P (R. 3/2018) Percentage of Total Popula on, Ages 65 and Older Wisconsin now has more people employed and more private
2017 ECONOMIC AND WORKFORCE PROFILE Washington County
 2017 ECONOMIC AND WORKFORCE PROFILE Washington County STATE OF WISCONSIN DETI-17957-WGT-P (R. 3/2018) Percentage of Total Popula on, Ages 65 and Older Wisconsin now has more people employed and more private
2017 ECONOMIC AND WORKFORCE PROFILE Clark County
 2017 ECONOMIC AND WORKFORCE PROFILE Clark County STATE OF WISCONSIN DETI-17957-CLK-P (R. 3/2018) Percentage of Total Popula on, Ages 65 and Older Wisconsin now has more people employed and more private
2017 ECONOMIC AND WORKFORCE PROFILE Dodge County
 2017 ECONOMIC AND WORKFORCE PROFILE Dodge County STATE OF WISCONSIN DETI-17957-DOD-P (R. 3/2018) Percentage of Total Popula on, Ages 65 and Older Wisconsin now has more people employed and more private
2017 ECONOMIC AND WORKFORCE PROFILE Sauk County
 2017 ECONOMIC AND WORKFORCE PROFILE Sauk County STATE OF WISCONSIN DETI-17957-SAK-P (R. 3/2018) Percentage of Total Popula on, Ages 65 and Older Wisconsin now has more people employed and more private
2017 ECONOMIC AND WORKFORCE PROFILE Pierce County
 2017 ECONOMIC AND WORKFORCE PROFILE Pierce County STATE OF WISCONSIN DETI-17957-PRC-P (R. 3/2018) Percentage of Total Popula on, Ages 65 and Older Wisconsin now has more people employed and more private
2017 ECONOMIC AND WORKFORCE PROFILE Dane County
 2017 ECONOMIC AND WORKFORCE PROFILE Dane County STATE OF WISCONSIN DETI-17957-DAN-P (R. 3/2018) Percentage of Total Popula on, Ages 65 and Older Wisconsin now has more people employed and more private
2017 ECONOMIC AND WORKFORCE PROFILE St. Croix County
 2017 ECONOMIC AND WORKFORCE PROFILE St. Croix County STATE OF WISCONSIN DETI-17957-STC-P (R. 3/2018) Percentage of Total Popula on, Ages 65 and Older Wisconsin now has more people employed and more private
Rock County DETI RCK-P (N. 3/2016)
") Rock County DETI-17957-RCK-P (N. 3/2016) 2015 Rock County Economic and Workforce Profile Na onal and State Economic Outlook Robust economic growth a er the Great Recession remains an cipated. The recession
Rock County DETI-17957-RCK-P (N. 3/2016) 2015 Rock County Economic and Workforce Profile Na onal and State Economic Outlook Robust economic growth a er the Great Recession remains an cipated. The recession
2017 ECONOMIC AND WORKFORCE PROFILE Chippewa County
 2017 ECONOMIC AND WORKFORCE PROFILE Chippewa County STATE OF WISCONSIN DETI-17957-CHP-P (R. 3/2018) Percentage of Total Popula on, Ages 65 and Older Wisconsin now has more people employed and more private
2017 ECONOMIC AND WORKFORCE PROFILE Barron County
 2017 ECONOMIC AND WORKFORCE PROFILE Barron County STATE OF WISCONSIN DETI-17957-BRN-P (R. 3/2018) Percentage of Total Popula on, Ages 65 and Older Wisconsin now has more people employed and more private
Columbia County DETI COL-P (N. 3/2016)
") Columbia County DETI-17957-COL-P (N. 3/2016) Average Household Income By County Na onal and State Economic Outlook Robust economic growth a er the Great Recession remains an cipated. The recession ended
Columbia County DETI-17957-COL-P (N. 3/2016) Average Household Income By County Na onal and State Economic Outlook Robust economic growth a er the Great Recession remains an cipated. The recession ended
Jackson County DETI JAK-P (N. 3/2016)
") Jackson County DETI-17957-JAK-P (N. 3/2016) 2015 Jackson County Economic and Workforce Profile Na onal and State Economic Outlook Robust economic growth a er the Great Recession remains an cipated. The
Jackson County DETI-17957-JAK-P (N. 3/2016) 2015 Jackson County Economic and Workforce Profile Na onal and State Economic Outlook Robust economic growth a er the Great Recession remains an cipated. The
Dane County DETI DAN-P DAN (N. 3/2016)
") Dane County DETI-17957-DAN-P DAN (N. 3/2016) Average Household Income By County Na onal and State Economic Outlook Robust economic growth a er the Great Recession remains an cipated. The recession ended
Dane County DETI-17957-DAN-P DAN (N. 3/2016) Average Household Income By County Na onal and State Economic Outlook Robust economic growth a er the Great Recession remains an cipated. The recession ended
Burnett County DETI BNT-P (N. 3/2016)
") Burnett County DETI-17957-BNT-P (N. 3/2016) Average Household Income By County Na onal and State Economic Outlook Robust economic growth a er the Great Recession remains an cipated. The recession ended
Burnett County DETI-17957-BNT-P (N. 3/2016) Average Household Income By County Na onal and State Economic Outlook Robust economic growth a er the Great Recession remains an cipated. The recession ended
Kenosha County DETI KEN-P (N. 3/2016)
") Kenosha County DETI-17957-KEN-P (N. 3/2016) Average Household Income By County Na onal and State Economic Outlook Robust economic growth a er the Great Recession remains an cipated. The recession ended
Kenosha County DETI-17957-KEN-P (N. 3/2016) Average Household Income By County Na onal and State Economic Outlook Robust economic growth a er the Great Recession remains an cipated. The recession ended
Racine County DETI RAC-P (N. 3/2016)
") Racine County DETI-17957-RAC-P (N. 3/2016) Average Household Income By County Na onal and State Economic Outlook Robust economic growth a er the Great Recession remains an cipated. The recession ended
Racine County DETI-17957-RAC-P (N. 3/2016) Average Household Income By County Na onal and State Economic Outlook Robust economic growth a er the Great Recession remains an cipated. The recession ended
Price County DETI PRI-P P (N. 3/2016)
") Price County DETI-17957-PRI-P P (N. 3/2016) Average Household Income By County Na onal and State Economic Outlook Robust economic growth a er the Great Recession remains an cipated. The recession ended
Price County DETI-17957-PRI-P P (N. 3/2016) Average Household Income By County Na onal and State Economic Outlook Robust economic growth a er the Great Recession remains an cipated. The recession ended
Eau Claire County DETI ECL-P ECL (N. 3/2016)
") Eau Claire County DETI-17957-ECL-P ECL (N. 3/2016) Average Household Income By County Na onal and State Economic Outlook Robust economic growth a er the Great Recession remains an cipated. The recession
Eau Claire County DETI-17957-ECL-P ECL (N. 3/2016) Average Household Income By County Na onal and State Economic Outlook Robust economic growth a er the Great Recession remains an cipated. The recession
Outagamie County DETI OUT-P (N. 3/2016)
") Outagamie County DETI-17957-OUT-P (N. 3/2016) Average Household Income By County Na onal and State Economic Outlook Robust economic growth a er the Great Recession remains an cipated. The recession ended
Outagamie County DETI-17957-OUT-P (N. 3/2016) Average Household Income By County Na onal and State Economic Outlook Robust economic growth a er the Great Recession remains an cipated. The recession ended
Economy Overview. Eagle County, CO. Emsi Q Data Set
 Eagle County, CO Emsi Q4 2018 Data Set www.economicmodeling.com Contents. Economy........ Overview......................................................................................... 1... Historic.......&..
Guernsey Economic Overview
 Guernsey Economic Overview Issue date: 19 May 17 The Guernsey Economic Overview brings together the most recent official Guernsey sta s cs and provides an overview of economic condi ons in Guernsey and
County Economic Profile Lee County, MS extension.msstate.edu/economic profiles
 County Economic Profile Lee County, MS extension.msstate.edu/economic profiles Demographics* Lee Mississippi United States Total Popula on, 2017 (Popula on Es mates) 84,933 2,984,100 325,719,178 Percent
Pennington County, SD
 Pennington County, SD 730 E. Watertown Street, Suite 102 Rapid City, South Dakota 57701 Emsi Q2 2018 Data Set www.economicmodeling.com Contents. Economy........ Overview.........................................................................................
Economy Overview. Summit County, CO. Emsi Q Data Set
 Summit County, CO Emsi Q4 2018 Data Set www.economicmodeling.com Contents. Economy........ Overview......................................................................................... 1... Historic.......&..
14 Coun es. Economy Overview. West Virginia Department of Commerce Capitol Complex, Bldg. 6, Room 525 Charleston, West Virginia 25305
 14 Coun es West Virginia Department of Commerce Capitol Complex, Bldg. 6, Room 525 Charleston, West Virginia 25305 Emsi Q4 2018 Data Set www.economicmodeling.com Contents. Economy........ Overview.........................................................................................
Economy Overview. Pitkin County, CO. Emsi Q Data Set
 Pitkin County, CO Emsi Q4 2018 Data Set www.economicmodeling.com Contents. Economy........ Overview......................................................................................... 1... Historic.......&..
County Economic Profile Copiah County, MS extension.msstate.edu/economic profiles
 County Economic Profile Copiah County, MS extension.msstate.edu/economic profiles Demographics* Copiah Mississippi United States Total Popula on, 2017 (Popula on Es mates) 28,516 2,984,100 325,719,178
Economy Overview. Grand County, CO. Emsi Q Data Set
 Grand County, CO Emsi Q4 2018 Data Set www.economicmodeling.com Contents. Economy........ Overview......................................................................................... 1... Historic.......&..
County Economic Profile Marion County, MS extension.msstate.edu/economic profiles
 County Economic Profile Marion County, MS extension.msstate.edu/economic profiles Demographics* Marion Mississippi United States Total Popula on, 2017 (Popula on Es mates) 25,069 2,984,100 325,719,178
County Economic Profile Jasper County, MS extension.msstate.edu/economic profiles
 County Economic Profile Jasper County, MS extension.msstate.edu/economic profiles Demographics* Jasper Mississippi United States Total Popula on, 2017 (Popula on Es mates) 16,582 2,984,100 325,719,178
County Economic Profile Clarke County, MS extension.msstate.edu/economic profiles
 County Economic Profile Clarke County, MS extension.msstate.edu/economic profiles Demographics* Clarke Mississippi United States Total Popula on, 2017 (Popula on Es mates) 15,828 2,984,100 325,719,178
County Economic Profile Monroe County, MS extension.msstate.edu/economic profiles
 County Economic Profile Monroe County, MS extension.msstate.edu/economic profiles Demographics* Monroe Mississippi United States Total Popula on, 2017 (Popula on Es mates) 35,872 2,984,100 325,719,178
County Economic Profile Leflore County, MS extension.msstate.edu/economic profiles
 County Economic Profile Leflore County, MS extension.msstate.edu/economic profiles Demographics* Leflore Mississippi United States Total Popula on, 2017 (Popula on Es mates) 29,223 2,984,100 325,719,178
County Economic Profile Bolivar County, MS extension.msstate.edu/economic profiles
 County Economic Profile Bolivar County, MS extension.msstate.edu/economic profiles Demographics* Bolivar Mississippi United States Total Popula on, 2017 (Popula on Es mates) 31,945 2,984,100 325,719,178
County Economic Profile Tunica County, MS extension.msstate.edu/economic profiles
 County Economic Profile Tunica County, MS extension.msstate.edu/economic profiles Demographics* Tunica Mississippi United States Total Popula on, 2017 (Popula on Es mates) 10,024 2,984,100 325,719,178
Quarterly Labour Market Report. August 2017
 Quarterly Labour Market Report August 2017 MB14363 August 2017 Ministry of Business, Innovation and Employment (MBIE) Hikina Whakatutuki - Lifting to make successful MBIE develops and delivers policy,
County Economic Profile Coahoma County, MS extension.msstate.edu/economic profiles
 County Economic Profile Coahoma County, MS extension.msstate.edu/economic profiles Demographics* Coahoma Mississippi United States Total Popula on, 2017 (Popula on Es mates) 23,154 2,984,100 325,719,178
County Economic Profile Lamar County, MS extension.msstate.edu/economic profiles
 County Economic Profile Lamar County, MS extension.msstate.edu/economic profiles Demographics* Lamar Mississippi United States Total Popula on, 2017 (Popula on Es mates) 61,374 2,984,100 325,719,178 Percent
O awa County, MI. Economy Overview. Michigan Economic Development Corpora on. 300 N. Washington Square, Lower Level Lansing, Michigan 48913
 O awa County, MI Michigan Economic Development Corpora on 300 N. Washington Square, Lower Level Lansing, Michigan 48913 Emsi Q4 2018 Data Set www.economicmodeling.com Contents. Economy........ Overview.........................................................................................
County Economic Profile Smith County, MS extension.msstate.edu/economic profiles
 County Economic Profile Smith County, MS extension.msstate.edu/economic profiles Demographics* Smith Mississippi United States Total Popula on, 2017 (Popula on Es mates) 16,078 2,984,100 325,719,178 Percent
Miller County, MO. Economy Overview. Michele Kroll, Community Development Specialist,
 Miller County, MO Michele Kroll, Community Development Specialist, krollm@missouri.edu Emsi Q1 2018 Data Set www.economicmodeling.com Contents. Economy........ Overview.........................................................................................
Quarterly Labour Market Report. November 2017
 Quarterly Labour Market Report November 2017 MBIE 3518 November 2017 Ministry of Business, Innovation and Employment (MBIE) Hikina Whakatutuki - Lifting to make successful MBIE develops and delivers policy,
Camden County, MO. Economy Overview. Michele Kroll, Community Development Specialist,
 Camden County, MO Michele Kroll, Community Development Specialist, krollm@missouri.edu Emsi Q1 2018 Data Set www.economicmodeling.com Contents. Economy........ Overview.........................................................................................
La Crosse County, WI
 La Crosse County, WI Mississippi River Regional Planning Commission 1707 Main Street, Suite 435 La Crosse, Wisconsin 54601 Emsi Q4 2018 Data Set www.economicmodeling.com Contents. Economy........ Overview.........................................................................................
2012 ALBANY COUNTY EXECUTIVE BUDGET
 2012 ALBANY COUNTY EXECUTIVE BUDGET INTRODUCTION AND HIGHLIGHTS Economic Forecast MICHAEL G. BRESLIN County Execu ve INTRODUCTION This sec on of the budget provides a survey of economic indicators and
Economy Overview. Esmeralda County, NV. Emsi Q Data Set
 Esmeralda County, NV Emsi Q3 2018 Data Set www.economicmodeling.com Economy Overview 795 403 $43.1K Popula on (2017) Jobs (2017) Median Household Income (2016) Popula on grew by 26 over the last 5 years
Industry Snapshot. Workforce Alliance of the North Bay. Emsi Q Data Set. September Emsi Q Data Set
 Industry Snapshot Emsi Q3 2018 Data Set September 2018 Workforce Alliance of the North Bay 1546 First Street Napa, California 94559 (707) 253-4697 Emsi Q3 2018 Data Set www.economicmodeling.com Page 1/7
Allegan County, MI. Economy Overview. Michigan Economic Development Corpora on. 300 N. Washington Square, Lower Level Lansing, Michigan 48913
 Allegan County, MI Michigan Economic Development Corpora on 300 N. Washington Square, Lower Level Lansing, Michigan 48913 Emsi Q4 2018 Data Set www.economicmodeling.com Contents. Economy........ Overview.........................................................................................
3 New Hampshire ZIPs
 3 New Hampshire ZIPs New Hampshire Economic Development 172 Pembroke Rd Concord, New Hampshire 03301 Emsi Q4 2018 Data Set www.economicmodeling.com Contents. Economy........ Overview.........................................................................................
WORKFORCE RESULTS. October 1 December 31, 2013 Second Quarter, Program Year 2013
 WORKFORCE RESULTS October 1 December 31, 2013 Second Quarter, Program Year 2013 WORKFORCE RESULTS Submi ed By: The Department of Workforce Services provides this overview of performance for the period
Superior Trade Zone. Economy Overview. Lake Superior Community Partnership. 501 S. Front Street Marque e, Michigan 49855
 Superior Trade Zone Lake Superior Community Partnership 501 S. Front Street Marque e, Michigan 49855 Emsi Q3 2018 Data Set www.economicmodeling.com Contents. Economy........ Overview.........................................................................................
Bucks County, PA. Economy Overview. Bucks County Workforce Development Board, Inc Veterans Highway Bristol, Pennsylvania 19007
 Bucks County, PA Bucks County Workforce Development Board, Inc. 1268 Veterans Highway Bristol, Pennsylvania 19007 Emsi Q4 2018 Data Set www.economicmodeling.com Contents. Economy........ Overview.........................................................................................
Industry Snapshot. Finance and Insurance
 Industry Snapshot Finance and Insurance Emsi Q2 2018 Data Set April 2018 Workforce Solutions for North Central Texas is an equal opportunity employer/program. Auxiliary aids and services are available
Quarterly Labour Market Report. August 2018
 Quarterly Labour Market Report August 2018 Ministry of Business, Innovation and Employment (MBIE) Hikina Whakatutuki - Lifting to make successful MBIE develops and delivers policy, services, advice and
Industry Snapshot. Health Care
 Industry Snapshot Health Care Emsi Q2 2018 Data Set April 2018 Workforce Solutions for North Central Texas is an equal opportunity employer/program. Auxiliary aids and services are available upon request
Highest Ranked Industries Top 10 Industries (2-Digit) in PVCC Service Region
 in PVCC Service Region") Highest Ranked Industries Top 10 Industries (2-Digit) in PVCC Service Region Emsi Q2 2018 Data Set June 2018 Piedmont Virginia Community College 501 College Drive Charlo esville, Virginia 22902 Emsi Q2
Highest Ranked Industries Top 10 Industries (2-Digit) in PVCC Service Region Emsi Q2 2018 Data Set June 2018 Piedmont Virginia Community College 501 College Drive Charlo esville, Virginia 22902 Emsi Q2
Economy Overview. Ellis County, TX. Emsi Q Data Set
 Ellis County, TX Emsi Q3 2018 Data Set www.economicmodeling.com Contents. Economy........ Overview......................................................................................... 1... Historic.......&..
Occupa on Overview. Bakersfield College. Emsi Q Data Set. September Emsi Q Data Set
 Occupa on Overview Emsi Q3 2017 Data Set September 2017 Bakersfield College 1801 Panorama Drive Bakersfield, California 93305 661.395.4921 Emsi Q3 2017 Data Set www.economicmodeling.com Page 1/10 Parameters
Economy Overview. Hunt County, TX. Emsi Q Data Set
 Hunt County, TX Emsi Q4 2018 Data Set www.economicmodeling.com Contents. Economy........ Overview......................................................................................... 1... Historic.......&..
CHAPTER I. Contextual background on Moldova. A. Historical and poli cal context. Table 2: General facts about Moldova
 CHAPTER I Contextual background on Moldova A. Historical and poli cal context Moldova is a small, landlocked country situated towards the east of the UNECE region, bordering Romania and Ukraine. It has
Palo Pinto County, TX
 Palo Pinto County, TX Emsi Q3 2018 Data Set www.economicmodeling.com Contents. Economy........ Overview......................................................................................... 1... Historic.......&..
Table of Contents. Long Range Financial Plan 27. Report Introduction 1
 Table of Contents Report Introduction 1 Water/Wastewater Long Range Financial Planning 2 Principles of Financial Sustainability 4 Importance of a Long Range Financial Plan 5 General Approach to Preparing
Communica on with Local Communi es. Hiring Local Manpower and Resources. Office Open in Belgrade
 Defining and adopting the Stakeholder Engagement Plan (SEP) Rakita has defined the Stakeholder Engagement Plan (SEP), which represents the base-line for communica on and cooperaon with target audiences
Economy Overview. Collin County, TX. Emsi Q Data Set
 Collin County, TX Emsi Q3 2018 Data Set www.economicmodeling.com Contents. Economy........ Overview......................................................................................... 1... Historic.......&..
Rifle city Demographic and Economic Profile
 Rifle city Demographic and Economic Profile Community Quick Facts Population (2014) 9,289 Population Change 2010 to 2014 156 Place Median HH Income (ACS 10-14) $52,539 State Median HH Income (ACS 10-14)
City of Guelph. Financial Condi on Assessment. September 24, 2015
 City of Guelph Financial Condi on Assessment September 24, 2015 62 Table of Contents Exeuctive Summary Introduction 1 Trend Analysis 2 Peer Analysis 2 Questions to Consider 3 Key Indicators 4 Section 1
The Advisors Inner Circle Fund II
 The Advisors Inner Circle Fund II A Class Shares PROSPECTUS June 1, 2018 Frost Total Return Bond Fund (FAJEX) Frost Credit Fund (FCFBX) Investment Adviser: Frost Investment Advisors, LLC The U.S. Securi
4.6% 5,852,000 23,941
 PA MONTHLY WORKSTATS LABOR FORCE JOBS UNEMPLOYMENT COMPENSATION PA Monthly WorkStats presents the most up-to-date labor market highlights and happenings in the commonwealth. Information herein is produced
Economy Overview. Denton County, TX. Emsi Q Data Set
 Denton County, TX Emsi Q1 2018 Data Set www.economicmodeling.com Contents. Economy........ Overview......................................................................................... 1... Historic.......&..
2 North San Joaquin Valley Index. Prepared by: Jeffrey A. Michael and Thomas E. Pogue
 Prepared by: Jeffrey A. Michael and Thomas E. Pogue This report has been prepared by the Center for Business and Policy Research at the University of the Pacific. This publica on was supported by JP Morgan
Credit Reports and Scores
 Credit Reports and Scores Advanced Level The Importance of a Credit History for Obtaining Credit Credit refers to borrowing. You have used credit if you receive money, goods, or services in exchange for
Deputy Finance Director Recruitment
 Deputy Finance Director Recruitment The City of Cape Girardeau, serving a growing popula on of 39,000, is succession planning for their Finance Director. The city is located between St. Louis and Memphis
Economy Overview. Monroe County, WI. Emsi Q Data Set
 Monroe County, WI Emsi Q4 2017 Data Set www.economicmodeling.com Contents. Economy........ Overview......................................................................................... 1... Historic.......&..
Occupa on Overview. Bakersfield College. Emsi Q Data Set. September Emsi Q Data Set
 Occupa on Overview Emsi Q3 2017 Data Set September 2017 Bakersfield College 1801 Panorama Drive Bakersfield, California 93305 661.395.4921 Emsi Q3 2017 Data Set www.economicmodeling.com Page 1/11 Parameters
which looks like a credit card, but is electronically connected to the cardholder s bank account.
 U C C T C Y F A L 1.4.1.F1 Credit is derived from the La n word credo meaning I believe. Credit is when goods, services, or money is received in exchange for a promise to pay a definite sum of money at
Population by Year. Ray County, Missouri 23,712 23,541. Population by Age. Ray County, Missouri 27% 27% 22%
 emographics, popula on has decreased by 3 percent since 2 and its popula on now stands at 22,754. or more informa on on Ray County, please visit www.raycountymo.com. Popula on by Year Population by Year
NORTH CAROLINA EDUCATION LOTTERY POPULAR ANNUAL FINANCIAL REPORT FISCAL YEAR ENDED JUNE 30, 2015
 NORTH CAROLINA EDUCATION LOTTERY POPULAR ANNUAL FINANCIAL REPORT FISCAL YEAR ENDED JUNE 30, 2015 ABOUT THE POPULAR ANNUAL FINANCIAL REPORT The North Carolina Educa on Lo ery (NCEL) finance division is
Occupa on Overview. Emsi Q Data Set. September Emsi Q Data Set Page 1/10
 Occupa on Overview Emsi Q3 2018 Data Set September 2018 900 Rancho San Diego Pky California 92019 Emsi Q3 2018 Data Set www.economicmodeling.com Page 1/10 Parameters Occupa ons Code Descrip on 49-3023
The Fron er Line. GLI Benchmarks. Thought Leadership and insights from Fron er Advisors. Issue 103, March 2015
 Thought Leadership and insights from Fron er Advisors GLI Benchmarks Issue 103, March 2015 Fron er Advisors has been at the forefront of ins tu onal investment advice in Australia for over two decades
By Aaron Brandenburg, NAIC Sta s cal Informa on Manager, and Jennifer Gardner, NAIC Research Analyst II
 E P /C I U C By Aaron Brandenburg, NAIC Sta s cal Informa on Manager, and Jennifer Gardner, NAIC Research Analyst II F 1: P /C U C Interpreta ons of the underwri ng cycle abound. The majority presume that
The Many Factors that Affect the Success of Regulatory Mechanisms Designed to Foster Investments in Energy Efficiency
 The Many Factors that Affect the Success of Regulatory Mechanisms Designed to Foster Investments in Energy Efficiency Jay Zarnikau Fron-er Associates and UT- Aus-n LBJ School of Public Affairs and Division
Credit Card Offer Scavenger Hunt
 Page 11 1.4.1.A1 Credit Card Offer Scavenger Hunt Total Points Earned Name 16 Total Points Possible Date Percentage Class Step 1: Find and highlight each of the vocabulary words in the table below in the
Guide to Pregnancy & Parental Leaves for OSSTF/FEESO
 Guide to Pregnancy & Parental Leaves for OSSTF/FEESO Table of Contents Introduc on........................................................2 Plan Ahead.........................................................3
Chromebook Computing Devices RFP
 Chromebook Computing Devices RFP May 15, 2018 NOTICE TO VENDORS EdAdvance will be receiving sealed proposals through May 31, 2018, 4:00 p.m. Eastern Time for Chromebook Compu ng Devices Tony DiLeone Director
1 Purpose Introduction Review of policy Best Execu on Delivery of Best Execution Scope...
 Order Execution Policy w w w.houseofborse.com HOUSE Of BÖRSE Limited is authorized and regulated by the Financial Conduct Authority. UK FCA Register Number: 631382. Registered in England andwale s, number:
Massachusetts Outlook,
 Massachusetts Outlook, 2016-2020 Highlights The state s economic growth will be pulled by two forces in opposite directions. Constraining growth will be a slower increase in the availability of workers
FX SENTIMENT REPORT COMMITMENT OF TRADERS CFTC
 GLOBAL FX STRATEGY FX SENTIMENT REPORT COMMITMENT OF TRADERS CFTC EUR & JPY BULLS WERE VULNERABLE AHEAD OF FED Data in this report cover up to Tuesday Sept 16, ahead of the FOMC, Scotland s referendum,
Income and Expense Statement
 Income and Expense Statement 1.15.5.F1 Take Charge of Your Finances Advanced Level Do you know where your money is coming from and where it is going? The Income and Expense Statement is a financial tool