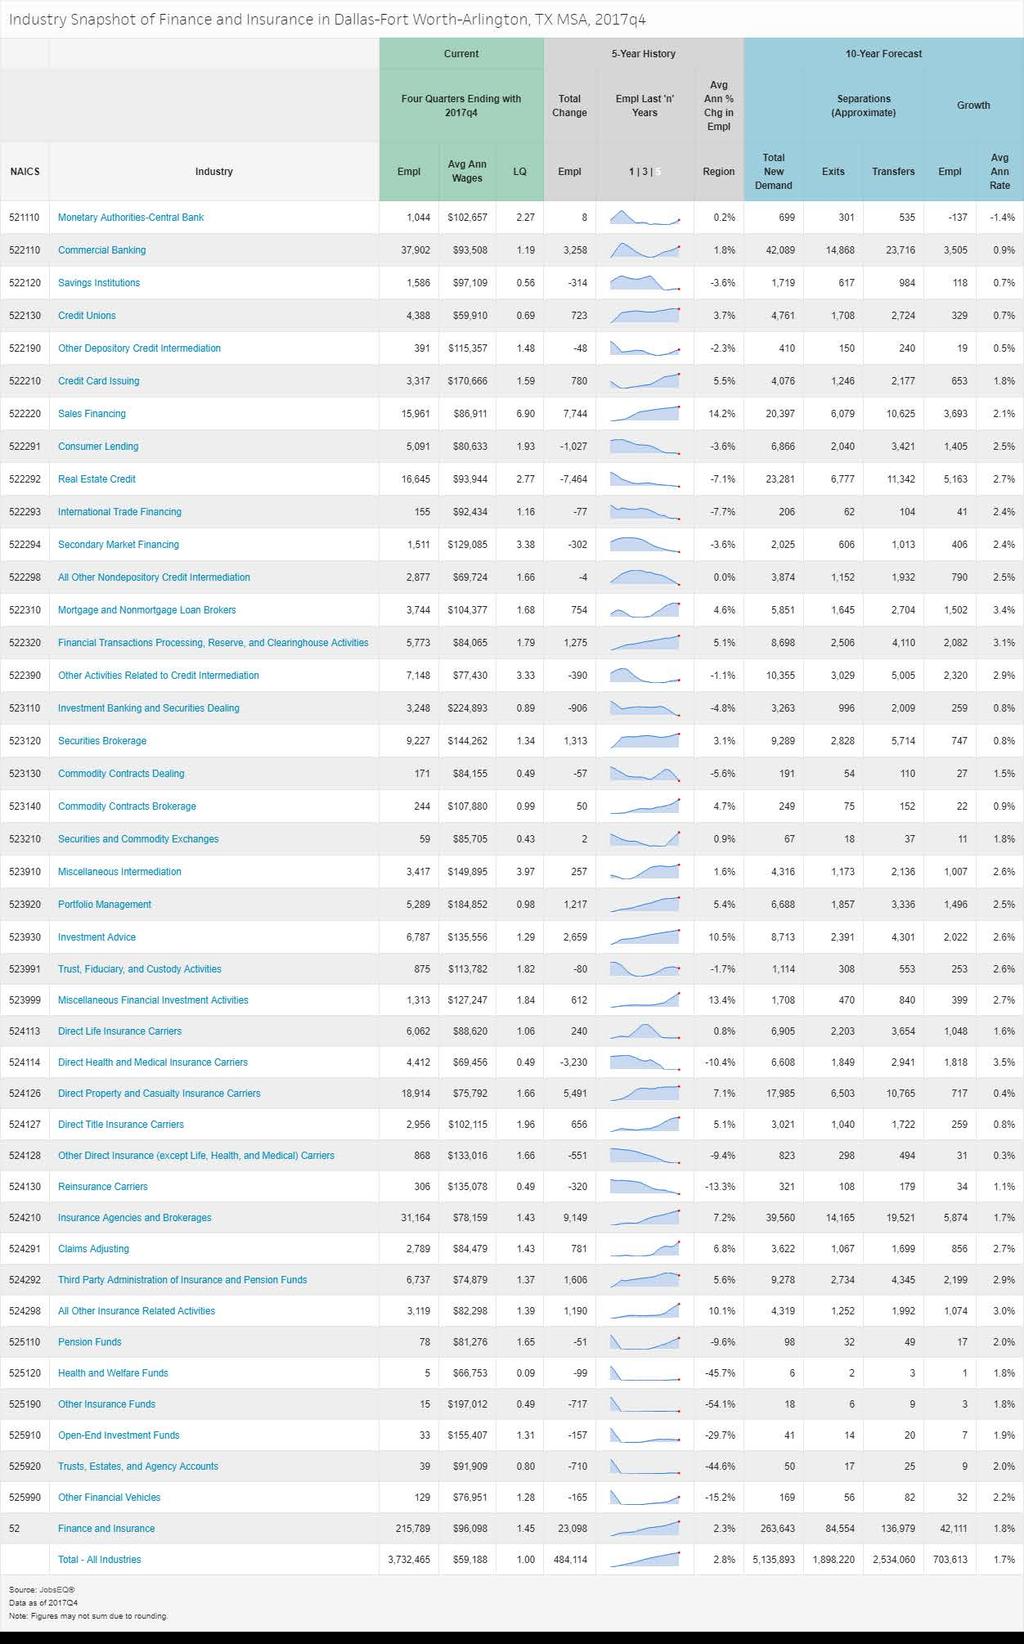
Industry Snapshot. Finance and Insurance
|
|
|
- Kathleen Craig
- 5 years ago
- Views:
Transcription


1 Industry Snapshot Finance and Insurance Emsi Q Data Set April 2018 Workforce Solutions for North Central Texas is an equal opportunity employer/program. Auxiliary aids and services are available upon request to individuals with disabilities. For the hearing impaired, call TDD or VOICE For more information, visit Emsi Q Data Set Page 1/9
2 Parameters Industries 11 items selected. See Appendix A for details. Regions Code Descrip on Dallas-Fort Worth-Arlington, TX Timeframe - Datarun Employees Emsi Q Data Set Page 2/9
3 Finance and Insurance WSNCT Targeted Industry Sector in Dallas-Fort Worth- Arlington, TX Industry Summary for Finance and Insurance WSNCT Targeted Industry Sector 83, % $101,051 Jobs (2017) % Change ( ) Avg. Earnings Per Job (2017) 15% above Na onal average Na on: -6.9% Na on: $97,944 Industry Detail Payrolled Business Loca ons (2017) 2,714 Jobs Mul plier 5 Unemployed Only Available for 2-Digit Emsi Q Data Set Page 3/9
 % of Total Jobs in Industry Group (2017) Tellers 9,681 11.")
4 Regional Trends Region 2007 Jobs 2017 Jobs Change % Change A Region 73,559 83,628 10, % B WSNCT Dallas and Tarrant 74,139 84,180 10, % C State 233, ,298 19, % D Na on 3,301,621 3,073, , % Occupa ons Employed by these Industries Descrip on Employed in Industry Group (2017) % of Total Jobs in Industry Group (2017) Tellers 9, % Customer Service Representa ves 7, % Insurance Claims and Policy Processing Clerks 6, % Securi es, Commodi es, and Financial Services Sales Agents 4, % First-Line Supervisors of Office and Administra ve Support Workers 4, % Emsi Q Data Set Page 4/9

5 Industry Gender Breakdown Gender 2017 Jobs 2017 Percent A Males 32, % A Females 50, % Industry Age Breakdown Age 2017 Jobs 2017 Percent A % A , % A , % A , % A , % A , % A 65+ 2, % Emsi Q Data Set Page 5/9

6 Industry Race/Ethnicity Breakdown Race/Ethnicity 2017 Jobs 2017 Percent A White 44, % A Black or African American 16, % A Hispanic or La no 15, % A Asian 5, % A Two or More Races 1, % A American Indian or Alaska Na ve % A Na ve Hawaiian or Other Pacific Islander % Industry Requirements Purchases from In-region Purchases Imported Purchases Total Purchases Insurance Agencies and Brokerages $2,954,175,109 $81,884,511 $3,036,059,620 Commercial Banking $920,439,905 $414,208 $920,854,113 Third Party Administra on of Insurance and Pension Funds $587,070,440 $697,891 $587,768,330 Investment Advice $539,848,179 $744,081 $540,592,260 Direct Property and Casualty Insurance Carriers $442,863,645 $580,751 $443,444,396 Emsi Q Data Set Page 6/9
7 Top Regional Businesses Business Name Industry Name Business Size Federal Reserve Bank Of Dallas Comerica Inc Colonial Savings United American Insurance Co Texas Capital Bank Commercial Banking (522110) Commercial Banking (522110) Commercial Banking (522110) Direct Life Insurance Carriers (524113) Commercial Banking (522110) 1,265 1, Business Data by DatabaseUSA.com is third-party data provided by Emsi to its customers as a convenience, and Emsi does not endorse or warrant its accuracy or consistency with other published Emsi data. Emsi Q Data Set Page 7/9
8 Appendix A - Industries Code Descrip on Commercial Banking Savings Ins tu ons Credit Unions Credit Card Issuing Mortgage and Nonmortgage Loan Brokers Direct Life Insurance Carriers Direct Health and Medical Insurance Carriers Direct Property and Casualty Insurance Carriers Direct Title Insurance Carriers Other Direct Insurance (except Life, Health, and Medical) Carriers Reinsurance Carriers Emsi Q Data Set Page 8/9
9 Appendix B - Data Sources and Calcula ons Industry Data Emsi industry data have various sources depending on the class of worker. (1) For QCEW Employees, Emsi primarily uses the QCEW (Quarterly Census of Employment and Wages), with supplemental es mates from County Business Pa erns. (2) Non- QCEW employees data are based on a number of sources including QCEW, Current Employment Sta s cs, County Business Pa erns, BEA State and Local Personal Income reports, the Na onal Industry-Occupa on Employment Matrix (NIOEM), the American Community Survey, and Railroad Re rement Board sta s cs. (3) Self-Employed and Extended Proprietor classes of worker data are primarily based on the American Community Survey, Nonemployer Sta s cs, and BEA State and Local Personal Income Reports. Projec ons for QCEW and Non-QCEW Employees are informed by NIOEM and long-term industry projec ons published by individual states. Input-Output Data The input-output model in this report is Emsi's gravita onal flows mul -regional social account matrix model (MR-SAM). It is based on data from the Census Bureau's Current Popula on Survey and American Community Survey; as well as the Bureau of Economic Analysis' Na onal Income and Product Accounts, Input-Output Make and Use Tables, and Gross State Product data. In addi on, several Emsi in-house data sets are used, as well as data from Oak Ridge Na onal Labs on the cost of transporta on between coun es. Staffing Pa erns Data The staffing pa ern data in this report are compiled from several sources using a specialized process. For QCEW and Non- QCEW Employees classes of worker, sources include Occupa onal Employment Sta s cs, the Na onal Industry-Occupa on Employment Matrix, and the American Community Survey. For the Self-Employed and Extended Proprietors classes of worker, the primary source is the American Community Survey, with a small amount of informa on from Occupa onal Employment Sta s cs. DatabaseUSA.com Business-Level Data Data for individual businesses is provided by DatabaseUSA.com, which maintains a database of more than 14 million U.S. business en es. Note that in aggregate it will not be consistent with Emsi labor market data due to differences in defini ons, methodology, coverage, and industry/geographic classifica on. State Data Sources This report uses state data from the following agencies: Texas Workforce Commission Emsi Q Data Set Page 9/9
10
Industry Snapshot. Health Care
 Industry Snapshot Health Care Emsi Q2 2018 Data Set April 2018 Workforce Solutions for North Central Texas is an equal opportunity employer/program. Auxiliary aids and services are available upon request
Industry Snapshot. Workforce Alliance of the North Bay. Emsi Q Data Set. September Emsi Q Data Set
 Industry Snapshot Emsi Q3 2018 Data Set September 2018 Workforce Alliance of the North Bay 1546 First Street Napa, California 94559 (707) 253-4697 Emsi Q3 2018 Data Set www.economicmodeling.com Page 1/7
Industry Overview. Austin Community College. Emsi Q Data Set. June Emsi Q Data Set
 Industry Overview Emsi Q2 2017 Data Set June 2017 Austin Community College 5930 Middle Fiskville Road Austin, Texas 78752 (512) 223.5100 Emsi Q2 2017 Data Set www.economicmodeling.com Page 1/8 Parameters
Occupa on Overview. Bakersfield College. Emsi Q Data Set. September Emsi Q Data Set
 Occupa on Overview Emsi Q3 2017 Data Set September 2017 Bakersfield College 1801 Panorama Drive Bakersfield, California 93305 661.395.4921 Emsi Q3 2017 Data Set www.economicmodeling.com Page 1/10 Parameters
Industry Overview. CareerSource Pinellas. Health Care and Social Assistance in 2 Counties
 Industry Overview Health Care and Social ssistance in 2 Counties CareerSource Pinellas Economic Modeling Specialists International www.economicmodeling.com Page 1/7 Parameters Industries Code Description
Occupa on Overview. Bakersfield College. Emsi Q Data Set. September Emsi Q Data Set
 Occupa on Overview Emsi Q3 2017 Data Set September 2017 Bakersfield College 1801 Panorama Drive Bakersfield, California 93305 661.395.4921 Emsi Q3 2017 Data Set www.economicmodeling.com Page 1/11 Parameters
Highest Ranked Industries Top 10 Industries (2-Digit) in PVCC Service Region
 in PVCC Service Region") Highest Ranked Industries Top 10 Industries (2-Digit) in PVCC Service Region Emsi Q2 2018 Data Set June 2018 Piedmont Virginia Community College 501 College Drive Charlo esville, Virginia 22902 Emsi Q2
Highest Ranked Industries Top 10 Industries (2-Digit) in PVCC Service Region Emsi Q2 2018 Data Set June 2018 Piedmont Virginia Community College 501 College Drive Charlo esville, Virginia 22902 Emsi Q2
Occupa on Overview. Emsi Q Data Set. September Emsi Q Data Set Page 1/10
 Occupa on Overview Emsi Q3 2018 Data Set September 2018 900 Rancho San Diego Pky California 92019 Emsi Q3 2018 Data Set www.economicmodeling.com Page 1/10 Parameters Occupa ons Code Descrip on 49-3023
Occupation Overview Industrial Health & Safety Related Occupations in Kern
 Occupation Overview Industrial Health & Safety Related Occupations in Kern EMSI Q2 2015 Data Set Taft College 29 Emmons Park Drive Taft, California 93268 661.763.7700 EMSI Q2 2015 Data Set www.economicmodeling.com
Occupation Overview Criminal Justice Administration-Corrections Related Occupations in Kern
 Occupation Overview Criminal Justice Administration-Corrections Related Occupations in Kern EMSI Q2 2015 Data Set Taft College 29 Emmons Park Drive Taft, California 93268 661.763.7700 EMSI Q2 2015 Data
Occupation Overview. EMSI Q Data Set. Criminal Justice Program. October Western Technical College
 Occupation Overview EMSI Q2 2015 Data Set Criminal Justice Program October 2015 Western Technical College 400 Seventh Street La Crosse, Wisconsin 54601 608.785.9200 EMSI Q2 2015 Data Set www.economicmodeling.com
Economy Overview Champaign County, IL
 Economy Overview Champaign County, IL Emsi Q4 2016 Data Set November 2016 Illinois Emsi Q4 2016 Data Set www.economicmodeling.com Page 1/17 Parameters Regions Code Description 17019 Champaign County, IL
Western Technical College
 Western Technical College 400 Seventh Street La Crosse, Wisconsin 54601 608.785.9200 FIRE PROTECTION Occupation Report 2014-2018 Western Technical College District Economic Modeling Specialists International
Occupational Therapy Assistant Occupation Overview
 Occupational Therapy Assistant Occupation Overview Emsi Q1 2018 Data Set March 2018 Western Technical College 400 Seventh Street La Crosse, Wisconsin 54601 608.785.9200 Emsi Q1 2018 Data Set www.economicmodeling.com
October Mid-Del Technology Center. Economy Overview
 October 2017 Mid-Del Technology Center Economy Overview Parameters Regions Code Description 40109 Oklahoma County, OK Timeframe 2001-2016 Datarun 2017.3 QCEW Employees, Non-QCEW Employees, and Self-Employed
Oklahoma Department of Career and Technology Education
 Oklahoma Department of Career and Technology Education Information Commons October 2016 Kiamichi Technology Center - McAlester Economy Overview Report Emsi Q3 2016 Data Set www.economicmodeling.com Parameters
Economy Overview Champaign-Urbana, IL
 Economy Overview Champaign-Urbana, IL Emsi Q4 Data Set November Illinois Emsi Q4 Data Set www.economicmodeling.com Page 1/15 Economy Overview Population () 240,355 Jobs () 100,288 Average Earnings () $53,770
Respiratory Therapy Occupation Overview
 Respiratory Therapy Occupation Overview Emsi Q1 2018 Data Set March 2018 Western Technical College 400 Seventh Street La Crosse, Wisconsin 54601 608.785.9200 Emsi Q1 2018 Data Set www.economicmodeling.com
White Pine County Economic Overview
 Economic Overview Population (2016) 10,105 Jobs (2016) 4,597 Average Earnings (2016) $65,033 Unemployed (2/2016) 229 GRP (2014) $996,944,330 Exports (2014) $1,789,478,088 Imports (2014) $1,181,738,119
September Caddo Kiowa Technology Center. Economy Overview
 September 2017 Caddo Kiowa Technology Center Economy Overview Parameters Regions Code Description 40015 Caddo County, OK 40051 Grady County, OK 40075 Kiowa County, OK Timeframe 2001-2016 Datarun 2017.3
Economy Overview 51 Texas ZIPs WEST HARRIS AND WESTSIDE ADJACENT COUNTIES
 Economy Overview 51 Texas ZIPs WEST HARRIS AND WESTSIDE ADJACENT COUNTIES Emsi Q2 2017 Data Set July 2017 Employment & Training Centers 3355 West Alabama, Suite 350 Houston, Texas 77098 713.688.6890 Emsi
Economy Overview. Colorado Workforce Centers. 6 Colorado ZIPs. Emsi Q Data Set. April th Street Denver, Colorado
 Economy Overview 6 Colorado ZIPs Emsi Q1 2017 Data Set April 2017 Colorado Workforce Centers 633 17th Street Denver, Colorado 80202 303.503.2739 Emsi Q1 2017 Data Set www.economicmodeling.com 1 Parameters
Regional Comparison by Industry Comparing Manufacturing across 10 Regions
 Regional Comparison by Comparing Manufacturing across 10 Regions Emsi Q3 2017 Data Set May 2018 OMAFRA Economic Modeling Specialists Interna onal Page 1/19 Parameters Industries Code 31-33 Manufacturing
County Economic Profile Lee County, MS extension.msstate.edu/economic profiles
 County Economic Profile Lee County, MS extension.msstate.edu/economic profiles Demographics* Lee Mississippi United States Total Popula on, 2017 (Popula on Es mates) 84,933 2,984,100 325,719,178 Percent
County Economic Profile Copiah County, MS extension.msstate.edu/economic profiles
 County Economic Profile Copiah County, MS extension.msstate.edu/economic profiles Demographics* Copiah Mississippi United States Total Popula on, 2017 (Popula on Es mates) 28,516 2,984,100 325,719,178
County Economic Profile Marion County, MS extension.msstate.edu/economic profiles
 County Economic Profile Marion County, MS extension.msstate.edu/economic profiles Demographics* Marion Mississippi United States Total Popula on, 2017 (Popula on Es mates) 25,069 2,984,100 325,719,178
County Economic Profile Jasper County, MS extension.msstate.edu/economic profiles
 County Economic Profile Jasper County, MS extension.msstate.edu/economic profiles Demographics* Jasper Mississippi United States Total Popula on, 2017 (Popula on Es mates) 16,582 2,984,100 325,719,178
County Economic Profile Monroe County, MS extension.msstate.edu/economic profiles
 County Economic Profile Monroe County, MS extension.msstate.edu/economic profiles Demographics* Monroe Mississippi United States Total Popula on, 2017 (Popula on Es mates) 35,872 2,984,100 325,719,178
County Economic Profile Leflore County, MS extension.msstate.edu/economic profiles
 County Economic Profile Leflore County, MS extension.msstate.edu/economic profiles Demographics* Leflore Mississippi United States Total Popula on, 2017 (Popula on Es mates) 29,223 2,984,100 325,719,178
County Economic Profile Bolivar County, MS extension.msstate.edu/economic profiles
 County Economic Profile Bolivar County, MS extension.msstate.edu/economic profiles Demographics* Bolivar Mississippi United States Total Popula on, 2017 (Popula on Es mates) 31,945 2,984,100 325,719,178
County Economic Profile Coahoma County, MS extension.msstate.edu/economic profiles
 County Economic Profile Coahoma County, MS extension.msstate.edu/economic profiles Demographics* Coahoma Mississippi United States Total Popula on, 2017 (Popula on Es mates) 23,154 2,984,100 325,719,178
County Economic Profile Tunica County, MS extension.msstate.edu/economic profiles
 County Economic Profile Tunica County, MS extension.msstate.edu/economic profiles Demographics* Tunica Mississippi United States Total Popula on, 2017 (Popula on Es mates) 10,024 2,984,100 325,719,178
County Economic Profile Lamar County, MS extension.msstate.edu/economic profiles
 County Economic Profile Lamar County, MS extension.msstate.edu/economic profiles Demographics* Lamar Mississippi United States Total Popula on, 2017 (Popula on Es mates) 61,374 2,984,100 325,719,178 Percent
County Economic Profile Clarke County, MS extension.msstate.edu/economic profiles
 County Economic Profile Clarke County, MS extension.msstate.edu/economic profiles Demographics* Clarke Mississippi United States Total Popula on, 2017 (Popula on Es mates) 15,828 2,984,100 325,719,178
County Economic Profile Smith County, MS extension.msstate.edu/economic profiles
 County Economic Profile Smith County, MS extension.msstate.edu/economic profiles Demographics* Smith Mississippi United States Total Popula on, 2017 (Popula on Es mates) 16,078 2,984,100 325,719,178 Percent
Economy Overview. Navarro County, TX. Emsi Q Data Set
 Economy Overview Navarro County, TX Emsi Q4 2017 Data Set www.economicmodeling.com Economy Overview Contents. Economy........ Overview.........................................................................................
Highest Ranked Industries
 Highest Ranked Industries Top 10 Industries (2-Digit) in 7 Counties EMSI Q1 2015 Data Set Centralina WDB 525 N. Tryon St., 12th Floor Charlotte, NC, North Carolina 28202 704.372.2416 EMSI Q1 2015 Data
Economy Overview. Eagle County, CO. Emsi Q Data Set
 Eagle County, CO Emsi Q4 2018 Data Set www.economicmodeling.com Contents. Economy........ Overview......................................................................................... 1... Historic.......&..
Economy Overview. Hunt County, TX. Emsi Q Data Set
 Hunt County, TX Emsi Q4 2018 Data Set www.economicmodeling.com Contents. Economy........ Overview......................................................................................... 1... Historic.......&..
Economy Overview. Ellis County, TX. Emsi Q Data Set
 Ellis County, TX Emsi Q3 2018 Data Set www.economicmodeling.com Contents. Economy........ Overview......................................................................................... 1... Historic.......&..
Economy Overview. Navarro County, TX. Emsi Q Data Set
 Economy Overview Navarro County, TX Emsi Q3 2017 Data Set www.economicmodeling.com Economy Overview Contents. Economy........ Overview.........................................................................................
3 New Hampshire ZIPs
 3 New Hampshire ZIPs New Hampshire Economic Development 172 Pembroke Rd Concord, New Hampshire 03301 Emsi Q4 2018 Data Set www.economicmodeling.com Contents. Economy........ Overview.........................................................................................
2017 ECONOMIC AND WORKFORCE PROFILE Monroe County
 2017 ECONOMIC AND WORKFORCE PROFILE Monroe County STATE OF WISCONSIN DETI-17957-MON-P (R. 3/2018) Percentage of Total Popula on, Ages 65 and Older Wisconsin now has more people employed and more private
La Crosse County, WI
 La Crosse County, WI Mississippi River Regional Planning Commission 1707 Main Street, Suite 435 La Crosse, Wisconsin 54601 Emsi Q4 2018 Data Set www.economicmodeling.com Contents. Economy........ Overview.........................................................................................
2017 ECONOMIC AND WORKFORCE PROFILE Grant County
 2017 ECONOMIC AND WORKFORCE PROFILE Grant County STATE OF WISCONSIN DETI-17957-GRT-P (R. 3/2018) Percentage of Total Popula on, Ages 65 and Older Wisconsin now has more people employed and more private
Economy Overview. Collin County, TX. Emsi Q Data Set
 Collin County, TX Emsi Q3 2018 Data Set www.economicmodeling.com Contents. Economy........ Overview......................................................................................... 1... Historic.......&..
2018:IIIQ Nevada Unemployment Rate Demographics Report*
 2018:IIIQ Nevada Unemployment Rate Demographics Report* Department of Employment, Training & Rehabilitation Research and Analysis Bureau Dr. Tiffany Tyler-Garner, Director Dennis Perea, Deputy Director
Pennington County, SD
 Pennington County, SD 730 E. Watertown Street, Suite 102 Rapid City, South Dakota 57701 Emsi Q2 2018 Data Set www.economicmodeling.com Contents. Economy........ Overview.........................................................................................
Palo Pinto County, TX
 Palo Pinto County, TX Emsi Q3 2018 Data Set www.economicmodeling.com Contents. Economy........ Overview......................................................................................... 1... Historic.......&..
Economy Overview. Summit County, CO. Emsi Q Data Set
 Summit County, CO Emsi Q4 2018 Data Set www.economicmodeling.com Contents. Economy........ Overview......................................................................................... 1... Historic.......&..
Economy Overview. Esmeralda County, NV. Emsi Q Data Set
 Esmeralda County, NV Emsi Q3 2018 Data Set www.economicmodeling.com Economy Overview 795 403 $43.1K Popula on (2017) Jobs (2017) Median Household Income (2016) Popula on grew by 26 over the last 5 years
Population by Year. Ray County, Missouri 23,712 23,541. Population by Age. Ray County, Missouri 27% 27% 22%
 emographics, popula on has decreased by 3 percent since 2 and its popula on now stands at 22,754. or more informa on on Ray County, please visit www.raycountymo.com. Popula on by Year Population by Year
Economy Overview. Pitkin County, CO. Emsi Q Data Set
 Pitkin County, CO Emsi Q4 2018 Data Set www.economicmodeling.com Contents. Economy........ Overview......................................................................................... 1... Historic.......&..
2017 ECONOMIC AND WORKFORCE PROFILE Buffalo County
 2017 ECONOMIC AND WORKFORCE PROFILE Buffalo County STATE OF WISCONSIN DETI-17957-BUF-P (R. 3/2018) Percentage of Total Popula on, Ages 65 and Older Wisconsin now has more people employed and more private
14 Coun es. Economy Overview. West Virginia Department of Commerce Capitol Complex, Bldg. 6, Room 525 Charleston, West Virginia 25305
 14 Coun es West Virginia Department of Commerce Capitol Complex, Bldg. 6, Room 525 Charleston, West Virginia 25305 Emsi Q4 2018 Data Set www.economicmodeling.com Contents. Economy........ Overview.........................................................................................
Allegan County, MI. Economy Overview. Michigan Economic Development Corpora on. 300 N. Washington Square, Lower Level Lansing, Michigan 48913
 Allegan County, MI Michigan Economic Development Corpora on 300 N. Washington Square, Lower Level Lansing, Michigan 48913 Emsi Q4 2018 Data Set www.economicmodeling.com Contents. Economy........ Overview.........................................................................................
Economy Overview. Grand County, CO. Emsi Q Data Set
 Grand County, CO Emsi Q4 2018 Data Set www.economicmodeling.com Contents. Economy........ Overview......................................................................................... 1... Historic.......&..
Regional Data Snapshot
 Regional Data Snapshot Population, Economy & Education Features SET Civic Forum Forest Country Region (FCR), Texas Table of Contents 01 Overview 03 Human Capital 02 Demography 04 Labor Force 01 overview
Economy Overview. Denton County, TX. Emsi Q Data Set
 Denton County, TX Emsi Q1 2018 Data Set www.economicmodeling.com Contents. Economy........ Overview......................................................................................... 1... Historic.......&..
2017 ECONOMIC AND WORKFORCE PROFILE Vernon County
 2017 ECONOMIC AND WORKFORCE PROFILE Vernon County STATE OF WISCONSIN DETI-17957-VRN-P (R. 3/2018) Percentage of Total Popula on, Ages 65 and Older Wisconsin now has more people employed and more private
2017 ECONOMIC AND WORKFORCE PROFILE Wood County
 2017 ECONOMIC AND WORKFORCE PROFILE Wood County STATE OF WISCONSIN DETI-17957-WOD-P (R. 3/2018) Percentage of Total Popula on, Ages 65 and Older Wisconsin now has more people employed and more private
Bucks County, PA. Economy Overview. Bucks County Workforce Development Board, Inc Veterans Highway Bristol, Pennsylvania 19007
 Bucks County, PA Bucks County Workforce Development Board, Inc. 1268 Veterans Highway Bristol, Pennsylvania 19007 Emsi Q4 2018 Data Set www.economicmodeling.com Contents. Economy........ Overview.........................................................................................
Applica on Instruc ons
 Shared Equity Program Homeownership Applica on Applica on Instruc ons This applica on is required in order to purchase a home through the Champlain Housing Trust (CHT). Thank you for taking the me to fill
O awa County, MI. Economy Overview. Michigan Economic Development Corpora on. 300 N. Washington Square, Lower Level Lansing, Michigan 48913
 O awa County, MI Michigan Economic Development Corpora on 300 N. Washington Square, Lower Level Lansing, Michigan 48913 Emsi Q4 2018 Data Set www.economicmodeling.com Contents. Economy........ Overview.........................................................................................
Local Business Profile All Sectors - Fairfield city, Ohio. Contents. What will I find in this report? My Customers
 Local Business Profile All Sectors -, Contents What will I find in this report? My Customers The My Customers section provides summarized demographic information for,. This information provides a snapshot
Miller County, MO. Economy Overview. Michele Kroll, Community Development Specialist,
 Miller County, MO Michele Kroll, Community Development Specialist, krollm@missouri.edu Emsi Q1 2018 Data Set www.economicmodeling.com Contents. Economy........ Overview.........................................................................................
Superior Trade Zone. Economy Overview. Lake Superior Community Partnership. 501 S. Front Street Marque e, Michigan 49855
 Superior Trade Zone Lake Superior Community Partnership 501 S. Front Street Marque e, Michigan 49855 Emsi Q3 2018 Data Set www.economicmodeling.com Contents. Economy........ Overview.........................................................................................
Regional Data Snapshot
 Regional Data Snapshot Population, Economy & Education Features SET Civic Forum Ozark Foothills Region, Missouri Table of Contents 01 Overview 03 Human Capital 02 Demography 04 Labor Force 01 overview
Jackson County DETI JAK-P (N. 3/2016)
") Jackson County DETI-17957-JAK-P (N. 3/2016) 2015 Jackson County Economic and Workforce Profile Na onal and State Economic Outlook Robust economic growth a er the Great Recession remains an cipated. The
Jackson County DETI-17957-JAK-P (N. 3/2016) 2015 Jackson County Economic and Workforce Profile Na onal and State Economic Outlook Robust economic growth a er the Great Recession remains an cipated. The
Camden County, MO. Economy Overview. Michele Kroll, Community Development Specialist,
 Camden County, MO Michele Kroll, Community Development Specialist, krollm@missouri.edu Emsi Q1 2018 Data Set www.economicmodeling.com Contents. Economy........ Overview.........................................................................................
Rock County DETI RCK-P (N. 3/2016)
") Rock County DETI-17957-RCK-P (N. 3/2016) 2015 Rock County Economic and Workforce Profile Na onal and State Economic Outlook Robust economic growth a er the Great Recession remains an cipated. The recession
Rock County DETI-17957-RCK-P (N. 3/2016) 2015 Rock County Economic and Workforce Profile Na onal and State Economic Outlook Robust economic growth a er the Great Recession remains an cipated. The recession
2017 ECONOMIC AND WORKFORCE PROFILE Walworth County
 2017 ECONOMIC AND WORKFORCE PROFILE Walworth County STATE OF WISCONSIN DETI-17957-WLW-P (R. 3/2018) Percentage of Total Popula on, Ages 65 and Older Wisconsin now has more people employed and more private
Diversity in the Insurance and Finance Industry Workforce
 Diversity in the Insurance and Finance Industry Workforce DBP RESEARCH REQUEST: AXA 1 Representation: Diversity in the Industry 2018 DBP INCLUSION INDEX Finance and Insurance Sector Position held % Male
This is a PDF version of the 2019 Law survey. To complete the survey, follow this link to the online form.
 This is a PDF version of the 2019 Law360 400 survey. To complete the survey, follow this link to the online form. Welcome to the 2019 Law360 400 survey! The answers to these questions will be used for
Commission District 4 Census Data Aggregation
 Commission District 4 Census Data Aggregation 2011-2015 American Community Survey Data, U.S. Census Bureau Table 1 (page 2) Table 2 (page 2) Table 3 (page 3) Table 4 (page 4) Table 5 (page 4) Table 6 (page
TABLE OF CONTENTS INTRODUCTION... 1
 TABLE OF CONTENTS INTRODUCTION... GENERAL WORKFORCE TRENDS... 3 General Workforce Trends and Comparisons Overview... 5 State Government Employees to State Population... 6 State Government Full-Time Equivalent
Columbia County DETI COL-P (N. 3/2016)
") Columbia County DETI-17957-COL-P (N. 3/2016) Average Household Income By County Na onal and State Economic Outlook Robust economic growth a er the Great Recession remains an cipated. The recession ended
Columbia County DETI-17957-COL-P (N. 3/2016) Average Household Income By County Na onal and State Economic Outlook Robust economic growth a er the Great Recession remains an cipated. The recession ended
Northwest Census Data Aggregation
 Northwest Census Data Aggregation 2011-2015 American Community Survey Data, U.S. Census Bureau Table 1 (page 2) Table 2 (page 2) Table 3 (page 3) Table 4 (page 4) Table 5 (page 4) Table 6 (page 5) Table
Riverview Census Data Aggregation
 Riverview Census Data Aggregation 2011-2015 American Community Survey Data, U.S. Census Bureau Table 1 (page 2) Table 2 (page 2) Table 3 (page 3) Table 4 (page 4) Table 5 (page 4) Table 6 (page 5) Table
Zipe Code Census Data Aggregation
 Zipe Code 66101 Census Data Aggregation 2011-2015 American Community Survey Data, U.S. Census Bureau Table 1 (page 2) Table 2 (page 2) Table 3 (page 3) Table 4 (page 4) Table 5 (page 4) Table 6 (page 5)
Zipe Code Census Data Aggregation
 Zipe Code 66103 Census Data Aggregation 2011-2015 American Community Survey Data, U.S. Census Bureau Table 1 (page 2) Table 2 (page 2) Table 3 (page 3) Table 4 (page 4) Table 5 (page 4) Table 6 (page 5)
2017 ECONOMIC AND WORKFORCE PROFILE Douglas County
 2017 ECONOMIC AND WORKFORCE PROFILE Douglas County STATE OF WISCONSIN DETI-17957-DOU-P (R. 3/2018) Percentage of Total Popula on, Ages 65 and Older Wisconsin now has more people employed and more private
Economic Overview City of Tyler, TX. January 8, 2018
 Economic Overview City of Tyler, TX January 8, 2018 DEMOGRAPHIC PROFILE...3 EMPLOYMENT TRENDS...5 WAGE TRENDS...5 COST OF LIVING INDEX...6 INDUSTRY SNAPSHOT...7 OCCUPATION SNAPSHOT...9 INDUSTRY CLUSTERS...
Economy Overview. Monroe County, WI. Emsi Q Data Set
 Monroe County, WI Emsi Q4 2017 Data Set www.economicmodeling.com Contents. Economy........ Overview......................................................................................... 1... Historic.......&..
2017 ECONOMIC AND WORKFORCE PROFILE Winnebago County
 2017 ECONOMIC AND WORKFORCE PROFILE Winnebago County STATE OF WISCONSIN DETI-17957-WIN-P (R. 3/2018) Percentage of Total Popula on, Ages 65 and Older Wisconsin now has more people employed and more private
Blackstone Falls Application for Subsidized Housing
 Blackstone Falls 1485 High Street Central Falls, RI 02863 Tel: (401) 725-1188 Fax: (401) 726-8711 Email: manager@blackstonefalls.com Blackstone Falls Application for Subsidized Housing We thank you for
Dane County DETI DAN-P DAN (N. 3/2016)
") Dane County DETI-17957-DAN-P DAN (N. 3/2016) Average Household Income By County Na onal and State Economic Outlook Robust economic growth a er the Great Recession remains an cipated. The recession ended
Dane County DETI-17957-DAN-P DAN (N. 3/2016) Average Household Income By County Na onal and State Economic Outlook Robust economic growth a er the Great Recession remains an cipated. The recession ended
DETROIT S WORKFORCE ANALYSIS
 TOURISM AND HOSPITALITY TALENT: Human Capital and Economic Contributions in Metro Detroit DETROIT S WORKFORCE ANALYSIS INTRODUCTION Tourism and the hospitality industry are stronger than ever in metro
Economy Overview. Greater Lima Region. Emsi Q Data Set
 Greater Lima Region Emsi Q3 2017 Data Set www.economicmodeling.com Contents. Economy........ Overview......................................................................................... 1... Historic.......&..
Washington, DC. HFA Performance Data Reporting- Borrower Characteristics
 HFA Performance Data Reporting- Borrower Characteristics QTD Cumulative 1 Unique Borrower Count 2 Number of Unique Borrowers Receiving Assistance 19 767 3 Number of Unique Borrowers Denied Assistance 5
Michigan Economic Development Corporation
 Michigan Economic Development Corporation 300 N. Washington Square, Lower Level Lansing, Michigan 48913 888.522.0103 Economy Overview MEDC Region 5 East Central Michigan Economic Modeling Specialists International
2016 Labor Market Profile
 2016 Labor Market Profile Prepared by The Tyler Economic Development Council Tyler Area Sponsor June 2016 The ability to demonstrate a regions availability of talented workers has become a vital tool
What America Is Thinking On Energy Issues January 2015
 What America Is Thinking On Energy Issues January 2015 South Carolina Offshore Drilling Presented by: Harris Poll Interviewing: January 13-15, 2015 Respondents: 604 Registered Voters Method: Telephone
Economic Overview York County, South Carolina. February 14, 2018
 Economic Overview York County, February 14, 2018 DEMOGRAPHIC PROFILE... 3 EMPLOYMENT TRENDS... 5 UNEMPLOYMENT RATE... 5 WAGE TRENDS... 6 COST OF LIVING INDEX... 6 INDUSTRY SNAPSHOT... 7 OCCUPATION SNAPSHOT...
Michigan Economic Development Corporation
 Michigan Economic Development Corporation 300 N. Washington Square, Lower Level Lansing, Michigan 48913 888.522.0103 Economy Overview MEDC Region 3 Northeast Michigan Economic Modeling Specialists International
2017 ECONOMIC AND WORKFORCE PROFILE Green Lake County
 2017 ECONOMIC AND WORKFORCE PROFILE Green Lake County STATE OF WISCONSIN DETI-17957-GRL-P (R. 3/2018) Percentage of Total Popula on, Ages 65 and Older Wisconsin now has more people employed and more private
THDA Homebuyer Education Initiative Customer Intake Form
 Sample 3 Date Case# (Trainer completes) Trainer Organization County (Trainer completes) THDA Homebuyer Education Initiative Customer Intake Form Please provide information about yourself for customer tracking
Application for Benefits Medicaid Buy-In for Children
 Texas Health and Human Services Commission Form H1200-MBIC Cover Letter January 2011 Application for Benefits Medicaid Buy-In for Children About this program: Medicaid Buy-In for Children can help pay
2017 ECONOMIC AND WORKFORCE PROFILE Brown County
 2017 ECONOMIC AND WORKFORCE PROFILE Brown County STATE OF WISCONSIN DETI-17957-BRW-P (R. 3/2018) Percentage of Total Popula on, Ages 65 and Older Wisconsin now has more people employed and more private
Tyler Area Economic Overview
 Tyler Area Economic Overview Demographic Profile. 2 Unemployment Rate. 4 Wage Trends. 4 Cost of Living Index...... 5 Industry Clusters. 5 Occupation Snapshot. 6 Education Levels 7 Gross Domestic Product