2017 ECONOMIC AND WORKFORCE PROFILE Douglas County
|
|
|
- Dina Cain
- 5 years ago
- Views:
Transcription


1 2017 ECONOMIC AND WORKFORCE PROFILE Douglas County STATE OF WISCONSIN DETI DOU-P (R. 3/2018)

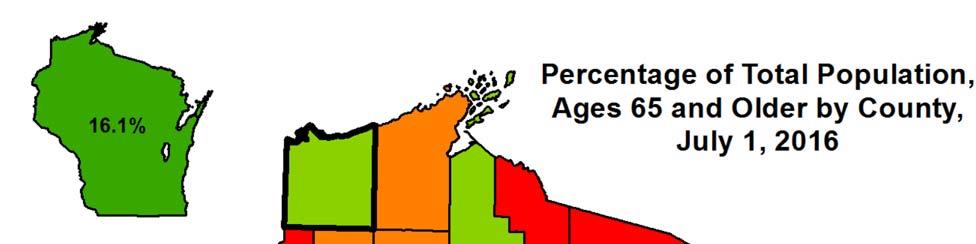
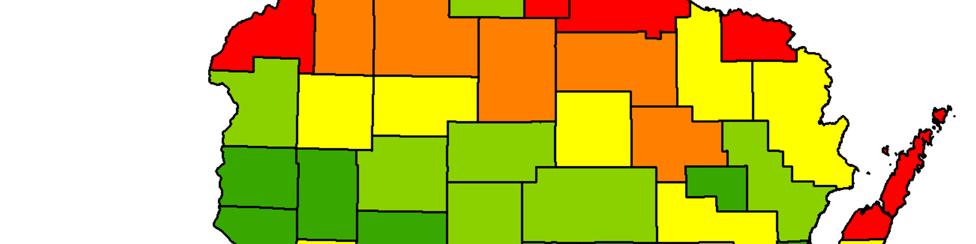
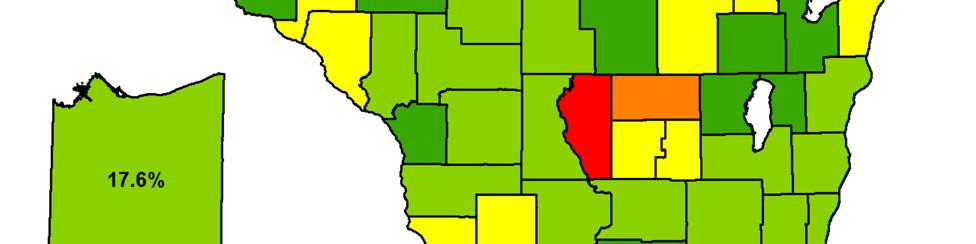
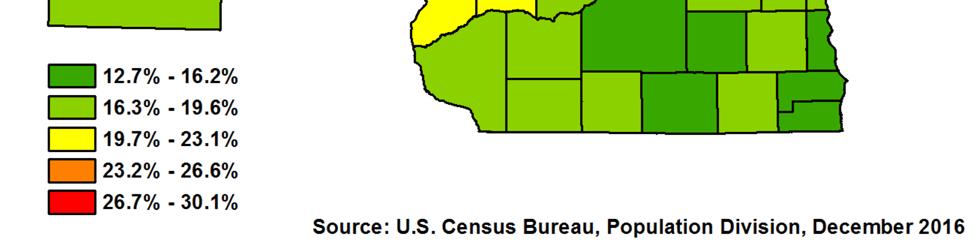
2 Percentage of Total Popula on, Ages 65 and Older
3 Wisconsin now has more people employed and more private sector jobs than at any me in its history. As of this wri ng, the state added 56,100 jobs during 2016 and Employment increased in almost all industry sectors, with prominent gains in construc on, manufacturing, and healthcare. Wisconsin s unemployment rate is near lows not seen in a genera on, decreasing from 4.3 percent in January 2016 to 3.2 percent in December 2017, on a seasonally adjusted basis. Wisconsin faces a worker quan ty challenge. The number of re ring Baby Boomers nearly match the influx of new workers, resul ng in a slow growing workforce and placing constraints on the ability by employers across all industries to hire talent. Many businesses report that the lack of available workers has hindered expansion and, in some cases, even curtailed their ability to meet current product orders. The blue line, orange line graph to the right illustrates the situa on in Wisconsin and other upper Midwest states. While Wisconsin's popula on will con nue to grow over the next twenty years, the workforce faces serious constraints. The labor force par cipa on rate (LFPR), defined as the labor force (sum of employed and unemployed) divided by the total popula on ages 16 and older, measures the popula on's engagement in the workforce and serves as an indicator in determining how Wisconsin's workforce will be constrained. The overall LFPR peaked in the late 1990s and has been trending lower ever since. The LFPR of peaks across Source: Local Area Unemployment Sta s cs, Bureau of Labor Sta s cs the age cohort at over ninety percent and decreases rapidly into the single digits by age seventy. Baby Boomers have and con nue to exit with respect to their LFPR. The mass of Baby Boomers has moved into the work lifecycle stage of declining LFPRs, with the tail end of the cohort turning 55 in Source: Bureau of Labor Sta s cs A recent development is the change in the labor force par cipa on rate trend. The LFPR of older workers (those aged 55 years and older) has turned upwards, resul ng in fla ening of the overall LFPR. More boomers are staying in the workforce longer, which may portend higher workforce growth over the coming years. Due to the size of the Baby Boomer cohort and the sensi vity of the LFPR to workforce growth rates, a rela vely small change in the LFPR of older workers would significantly boost the number in the workforce. 1


4 Popula on and Demographics Source: Demographic Services Center, Wisconsin Department of Administra on Between the years 2010 and 2016 Douglas County s popula on increased by 256, or 0.6%. Douglas County s popula on growth rate ranks 40 out of 72 Wisconsin Coun es. This increase con nues a trend of increasing popula on which started in the 1990s. At its highest, Douglas County s popula on was 49,771 in During the same me frame, , the United States and the State of Wisconsin saw popula on growth rates of 4.8% and 1.5%, respec vely. From 2010 to 2016, Douglas County had a yearly average growth rate of 0.10%. During the period, Douglas County s yearly average popula on growth was 0.20%. According to the recent es mates found above, Douglas County s popula on change is star ng to slow down. Douglas County s net popula on increase was based on natural increase within the county and migra on into the county. The graph to the right shows its net migra on was 0.2% which means that a greater number of people moved into the county than out of the county. The natural increase was 0.4% which means that the county recorded more births than deaths over the six year period. Components of Popula on Change According to data gathered from Wisconsin s Department of Health Services, Douglas County s birth rate (births per 1,000 women aged 15 44) in 2015 was 50.3 which rated 67th highest out of Wisconsin s 72 coun es. The birth rate for the state of Wisconsin in 2015 was Douglas s rate in 2010 was 58.2, while Wisconsin s rate was Source: Demographic Services Center, Wisconsin Department of Administra on 2
5 Labor Force Dynamics The above graph Source: Local Area Unemployment Sta s cs, Bureau of Labor Sta s cs outlines Douglas County s monthly unemployment rate over the past 25 years comparing it to the state of Wisconsin and the United States. There was a great deal of variance in Douglas County from when compared to Wisconsin and the United States. Its rates started to match Wisconsin s closely from and then started to differ greatly again from 2016 to the present. The labor force is made up of the employed and unemployed. To be classified as employed, you must be 16 years of age or older and completed paid work, worked for your own business or farm, or worked 15 or more unpaid hours at a family owned business during the week the government employment survey is performed. You are also included if you are absent from work due to vaca on, illness, etc. You are unemployed if you are 16 or older, are available for work, and ac vely looked for work during the 4 week period prior to the survey. The number of employed in Douglas County hovered around 21,500 between In 2009, the number of unemployed increased due to the Great Recession. The Source: Local Area Unemployment Sta s cs, Bureau of Labor Sta s cs number of employed is now higher than pre recession levels. 3


6 Industry Employment and Wages The graph above demonstrates employment and payroll data collected from all businesses that are covered by unemployment insurance, around 96% of all employment. Industry employment in Douglas County contracted 0.1% in 2016 when compared to a year earlier, ranking 58th out of Wisconsin s 72 coun es. Wisconsin s employ ment grew by 1.2%, while the Na on s grew by 1.7%. The total amount of pay to those working within Douglas County during 2016 was $595.9 million, 3.9% less than in The percentage decrease ranked 70th out of Wis consin s 72 coun es. The Trade, Transporta on, U li es sector represents 28.1% of the county s job base ranking as its largest employment sector. The sector represents only 19.5% of the state s job base. The second table on this page shows the average wage by industry sector for both Douglas County and the State of Wisconsin. It shows the wage differen al between Wisconsin s average wages and the lower average wage rates of Douglas County. Nine out of 11 industry sectors had below average wages in 2016 when compared to Wisconsin, with the Informa on sector being below 50% of the State wage. However, the Trade, Transporta on & U li es sec tor was 105.9% above the Statewide wage. 4
7 Employment Projec ons Above is a table showing the industry employment projec ons for the Northwest Workforce Investment Development Area (Northwest WDA). Douglas is one of ten coun es found within the Northwest WDA. The ten county area is projected to see a 4% increase with 3,099 employed posi ons. The Self employed and unpaid family workers are projected to have the highest growth with 9%. The Construc on, Financial Ac vi es, and Professional and Business Service sectors are projected to each grow at 6%, making them the second highest projected growth industry sectors in the Northwest WDA in terms of percentage. When viewed by the overall change in employment, Educa on and Health Services is projected to be the largest growth industry in the Northwest WDA. Only three industry sectors are projected to decrease in terms of employment during the me period. The Informa on sector is projected to decline in employment more than any other sector, with a 27% decrease. The Other Services and the Public Administra on sectors are projected to shrink by a smaller 6% and 1%, respec vely. Wisconsin s industry employment projec ons do not look similar when comparing which industry sectors in Northwest Wisconsin are projected to see high decline. Employment in the Informa on Industry is projected to see an 8% growth rate at the state level, while in Northwest Wisconsin, it is projected to see a decline in employment of 27%. Similarly, the Other Services Industry is projected to have a 6% growth rate in the Northwest WDA, but for Wisconsin as a whole, the projected growth rate is a posi ve 6%. In the Public Administra on industry, Wisconsin and the Northwest WDA are both projected to see a small decline in employment of 0.5% and 0.6% respec vely. Total Wisconsin employment is projected to grow by 6%, while in Northwest Wisconsin it is projected to grow by 4%. When examining the U.S. industry employment projec ons and comparing it to Wisconsin s and the Northwest WDA s, the percentage gains and losses are not the same. This should be expected given that the na onal projec ons cover a broader, more diverse economy than at the state and regional levels. The state of Wisconsin and its Northwest region specialize in certain industries. An example is the Manufacturing industry. Its employment at the na onal level is projected to shrink by 7% from In Wisconsin, its employment is projected to grow 1%, and in the Northwest WDA, it is projected to grow 2%. 5
8 Employment ProjecƟons Source: Office of Economic Advisors, Wisconsin Department of Workforce Development, September 2015 The table above is the occupa on projec ons for the Northwest WDA. Adding all occupa ons togeth er, the ten year change in employment is projected to be a posi ve 3,099. Looking at the projected annual aver age openings of 2,434, a minority of 403 is due to growth of new jobs and a majority of 2,031 is due to replace ment of workers in exis ng jobs. The top three occupa on groups, in terms of projected annual total openings, have median annual wages of less than the region s median annual wage of $30,441. However, 58% of the pro jected annual total openings have a median annual wage of higher than $30,441. Also, 63% of the projected av erage annual openings due to growth have a median annual wage of more than $30,441. When looking at the projected 10 year change in employment, 66% of the 3,099 employment increase is in occupa ons with a medi an wage higher than $30,441. This suggests the region is transi oning from an economy of lower paying occupa ons to an economy of higher paying occupa ons. Comparing Northwest s projected numbers with the Wiscon sin occupa on numbers is interes ng. The state s median wage is higher by almost $5,000 at $35,110. But only 33% of the projected annual total openings have a median annual wage of higher than $35,110, and only 36% of the projected average annual openings due to growth have a median annual wage of more than $35,110. When looking at the projected 10 year change in Wisconsin s employment, 39% of the 196,009 employment increase is in occupa ons with a median wage higher than $35,110. 6


9 The occupa on group that is projected to grow the fastest in Northwest Wisconsin is Personal Care and Service occupa ons at 14%. Fueling most of that growth is the Personal Care Aides occupa on with a growth rate of 26%. This occupa on is projected to grow due to the aging of the popula on, needing increasing help with basic hygiene and medical services. The graph above displays Northwest Wisconsin s job base by major industry sector outlining the age distribu on of its job holders. The graph examines job holders age based upon jobs located in Northwest Wisconsin without regard to where the worker lives. One will no ce that the age bands can be quite different industry to industry. Two factors that shape this composi on are labor availability and the occupa onal composi on within the industries. Labor availability is dictated by the overarching age composi on of the popula on and the likelihood of par cipa on in the labor force. The highest par cipa on is likely to occur between the ages of mid twen es to late fi ies/early six es. In short, the region s labor pool should mirror its popula on within this age range. Occupa onal composi on is a more complex factor influenced by a job holder s life stage, experience, educa on/ training, etc. Life stage essen ally refers to age. Younger inexperienced workers tend to work in entry level jobs. These entry jobs are more prominent in some industries than others such as the leisure and hospitality sector. Conversely, some industries require workers to have completed a higher level of formal educa on or training such as workers in the educa on and health care sector, and thus have a low share of the youngest working cohort. More educa on typically equals workers of an age who ve made the me investment. In sum, age demographic analysis in terms of the labor market is not exclusively regulated to examining re rees and low birth rates. It suggests the poten al of the workforce because employment choices are influenced by one s life stage. For More Informa on: Thomas Michels Regional Economist Northwest WDA Phone: (715) thomas.michels@dwd.wisconsin.gov 7
2017 ECONOMIC AND WORKFORCE PROFILE Grant County
 2017 ECONOMIC AND WORKFORCE PROFILE Grant County STATE OF WISCONSIN DETI-17957-GRT-P (R. 3/2018) Percentage of Total Popula on, Ages 65 and Older Wisconsin now has more people employed and more private
2017 ECONOMIC AND WORKFORCE PROFILE Buffalo County
 2017 ECONOMIC AND WORKFORCE PROFILE Buffalo County STATE OF WISCONSIN DETI-17957-BUF-P (R. 3/2018) Percentage of Total Popula on, Ages 65 and Older Wisconsin now has more people employed and more private
2017 ECONOMIC AND WORKFORCE PROFILE Monroe County
 2017 ECONOMIC AND WORKFORCE PROFILE Monroe County STATE OF WISCONSIN DETI-17957-MON-P (R. 3/2018) Percentage of Total Popula on, Ages 65 and Older Wisconsin now has more people employed and more private
2017 ECONOMIC AND WORKFORCE PROFILE Waukesha County
 2017 ECONOMIC AND WORKFORCE PROFILE Waukesha County STATE OF WISCONSIN DETI-17957-WAK-P (R. 3/2018) Percentage of Total Popula on, Ages 65 and Older Wisconsin now has more people employed and more private
2017 ECONOMIC AND WORKFORCE PROFILE Florence County
 2017 ECONOMIC AND WORKFORCE PROFILE Florence County STATE OF WISCONSIN DETI-17957-FLO-P (R. 3/2018) Percentage of Total Popula on, Ages 65 and Older Wisconsin now has more people employed and more private
2017 ECONOMIC AND WORKFORCE PROFILE Walworth County
 2017 ECONOMIC AND WORKFORCE PROFILE Walworth County STATE OF WISCONSIN DETI-17957-WLW-P (R. 3/2018) Percentage of Total Popula on, Ages 65 and Older Wisconsin now has more people employed and more private
2017 ECONOMIC AND WORKFORCE PROFILE Wood County
 2017 ECONOMIC AND WORKFORCE PROFILE Wood County STATE OF WISCONSIN DETI-17957-WOD-P (R. 3/2018) Percentage of Total Popula on, Ages 65 and Older Wisconsin now has more people employed and more private
2017 ECONOMIC AND WORKFORCE PROFILE Brown County
 2017 ECONOMIC AND WORKFORCE PROFILE Brown County STATE OF WISCONSIN DETI-17957-BRW-P (R. 3/2018) Percentage of Total Popula on, Ages 65 and Older Wisconsin now has more people employed and more private
2017 ECONOMIC AND WORKFORCE PROFILE Washington County
 2017 ECONOMIC AND WORKFORCE PROFILE Washington County STATE OF WISCONSIN DETI-17957-WGT-P (R. 3/2018) Percentage of Total Popula on, Ages 65 and Older Wisconsin now has more people employed and more private
2017 ECONOMIC AND WORKFORCE PROFILE Kewaunee County
 2017 ECONOMIC AND WORKFORCE PROFILE Kewaunee County STATE OF WISCONSIN DETI-17957-KEW-P (R. 3/2018) Percentage of Total Popula on, Ages 65 and Older Wisconsin now has more people employed and more private
2017 ECONOMIC AND WORKFORCE PROFILE Winnebago County
 2017 ECONOMIC AND WORKFORCE PROFILE Winnebago County STATE OF WISCONSIN DETI-17957-WIN-P (R. 3/2018) Percentage of Total Popula on, Ages 65 and Older Wisconsin now has more people employed and more private
2017 ECONOMIC AND WORKFORCE PROFILE Vernon County
 2017 ECONOMIC AND WORKFORCE PROFILE Vernon County STATE OF WISCONSIN DETI-17957-VRN-P (R. 3/2018) Percentage of Total Popula on, Ages 65 and Older Wisconsin now has more people employed and more private
2017 ECONOMIC AND WORKFORCE PROFILE Green Lake County
 2017 ECONOMIC AND WORKFORCE PROFILE Green Lake County STATE OF WISCONSIN DETI-17957-GRL-P (R. 3/2018) Percentage of Total Popula on, Ages 65 and Older Wisconsin now has more people employed and more private
2017 ECONOMIC AND WORKFORCE PROFILE Clark County
 2017 ECONOMIC AND WORKFORCE PROFILE Clark County STATE OF WISCONSIN DETI-17957-CLK-P (R. 3/2018) Percentage of Total Popula on, Ages 65 and Older Wisconsin now has more people employed and more private
2017 ECONOMIC AND WORKFORCE PROFILE Pierce County
 2017 ECONOMIC AND WORKFORCE PROFILE Pierce County STATE OF WISCONSIN DETI-17957-PRC-P (R. 3/2018) Percentage of Total Popula on, Ages 65 and Older Wisconsin now has more people employed and more private
2017 ECONOMIC AND WORKFORCE PROFILE Dodge County
 2017 ECONOMIC AND WORKFORCE PROFILE Dodge County STATE OF WISCONSIN DETI-17957-DOD-P (R. 3/2018) Percentage of Total Popula on, Ages 65 and Older Wisconsin now has more people employed and more private
2017 ECONOMIC AND WORKFORCE PROFILE Sauk County
 2017 ECONOMIC AND WORKFORCE PROFILE Sauk County STATE OF WISCONSIN DETI-17957-SAK-P (R. 3/2018) Percentage of Total Popula on, Ages 65 and Older Wisconsin now has more people employed and more private
2017 ECONOMIC AND WORKFORCE PROFILE Dane County
 2017 ECONOMIC AND WORKFORCE PROFILE Dane County STATE OF WISCONSIN DETI-17957-DAN-P (R. 3/2018) Percentage of Total Popula on, Ages 65 and Older Wisconsin now has more people employed and more private
2017 ECONOMIC AND WORKFORCE PROFILE St. Croix County
 2017 ECONOMIC AND WORKFORCE PROFILE St. Croix County STATE OF WISCONSIN DETI-17957-STC-P (R. 3/2018) Percentage of Total Popula on, Ages 65 and Older Wisconsin now has more people employed and more private
2017 ECONOMIC AND WORKFORCE PROFILE Chippewa County
 2017 ECONOMIC AND WORKFORCE PROFILE Chippewa County STATE OF WISCONSIN DETI-17957-CHP-P (R. 3/2018) Percentage of Total Popula on, Ages 65 and Older Wisconsin now has more people employed and more private
2017 ECONOMIC AND WORKFORCE PROFILE Barron County
 2017 ECONOMIC AND WORKFORCE PROFILE Barron County STATE OF WISCONSIN DETI-17957-BRN-P (R. 3/2018) Percentage of Total Popula on, Ages 65 and Older Wisconsin now has more people employed and more private
Burnett County DETI BNT-P (N. 3/2016)
") Burnett County DETI-17957-BNT-P (N. 3/2016) Average Household Income By County Na onal and State Economic Outlook Robust economic growth a er the Great Recession remains an cipated. The recession ended
Burnett County DETI-17957-BNT-P (N. 3/2016) Average Household Income By County Na onal and State Economic Outlook Robust economic growth a er the Great Recession remains an cipated. The recession ended
Price County DETI PRI-P P (N. 3/2016)
") Price County DETI-17957-PRI-P P (N. 3/2016) Average Household Income By County Na onal and State Economic Outlook Robust economic growth a er the Great Recession remains an cipated. The recession ended
Price County DETI-17957-PRI-P P (N. 3/2016) Average Household Income By County Na onal and State Economic Outlook Robust economic growth a er the Great Recession remains an cipated. The recession ended
Columbia County DETI COL-P (N. 3/2016)
") Columbia County DETI-17957-COL-P (N. 3/2016) Average Household Income By County Na onal and State Economic Outlook Robust economic growth a er the Great Recession remains an cipated. The recession ended
Columbia County DETI-17957-COL-P (N. 3/2016) Average Household Income By County Na onal and State Economic Outlook Robust economic growth a er the Great Recession remains an cipated. The recession ended
Dane County DETI DAN-P DAN (N. 3/2016)
") Dane County DETI-17957-DAN-P DAN (N. 3/2016) Average Household Income By County Na onal and State Economic Outlook Robust economic growth a er the Great Recession remains an cipated. The recession ended
Dane County DETI-17957-DAN-P DAN (N. 3/2016) Average Household Income By County Na onal and State Economic Outlook Robust economic growth a er the Great Recession remains an cipated. The recession ended
Racine County DETI RAC-P (N. 3/2016)
") Racine County DETI-17957-RAC-P (N. 3/2016) Average Household Income By County Na onal and State Economic Outlook Robust economic growth a er the Great Recession remains an cipated. The recession ended
Racine County DETI-17957-RAC-P (N. 3/2016) Average Household Income By County Na onal and State Economic Outlook Robust economic growth a er the Great Recession remains an cipated. The recession ended
Kenosha County DETI KEN-P (N. 3/2016)
") Kenosha County DETI-17957-KEN-P (N. 3/2016) Average Household Income By County Na onal and State Economic Outlook Robust economic growth a er the Great Recession remains an cipated. The recession ended
Kenosha County DETI-17957-KEN-P (N. 3/2016) Average Household Income By County Na onal and State Economic Outlook Robust economic growth a er the Great Recession remains an cipated. The recession ended
Rock County DETI RCK-P (N. 3/2016)
") Rock County DETI-17957-RCK-P (N. 3/2016) 2015 Rock County Economic and Workforce Profile Na onal and State Economic Outlook Robust economic growth a er the Great Recession remains an cipated. The recession
Rock County DETI-17957-RCK-P (N. 3/2016) 2015 Rock County Economic and Workforce Profile Na onal and State Economic Outlook Robust economic growth a er the Great Recession remains an cipated. The recession
Eau Claire County DETI ECL-P ECL (N. 3/2016)
") Eau Claire County DETI-17957-ECL-P ECL (N. 3/2016) Average Household Income By County Na onal and State Economic Outlook Robust economic growth a er the Great Recession remains an cipated. The recession
Eau Claire County DETI-17957-ECL-P ECL (N. 3/2016) Average Household Income By County Na onal and State Economic Outlook Robust economic growth a er the Great Recession remains an cipated. The recession
Outagamie County DETI OUT-P (N. 3/2016)
") Outagamie County DETI-17957-OUT-P (N. 3/2016) Average Household Income By County Na onal and State Economic Outlook Robust economic growth a er the Great Recession remains an cipated. The recession ended
Outagamie County DETI-17957-OUT-P (N. 3/2016) Average Household Income By County Na onal and State Economic Outlook Robust economic growth a er the Great Recession remains an cipated. The recession ended
Jackson County DETI JAK-P (N. 3/2016)
") Jackson County DETI-17957-JAK-P (N. 3/2016) 2015 Jackson County Economic and Workforce Profile Na onal and State Economic Outlook Robust economic growth a er the Great Recession remains an cipated. The
Jackson County DETI-17957-JAK-P (N. 3/2016) 2015 Jackson County Economic and Workforce Profile Na onal and State Economic Outlook Robust economic growth a er the Great Recession remains an cipated. The
Economy Overview. Eagle County, CO. Emsi Q Data Set
 Eagle County, CO Emsi Q4 2018 Data Set www.economicmodeling.com Contents. Economy........ Overview......................................................................................... 1... Historic.......&..
Guernsey Economic Overview
 Guernsey Economic Overview Issue date: 19 May 17 The Guernsey Economic Overview brings together the most recent official Guernsey sta s cs and provides an overview of economic condi ons in Guernsey and
County Economic Profile Lee County, MS extension.msstate.edu/economic profiles
 County Economic Profile Lee County, MS extension.msstate.edu/economic profiles Demographics* Lee Mississippi United States Total Popula on, 2017 (Popula on Es mates) 84,933 2,984,100 325,719,178 Percent
County Economic Profile Copiah County, MS extension.msstate.edu/economic profiles
 County Economic Profile Copiah County, MS extension.msstate.edu/economic profiles Demographics* Copiah Mississippi United States Total Popula on, 2017 (Popula on Es mates) 28,516 2,984,100 325,719,178
County Economic Profile Marion County, MS extension.msstate.edu/economic profiles
 County Economic Profile Marion County, MS extension.msstate.edu/economic profiles Demographics* Marion Mississippi United States Total Popula on, 2017 (Popula on Es mates) 25,069 2,984,100 325,719,178
County Economic Profile Jasper County, MS extension.msstate.edu/economic profiles
 County Economic Profile Jasper County, MS extension.msstate.edu/economic profiles Demographics* Jasper Mississippi United States Total Popula on, 2017 (Popula on Es mates) 16,582 2,984,100 325,719,178
County Economic Profile Monroe County, MS extension.msstate.edu/economic profiles
 County Economic Profile Monroe County, MS extension.msstate.edu/economic profiles Demographics* Monroe Mississippi United States Total Popula on, 2017 (Popula on Es mates) 35,872 2,984,100 325,719,178
County Economic Profile Leflore County, MS extension.msstate.edu/economic profiles
 County Economic Profile Leflore County, MS extension.msstate.edu/economic profiles Demographics* Leflore Mississippi United States Total Popula on, 2017 (Popula on Es mates) 29,223 2,984,100 325,719,178
County Economic Profile Bolivar County, MS extension.msstate.edu/economic profiles
 County Economic Profile Bolivar County, MS extension.msstate.edu/economic profiles Demographics* Bolivar Mississippi United States Total Popula on, 2017 (Popula on Es mates) 31,945 2,984,100 325,719,178
County Economic Profile Tunica County, MS extension.msstate.edu/economic profiles
 County Economic Profile Tunica County, MS extension.msstate.edu/economic profiles Demographics* Tunica Mississippi United States Total Popula on, 2017 (Popula on Es mates) 10,024 2,984,100 325,719,178
County Economic Profile Coahoma County, MS extension.msstate.edu/economic profiles
 County Economic Profile Coahoma County, MS extension.msstate.edu/economic profiles Demographics* Coahoma Mississippi United States Total Popula on, 2017 (Popula on Es mates) 23,154 2,984,100 325,719,178
County Economic Profile Lamar County, MS extension.msstate.edu/economic profiles
 County Economic Profile Lamar County, MS extension.msstate.edu/economic profiles Demographics* Lamar Mississippi United States Total Popula on, 2017 (Popula on Es mates) 61,374 2,984,100 325,719,178 Percent
County Economic Profile Clarke County, MS extension.msstate.edu/economic profiles
 County Economic Profile Clarke County, MS extension.msstate.edu/economic profiles Demographics* Clarke Mississippi United States Total Popula on, 2017 (Popula on Es mates) 15,828 2,984,100 325,719,178
County Economic Profile Smith County, MS extension.msstate.edu/economic profiles
 County Economic Profile Smith County, MS extension.msstate.edu/economic profiles Demographics* Smith Mississippi United States Total Popula on, 2017 (Popula on Es mates) 16,078 2,984,100 325,719,178 Percent
Economy Overview. Summit County, CO. Emsi Q Data Set
 Summit County, CO Emsi Q4 2018 Data Set www.economicmodeling.com Contents. Economy........ Overview......................................................................................... 1... Historic.......&..
Quarterly Labour Market Report. August 2017
 Quarterly Labour Market Report August 2017 MB14363 August 2017 Ministry of Business, Innovation and Employment (MBIE) Hikina Whakatutuki - Lifting to make successful MBIE develops and delivers policy,
Economy Overview. Esmeralda County, NV. Emsi Q Data Set
 Esmeralda County, NV Emsi Q3 2018 Data Set www.economicmodeling.com Economy Overview 795 403 $43.1K Popula on (2017) Jobs (2017) Median Household Income (2016) Popula on grew by 26 over the last 5 years
2012 ALBANY COUNTY EXECUTIVE BUDGET
 2012 ALBANY COUNTY EXECUTIVE BUDGET INTRODUCTION AND HIGHLIGHTS Economic Forecast MICHAEL G. BRESLIN County Execu ve INTRODUCTION This sec on of the budget provides a survey of economic indicators and
Camden County, MO. Economy Overview. Michele Kroll, Community Development Specialist,
 Camden County, MO Michele Kroll, Community Development Specialist, krollm@missouri.edu Emsi Q1 2018 Data Set www.economicmodeling.com Contents. Economy........ Overview.........................................................................................
La Crosse County, WI
 La Crosse County, WI Mississippi River Regional Planning Commission 1707 Main Street, Suite 435 La Crosse, Wisconsin 54601 Emsi Q4 2018 Data Set www.economicmodeling.com Contents. Economy........ Overview.........................................................................................
Economy Overview. Pitkin County, CO. Emsi Q Data Set
 Pitkin County, CO Emsi Q4 2018 Data Set www.economicmodeling.com Contents. Economy........ Overview......................................................................................... 1... Historic.......&..
14 Coun es. Economy Overview. West Virginia Department of Commerce Capitol Complex, Bldg. 6, Room 525 Charleston, West Virginia 25305
 14 Coun es West Virginia Department of Commerce Capitol Complex, Bldg. 6, Room 525 Charleston, West Virginia 25305 Emsi Q4 2018 Data Set www.economicmodeling.com Contents. Economy........ Overview.........................................................................................
Miller County, MO. Economy Overview. Michele Kroll, Community Development Specialist,
 Miller County, MO Michele Kroll, Community Development Specialist, krollm@missouri.edu Emsi Q1 2018 Data Set www.economicmodeling.com Contents. Economy........ Overview.........................................................................................
O awa County, MI. Economy Overview. Michigan Economic Development Corpora on. 300 N. Washington Square, Lower Level Lansing, Michigan 48913
 O awa County, MI Michigan Economic Development Corpora on 300 N. Washington Square, Lower Level Lansing, Michigan 48913 Emsi Q4 2018 Data Set www.economicmodeling.com Contents. Economy........ Overview.........................................................................................
Economy Overview. Grand County, CO. Emsi Q Data Set
 Grand County, CO Emsi Q4 2018 Data Set www.economicmodeling.com Contents. Economy........ Overview......................................................................................... 1... Historic.......&..
Pennington County, SD
 Pennington County, SD 730 E. Watertown Street, Suite 102 Rapid City, South Dakota 57701 Emsi Q2 2018 Data Set www.economicmodeling.com Contents. Economy........ Overview.........................................................................................
Quarterly Labour Market Report. August 2018
 Quarterly Labour Market Report August 2018 Ministry of Business, Innovation and Employment (MBIE) Hikina Whakatutuki - Lifting to make successful MBIE develops and delivers policy, services, advice and
Economy Overview. Monroe County, WI. Emsi Q Data Set
 Monroe County, WI Emsi Q4 2017 Data Set www.economicmodeling.com Contents. Economy........ Overview......................................................................................... 1... Historic.......&..
which looks like a credit card, but is electronically connected to the cardholder s bank account.
 U C C T C Y F A L 1.4.1.F1 Credit is derived from the La n word credo meaning I believe. Credit is when goods, services, or money is received in exchange for a promise to pay a definite sum of money at
Bucks County, PA. Economy Overview. Bucks County Workforce Development Board, Inc Veterans Highway Bristol, Pennsylvania 19007
 Bucks County, PA Bucks County Workforce Development Board, Inc. 1268 Veterans Highway Bristol, Pennsylvania 19007 Emsi Q4 2018 Data Set www.economicmodeling.com Contents. Economy........ Overview.........................................................................................
Allegan County, MI. Economy Overview. Michigan Economic Development Corpora on. 300 N. Washington Square, Lower Level Lansing, Michigan 48913
 Allegan County, MI Michigan Economic Development Corpora on 300 N. Washington Square, Lower Level Lansing, Michigan 48913 Emsi Q4 2018 Data Set www.economicmodeling.com Contents. Economy........ Overview.........................................................................................
Quarterly Labour Market Report. November 2017
 Quarterly Labour Market Report November 2017 MBIE 3518 November 2017 Ministry of Business, Innovation and Employment (MBIE) Hikina Whakatutuki - Lifting to make successful MBIE develops and delivers policy,
Credit Reports and Scores
 Credit Reports and Scores Advanced Level The Importance of a Credit History for Obtaining Credit Credit refers to borrowing. You have used credit if you receive money, goods, or services in exchange for
CHAPTER I. Contextual background on Moldova. A. Historical and poli cal context. Table 2: General facts about Moldova
 CHAPTER I Contextual background on Moldova A. Historical and poli cal context Moldova is a small, landlocked country situated towards the east of the UNECE region, bordering Romania and Ukraine. It has
Superior Trade Zone. Economy Overview. Lake Superior Community Partnership. 501 S. Front Street Marque e, Michigan 49855
 Superior Trade Zone Lake Superior Community Partnership 501 S. Front Street Marque e, Michigan 49855 Emsi Q3 2018 Data Set www.economicmodeling.com Contents. Economy........ Overview.........................................................................................
3 New Hampshire ZIPs
 3 New Hampshire ZIPs New Hampshire Economic Development 172 Pembroke Rd Concord, New Hampshire 03301 Emsi Q4 2018 Data Set www.economicmodeling.com Contents. Economy........ Overview.........................................................................................
2 North San Joaquin Valley Index. Prepared by: Jeffrey A. Michael and Thomas E. Pogue
 Prepared by: Jeffrey A. Michael and Thomas E. Pogue This report has been prepared by the Center for Business and Policy Research at the University of the Pacific. This publica on was supported by JP Morgan
Communica on with Local Communi es. Hiring Local Manpower and Resources. Office Open in Belgrade
 Defining and adopting the Stakeholder Engagement Plan (SEP) Rakita has defined the Stakeholder Engagement Plan (SEP), which represents the base-line for communica on and cooperaon with target audiences
Industry Snapshot. Workforce Alliance of the North Bay. Emsi Q Data Set. September Emsi Q Data Set
 Industry Snapshot Emsi Q3 2018 Data Set September 2018 Workforce Alliance of the North Bay 1546 First Street Napa, California 94559 (707) 253-4697 Emsi Q3 2018 Data Set www.economicmodeling.com Page 1/7
Highest Ranked Industries Top 10 Industries (2-Digit) in PVCC Service Region
 in PVCC Service Region") Highest Ranked Industries Top 10 Industries (2-Digit) in PVCC Service Region Emsi Q2 2018 Data Set June 2018 Piedmont Virginia Community College 501 College Drive Charlo esville, Virginia 22902 Emsi Q2
Highest Ranked Industries Top 10 Industries (2-Digit) in PVCC Service Region Emsi Q2 2018 Data Set June 2018 Piedmont Virginia Community College 501 College Drive Charlo esville, Virginia 22902 Emsi Q2
Palo Pinto County, TX
 Palo Pinto County, TX Emsi Q3 2018 Data Set www.economicmodeling.com Contents. Economy........ Overview......................................................................................... 1... Historic.......&..
Economy Overview. Ellis County, TX. Emsi Q Data Set
 Ellis County, TX Emsi Q3 2018 Data Set www.economicmodeling.com Contents. Economy........ Overview......................................................................................... 1... Historic.......&..
Economy Overview. Hunt County, TX. Emsi Q Data Set
 Hunt County, TX Emsi Q4 2018 Data Set www.economicmodeling.com Contents. Economy........ Overview......................................................................................... 1... Historic.......&..
Guide to Pregnancy & Parental Leaves for OSSTF/FEESO
 Guide to Pregnancy & Parental Leaves for OSSTF/FEESO Table of Contents Introduc on........................................................2 Plan Ahead.........................................................3
Industry Snapshot. Finance and Insurance
 Industry Snapshot Finance and Insurance Emsi Q2 2018 Data Set April 2018 Workforce Solutions for North Central Texas is an equal opportunity employer/program. Auxiliary aids and services are available
1 Purpose Introduction Review of policy Best Execu on Delivery of Best Execution Scope...
 Order Execution Policy w w w.houseofborse.com HOUSE Of BÖRSE Limited is authorized and regulated by the Financial Conduct Authority. UK FCA Register Number: 631382. Registered in England andwale s, number:
Table of Contents. Long Range Financial Plan 27. Report Introduction 1
 Table of Contents Report Introduction 1 Water/Wastewater Long Range Financial Planning 2 Principles of Financial Sustainability 4 Importance of a Long Range Financial Plan 5 General Approach to Preparing
Credit Card Offer Scavenger Hunt
 Page 11 1.4.1.A1 Credit Card Offer Scavenger Hunt Total Points Earned Name 16 Total Points Possible Date Percentage Class Step 1: Find and highlight each of the vocabulary words in the table below in the
WORKFORCE RESULTS. October 1 December 31, 2013 Second Quarter, Program Year 2013
 WORKFORCE RESULTS October 1 December 31, 2013 Second Quarter, Program Year 2013 WORKFORCE RESULTS Submi ed By: The Department of Workforce Services provides this overview of performance for the period
4.6% 5,852,000 23,941
 PA MONTHLY WORKSTATS LABOR FORCE JOBS UNEMPLOYMENT COMPENSATION PA Monthly WorkStats presents the most up-to-date labor market highlights and happenings in the commonwealth. Information herein is produced
NATIONAL MILK RECORDS PLC
 16543 National Milk Records:Layout 3 21/08/2012 13:38 Page 1 NATIONAL MILK RECORDS PLC Summary financial statement for the year ended 31 March 2012 Na onal Milk Records plc ( NMR or the Company ) Audited
The Advisors Inner Circle Fund II
 The Advisors Inner Circle Fund II A Class Shares PROSPECTUS June 1, 2018 Frost Total Return Bond Fund (FAJEX) Frost Credit Fund (FCFBX) Investment Adviser: Frost Investment Advisors, LLC The U.S. Securi
Economy Overview. Collin County, TX. Emsi Q Data Set
 Collin County, TX Emsi Q3 2018 Data Set www.economicmodeling.com Contents. Economy........ Overview......................................................................................... 1... Historic.......&..
Economy Overview. Denton County, TX. Emsi Q Data Set
 Denton County, TX Emsi Q1 2018 Data Set www.economicmodeling.com Contents. Economy........ Overview......................................................................................... 1... Historic.......&..
Industry Snapshot. Health Care
 Industry Snapshot Health Care Emsi Q2 2018 Data Set April 2018 Workforce Solutions for North Central Texas is an equal opportunity employer/program. Auxiliary aids and services are available upon request
Occupa on Overview. Bakersfield College. Emsi Q Data Set. September Emsi Q Data Set
 Occupa on Overview Emsi Q3 2017 Data Set September 2017 Bakersfield College 1801 Panorama Drive Bakersfield, California 93305 661.395.4921 Emsi Q3 2017 Data Set www.economicmodeling.com Page 1/10 Parameters
Deputy Finance Director Recruitment
 Deputy Finance Director Recruitment The City of Cape Girardeau, serving a growing popula on of 39,000, is succession planning for their Finance Director. The city is located between St. Louis and Memphis
Introduc on to Depository Ins tu ons
 Introduc on to Depository Ins tu ons Advanced Level Millions of people use financial services offered by depository ins tu ons on a daily basis to help them manage their money. Commercial banks, credit
Economy Overview. Navarro County, TX. Emsi Q Data Set
 Economy Overview Navarro County, TX Emsi Q3 2017 Data Set www.economicmodeling.com Economy Overview Contents. Economy........ Overview.........................................................................................
Bloomberg Survey of Economists
 Bloomberg Survey of Economists December 2018 Economists Lower Rate Forecasts but Expect Economy to Con nue Growing in 2019 Economists revised their 2019 growth forecasts slightly lower and expect interest
City of Henderson/Henderson County Fiscal Court Net Profit License Tax Return
 FORM NP City of Henderson/Henderson County Fiscal Court Net Profit License Tax Return City/County Acct # Period Ending Business Type Individual Corpora on Partnership LLC/Individual LLC/Partnership Other
City of Henderson/Henderson County Fiscal Court Net Profit License Tax Return
 FORM NP City of Henderson/Henderson County Fiscal Court Net Profit License Tax Return City/County Acct # Period Ending Business Type Individual Corpora on Partnership LLC/Individual LLC/Partnership Other
Population by Year. Ray County, Missouri 23,712 23,541. Population by Age. Ray County, Missouri 27% 27% 22%
 emographics, popula on has decreased by 3 percent since 2 and its popula on now stands at 22,754. or more informa on on Ray County, please visit www.raycountymo.com. Popula on by Year Population by Year
Community Bankers for Compliance 2019
 Community Bankers for Compliance 2019 Providing prac cal and user friendly compliance techniques rela ng to all areas of compliance. Sponsored By:, IN February 12 & 13, 2019 May 7 & 8, 2019 August 6 &
Massachusetts Outlook,
 Massachusetts Outlook, 2016-2020 Highlights The state s economic growth will be pulled by two forces in opposite directions. Constraining growth will be a slower increase in the availability of workers
City of Guelph. Financial Condi on Assessment. September 24, 2015
 City of Guelph Financial Condi on Assessment September 24, 2015 62 Table of Contents Exeuctive Summary Introduction 1 Trend Analysis 2 Peer Analysis 2 Questions to Consider 3 Key Indicators 4 Section 1
REQUEST FOR PROPOSAL PREPARATION OF A LOCAL HAZARD MITIGATION PLAN (HMP) FOR HUERFANO COUNTY
 FOR HUERFANO COUNTY") REQUEST FOR PROPOSAL PREPARATION OF A LOCAL HAZARD MITIGATION PLAN (HMP) FOR HUERFANO COUNTY PROJECT OVERVIEW: Huerfano County Emergency Management is seeking qualified consultants to submit proposals
REQUEST FOR PROPOSAL PREPARATION OF A LOCAL HAZARD MITIGATION PLAN (HMP) FOR HUERFANO COUNTY PROJECT OVERVIEW: Huerfano County Emergency Management is seeking qualified consultants to submit proposals
Personal Exemp ons. Standard Deduc on
 Personal Exemp ons Taxpayer, Spouse, Qualified Child Qualified Rela ve $4,050 for each person in the household All Personal Exemp ons are Eliminated Standard Deduc on If your filing status is... Single
most important SBI LIFE - CAPASSURE GOLD UIN: 111N091V02
 Secure your most important asset : your employees SBI LIFE - CAPASSURE GOLD UIN: 111N091V02 SBI Life CapAssure Gold plan SBI Life Insurance Company Limited (SBI Life) offers SBI Life CapAssure Gold plan,