Kenosha County DETI KEN-P (N. 3/2016)
|
|
|
- Thomasina Holland
- 6 years ago
- Views:
Transcription


1 Kenosha County DETI KEN-P (N. 3/2016)


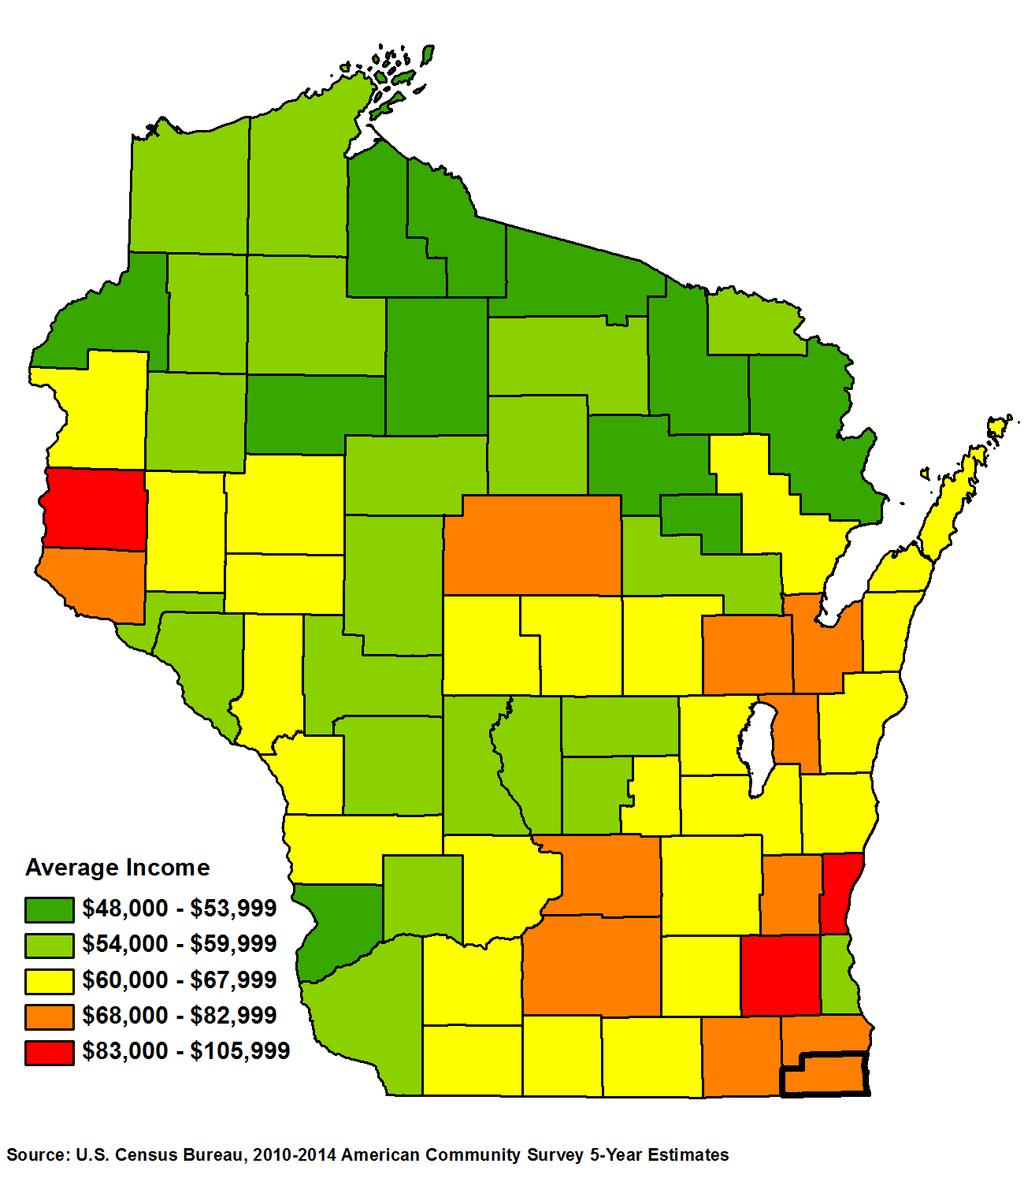
2 Average Household Income By County
3 Na onal and State Economic Outlook Robust economic growth a er the Great Recession remains an cipated. The recession ended in June of This recovery has been the slowest of post war cycles. U.S. gross domes c product (GDP) growth through this recovery cycle has averaged just over two percent per year. Most recoveries show growth rates in the three percent range. As with all economic growth, benefits have accrued. Job levels are up. Wages have increased. Home values are nearly back to prerecession levels. Wisconsin total non farm jobs have increased by 200,000 since the trough in February 2010 through October The state's manufacturing industries have gained almost 50,000 jobs. Total nominal wages paid have increased by 17 percent since bo oming out in Aggregate household real estate values have all but full recovered from the na onal housing devalua ons that began in So what is it, six years a er the recession ended, that is holding the na onal economy back from even stronger growth? A variety of factors are having an impact, such as: flat real wages, lack of business investment, focus of business investment, slower global economic growth, a stronger U.S. currency and its impact on U.S. and Wisconsin exports, and snug government capital and opera ons budgets. The silver lining may be that the slower the growth, the longer the recovery will last. This recovery is 70 months old as of December 2015 with no expected downturn in sight. The average growth period of post war business cycles is 58.4 months. Workforce Outlook On the workforce front, there is much discussion of the "skills gap" the inability of employers to find and keep skilled workers. One anecdote o en voiced is that Wisconsin companies could expand business if only they could find and retain skilled workers. Wisconsin has never had more people employed and the unemployment rate is registering low levels not seen since the early 2000s. However, as has been discussed repeatedly over the years (Winters, Strang, & Klus, 2000; Winters, Gehrke, Grosso, & Udalova, 2009; Wisconsin Taxpayer Alliance, 2015), Wisconsin faces a quan ty challenge and, as a consequence, a skills challenge. Source: Local Area Unemployment Sta s cs, Bureau of Labor Sta s cs 1
4 Businesses will be compe ng not only with each other for workers with similar skills, but also with en es of other disciplines. For example, one company may try to recruit a math teacher to become a computer programmer. Then the school will have to find another math teacher from, say, an insurance company, which, in turn, may try to recruit someone out of health care. The point is that without enough workers to go around, some businesses will end up short of talent. This is true not only of highly skilled workers, but for all posi ons. Even retail and restaurant opera ons are displaying help wanted signs. During the late 1990s when the U.S. economic expansion was se ng new longevity marks, there was a similar quan ty challenge. The na onal unemployment rate fell to 3.8 percent in July 2000 and Wisconsin's unemployment rate fell to 3.0 percent in July of Two recessions alleviated the labor quan ty constraints from 2001 to Now the U.S. unemployment rate is down to 5.0 percent (Wisconsin December 2015 seasonally adjusted unemployment rate was 4.3 percent), GDP is only growing at 2.0 percent, and businesses are already experiencing quan ty challenges. The major change in the labor force during this period is that now the Baby Boomers are fi een years older and leaving the labor force in unprecedented numbers. The oldest Baby Boomers (born in 1946) will be 70 years old in The youngest (born in 1964) will be 52 years old, a mere three years from a rapid decline in their par cipa on in the labor force. Below is a graph of the labor force par cipa on rate (LFPR) by age cohort. The LFPR drops precipitously a er age 55. The bulk of the Baby Boomers are now over age 55. Source: Bureau of Labor Sta s cs Wisconsin's overall labor force par cipa on rate peaked in the late 1990s and the employment to popula on ra o (e/pop) peaked in 1997 at 72.9 percent. The 2014 e/pop rate was above the 2010 low of 63.4 percent, at 64.7 percent. The exit of Baby Boomers (people born between 1946 and 1964) from the labor market will affect future growth of Wisconsin s e/pop rate. Popula on growth and age distribu on will drive labor force availability in local and regional labor sheds. Below are county level demographic and economic characteriza ons. The primary factor driving economic trends in future years will be workforce developments and talent access. 2
5 Popula on and Demographics Kenosha County s 10 Most Populous Municipalities April 2010 Census January 2015 Proportional Numeric Change Estimate Change United States 308,400, ,289,069 11,888, % Wisconsin 5,686,986 5,753,324 66, % Kenosha County 166, ,493 1, % Kenosha, City 99,218 99, % Pleasant Prairie, Village 19,719 20, % Salem, Town 12,067 12, % Somers, Town 9,597 9, % Twin Lakes, Village 5,989 6, % Bristol, Village 4,914 4, % Wheatland, Town 3,373 3, % Randall, Town 3,180 3, % Paddock Lake, Village 2,992 2, % Silver Lake, Village 2,411 2, % Source: Demographic Services Center, Wisconsin Department of Administra on The chart above lists Kenosha County s ten largest municipali es and compares popula on growth since the 2010 Census at the municipal, county, state, and na onal level. Popula on growth in Wisconsin and Kenosha County was slow as compared to the United States, although Kenosha s growth rate was somewhat higher than the state s and much higher than neighboring coun es. Walworth County to the west grew by.02 percent while Racine County to the north grew by 76 residents during the period for a growth rate of less than.01 percent. Kenosha County growth of 1,067 residents, or 0.6 percent, distributed differently among municipali es. While the City of Kenosha and Village of Pleasant Prairie experienced strong popula on growth, the Towns of Somers and Wheatland experienced popula on declines during the period. Components of Popula on Change The graph to the right displays the components of popula on growth in Kenosha County, the state, and the na on. The components include migra on, which is movement of residents into and out of the area, and natural increases and decreases resul ng from births and deaths. Popula on growth has been further fueled with a strong birth rate. Net migra on remains nega ve. Kenosha was hit especially hard by the Great Recession and its a ermath, which, along with its proximity to Illinois, contributed to its higher rate of out migra on. The county s strong natural increase is a reflec on of its younger popula on, which had a median age of 37.4 in 2014 compared to 39.2 in Wisconsin. 2.2% 1.9% 1.1% 0.6% 0.8% 1.6% United States Wisconsin Kenosha County Natural Increase Net Migration Source: Demographic Services Center, Wisconsin Department of Administra on 3
6 Labor Force Dynamics The graph to the right tracks the unemployment Unemployment Rates Not Seasonally Adjusted rate in Kenosha 14% County since 1990 and United States Wisconsin Kenosha County compares it to state and na onal rates during the same me period. Since this unemployment data has not been seasonally adjusted, or smoothed, the graph also shows seasonal 12% 10% 8% 6% 4% 2% 0% employment vari a ons within each year. The seasonality of the Source: Local Area Unemployment Sta s cs, Bureau of Labor Sta s cs county s labor market is moderate and typical, with normal peaks of unemployment early in the year and again in summer as students enter the job market in search of work, and normal troughs late in the year. The Great Recession caused na onal, state, and county unemployment rates to rise sharply a er 2008 and peak in early Since then, rates have steadily fallen as the economy has recovered. Kenosha County s average annual unemployment rate in 2015 was 5.2 percent, which was higher than the state rate of 4.6 percent, but lower than the na onal rate of 5.3 percent. Jan 1990 Jan 1991 Jan 1992 Jan 1993 Jan 1994 Jan 1995 Jan 1996 Jan 1997 Jan 1998 Jan 1999 Jan 2000 Jan 2001 Jan 2002 Jan 2003 Jan 2004 Jan 2005 Jan 2006 Jan 2007 Jan 2008 Jan 2009 Jan 2010 Jan 2011 Jan 2012 Jan 2013 Jan 2014 Jan 2015 The unemployment rate is closely related to the labor force par cipa on rate (LFPR), which reflects not only an area s economic condi ons, but also its age demographics. It is the por on of the popula on age 16 years and older who are employed or ac vely seeking employment. Aging of Labor Force Participation Rates the popula on combined with high unemployment during and a er the Great Recession have caused na onal, state, and county LFPRs to trend downward in recent years. But recent ghtening in the job market has a racted more par cipants, causing par cipa on rates to level off. 82% 80% 78% 76% 74% 72% 70% 68% 66% 64% 62% 60% 58% 56% 54% 52% 50% 48% Kenosha County Wisconsin United States Source: Current Popula on Survey, U.S. Department of Commerce, Census Bureau The employment and wage distribu on graph above shows the one year change in employment and the economic impact of industry sectors in Kenosha County from 4
7 Industry Employment and Wages 2014 Employment and Wage Distribution by Industry in Kenosha County Employment % of Total Employment Annual 1 year Total % of Total Payroll Average change Payroll Natural Resources $ 6,582,163 Construction 1, $ 72,095,103 Manufacturing 7, $ 363,291,898 Trade, Transportation, Utilities 13, $ 517,305,201 Information $ 14,099,095 Financial Activities 1, $ 53,417,170 Professional & Business Services 6, $ 299,188,908 Education & Health 13, $ 605,517,768 Leisure & Hospitality 6, $ 94,576,049 Other services 1,589 1 $ 39,833,463 Public Administration 3, $ 131,877,145 Not assigned 0 0 $ 00% All industries 55,075 1,720 $2,197,783,963 10% 20% 30% Source: WI DWD, Bureau of Workforce Training, Quarterly Census Employment and Wages, June 2015 both an employment and payroll perspec ve. The county s job base grew by 1,720 jobs or 3.2 percent during 2014, which was more than double average statewide job growth of 1.3 percent during the same period. Strongest employment growth occurred in trade, transporta on, and u li es (TTU), with job gains of 685 divided evenly between the retail and warehousing subsectors. TTU is the county s second largest employment sector a er educa on and health services, but if its rapid growth con nues, it may soon become the county s largest. Manufacturing and leisure and hospitality, which are about half the size of TTU, also added significant numbers of jobs. TTU accounts for 24 percent of the county s jobs and 23 percent of total county payroll. Manufacturing s share of total jobs and payroll is 13 and 17 percent, respec vely, while leisure and hospitality's share is 13 percent of total jobs and four percent of payroll. This disparity reflects Average Annual Wage by Industry Division in 2014 the compara vely higher Wisconsin Kenosha Average County wages paid to manufacturing Annual Average Percent of 1 year % workers than to workers in Wage Annual Wage Wisconsin change leisure and hospitality and All industries $ 43,856 $ 39, % 2.7% Natural Resources $ 36,156 $ 25, % 2.9% other sectors. Construction $ 55,317 $ 53, % 7.2% Manufacturing $ 54,365 $ 51, % 4.3% The table at the bo om of Trade, Transportation & Utilities $ 37,362 $ 39, % 3.5% page five shows annual average wage by industry in Ke Information $ 62,482 $ 50, % 15.1% Financial Activities $ 61,884 $ 41, % 1.1% Professional & Business Services $ 52,386 $ 48, % 1.2% nosha County, compares Education & Health $ 44,829 $ 43, % 2.2% those wages to the statewide Leisure & Hospitality $ 16,055 $ 13, % 4.9% average, and displays the Other Services $ 25,847 $ 25, % 10.9% Public Administration $ 44,462 $ 41, % 1.4% county s one year change in Source: WI DWD, Labor Market Information, QCEW, June 2015 each of the sectors. Ke 5
8 Employment Projec ons Southeast Workforce Development Area Industry Projections, Kenosha, Racine and Walworth Counties Projected Change ( ) Industry Employment Employment Employment Percent All Industries 185, ,324 19,618 11% Natural Resources 6,420 6, % Construction 4,348 5, % Manufacturing 33,613 36,719 3,106 9% Trade, Transportation, and Utilities 32,095 34,863 2,768 9% Information % Financial Activities 5,198 5, % Professional and Business Services 15,223 18,484 3,261 21% Education and Health Services 42,491 48,144 5,653 13% Leisure and Hospitality 19,860 22,369 2,509 13% Other Services 5,443 5, % Public Administration 9,797 10, % Self Employed and Unpaid Family Workers 10,273 10, % Source: Office of Economic Advisors, Wisconsin Department of Workforce Development, September nosha s average annual wage is nine percent less than the state average but increased at a slightly faster rate, 2.7% in Kenosha County compared to 2.5% in Wisconsin. Trade, transporta on and u li es was the only county sector paying wages that exceeded the state average, a likely result of rapid growth in that industry. The table above presents ten year regional employment projec ons by industry sector for the Southeast Workforce Development Area, which is comprised of Racine, Kenosha, and Walworth Coun es. The change in the number of jobs from 2012 to 2022 represents new jobs expected to be created during the period. In 2014, Racine had the largest job base of the three coun es, with 44 percent of the region s jobs. Kenosha and Walworth coun es had 33 and 24 percent, respec vely. Ten year regional employment growth is projected to exceed statewide projected job growth of 7.1 percent. Jobs in the three county area are expected to increase 11 percent between 2012 and 2022, with average annual growth of 1.1 percent or 1,962 jobs per year. Employment in the area grew by over 3,000 new jobs or 1.9 percent during 2014, exceeding projec ons. Most of the job growth occurred in Kenosha County which, despite comprising 33 percent of the regional job base, accounted for 54 percent of the area s new jobs in The educa on and health services sector is projected to add the most jobs between 2012 and 2022, with health services employment expected to grow faster than educa onal services. The professional and business services sector, which provides professional, technical, and administra ve services to businesses, is also expected to add jobs. A large por on of recent and projected growth in this sector are in the employment services subsector, which o en provide business with temporary workers. These workers may work in a variety of industries such as health care or manufacturing, but as long as they are employed by an employment services establishment, their jobs are counted in the professional and business services sector, even if they are a nurse working in a hospital or a welder working in a manufacturing plant. To get more detailed informa on about the types of jobs included in employment projec ons, we can also look at expected job growth by occupa on. The table above displays projected total job openings through 2022 and in 6
9 Employment Projec ons Southeast Workforce Development Area Occupation Projections, Kenosha, Racine and Walworth Counties Employment Average Annual Openings Change ( ) Due to Median Due to Replace Total Annual Occupation Group Number Percent Growth ment Openings Wage All Occupations 185, ,324 19,618 11% 2,047 4,462 6,509 $ 31,892 Management 8,492 9, % $ 87,429 Business and Financial 5,748 6, % $ 55,529 Computer and Mathematical 1,457 1, % $ 62,575 Architecture and Engineering 2,677 2, % $ 67,167 Life, Physical, and Social Science % $ 55,847 Community and Social Service 2,368 2, % $ 41,122 Legal % $ 54,657 Education, Training, and Library 13,406 14,532 1,126 8% $ 47,831 Arts, Entertainment and Media 2,540 2, % $ 38,745 Healthcare Practitioners 9,160 11,029 1,869 20% $ 60,470 Healthcare Support 4,446 5, % $ 28,118 Protective Service 4,013 4, % $ 41,078 Food Preparation and Serving 16,333 18,043 1,710 10% $ 18,440 Building & Grounds Maintenance 7,224 8,315 1,091 15% $ 23,263 Personal Care and Service 9,825 11,282 1,457 15% $ 21,334 Sales and Related 17,920 19,005 1,085 6% $ 22,821 Office and Administrative Support 27,100 28,856 1,756 6% $ 30,593 Farming, Fishing, and Forestry 2,983 2, % $ 27,528 Construction and Extraction 4,855 5, % $ 50,932 Installation, Maintenance, Repair 6,787 7, % $ 42,190 Production 22,994 25,209 2,215 10% $ 31,378 Transportation & Material Moving 13,914 15,735 1,821 13% $ 28,273 Source: Office of Economic Advisors, Wisconsin Department of Workforce Development, September 2015 cludes not only openings resul ng from the crea on of new jobs (Change column) but also replacement openings in previously created jobs that are an cipated to occur as incumbent workers leave those posi ons, necessita ng the hiring of new workers to replace them (Replacement Openings column). Large numbers of Baby Boomers are expected to re re within the next few years, which is why projected replacement openings exceed the number of openings expected to occur as a result of job growth. This phenomenon is occurring not only in the Southeast region, but throughout the state economy as well. The largest number of job openings are projected in office and administra ve support, food prepara on and serving, produc on, and sales and related. Large numbers of replacement openings are projected in those occupa ons that are not expected to grow significantly, such as office and administra ve support and sales and related. This is especially common in occupa ons with older workforces and large numbers of an cipated re rements during the projec on period, as well as low wage occupa ons which tend to have younger workforces but higher rates of employee turnover. The chart on the next page displays the ten year personal income trend in Kenosha County, Wisconsin and the United States. Dollar amounts have been adjusted for infla on to allow comparison between 2004 and Personal income consists of earned income from employment plus income from assets (dividends, interest, and rent receipts) plus transfer receipts. Transfer receipts are government payments not made in exchange for 7
10 2004 Nominal Per Capita Personal Income 2004 Per Capita Personal Income in 2014 dollars Personal Income 2014 Per Capita Personal Income Source: Bureau of Economic Analysis Nominal Change in Per Capita Personal Income ( ) Inflation adjusted Change in Per Capita Personal Income ( ) United States $34,316 $41,709 $46, % 10.4% Wisconsin $33,350 $40,534 $44, % 9.0% Kenosha County $31,969 $38,856 $39, % 2.3% goods or services. Examples include, but are not limited to, social security checks, Unemployment Insurance, veterans benefits, Medicare, Medicaid, and public assistance. Per capita personal income (PCPI) is calculated by dividing total personal income in a geographic area by that area s total popula on. The popula on number used to calculate PCPI is the en re popula on, not just those of working age, and includes children, re rees and others who are not typically wage earners. Similar to adjus ng for infla on, which allows us to compare between me periods, adjus ng personal income to a per capita basis allows us compare areas which have differ 2014 Per Capita Personal Income Change in Per Capita Personal Income, Inflation adjusted Kenosha County $39,748 Kenosha County 2.3% Wisconsin $44,186 Wisconsin 9.0% United States $46,049 United States 10.4% $0 $20,000 $40,000 $60,000 10% 0% 10% 20% Source: Bureau of Economic Analysis ent popula on sizes. Kenosha s PCPI of $39,748 in 2014 was less than state and na onal PCPI. Ten year nominal increase in personal income was lower than state and na onal income growth and a er adjus ng for infla on, county PCPI increased by 2.3 percent since Even with recent strong job growth in the county, recession related job losses and high unemployment resulted in slow income growth over the last ten years. For More Informa on: Wandy Miezio Regional Economist Southeast, Milwaukee, and WOW WDA Phone: (262) wandy.miezio@dwd.wisconsin.gov h p://dwd.wisconsin.gov/oea 8
Racine County DETI RAC-P (N. 3/2016)
") Racine County DETI-17957-RAC-P (N. 3/2016) Average Household Income By County Na onal and State Economic Outlook Robust economic growth a er the Great Recession remains an cipated. The recession ended
Racine County DETI-17957-RAC-P (N. 3/2016) Average Household Income By County Na onal and State Economic Outlook Robust economic growth a er the Great Recession remains an cipated. The recession ended
Columbia County DETI COL-P (N. 3/2016)
") Columbia County DETI-17957-COL-P (N. 3/2016) Average Household Income By County Na onal and State Economic Outlook Robust economic growth a er the Great Recession remains an cipated. The recession ended
Columbia County DETI-17957-COL-P (N. 3/2016) Average Household Income By County Na onal and State Economic Outlook Robust economic growth a er the Great Recession remains an cipated. The recession ended
Dane County DETI DAN-P DAN (N. 3/2016)
") Dane County DETI-17957-DAN-P DAN (N. 3/2016) Average Household Income By County Na onal and State Economic Outlook Robust economic growth a er the Great Recession remains an cipated. The recession ended
Dane County DETI-17957-DAN-P DAN (N. 3/2016) Average Household Income By County Na onal and State Economic Outlook Robust economic growth a er the Great Recession remains an cipated. The recession ended
Price County DETI PRI-P P (N. 3/2016)
") Price County DETI-17957-PRI-P P (N. 3/2016) Average Household Income By County Na onal and State Economic Outlook Robust economic growth a er the Great Recession remains an cipated. The recession ended
Price County DETI-17957-PRI-P P (N. 3/2016) Average Household Income By County Na onal and State Economic Outlook Robust economic growth a er the Great Recession remains an cipated. The recession ended
Burnett County DETI BNT-P (N. 3/2016)
") Burnett County DETI-17957-BNT-P (N. 3/2016) Average Household Income By County Na onal and State Economic Outlook Robust economic growth a er the Great Recession remains an cipated. The recession ended
Burnett County DETI-17957-BNT-P (N. 3/2016) Average Household Income By County Na onal and State Economic Outlook Robust economic growth a er the Great Recession remains an cipated. The recession ended
Rock County DETI RCK-P (N. 3/2016)
") Rock County DETI-17957-RCK-P (N. 3/2016) 2015 Rock County Economic and Workforce Profile Na onal and State Economic Outlook Robust economic growth a er the Great Recession remains an cipated. The recession
Rock County DETI-17957-RCK-P (N. 3/2016) 2015 Rock County Economic and Workforce Profile Na onal and State Economic Outlook Robust economic growth a er the Great Recession remains an cipated. The recession
2017 ECONOMIC AND WORKFORCE PROFILE Walworth County
 2017 ECONOMIC AND WORKFORCE PROFILE Walworth County STATE OF WISCONSIN DETI-17957-WLW-P (R. 3/2018) Percentage of Total Popula on, Ages 65 and Older Wisconsin now has more people employed and more private
2017 ECONOMIC AND WORKFORCE PROFILE Waukesha County
 2017 ECONOMIC AND WORKFORCE PROFILE Waukesha County STATE OF WISCONSIN DETI-17957-WAK-P (R. 3/2018) Percentage of Total Popula on, Ages 65 and Older Wisconsin now has more people employed and more private
2017 ECONOMIC AND WORKFORCE PROFILE Washington County
 2017 ECONOMIC AND WORKFORCE PROFILE Washington County STATE OF WISCONSIN DETI-17957-WGT-P (R. 3/2018) Percentage of Total Popula on, Ages 65 and Older Wisconsin now has more people employed and more private
Outagamie County DETI OUT-P (N. 3/2016)
") Outagamie County DETI-17957-OUT-P (N. 3/2016) Average Household Income By County Na onal and State Economic Outlook Robust economic growth a er the Great Recession remains an cipated. The recession ended
Outagamie County DETI-17957-OUT-P (N. 3/2016) Average Household Income By County Na onal and State Economic Outlook Robust economic growth a er the Great Recession remains an cipated. The recession ended
Jackson County DETI JAK-P (N. 3/2016)
") Jackson County DETI-17957-JAK-P (N. 3/2016) 2015 Jackson County Economic and Workforce Profile Na onal and State Economic Outlook Robust economic growth a er the Great Recession remains an cipated. The
Jackson County DETI-17957-JAK-P (N. 3/2016) 2015 Jackson County Economic and Workforce Profile Na onal and State Economic Outlook Robust economic growth a er the Great Recession remains an cipated. The
Eau Claire County DETI ECL-P ECL (N. 3/2016)
") Eau Claire County DETI-17957-ECL-P ECL (N. 3/2016) Average Household Income By County Na onal and State Economic Outlook Robust economic growth a er the Great Recession remains an cipated. The recession
Eau Claire County DETI-17957-ECL-P ECL (N. 3/2016) Average Household Income By County Na onal and State Economic Outlook Robust economic growth a er the Great Recession remains an cipated. The recession
2017 ECONOMIC AND WORKFORCE PROFILE Florence County
 2017 ECONOMIC AND WORKFORCE PROFILE Florence County STATE OF WISCONSIN DETI-17957-FLO-P (R. 3/2018) Percentage of Total Popula on, Ages 65 and Older Wisconsin now has more people employed and more private
2017 ECONOMIC AND WORKFORCE PROFILE Winnebago County
 2017 ECONOMIC AND WORKFORCE PROFILE Winnebago County STATE OF WISCONSIN DETI-17957-WIN-P (R. 3/2018) Percentage of Total Popula on, Ages 65 and Older Wisconsin now has more people employed and more private
2017 ECONOMIC AND WORKFORCE PROFILE Kewaunee County
 2017 ECONOMIC AND WORKFORCE PROFILE Kewaunee County STATE OF WISCONSIN DETI-17957-KEW-P (R. 3/2018) Percentage of Total Popula on, Ages 65 and Older Wisconsin now has more people employed and more private
2017 ECONOMIC AND WORKFORCE PROFILE Green Lake County
 2017 ECONOMIC AND WORKFORCE PROFILE Green Lake County STATE OF WISCONSIN DETI-17957-GRL-P (R. 3/2018) Percentage of Total Popula on, Ages 65 and Older Wisconsin now has more people employed and more private
2017 ECONOMIC AND WORKFORCE PROFILE Brown County
 2017 ECONOMIC AND WORKFORCE PROFILE Brown County STATE OF WISCONSIN DETI-17957-BRW-P (R. 3/2018) Percentage of Total Popula on, Ages 65 and Older Wisconsin now has more people employed and more private
2017 ECONOMIC AND WORKFORCE PROFILE Grant County
 2017 ECONOMIC AND WORKFORCE PROFILE Grant County STATE OF WISCONSIN DETI-17957-GRT-P (R. 3/2018) Percentage of Total Popula on, Ages 65 and Older Wisconsin now has more people employed and more private
2017 ECONOMIC AND WORKFORCE PROFILE Douglas County
 2017 ECONOMIC AND WORKFORCE PROFILE Douglas County STATE OF WISCONSIN DETI-17957-DOU-P (R. 3/2018) Percentage of Total Popula on, Ages 65 and Older Wisconsin now has more people employed and more private
2017 ECONOMIC AND WORKFORCE PROFILE Clark County
 2017 ECONOMIC AND WORKFORCE PROFILE Clark County STATE OF WISCONSIN DETI-17957-CLK-P (R. 3/2018) Percentage of Total Popula on, Ages 65 and Older Wisconsin now has more people employed and more private
2017 ECONOMIC AND WORKFORCE PROFILE Wood County
 2017 ECONOMIC AND WORKFORCE PROFILE Wood County STATE OF WISCONSIN DETI-17957-WOD-P (R. 3/2018) Percentage of Total Popula on, Ages 65 and Older Wisconsin now has more people employed and more private
2017 ECONOMIC AND WORKFORCE PROFILE Monroe County
 2017 ECONOMIC AND WORKFORCE PROFILE Monroe County STATE OF WISCONSIN DETI-17957-MON-P (R. 3/2018) Percentage of Total Popula on, Ages 65 and Older Wisconsin now has more people employed and more private
2017 ECONOMIC AND WORKFORCE PROFILE Buffalo County
 2017 ECONOMIC AND WORKFORCE PROFILE Buffalo County STATE OF WISCONSIN DETI-17957-BUF-P (R. 3/2018) Percentage of Total Popula on, Ages 65 and Older Wisconsin now has more people employed and more private
2017 ECONOMIC AND WORKFORCE PROFILE Vernon County
 2017 ECONOMIC AND WORKFORCE PROFILE Vernon County STATE OF WISCONSIN DETI-17957-VRN-P (R. 3/2018) Percentage of Total Popula on, Ages 65 and Older Wisconsin now has more people employed and more private
2017 ECONOMIC AND WORKFORCE PROFILE Dodge County
 2017 ECONOMIC AND WORKFORCE PROFILE Dodge County STATE OF WISCONSIN DETI-17957-DOD-P (R. 3/2018) Percentage of Total Popula on, Ages 65 and Older Wisconsin now has more people employed and more private
2017 ECONOMIC AND WORKFORCE PROFILE Sauk County
 2017 ECONOMIC AND WORKFORCE PROFILE Sauk County STATE OF WISCONSIN DETI-17957-SAK-P (R. 3/2018) Percentage of Total Popula on, Ages 65 and Older Wisconsin now has more people employed and more private
2017 ECONOMIC AND WORKFORCE PROFILE Dane County
 2017 ECONOMIC AND WORKFORCE PROFILE Dane County STATE OF WISCONSIN DETI-17957-DAN-P (R. 3/2018) Percentage of Total Popula on, Ages 65 and Older Wisconsin now has more people employed and more private
2017 ECONOMIC AND WORKFORCE PROFILE Pierce County
 2017 ECONOMIC AND WORKFORCE PROFILE Pierce County STATE OF WISCONSIN DETI-17957-PRC-P (R. 3/2018) Percentage of Total Popula on, Ages 65 and Older Wisconsin now has more people employed and more private
2017 ECONOMIC AND WORKFORCE PROFILE St. Croix County
 2017 ECONOMIC AND WORKFORCE PROFILE St. Croix County STATE OF WISCONSIN DETI-17957-STC-P (R. 3/2018) Percentage of Total Popula on, Ages 65 and Older Wisconsin now has more people employed and more private
2017 ECONOMIC AND WORKFORCE PROFILE Chippewa County
 2017 ECONOMIC AND WORKFORCE PROFILE Chippewa County STATE OF WISCONSIN DETI-17957-CHP-P (R. 3/2018) Percentage of Total Popula on, Ages 65 and Older Wisconsin now has more people employed and more private
2017 ECONOMIC AND WORKFORCE PROFILE Barron County
 2017 ECONOMIC AND WORKFORCE PROFILE Barron County STATE OF WISCONSIN DETI-17957-BRN-P (R. 3/2018) Percentage of Total Popula on, Ages 65 and Older Wisconsin now has more people employed and more private
La Crosse County, WI
 La Crosse County, WI Mississippi River Regional Planning Commission 1707 Main Street, Suite 435 La Crosse, Wisconsin 54601 Emsi Q4 2018 Data Set www.economicmodeling.com Contents. Economy........ Overview.........................................................................................
Economy Overview. Eagle County, CO. Emsi Q Data Set
 Eagle County, CO Emsi Q4 2018 Data Set www.economicmodeling.com Contents. Economy........ Overview......................................................................................... 1... Historic.......&..
Economy Overview. Pitkin County, CO. Emsi Q Data Set
 Pitkin County, CO Emsi Q4 2018 Data Set www.economicmodeling.com Contents. Economy........ Overview......................................................................................... 1... Historic.......&..
Economy Overview. Summit County, CO. Emsi Q Data Set
 Summit County, CO Emsi Q4 2018 Data Set www.economicmodeling.com Contents. Economy........ Overview......................................................................................... 1... Historic.......&..
Miller County, MO. Economy Overview. Michele Kroll, Community Development Specialist,
 Miller County, MO Michele Kroll, Community Development Specialist, krollm@missouri.edu Emsi Q1 2018 Data Set www.economicmodeling.com Contents. Economy........ Overview.........................................................................................
Pennington County, SD
 Pennington County, SD 730 E. Watertown Street, Suite 102 Rapid City, South Dakota 57701 Emsi Q2 2018 Data Set www.economicmodeling.com Contents. Economy........ Overview.........................................................................................
Economy Overview. Grand County, CO. Emsi Q Data Set
 Grand County, CO Emsi Q4 2018 Data Set www.economicmodeling.com Contents. Economy........ Overview......................................................................................... 1... Historic.......&..
Allegan County, MI. Economy Overview. Michigan Economic Development Corpora on. 300 N. Washington Square, Lower Level Lansing, Michigan 48913
 Allegan County, MI Michigan Economic Development Corpora on 300 N. Washington Square, Lower Level Lansing, Michigan 48913 Emsi Q4 2018 Data Set www.economicmodeling.com Contents. Economy........ Overview.........................................................................................
Camden County, MO. Economy Overview. Michele Kroll, Community Development Specialist,
 Camden County, MO Michele Kroll, Community Development Specialist, krollm@missouri.edu Emsi Q1 2018 Data Set www.economicmodeling.com Contents. Economy........ Overview.........................................................................................
Guernsey Economic Overview
 Guernsey Economic Overview Issue date: 19 May 17 The Guernsey Economic Overview brings together the most recent official Guernsey sta s cs and provides an overview of economic condi ons in Guernsey and
3 New Hampshire ZIPs
 3 New Hampshire ZIPs New Hampshire Economic Development 172 Pembroke Rd Concord, New Hampshire 03301 Emsi Q4 2018 Data Set www.economicmodeling.com Contents. Economy........ Overview.........................................................................................
Burnett County Workforce Profile
 Percentage of working-age population aged 60 years and older in 2020 23.2% - 30.0% 30.1% - 40.0% 40.1% - 49.3% State average 29.4% Office of Economic Advisors OEA-10599-P Beverly Gehrke 15618 Windrose
Bucks County, PA. Economy Overview. Bucks County Workforce Development Board, Inc Veterans Highway Bristol, Pennsylvania 19007
 Bucks County, PA Bucks County Workforce Development Board, Inc. 1268 Veterans Highway Bristol, Pennsylvania 19007 Emsi Q4 2018 Data Set www.economicmodeling.com Contents. Economy........ Overview.........................................................................................
14 Coun es. Economy Overview. West Virginia Department of Commerce Capitol Complex, Bldg. 6, Room 525 Charleston, West Virginia 25305
 14 Coun es West Virginia Department of Commerce Capitol Complex, Bldg. 6, Room 525 Charleston, West Virginia 25305 Emsi Q4 2018 Data Set www.economicmodeling.com Contents. Economy........ Overview.........................................................................................
O awa County, MI. Economy Overview. Michigan Economic Development Corpora on. 300 N. Washington Square, Lower Level Lansing, Michigan 48913
 O awa County, MI Michigan Economic Development Corpora on 300 N. Washington Square, Lower Level Lansing, Michigan 48913 Emsi Q4 2018 Data Set www.economicmodeling.com Contents. Economy........ Overview.........................................................................................
Superior Trade Zone. Economy Overview. Lake Superior Community Partnership. 501 S. Front Street Marque e, Michigan 49855
 Superior Trade Zone Lake Superior Community Partnership 501 S. Front Street Marque e, Michigan 49855 Emsi Q3 2018 Data Set www.economicmodeling.com Contents. Economy........ Overview.........................................................................................
Economy Overview. Hunt County, TX. Emsi Q Data Set
 Hunt County, TX Emsi Q4 2018 Data Set www.economicmodeling.com Contents. Economy........ Overview......................................................................................... 1... Historic.......&..
Palo Pinto County, TX
 Palo Pinto County, TX Emsi Q3 2018 Data Set www.economicmodeling.com Contents. Economy........ Overview......................................................................................... 1... Historic.......&..
County Economic Profile Leflore County, MS extension.msstate.edu/economic profiles
 County Economic Profile Leflore County, MS extension.msstate.edu/economic profiles Demographics* Leflore Mississippi United States Total Popula on, 2017 (Popula on Es mates) 29,223 2,984,100 325,719,178
Polk County Labor Market Review
 Polk County Labor Market Review Polk County has a labor force of approximately 281,000 with 265,000 of them employed as of June 2016. The labor force reversed the 2014 2015 trend by growing 0.22% between
Economy Overview. Esmeralda County, NV. Emsi Q Data Set
 Esmeralda County, NV Emsi Q3 2018 Data Set www.economicmodeling.com Economy Overview 795 403 $43.1K Popula on (2017) Jobs (2017) Median Household Income (2016) Popula on grew by 26 over the last 5 years
County Economic Profile Marion County, MS extension.msstate.edu/economic profiles
 County Economic Profile Marion County, MS extension.msstate.edu/economic profiles Demographics* Marion Mississippi United States Total Popula on, 2017 (Popula on Es mates) 25,069 2,984,100 325,719,178
Quarterly Labour Market Report. August 2017
 Quarterly Labour Market Report August 2017 MB14363 August 2017 Ministry of Business, Innovation and Employment (MBIE) Hikina Whakatutuki - Lifting to make successful MBIE develops and delivers policy,
County Economic Profile Jasper County, MS extension.msstate.edu/economic profiles
 County Economic Profile Jasper County, MS extension.msstate.edu/economic profiles Demographics* Jasper Mississippi United States Total Popula on, 2017 (Popula on Es mates) 16,582 2,984,100 325,719,178
County Economic Profile Bolivar County, MS extension.msstate.edu/economic profiles
 County Economic Profile Bolivar County, MS extension.msstate.edu/economic profiles Demographics* Bolivar Mississippi United States Total Popula on, 2017 (Popula on Es mates) 31,945 2,984,100 325,719,178
County Economic Profile Lee County, MS extension.msstate.edu/economic profiles
 County Economic Profile Lee County, MS extension.msstate.edu/economic profiles Demographics* Lee Mississippi United States Total Popula on, 2017 (Popula on Es mates) 84,933 2,984,100 325,719,178 Percent
Economy Overview. Ellis County, TX. Emsi Q Data Set
 Ellis County, TX Emsi Q3 2018 Data Set www.economicmodeling.com Contents. Economy........ Overview......................................................................................... 1... Historic.......&..
County Economic Profile Coahoma County, MS extension.msstate.edu/economic profiles
 County Economic Profile Coahoma County, MS extension.msstate.edu/economic profiles Demographics* Coahoma Mississippi United States Total Popula on, 2017 (Popula on Es mates) 23,154 2,984,100 325,719,178
County Economic Profile Copiah County, MS extension.msstate.edu/economic profiles
 County Economic Profile Copiah County, MS extension.msstate.edu/economic profiles Demographics* Copiah Mississippi United States Total Popula on, 2017 (Popula on Es mates) 28,516 2,984,100 325,719,178
County Economic Profile Tunica County, MS extension.msstate.edu/economic profiles
 County Economic Profile Tunica County, MS extension.msstate.edu/economic profiles Demographics* Tunica Mississippi United States Total Popula on, 2017 (Popula on Es mates) 10,024 2,984,100 325,719,178
Environmental Justice Task Force
 Attachment 5 Year 2050 Population and Economic Forecasts #211068v1 Environmental Justice Task Force April 16, 2013 1 Introduction Population and economic projections serve as a basis for updating the regional
Economy Overview. Collin County, TX. Emsi Q Data Set
 Collin County, TX Emsi Q3 2018 Data Set www.economicmodeling.com Contents. Economy........ Overview......................................................................................... 1... Historic.......&..
Rock County Workforce Profile 2011
 Rock County Workforce Profile 2011 Proportional Population Change by Minor Civil Division 2000 2010 Source: US Census Bureau, 2000 Census and WI Dept. of Administration Demographic Services, January 2010
County Economic Profile Lamar County, MS extension.msstate.edu/economic profiles
 County Economic Profile Lamar County, MS extension.msstate.edu/economic profiles Demographics* Lamar Mississippi United States Total Popula on, 2017 (Popula on Es mates) 61,374 2,984,100 325,719,178 Percent
County Economic Profile Monroe County, MS extension.msstate.edu/economic profiles
 County Economic Profile Monroe County, MS extension.msstate.edu/economic profiles Demographics* Monroe Mississippi United States Total Popula on, 2017 (Popula on Es mates) 35,872 2,984,100 325,719,178
County Economic Profile Clarke County, MS extension.msstate.edu/economic profiles
 County Economic Profile Clarke County, MS extension.msstate.edu/economic profiles Demographics* Clarke Mississippi United States Total Popula on, 2017 (Popula on Es mates) 15,828 2,984,100 325,719,178
Economy Overview. Navarro County, TX. Emsi Q Data Set
 Economy Overview Navarro County, TX Emsi Q3 2017 Data Set www.economicmodeling.com Economy Overview Contents. Economy........ Overview.........................................................................................
Economy Overview. Navarro County, TX. Emsi Q Data Set
 Economy Overview Navarro County, TX Emsi Q4 2017 Data Set www.economicmodeling.com Economy Overview Contents. Economy........ Overview.........................................................................................
Rifle city Demographic and Economic Profile
 Rifle city Demographic and Economic Profile Community Quick Facts Population (2014) 9,289 Population Change 2010 to 2014 156 Place Median HH Income (ACS 10-14) $52,539 State Median HH Income (ACS 10-14)
County Economic Profile Smith County, MS extension.msstate.edu/economic profiles
 County Economic Profile Smith County, MS extension.msstate.edu/economic profiles Demographics* Smith Mississippi United States Total Popula on, 2017 (Popula on Es mates) 16,078 2,984,100 325,719,178 Percent
Economy Overview. Denton County, TX. Emsi Q Data Set
 Denton County, TX Emsi Q1 2018 Data Set www.economicmodeling.com Contents. Economy........ Overview......................................................................................... 1... Historic.......&..
Economy Overview. Monroe County, WI. Emsi Q Data Set
 Monroe County, WI Emsi Q4 2017 Data Set www.economicmodeling.com Contents. Economy........ Overview......................................................................................... 1... Historic.......&..
Regional Economics 6-1. Northwest Regional Comprehensive Plan Regional Economics
 Regional Economics Northwest Regional Economy Economic information specifically for the Northwest Region of Wisconsin is provided in this chapter. The following data and related analysis addresses population,
Quarterly Labour Market Report. August 2018
 Quarterly Labour Market Report August 2018 Ministry of Business, Innovation and Employment (MBIE) Hikina Whakatutuki - Lifting to make successful MBIE develops and delivers policy, services, advice and
UPSTATE NEW YORK REGIONAL NO. 1, ISSUE NO Baby-Boom Retirements and Emerging Labor Market Pressures Richard Deitz
 UPSTATE NEW YORK REGIONAL REVIEW VOLUME NO. 1, ISSUE NO. 1 2006 Baby-Boom Retirements and Emerging Labor Market Pressures Richard Deitz As the baby-boom generation begins to retire, employers in upstate
Quarterly Labour Market Report. November 2017
 Quarterly Labour Market Report November 2017 MBIE 3518 November 2017 Ministry of Business, Innovation and Employment (MBIE) Hikina Whakatutuki - Lifting to make successful MBIE develops and delivers policy,
ECONOMIC OVERVIEW DuPage County, Illinois
 ECONOMIC OVERVIEW DuPage County, Illinois DEMOGRAPHIC PROFILE... 3 EMPLOYMENT TRENDS... 5 UNEMPLOYMENT RATE... 5 WAGE TRENDS... 6 COST OF LIVING INDEX... 7 INDUSTRY SNAPSHOT... 8 OCCUPATION SNAPSHOT...
2016 Labor Market Profile
 2016 Labor Market Profile Prepared by The Tyler Economic Development Council Tyler Area Sponsor June 2016 The ability to demonstrate a regions availability of talented workers has become a vital tool
Florida: An Economic Overview
 Florida: An Economic Overview December 26, 2018 Presented by: The Florida Legislature Office of Economic and Demographic Research 850.487.1402 http://edr.state.fl.us Shifting in Key Economic Variables
A summary of economic events, data, and trends published by the Community Research Institute. The Workforce Without the Baby Boomers
 Allen County Insight A summary of economic events, data, and trends published by the October 2014 On the web: www.ipfw.edu/cri In this Issue Focus on... Baby Boomers and Labor Force Also... Employment
PROPERTY VALUES AND TAXES IN SOUTHEAST WISCONSIN
 PROPERTY VALUES AND TAXES IN SOUTHEAST WISCONSIN September 2017 Rob Henken, President Maddie Keyes, Research Intern Jeff Schmidt, Data & Technology Director Sponsored by: T a b l e o f C o n t e n t s
Highest Ranked Industries Top 10 Industries (2-Digit) in PVCC Service Region
 in PVCC Service Region") Highest Ranked Industries Top 10 Industries (2-Digit) in PVCC Service Region Emsi Q2 2018 Data Set June 2018 Piedmont Virginia Community College 501 College Drive Charlo esville, Virginia 22902 Emsi Q2
Highest Ranked Industries Top 10 Industries (2-Digit) in PVCC Service Region Emsi Q2 2018 Data Set June 2018 Piedmont Virginia Community College 501 College Drive Charlo esville, Virginia 22902 Emsi Q2
Ravenna s most significant growth occurred before Between 1960 and 1980 the city s population declined by 8.5%.
 DRAFT Ravenna Comprehensive Plan Draft May 2008 1 A Profile of Ravenna This section examines demographic trends that will affect Ravenna. The analysis examines population and demographic dynamics, including
2 North San Joaquin Valley Index. Prepared by: Jeffrey A. Michael and Thomas E. Pogue
 Prepared by: Jeffrey A. Michael and Thomas E. Pogue This report has been prepared by the Center for Business and Policy Research at the University of the Pacific. This publica on was supported by JP Morgan
2012 ALBANY COUNTY EXECUTIVE BUDGET
 2012 ALBANY COUNTY EXECUTIVE BUDGET FUND BALANCE and RESERVES MICHAEL G. BRESLIN County Execu ve FUND BALANCE The undesignated, unappropriated fund balance is one measure of Albany County s overall financial
Economic Overview. Lawrence, KS MSA
 Economic Overview Lawrence, KS MSA March 5, 2019 DEMOGRAPHIC PROFILE... 3 EMPLOYMENT TRENDS... 5 UNEMPLOYMENT RATE... 5 WAGE TRENDS... 6 COST OF LIVING INDEX... 7 INDUSTRY SNAPSHOT... 8 OCCUPATION SNAPSHOT...
Economy Overview. Greater Lima Region. Emsi Q Data Set
 Greater Lima Region Emsi Q3 2017 Data Set www.economicmodeling.com Contents. Economy........ Overview......................................................................................... 1... Historic.......&..
Tyler Area Economic Overview
 Tyler Area Economic Overview Demographic Profile. 2 Unemployment Rate. 4 Wage Trends. 4 Cost of Living Index...... 5 Industry Clusters. 5 Occupation Snapshot. 6 Education Levels 7 Gross Domestic Product
American Community Survey 5-Year Estimates
 S2401 OCCUPATION BY SEX AND MEDIAN EARNINGS IN THE PAST 12 MONTHS (IN 2012 INFLATION- ADJUSTED DOLLARS) FOR THE CIVILIAN EMPLOYED POPULATION 16 YEARS AND OVER 2008-2012 American Community Survey 5-Year
By Sarah Pilipaitis, CT DOL Economist
 THE CONNECTICUT ECONOMIC DIGEST Vol.21 No.5 A joint publication of the Connecticut Department of Labor & the Connecticut Department of Economic and Community Development MAY 2016 IN THIS ISSUE... Connecticut
Sussex Demographic and Labor Market Trends
 Sussex Demographic and Labor Market Trends Ed Simon (302) 672-6845 edward.simon@state.de.us October 2013 Introduction Statistical Update Differences among the regions in Sussex Demographic, economic and
Deputy Finance Director Recruitment
 Deputy Finance Director Recruitment The City of Cape Girardeau, serving a growing popula on of 39,000, is succession planning for their Finance Director. The city is located between St. Louis and Memphis
Economic Overview York County, South Carolina. February 14, 2018
 Economic Overview York County, February 14, 2018 DEMOGRAPHIC PROFILE... 3 EMPLOYMENT TRENDS... 5 UNEMPLOYMENT RATE... 5 WAGE TRENDS... 6 COST OF LIVING INDEX... 6 INDUSTRY SNAPSHOT... 7 OCCUPATION SNAPSHOT...
2012 ALBANY COUNTY EXECUTIVE BUDGET
 2012 ALBANY COUNTY EXECUTIVE BUDGET INTRODUCTION AND HIGHLIGHTS Economic Forecast MICHAEL G. BRESLIN County Execu ve INTRODUCTION This sec on of the budget provides a survey of economic indicators and
Forecast for Muskegon County
 2015 2016 Forecast for Muskegon County 2014 Was Another Great Year, but I Am Still Looking for Clouds George A. Erickcek Brian Pittelko W.E. Upjohn Institute for Employment Research January 30, 2015 A
Economic Overview Monterey County, California. July 22, 2016
 Economic Overview Monterey July 22, 2016 DEMOGRAPHIC PROFILE... 3 EMPLOYMENT TRENDS... 5 UNEMPLOYMENT RATE... 5 WAGE TRENDS... 6 COST OF LIVING INDEX... 6 INDUSTRY SNAPSHOT... 7 OCCUPATION SNAPSHOT...
2016 Marquette County
 2016 Marquette County Economic Data Booklet LAKE SUPERIOR COMMUNITY PARTNERSHIP Business Development Department July 2017 The Lake Superior Community Partnership is the Marquette County region s leading
Sussex Demographic and Labor Market Trends
 Sussex Demographic and Labor Market Trends Ed Simon (302) 672-6845 edward.simon@state.de.us October 2012 Introduction Statistical Update Economic and labor market update for 2012 Is Sussex doing better?
Massachusetts Outlook,
 Massachusetts Outlook, 2016-2020 Highlights The state s economic growth will be pulled by two forces in opposite directions. Constraining growth will be a slower increase in the availability of workers