Outagamie County DETI OUT-P (N. 3/2016)
|
|
|
- Caren Snow
- 6 years ago
- Views:
Transcription


1 Outagamie County DETI OUT-P (N. 3/2016)


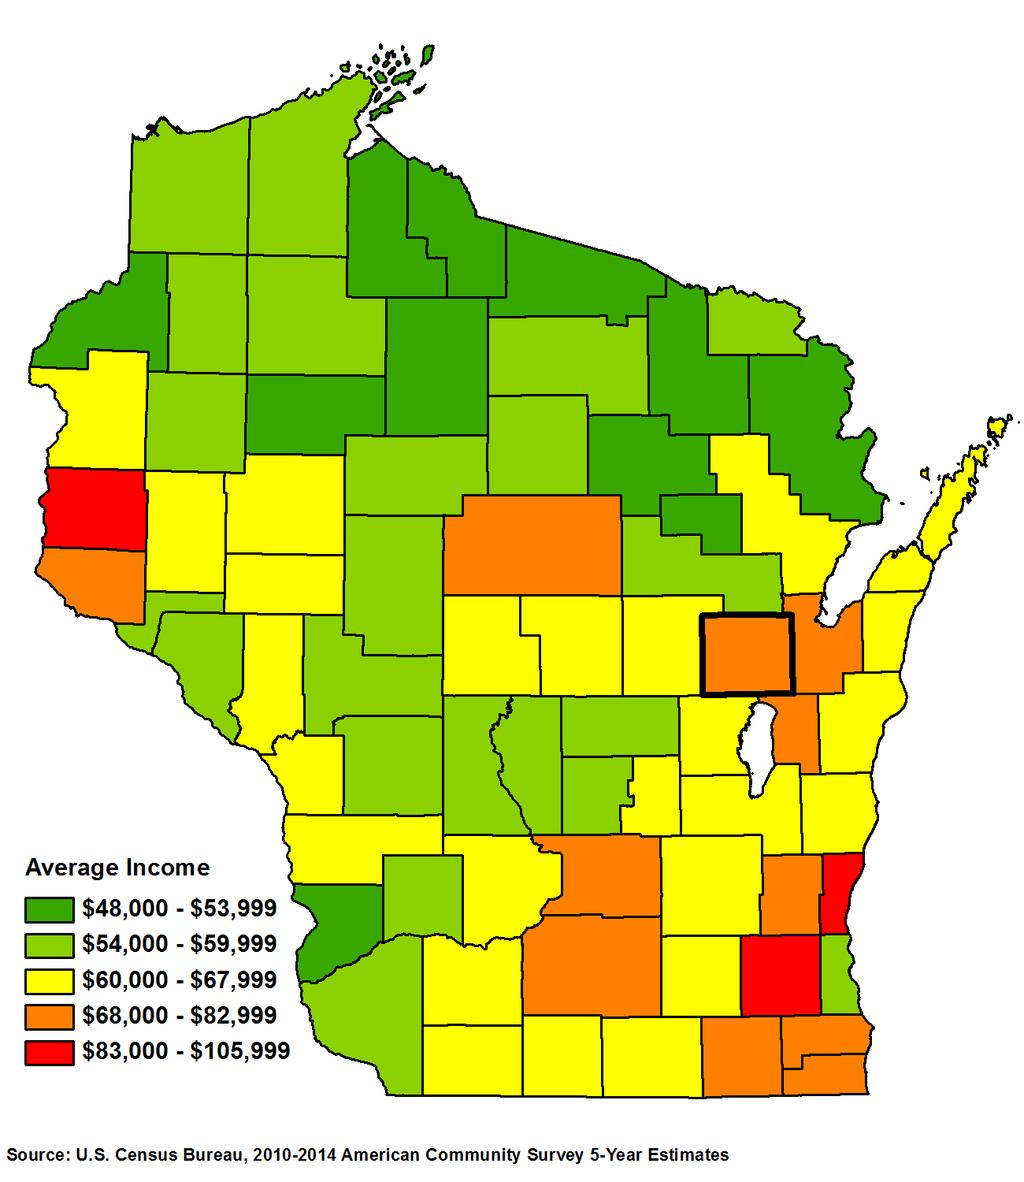
2 Average Household Income By County
3 Na onal and State Economic Outlook Robust economic growth a er the Great Recession remains an cipated. The recession ended in June of This recovery has been the slowest of post war cycles. U.S. gross domes c product (GDP) growth through this recovery cycle has averaged just over two percent per year. Most recoveries show growth rates in the three percent range. As with all economic growth, benefits have accrued. Job levels are up. Wages have increased. Home values are nearly back to prerecession levels. Wisconsin total non farm jobs have increased by 200,000 since the trough in February 2010 through October The state's manufacturing industries have gained almost 50,000 jobs. Total nominal wages paid have increased by 17 percent since bo oming out in Aggregate household real estate values have all but full recovered from the na onal housing devalua ons that began in So what is it, six years a er the recession ended, that is holding the na onal economy back from even stronger growth? A variety of factors are having an impact, such as: flat real wages, lack of business investment, focus of business investment, slower global economic growth, a stronger U.S. currency and its impact on U.S. and Wisconsin exports, and snug government capital and opera ons budgets. The silver lining may be that the slower the growth, the longer the recovery will last. This recovery is 70 months old as of December 2015 with no expected downturn in sight. The average growth period of post war business cycles is 58.4 months. Workforce Outlook On the workforce front, there is much discussion of the "skills gap" the inability of employers to find and keep skilled workers. One anecdote o en voiced is that Wisconsin companies could expand business if only they could find and retain skilled workers. Wisconsin has never had more people employed and the unemployment rate is registering low levels not seen since the early 2000s. However, as has been discussed repeatedly over the years (Winters, Strang, & Klus, 2000; Winters, Gehrke, Grosso, & Udalova, 2009; Wisconsin Taxpayer Alliance, 2015), Wisconsin faces a quan ty challenge and, as a consequence, a skills challenge. Source: Local Area Unemployment Sta s cs, Bureau of Labor Sta s cs 1
4 Businesses will be compe ng not only with each other for workers with similar skills, but also with en es of other disciplines. For example, one company may try to recruit a math teacher to become a computer programmer. Then the school will have to find another math teacher from, say, an insurance company, which, in turn, may try to recruit someone out of health care. The point is that without enough workers to go around, some businesses will end up short of talent. This is true not only of highly skilled workers, but for all posi ons. Even retail and restaurant opera ons are displaying help wanted signs. During the late 1990s when the U.S. economic expansion was se ng new longevity marks, there was a similar quan ty challenge. The na onal unemployment rate fell to 3.8 percent in July 2000 and Wisconsin's unemployment rate fell to 3.0 percent in July of Two recessions alleviated the labor quan ty constraints from 2001 to Now the U.S. unemployment rate is down to 5.0 percent (Wisconsin December 2015 seasonally adjusted unemployment rate was 4.3 percent), GDP is only growing at 2.0 percent, and businesses are already experiencing quan ty challenges. The major change in the labor force during this period is that now the Baby Boomers are fi een years older and leaving the labor force in unprecedented numbers. The oldest Baby Boomers (born in 1946) will be 70 years old in The youngest (born in 1964) will be 52 years old, a mere three years from a rapid decline in their par cipa on in the labor force. Below is a graph of the labor force par cipa on rate (LFPR) by age cohort. The LFPR drops precipitously a er age 55. The bulk of the Baby Boomers are now over age 55. Source: Bureau of Labor Sta s cs Wisconsin's overall labor force par cipa on rate peaked in the late 1990s and the employment to popula on ra o (e/pop) peaked in 1997 at 72.9 percent. The 2014 e/pop rate was above the 2010 low of 63.4 percent, at 64.7 percent. The exit of Baby Boomers (people born between 1946 and 1964) from the labor market will affect future growth of Wisconsin s e/pop rate. Popula on growth and age distribu on will drive labor force availability in local and regional labor sheds. Below are county level demographic and economic characteriza ons. The primary factor driving economic trends in future years will be workforce developments and talent access. 2
5 Popula on and Demographics Outagamie County s 10 Most Populous Municipalities April 2010 Census January 2015 Proportional Numeric Change Estimate Change United States 308,400, ,289,069 11,888, % Wisconsin 5,686,986 5,753,324 66, % Outagamie County 176, ,310 4, % Appleton, City * 60,045 60, % Grand Chute, Town 20,919 21, % Kaukauna, City * 15,462 15, % Greenville, Town 10,309 11, % Little Chute, Village 10,449 10, % Buchanan, Town 6,755 6, % Kimberly, Village 6,468 6, % Freedom, Town 5,842 5, % Oneida, Town 4,678 4, % Combined Locks, Village 3,328 3, % *Outagamie County portion only. Source: Demographic Services Center, Wisconsin Department of Administra on Outagamie County s popula on con nues to be among the most dynamic in Northeast Wisconsin, if not the en re state. County popula on grew by 2.6 percent since the 2010 Census. In comparison the state s popula on has grown at a much slower rate over the same period, illustra ng a series of disparate dynamics that will be discussed throughout the course of this profile. The county added 4,615 residents between 2010 and 2015, a sum that is 30 percent of the county s popula on growth that occurred during the previous decade (15,604 growth from 2000 to 2010). Its 2.6 percent growth rate is also significantly slower than the 9.7 percent observed in the earlier period, sugges ng that the popula on growth that has occurred over the past forty years is slowing. This is a common theme among many of the region s largest coun es. Components of Popula on Change Many of the county s largest municipali es have also witnessed considerable growth over the past five years. Much of the region s popula on growth has been located in the western part of the Appleton market in the communi es of Grand Chute and Greenville. This growth will be further facilitated by ongoing improvements to I 41. Growth in more established communi es such as Kaukana, Kimberly, and Li le Chute has been more moderate in comparison. Popula on growth has further been fueled with a strong birth rate. Net migra on remains nega ve. A great deal of recent a en on has been commi ed 3.0% 1.9% 1.1% 0.6% 0.4% 0.8% United States Wisconsin Outagamie County Natural Increase Net Migration Source: Demographic Services Center, Wisconsin Department of Administra on 3
6 Labor Force Dynamics to changes in the Outagamie County labor Unemployment Rates Not Seasonally Adjusted force over the past several years. Many of 12% United States Wisconsin Outagamie County these conversa ons have focused on two 10% 8% related metrics the county s unemployment rate and the rela 6% 4% ve ability of the county s employers to find needed talent. The 2% 0% narra ve that has emerged in this dialogue has concluded Source: Local Area Unemployment Sta s cs, Bureau of Labor Sta s cs that, as the county s unemployment rate has decreased precipitously since the peak of the recession, employers have witnessed greater difficulty in finding needed workers. While there is a great deal of credence to this assump on, the cause of these issues is largely demographic. Jan 1990 Jan 1991 Jan 1992 Jan 1993 Jan 1994 Jan 1995 Jan 1996 Jan 1997 Jan 1998 Jan 1999 Jan 2000 Jan 2001 Jan 2002 Jan 2003 Jan 2004 Jan 2005 Jan 2006 Jan 2007 Jan 2008 Jan 2009 Jan 2010 Jan 2011 Jan 2012 Jan 2013 Jan 2014 Jan 2015 The chart above tracks Outagamie County s unemployment rate against that of both the na on and state from January 1990 to September It is important to first note that significant seasonality exists in this data, reflec ng calendar year changes in demand in industries ranging from construc on to hospitality. The county s unemployment rate is presently at Labor Force Participation Rates its lowest point in more than a decade. This is also true of the state, as a whole, which highlights common issues. The county s labor force has remained virtually unchanged over this period sugges ng that individuals are finding employment more rapidly than new entrants are added. 82% 80% 78% 76% 74% 72% 70% 68% 66% 64% 62% 60% 58% 56% 54% 52% 50% 48% Outagamie County Wisconsin United States Source: Current Popula on Survey, U.S. Department of Commerce, Census Bureau Outagamie County s labor force par cipa on rate has largely stabilized over the past two years and remains significantly higher than either the state or the na onal rate. This closely mirrors changes in local unemployment and is also 4
7 Industry Employment and Wages 2014 Employment and Wage Distribution by Industry in Outagamie County Employment % of Total Employment Annual 1 year Total % of Total Payroll Average change Payroll Natural Resources $ 20,118,680 Construction 6, $ 355,833,837 Manufacturing 19, $ 1,068,895,118 Trade, Transportation, Utilities 20, $ 719,691,103 Information Suppressed Not avail. Suppressed Financial Activities 6, $ 358,614,068 Professional & Business Services 12, $ 544,108,018 Education & Health 19, $ 888,136,806 Leisure & Hospitality 10, $ 135,018,531 Other services 3,911 9 $ 94,224,549 Public Administration 3, $ 140,001,623 Not assigned Suppressed Not avail. Suppressed 0% All industries 103,457 1,271 $4,410,181,246 10% 20% 30% Source: WI DWD, DET, BWITS, Quarterly Census Employment and Wages, June 2015 bolstered by a series of industry employment condi ons that we will discuss in the coming pages. The charts included on this page represent 2014 annual averages from the Quarterly Census of Employment and Wages. This program presents employment and wage data for more than 186,000 employers in Wisconsin and represent our most comprehensive look at industry dynamics. All industries employment in Outagamie County increased by 1,271 employees, or 1.2 percent. This growth rate was roughly equal to the state s employment growth rate over the same period, sugges ng that a number of key industry sectors have experienced li le or no growth. This is par cularly notable in many of the county s largest industry sectors. The Educa on and Health Services super sector experienced an increase in employment while the Manufacturing sector also grew. The most notable numerical employment Average Annual Wage by Industry Division in 2014 growth occurred in Wisconsin Outagamie the Educa on and Health Services sector and in the Profes Average County Annual Average Percent of 1 year % Wage Annual Wage Wisconsin change sional and Business Services All industries $ 43,856 $ 42, % 2.9% sector. The construc on industry has experienced signifi Natural Resources $ 36,156 $ 33, % 1.4% Construction $ 55,317 $ 56, % 3.0% Manufacturing $ 54,365 $ 54, % 1.7% cant growth throughout the Trade, Transportation & Utilities $ 37,362 $ 35, % 4.0% state as both the residen al Information $ 62,482 suppressed Not avail. Not avail. and commercial sectors have Financial Activities $ 61,884 $ 57, % 2.8% Professional & Business Services $ 52,386 $ 44, % 3.0% recovered to near prerecessionary Education & Health $ 44,829 $ 46, % 2.8% Leisure & Hospitality $ 16,055 $ 13, % 3.1% levels. Other Services $ 25,847 $ 24, % 4.4% Employers in many of Outagamie Public Administration $ 44,462 $ 44, % 1.3% County s industry sec Source: WI DWD, Labor Market Information, QCEW, June
8 Employment Projec ons Bay Area Workforce Development Area Industry Projections, Brown, Door, Florence, Kewaunee, Manitowoc, Marinette, Menominee, Oconto, Outagamie, Shawano and Sheboygan Counties Projected Change ( ) Industry Employment Employment Employment Percent All Industries 323, ,446 24,782 8% Natural Resources 8,255 8, % Construction 10,700 12,705 2,005 19% Manufacturing 67,700 68,837 1,137 2% Trade, Transportation, and Utilities 55,602 58,517 2,915 5% Information 2,879 3, % Financial Activities 16,123 17,420 1,297 8% Professional and Business Services 27,659 32,241 4,582 17% Education and Health Services 61,237 69,444 8,207 13% Leisure and Hospitality 30,300 32,236 1,936 6% Other Services 8,197 8, % Public Administration 17,188 18, % Self Employed and Unpaid Family Workers 17,824 18, % Source: Office of Economic Advisors, Wisconsin Department of Workforce Development, September tors con nue to pay wages that approach but are below state averages. The county annual average wage of $42,628 is 2.8 percent below the state average and has increased by 2.9 percent over the past year, exceeding the rate of infla on over the same period. It is difficult to ascertain whether wages have increased over this period among individuals in similar roles or if wages have increased by a more significant degree due to individuals changing roles either within or between organiza ons. The largest difference between Outagamie County and Wisconsin annual average industry wages can be found in the Construc on sector, where local wages are nearly three percent higher than the state average. This difference can be generally accounted for by varia ons within the industry with a higher share of workers in Outagamie County working for a concentra on of large regional and na onal commercial contractors. It is also important to note that wages in this sector are strongly influenced by ac vity across the country. Our focus now shi s to the considera on of poten al future employment trends. The data presented on the next two pages has been produced as part of the Department s two year long range employment projec ons cycle. The current ten year forecast examines employment over the period between 2012 and 2022 and has been published at both the state and Workforce Development Area level. The industry and occupa onal employment projec ons are presented for the eleven county Bay Area Workforce Development Area. This region includes more than just the area directly impacted by the Outagamie County regional economy. Industry employment in Outagamie County does comprise 31.9 percent of employment in the region. However, employment and economic dynamics are similar enough within all parts of the region to comment on general trends. Employment across all industries is expected to grow by eight percent over the ten year period, or slightly less than 25,000 workers. This projec on only forecasts levels of filled posi ons rather than poten al demand. This further supports the earlier asser on that the availability of labor throughout the region may be ac vely constraining employment growth. As the region s popula on con nues to age and growth slows this will con nue. The most significant numerical growth is expected in the Educa on and Health Services (8,207) and Professional 6
9 Employment Projec ons Bay Area Workforce Development Area Occupation Projections, Brown, Door, Florence, Kewaunee, Manitowoc, Marinette, Menominee, Oconto, Outagamie, Shawano and Sheboygan Counties Employment Average Annual Openings Change ( ) Due to Median Due to Replace Total Annual Occupation Group Number Percent Growth ment Openings Wage All Occupations 323, ,446 24,782 8% 2,689 7,614 10,303 $ 33,670 Management 15,139 16,313 1,174 8% $ 82,570 Business and Financial 13,645 14,838 1,193 9% $ 53,758 Computer and Mathematical 5,759 6, % $ 63,339 Architecture and Engineering 5,364 5, % $ 64,071 Life, Physical, and Social Science 3,705 3, % $ 50,119 Community and Social Service 3,406 3, % $ 37,766 Legal 1,036 1, % $ 56,297 Education, Training, and Library 17,164 18,467 1,303 8% $ 44,662 Arts, Entertainment and Media 4,701 5, % $ 36,214 Healthcare Practitioners 16,057 19,184 3,127 19% $ 57,592 Healthcare Support 7,988 9,083 1,095 14% $ 28,272 Protective Service 5,844 6, % $ 31,062 Food Preparation and Serving 26,386 27,977 1,591 6% ,155 $ 18,564 Building & Grounds Maintenance 10,267 11,545 1,278 12% $ 22,720 Personal Care and Service 14,154 16,050 1,896 13% $ 21,364 Sales and Related 31,092 32,432 1,340 4% ,089 $ 24,086 Office and Administrative Support 44,891 47,632 2,741 6% 321 1,028 1,349 $ 31,575 Farming, Fishing, and Forestry 3,333 3, % $ 32,025 Construction and Extraction 12,254 14,016 1,762 14% $ 45,684 Installation, Maintenance, Repair 12,081 12, % $ 42,013 Production 43,393 44,645 1,252 3% ,085 $ 35,008 Transportation & Material Moving 26,005 27,492 1,487 6% $ 30,799 Source: Office of Economic Advisors, Wisconsin Department of Workforce Development, September 2015 and Business Services (4,582) industry sectors. This is equal to 13 and 17 percent period growth, rates that are only eclipsed by an cipated growth in the Construc on sector (19 percent). Growth in a number of other industry sectors is significant with a pair of notable outliers. Public sector employment is expected to be constrained over the next decade as the workforce in this sector con nues to age more rapidly than the popula on as a whole. Manufacturing employment is also expected to grow more modestly at 2 percent. This equals an cipated statewide sector growth. An examina on of projected occupa onal employment growth reveals a possible explana on for the moderate growth rates an cipated in a number of the region s largest industry sectors. We first see that the most significant occupa onal growth can be observed in a number of occupa onal categories largely concentrated in the Health Services sector, including Healthcare Prac oners, Healthcare Support, and Personal Care and Services workers. Significant growth is also an cipated in many other occupa onal sectors, suppor ng the narra ve of long range stability in many of the region s largest industries. The other trend that is also illustrated is that of labor constraints as openings created due to replacement needs outnumber those generated by new growth by a factor of three to one in most occupa on sectors. This suggests that there will be increased importance 7
10 2004 Nominal Per Capita Personal Income 2004 Per Capita Personal Income in 2014 dollars Personal Income 2014 Per Capita Personal Income Source: Bureau of Economic Analysis Nominal Change in Per Capita Personal Income ( ) Inflation adjusted Change in Per Capita Personal Income ( ) United States $34,316 $41,709 $46, % 10.4% Wisconsin $33,350 $40,534 $44, % 9.0% Outagamie County $33,756 $41,028 $43, % 6.4% placed on the availability and skill sets of young workers entering the region s workforce. The final topic to be considered in this profile is that of personal income. It is again important to note that personal income differs from wage income in that wage income is one component of personal income, but personal income also includes secondary income sources such as rental and dividend income and transfer payments. Outagamie County s per capita personal income in 2014 was $43,665, or $500 lower than the state average, making it the fourteenth highest income county in the state. This measure also is below the na onal average of 2014 Per Capita Personal Income Change in Per Capita Personal Income, Inflation adjusted Outagamie County $43,665 Outagamie County 6.4% Wisconsin $44,186 Wisconsin 9.0% United States $46,049 United States 10.4% $0 $20,000 $40,000 $60,000 10% 0% 10% 20% Source: Bureau of Economic Analysis $46,049. Current measures stand in comparison to those observed a decade earlier as both nominal and infla on adjusted per capita personal income in Outagamie County previously exceeded state averages. Over the course of the decade state and na onal income growth has significantly outpaced local growth. This is largely due to slowing wage growth within the county. This is further a ributed to differences in both industry and occupa on composi on of the region compared to na onal averages. Outagamie County s manufacturing sector has a larger share of produc on employment and fewer office or technical posi ons than the manufacturing sector na onally, for example. As the character of many of the region s most prominent industry sectors con nues to change we should expect this difference to once again narrow. This again suggests that the region should con nue to enjoy a high level of economic prosperity. For More Informa on: Jeffrey Sachse Regional Economist Bay Area and Fox Valley WDA Phone: (920) jeff.sachse@dwd.wisconsin.gov h p://dwd.wisconsin.gov/oea 8
Columbia County DETI COL-P (N. 3/2016)
") Columbia County DETI-17957-COL-P (N. 3/2016) Average Household Income By County Na onal and State Economic Outlook Robust economic growth a er the Great Recession remains an cipated. The recession ended
Columbia County DETI-17957-COL-P (N. 3/2016) Average Household Income By County Na onal and State Economic Outlook Robust economic growth a er the Great Recession remains an cipated. The recession ended
Price County DETI PRI-P P (N. 3/2016)
") Price County DETI-17957-PRI-P P (N. 3/2016) Average Household Income By County Na onal and State Economic Outlook Robust economic growth a er the Great Recession remains an cipated. The recession ended
Price County DETI-17957-PRI-P P (N. 3/2016) Average Household Income By County Na onal and State Economic Outlook Robust economic growth a er the Great Recession remains an cipated. The recession ended
Burnett County DETI BNT-P (N. 3/2016)
") Burnett County DETI-17957-BNT-P (N. 3/2016) Average Household Income By County Na onal and State Economic Outlook Robust economic growth a er the Great Recession remains an cipated. The recession ended
Burnett County DETI-17957-BNT-P (N. 3/2016) Average Household Income By County Na onal and State Economic Outlook Robust economic growth a er the Great Recession remains an cipated. The recession ended
Dane County DETI DAN-P DAN (N. 3/2016)
") Dane County DETI-17957-DAN-P DAN (N. 3/2016) Average Household Income By County Na onal and State Economic Outlook Robust economic growth a er the Great Recession remains an cipated. The recession ended
Dane County DETI-17957-DAN-P DAN (N. 3/2016) Average Household Income By County Na onal and State Economic Outlook Robust economic growth a er the Great Recession remains an cipated. The recession ended
Racine County DETI RAC-P (N. 3/2016)
") Racine County DETI-17957-RAC-P (N. 3/2016) Average Household Income By County Na onal and State Economic Outlook Robust economic growth a er the Great Recession remains an cipated. The recession ended
Racine County DETI-17957-RAC-P (N. 3/2016) Average Household Income By County Na onal and State Economic Outlook Robust economic growth a er the Great Recession remains an cipated. The recession ended
Rock County DETI RCK-P (N. 3/2016)
") Rock County DETI-17957-RCK-P (N. 3/2016) 2015 Rock County Economic and Workforce Profile Na onal and State Economic Outlook Robust economic growth a er the Great Recession remains an cipated. The recession
Rock County DETI-17957-RCK-P (N. 3/2016) 2015 Rock County Economic and Workforce Profile Na onal and State Economic Outlook Robust economic growth a er the Great Recession remains an cipated. The recession
Kenosha County DETI KEN-P (N. 3/2016)
") Kenosha County DETI-17957-KEN-P (N. 3/2016) Average Household Income By County Na onal and State Economic Outlook Robust economic growth a er the Great Recession remains an cipated. The recession ended
Kenosha County DETI-17957-KEN-P (N. 3/2016) Average Household Income By County Na onal and State Economic Outlook Robust economic growth a er the Great Recession remains an cipated. The recession ended
Eau Claire County DETI ECL-P ECL (N. 3/2016)
") Eau Claire County DETI-17957-ECL-P ECL (N. 3/2016) Average Household Income By County Na onal and State Economic Outlook Robust economic growth a er the Great Recession remains an cipated. The recession
Eau Claire County DETI-17957-ECL-P ECL (N. 3/2016) Average Household Income By County Na onal and State Economic Outlook Robust economic growth a er the Great Recession remains an cipated. The recession
Jackson County DETI JAK-P (N. 3/2016)
") Jackson County DETI-17957-JAK-P (N. 3/2016) 2015 Jackson County Economic and Workforce Profile Na onal and State Economic Outlook Robust economic growth a er the Great Recession remains an cipated. The
Jackson County DETI-17957-JAK-P (N. 3/2016) 2015 Jackson County Economic and Workforce Profile Na onal and State Economic Outlook Robust economic growth a er the Great Recession remains an cipated. The
2017 ECONOMIC AND WORKFORCE PROFILE Florence County
 2017 ECONOMIC AND WORKFORCE PROFILE Florence County STATE OF WISCONSIN DETI-17957-FLO-P (R. 3/2018) Percentage of Total Popula on, Ages 65 and Older Wisconsin now has more people employed and more private
2017 ECONOMIC AND WORKFORCE PROFILE Winnebago County
 2017 ECONOMIC AND WORKFORCE PROFILE Winnebago County STATE OF WISCONSIN DETI-17957-WIN-P (R. 3/2018) Percentage of Total Popula on, Ages 65 and Older Wisconsin now has more people employed and more private
2017 ECONOMIC AND WORKFORCE PROFILE Green Lake County
 2017 ECONOMIC AND WORKFORCE PROFILE Green Lake County STATE OF WISCONSIN DETI-17957-GRL-P (R. 3/2018) Percentage of Total Popula on, Ages 65 and Older Wisconsin now has more people employed and more private
2017 ECONOMIC AND WORKFORCE PROFILE Clark County
 2017 ECONOMIC AND WORKFORCE PROFILE Clark County STATE OF WISCONSIN DETI-17957-CLK-P (R. 3/2018) Percentage of Total Popula on, Ages 65 and Older Wisconsin now has more people employed and more private
2017 ECONOMIC AND WORKFORCE PROFILE Kewaunee County
 2017 ECONOMIC AND WORKFORCE PROFILE Kewaunee County STATE OF WISCONSIN DETI-17957-KEW-P (R. 3/2018) Percentage of Total Popula on, Ages 65 and Older Wisconsin now has more people employed and more private
2017 ECONOMIC AND WORKFORCE PROFILE Walworth County
 2017 ECONOMIC AND WORKFORCE PROFILE Walworth County STATE OF WISCONSIN DETI-17957-WLW-P (R. 3/2018) Percentage of Total Popula on, Ages 65 and Older Wisconsin now has more people employed and more private
2017 ECONOMIC AND WORKFORCE PROFILE Brown County
 2017 ECONOMIC AND WORKFORCE PROFILE Brown County STATE OF WISCONSIN DETI-17957-BRW-P (R. 3/2018) Percentage of Total Popula on, Ages 65 and Older Wisconsin now has more people employed and more private
2017 ECONOMIC AND WORKFORCE PROFILE Washington County
 2017 ECONOMIC AND WORKFORCE PROFILE Washington County STATE OF WISCONSIN DETI-17957-WGT-P (R. 3/2018) Percentage of Total Popula on, Ages 65 and Older Wisconsin now has more people employed and more private
2017 ECONOMIC AND WORKFORCE PROFILE Waukesha County
 2017 ECONOMIC AND WORKFORCE PROFILE Waukesha County STATE OF WISCONSIN DETI-17957-WAK-P (R. 3/2018) Percentage of Total Popula on, Ages 65 and Older Wisconsin now has more people employed and more private
2017 ECONOMIC AND WORKFORCE PROFILE Pierce County
 2017 ECONOMIC AND WORKFORCE PROFILE Pierce County STATE OF WISCONSIN DETI-17957-PRC-P (R. 3/2018) Percentage of Total Popula on, Ages 65 and Older Wisconsin now has more people employed and more private
2017 ECONOMIC AND WORKFORCE PROFILE Grant County
 2017 ECONOMIC AND WORKFORCE PROFILE Grant County STATE OF WISCONSIN DETI-17957-GRT-P (R. 3/2018) Percentage of Total Popula on, Ages 65 and Older Wisconsin now has more people employed and more private
2017 ECONOMIC AND WORKFORCE PROFILE Douglas County
 2017 ECONOMIC AND WORKFORCE PROFILE Douglas County STATE OF WISCONSIN DETI-17957-DOU-P (R. 3/2018) Percentage of Total Popula on, Ages 65 and Older Wisconsin now has more people employed and more private
2017 ECONOMIC AND WORKFORCE PROFILE Buffalo County
 2017 ECONOMIC AND WORKFORCE PROFILE Buffalo County STATE OF WISCONSIN DETI-17957-BUF-P (R. 3/2018) Percentage of Total Popula on, Ages 65 and Older Wisconsin now has more people employed and more private
2017 ECONOMIC AND WORKFORCE PROFILE Wood County
 2017 ECONOMIC AND WORKFORCE PROFILE Wood County STATE OF WISCONSIN DETI-17957-WOD-P (R. 3/2018) Percentage of Total Popula on, Ages 65 and Older Wisconsin now has more people employed and more private
2017 ECONOMIC AND WORKFORCE PROFILE St. Croix County
 2017 ECONOMIC AND WORKFORCE PROFILE St. Croix County STATE OF WISCONSIN DETI-17957-STC-P (R. 3/2018) Percentage of Total Popula on, Ages 65 and Older Wisconsin now has more people employed and more private
2017 ECONOMIC AND WORKFORCE PROFILE Monroe County
 2017 ECONOMIC AND WORKFORCE PROFILE Monroe County STATE OF WISCONSIN DETI-17957-MON-P (R. 3/2018) Percentage of Total Popula on, Ages 65 and Older Wisconsin now has more people employed and more private
2017 ECONOMIC AND WORKFORCE PROFILE Chippewa County
 2017 ECONOMIC AND WORKFORCE PROFILE Chippewa County STATE OF WISCONSIN DETI-17957-CHP-P (R. 3/2018) Percentage of Total Popula on, Ages 65 and Older Wisconsin now has more people employed and more private
2017 ECONOMIC AND WORKFORCE PROFILE Barron County
 2017 ECONOMIC AND WORKFORCE PROFILE Barron County STATE OF WISCONSIN DETI-17957-BRN-P (R. 3/2018) Percentage of Total Popula on, Ages 65 and Older Wisconsin now has more people employed and more private
2017 ECONOMIC AND WORKFORCE PROFILE Vernon County
 2017 ECONOMIC AND WORKFORCE PROFILE Vernon County STATE OF WISCONSIN DETI-17957-VRN-P (R. 3/2018) Percentage of Total Popula on, Ages 65 and Older Wisconsin now has more people employed and more private
2017 ECONOMIC AND WORKFORCE PROFILE Dodge County
 2017 ECONOMIC AND WORKFORCE PROFILE Dodge County STATE OF WISCONSIN DETI-17957-DOD-P (R. 3/2018) Percentage of Total Popula on, Ages 65 and Older Wisconsin now has more people employed and more private
2017 ECONOMIC AND WORKFORCE PROFILE Sauk County
 2017 ECONOMIC AND WORKFORCE PROFILE Sauk County STATE OF WISCONSIN DETI-17957-SAK-P (R. 3/2018) Percentage of Total Popula on, Ages 65 and Older Wisconsin now has more people employed and more private
2017 ECONOMIC AND WORKFORCE PROFILE Dane County
 2017 ECONOMIC AND WORKFORCE PROFILE Dane County STATE OF WISCONSIN DETI-17957-DAN-P (R. 3/2018) Percentage of Total Popula on, Ages 65 and Older Wisconsin now has more people employed and more private
Guernsey Economic Overview
 Guernsey Economic Overview Issue date: 19 May 17 The Guernsey Economic Overview brings together the most recent official Guernsey sta s cs and provides an overview of economic condi ons in Guernsey and
Economy Overview. Eagle County, CO. Emsi Q Data Set
 Eagle County, CO Emsi Q4 2018 Data Set www.economicmodeling.com Contents. Economy........ Overview......................................................................................... 1... Historic.......&..
Economy Overview. Pitkin County, CO. Emsi Q Data Set
 Pitkin County, CO Emsi Q4 2018 Data Set www.economicmodeling.com Contents. Economy........ Overview......................................................................................... 1... Historic.......&..
Economy Overview. Summit County, CO. Emsi Q Data Set
 Summit County, CO Emsi Q4 2018 Data Set www.economicmodeling.com Contents. Economy........ Overview......................................................................................... 1... Historic.......&..
Economy Overview. Grand County, CO. Emsi Q Data Set
 Grand County, CO Emsi Q4 2018 Data Set www.economicmodeling.com Contents. Economy........ Overview......................................................................................... 1... Historic.......&..
La Crosse County, WI
 La Crosse County, WI Mississippi River Regional Planning Commission 1707 Main Street, Suite 435 La Crosse, Wisconsin 54601 Emsi Q4 2018 Data Set www.economicmodeling.com Contents. Economy........ Overview.........................................................................................
Quarterly Labour Market Report. November 2017
 Quarterly Labour Market Report November 2017 MBIE 3518 November 2017 Ministry of Business, Innovation and Employment (MBIE) Hikina Whakatutuki - Lifting to make successful MBIE develops and delivers policy,
O awa County, MI. Economy Overview. Michigan Economic Development Corpora on. 300 N. Washington Square, Lower Level Lansing, Michigan 48913
 O awa County, MI Michigan Economic Development Corpora on 300 N. Washington Square, Lower Level Lansing, Michigan 48913 Emsi Q4 2018 Data Set www.economicmodeling.com Contents. Economy........ Overview.........................................................................................
Pennington County, SD
 Pennington County, SD 730 E. Watertown Street, Suite 102 Rapid City, South Dakota 57701 Emsi Q2 2018 Data Set www.economicmodeling.com Contents. Economy........ Overview.........................................................................................
Quarterly Labour Market Report. August 2018
 Quarterly Labour Market Report August 2018 Ministry of Business, Innovation and Employment (MBIE) Hikina Whakatutuki - Lifting to make successful MBIE develops and delivers policy, services, advice and
14 Coun es. Economy Overview. West Virginia Department of Commerce Capitol Complex, Bldg. 6, Room 525 Charleston, West Virginia 25305
 14 Coun es West Virginia Department of Commerce Capitol Complex, Bldg. 6, Room 525 Charleston, West Virginia 25305 Emsi Q4 2018 Data Set www.economicmodeling.com Contents. Economy........ Overview.........................................................................................
Polk County Labor Market Review
 Polk County Labor Market Review Polk County has a labor force of approximately 281,000 with 265,000 of them employed as of June 2016. The labor force reversed the 2014 2015 trend by growing 0.22% between
Miller County, MO. Economy Overview. Michele Kroll, Community Development Specialist,
 Miller County, MO Michele Kroll, Community Development Specialist, krollm@missouri.edu Emsi Q1 2018 Data Set www.economicmodeling.com Contents. Economy........ Overview.........................................................................................
County Economic Profile Leflore County, MS extension.msstate.edu/economic profiles
 County Economic Profile Leflore County, MS extension.msstate.edu/economic profiles Demographics* Leflore Mississippi United States Total Popula on, 2017 (Popula on Es mates) 29,223 2,984,100 325,719,178
Camden County, MO. Economy Overview. Michele Kroll, Community Development Specialist,
 Camden County, MO Michele Kroll, Community Development Specialist, krollm@missouri.edu Emsi Q1 2018 Data Set www.economicmodeling.com Contents. Economy........ Overview.........................................................................................
3 New Hampshire ZIPs
 3 New Hampshire ZIPs New Hampshire Economic Development 172 Pembroke Rd Concord, New Hampshire 03301 Emsi Q4 2018 Data Set www.economicmodeling.com Contents. Economy........ Overview.........................................................................................
Allegan County, MI. Economy Overview. Michigan Economic Development Corpora on. 300 N. Washington Square, Lower Level Lansing, Michigan 48913
 Allegan County, MI Michigan Economic Development Corpora on 300 N. Washington Square, Lower Level Lansing, Michigan 48913 Emsi Q4 2018 Data Set www.economicmodeling.com Contents. Economy........ Overview.........................................................................................
Quarterly Labour Market Report. August 2017
 Quarterly Labour Market Report August 2017 MB14363 August 2017 Ministry of Business, Innovation and Employment (MBIE) Hikina Whakatutuki - Lifting to make successful MBIE develops and delivers policy,
Bucks County, PA. Economy Overview. Bucks County Workforce Development Board, Inc Veterans Highway Bristol, Pennsylvania 19007
 Bucks County, PA Bucks County Workforce Development Board, Inc. 1268 Veterans Highway Bristol, Pennsylvania 19007 Emsi Q4 2018 Data Set www.economicmodeling.com Contents. Economy........ Overview.........................................................................................
County Economic Profile Jasper County, MS extension.msstate.edu/economic profiles
 County Economic Profile Jasper County, MS extension.msstate.edu/economic profiles Demographics* Jasper Mississippi United States Total Popula on, 2017 (Popula on Es mates) 16,582 2,984,100 325,719,178
County Economic Profile Marion County, MS extension.msstate.edu/economic profiles
 County Economic Profile Marion County, MS extension.msstate.edu/economic profiles Demographics* Marion Mississippi United States Total Popula on, 2017 (Popula on Es mates) 25,069 2,984,100 325,719,178
Economy Overview. Hunt County, TX. Emsi Q Data Set
 Hunt County, TX Emsi Q4 2018 Data Set www.economicmodeling.com Contents. Economy........ Overview......................................................................................... 1... Historic.......&..
County Economic Profile Monroe County, MS extension.msstate.edu/economic profiles
 County Economic Profile Monroe County, MS extension.msstate.edu/economic profiles Demographics* Monroe Mississippi United States Total Popula on, 2017 (Popula on Es mates) 35,872 2,984,100 325,719,178
Burnett County Workforce Profile
 Percentage of working-age population aged 60 years and older in 2020 23.2% - 30.0% 30.1% - 40.0% 40.1% - 49.3% State average 29.4% Office of Economic Advisors OEA-10599-P Beverly Gehrke 15618 Windrose
Superior Trade Zone. Economy Overview. Lake Superior Community Partnership. 501 S. Front Street Marque e, Michigan 49855
 Superior Trade Zone Lake Superior Community Partnership 501 S. Front Street Marque e, Michigan 49855 Emsi Q3 2018 Data Set www.economicmodeling.com Contents. Economy........ Overview.........................................................................................
County Economic Profile Tunica County, MS extension.msstate.edu/economic profiles
 County Economic Profile Tunica County, MS extension.msstate.edu/economic profiles Demographics* Tunica Mississippi United States Total Popula on, 2017 (Popula on Es mates) 10,024 2,984,100 325,719,178
County Economic Profile Coahoma County, MS extension.msstate.edu/economic profiles
 County Economic Profile Coahoma County, MS extension.msstate.edu/economic profiles Demographics* Coahoma Mississippi United States Total Popula on, 2017 (Popula on Es mates) 23,154 2,984,100 325,719,178
County Economic Profile Bolivar County, MS extension.msstate.edu/economic profiles
 County Economic Profile Bolivar County, MS extension.msstate.edu/economic profiles Demographics* Bolivar Mississippi United States Total Popula on, 2017 (Popula on Es mates) 31,945 2,984,100 325,719,178
County Economic Profile Copiah County, MS extension.msstate.edu/economic profiles
 County Economic Profile Copiah County, MS extension.msstate.edu/economic profiles Demographics* Copiah Mississippi United States Total Popula on, 2017 (Popula on Es mates) 28,516 2,984,100 325,719,178
County Economic Profile Clarke County, MS extension.msstate.edu/economic profiles
 County Economic Profile Clarke County, MS extension.msstate.edu/economic profiles Demographics* Clarke Mississippi United States Total Popula on, 2017 (Popula on Es mates) 15,828 2,984,100 325,719,178
2 North San Joaquin Valley Index. Prepared by: Jeffrey A. Michael and Thomas E. Pogue
 Prepared by: Jeffrey A. Michael and Thomas E. Pogue This report has been prepared by the Center for Business and Policy Research at the University of the Pacific. This publica on was supported by JP Morgan
County Economic Profile Smith County, MS extension.msstate.edu/economic profiles
 County Economic Profile Smith County, MS extension.msstate.edu/economic profiles Demographics* Smith Mississippi United States Total Popula on, 2017 (Popula on Es mates) 16,078 2,984,100 325,719,178 Percent
County Economic Profile Lee County, MS extension.msstate.edu/economic profiles
 County Economic Profile Lee County, MS extension.msstate.edu/economic profiles Demographics* Lee Mississippi United States Total Popula on, 2017 (Popula on Es mates) 84,933 2,984,100 325,719,178 Percent
County Economic Profile Lamar County, MS extension.msstate.edu/economic profiles
 County Economic Profile Lamar County, MS extension.msstate.edu/economic profiles Demographics* Lamar Mississippi United States Total Popula on, 2017 (Popula on Es mates) 61,374 2,984,100 325,719,178 Percent
Palo Pinto County, TX
 Palo Pinto County, TX Emsi Q3 2018 Data Set www.economicmodeling.com Contents. Economy........ Overview......................................................................................... 1... Historic.......&..
Economy Overview. Esmeralda County, NV. Emsi Q Data Set
 Esmeralda County, NV Emsi Q3 2018 Data Set www.economicmodeling.com Economy Overview 795 403 $43.1K Popula on (2017) Jobs (2017) Median Household Income (2016) Popula on grew by 26 over the last 5 years
Rifle city Demographic and Economic Profile
 Rifle city Demographic and Economic Profile Community Quick Facts Population (2014) 9,289 Population Change 2010 to 2014 156 Place Median HH Income (ACS 10-14) $52,539 State Median HH Income (ACS 10-14)
Economy Overview. Ellis County, TX. Emsi Q Data Set
 Ellis County, TX Emsi Q3 2018 Data Set www.economicmodeling.com Contents. Economy........ Overview......................................................................................... 1... Historic.......&..
Economy Overview. Collin County, TX. Emsi Q Data Set
 Collin County, TX Emsi Q3 2018 Data Set www.economicmodeling.com Contents. Economy........ Overview......................................................................................... 1... Historic.......&..
Economy Overview. Denton County, TX. Emsi Q Data Set
 Denton County, TX Emsi Q1 2018 Data Set www.economicmodeling.com Contents. Economy........ Overview......................................................................................... 1... Historic.......&..
2012 ALBANY COUNTY EXECUTIVE BUDGET
 2012 ALBANY COUNTY EXECUTIVE BUDGET INTRODUCTION AND HIGHLIGHTS Economic Forecast MICHAEL G. BRESLIN County Execu ve INTRODUCTION This sec on of the budget provides a survey of economic indicators and
A summary of economic events, data, and trends published by the Community Research Institute. The Workforce Without the Baby Boomers
 Allen County Insight A summary of economic events, data, and trends published by the October 2014 On the web: www.ipfw.edu/cri In this Issue Focus on... Baby Boomers and Labor Force Also... Employment
Outlook for the Wisconsin Economy. Noah Williams
 Outlook for the Wisconsin Economy Noah University of Wisconsin-Madison Center for Research On the Wisconsin Economy (CROWE) https://crowe.wisc.edu The State of the Wisconsin Economy Tight labor market:
December 2012 County Unemployment
 Calumet Lafayette Pierce Ozaukee Winnebago Eau Claire Waukesha Trempealeau Outagamie Brown Washington 14.0% 12.0% 10.0% 8.0% 6.0% 4.0% 2.0% 0.0% December 2012 County Unemployment Florence Manitowoc Taylor
Economy Overview. Navarro County, TX. Emsi Q Data Set
 Economy Overview Navarro County, TX Emsi Q3 2017 Data Set www.economicmodeling.com Economy Overview Contents. Economy........ Overview.........................................................................................
Regional Prosperity Initiative: Labor Market Information Supplement
 Regional Prosperity Initiative: Labor Market Information Supplement Prepared For: (Region 6) (Genesee, Huron, Lapeer, Sanilac, Shiawassee, St. Clair, and Tuscola) Prepared By: State of Michigan Department
Community and Economic Development
 192 193 194 195 196 197 198 199 2 21 22 23 24 2-1 Lycoming County Comprehensive Plan Update 218 Community and Economic Development At a Glance Over the last ten years, has experienced a decline in population,
Aging and the Pennsylvania Economy. Task Force on Private Sector Retirement Security January 25, 2018
 Aging and the Pennsylvania Economy Task Force on Private Sector Retirement Security January 25, 2018 Aging Population Has Broad Implications Pennsylvania undergoing dramatic transformation. Began roughly
UPSTATE NEW YORK REGIONAL NO. 1, ISSUE NO Baby-Boom Retirements and Emerging Labor Market Pressures Richard Deitz
 UPSTATE NEW YORK REGIONAL REVIEW VOLUME NO. 1, ISSUE NO. 1 2006 Baby-Boom Retirements and Emerging Labor Market Pressures Richard Deitz As the baby-boom generation begins to retire, employers in upstate
Entrepreneurship in the Nebraska Economy. Eric Thompson (November 15, 2006)
") Entrepreneurship in the Nebraska Economy Eric Thompson (November 15, 2006) Entrepreneurs benefit from the freedom, self-reliance and opportunity to build wealth that accompanies business ownership. In
Entrepreneurship in the Nebraska Economy Eric Thompson (November 15, 2006) Entrepreneurs benefit from the freedom, self-reliance and opportunity to build wealth that accompanies business ownership. In
City of Guelph. Financial Condi on Assessment. September 24, 2015
 City of Guelph Financial Condi on Assessment September 24, 2015 62 Table of Contents Exeuctive Summary Introduction 1 Trend Analysis 2 Peer Analysis 2 Questions to Consider 3 Key Indicators 4 Section 1
which looks like a credit card, but is electronically connected to the cardholder s bank account.
 U C C T C Y F A L 1.4.1.F1 Credit is derived from the La n word credo meaning I believe. Credit is when goods, services, or money is received in exchange for a promise to pay a definite sum of money at
Economy Overview. Monroe County, WI. Emsi Q Data Set
 Monroe County, WI Emsi Q4 2017 Data Set www.economicmodeling.com Contents. Economy........ Overview......................................................................................... 1... Historic.......&..
Ravenna s most significant growth occurred before Between 1960 and 1980 the city s population declined by 8.5%.
 DRAFT Ravenna Comprehensive Plan Draft May 2008 1 A Profile of Ravenna This section examines demographic trends that will affect Ravenna. The analysis examines population and demographic dynamics, including
American Community Survey 5-Year Estimates
 S2401 OCCUPATION BY SEX AND MEDIAN EARNINGS IN THE PAST 12 MONTHS (IN 2012 INFLATION- ADJUSTED DOLLARS) FOR THE CIVILIAN EMPLOYED POPULATION 16 YEARS AND OVER 2008-2012 American Community Survey 5-Year
BROWARD COUNTY LABOR FORCE
 BROWARD COUNTY LABOR FORCE Broward County s has a workforce of 978,000 people, including 54,000 self-employed. Twenty-three percent of residents commute to a job outside Broward County and five percent
Table of Contents. Long Range Financial Plan 27. Report Introduction 1
 Table of Contents Report Introduction 1 Water/Wastewater Long Range Financial Planning 2 Principles of Financial Sustainability 4 Importance of a Long Range Financial Plan 5 General Approach to Preparing
2016 Marquette County
 2016 Marquette County Economic Data Booklet LAKE SUPERIOR COMMUNITY PARTNERSHIP Business Development Department July 2017 The Lake Superior Community Partnership is the Marquette County region s leading
Sussex Demographic and Labor Market Trends
 Sussex Demographic and Labor Market Trends Ed Simon (302) 672-6845 edward.simon@state.de.us October 2012 Introduction Statistical Update Economic and labor market update for 2012 Is Sussex doing better?
State Profile: Delaware
 State Perspectives Delaware Indicators: Aging & Work State Profile Series March, 2008 By: Michelle Wong with Tay McNamara, Sandee Shulkin, Chelsea Lettieri and Vanessa Careiro Sponsored by: Quick Fact
Rock County Workforce Profile 2011
 Rock County Workforce Profile 2011 Proportional Population Change by Minor Civil Division 2000 2010 Source: US Census Bureau, 2000 Census and WI Dept. of Administration Demographic Services, January 2010
2015 Marquette County
 2015 Marquette County Economic Data Booklet LAKE SUPERIOR COMMUNITY PARTNERSHIP Business Development Department July 2016 The Lake Superior Community Partnership is the Marquette County region s leading
Economy Overview. Navarro County, TX. Emsi Q Data Set
 Economy Overview Navarro County, TX Emsi Q4 2017 Data Set www.economicmodeling.com Economy Overview Contents. Economy........ Overview.........................................................................................
Wisconsin Metropolitan Area Economic Outlook. Wisconsin Department of Revenue Division of Research & Policy September 2008
 Metropolitan Area Economic Outlook Department of Revenue Division of Research & Policy September 2008 TABLE OF CONTENTS I. ECONOMIC OUTLOOK Page Overview... 1 Note on Housing Data... 6 II. MSA DETAIL Appleton...
Sussex Demographic and Labor Market Trends
 Sussex Demographic and Labor Market Trends Ed Simon (302) 672-6845 edward.simon@state.de.us October 2013 Introduction Statistical Update Differences among the regions in Sussex Demographic, economic and
The Province of Prince Edward Island Employment Trends and Data Poverty Reduction Action Plan Backgrounder
 The Province of Prince Edward Island Employment Trends and Data Poverty Reduction Action Plan Backgrounder 5/17/2018 www.princeedwardisland.ca/poverty-reduction $000's Poverty Reduction Action Plan Backgrounder:
Regional Economics 6-1. Northwest Regional Comprehensive Plan Regional Economics
 Regional Economics Northwest Regional Economy Economic information specifically for the Northwest Region of Wisconsin is provided in this chapter. The following data and related analysis addresses population,
Florida: An Economic Overview
 Florida: An Economic Overview December 26, 2018 Presented by: The Florida Legislature Office of Economic and Demographic Research 850.487.1402 http://edr.state.fl.us Shifting in Key Economic Variables
State Profile: South Carolina
 State Perspectives State Profile Series South Carolina Indicators: Aging & Work April, 2008 By: Michelle Wong with Tay McNamara, Sandee Shulkin, Chelsea Lettieri and Vanessa Careiro Sponsored by: Quick