2017 ECONOMIC AND WORKFORCE PROFILE Waukesha County
|
|
|
- Douglas Skinner
- 6 years ago
- Views:
Transcription


1 2017 ECONOMIC AND WORKFORCE PROFILE Waukesha County STATE OF WISCONSIN DETI WAK-P (R. 3/2018)


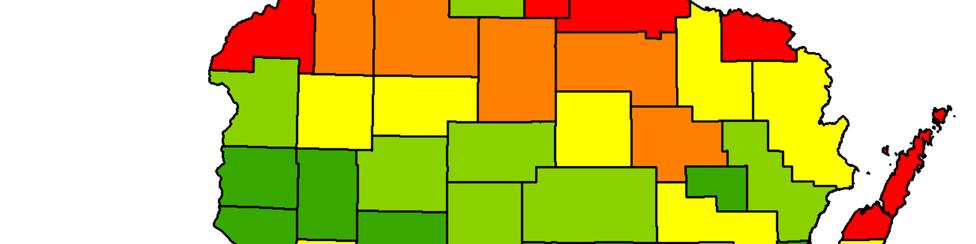
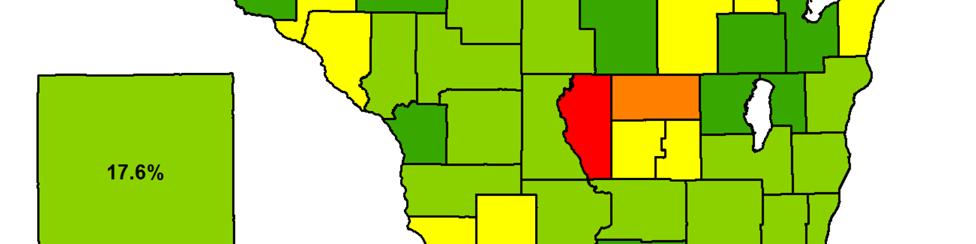
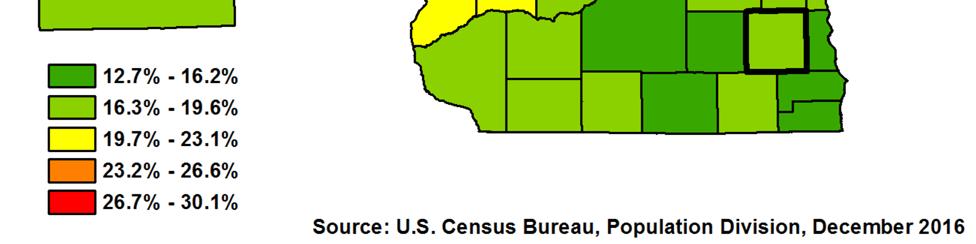
2 Percentage of Total Popula on, Ages 65 and Older
3 Wisconsin now has more people employed and more private sector jobs than at any me in its history. As of this wri ng, the state added 56,100 jobs during 2016 and Employment increased in almost all industry sectors, with prominent gains in construc on, manufacturing, and healthcare. Wisconsin s unemployment rate is near lows not seen in a genera on, decreasing from 4.3 percent in January 2016 to 3.2 percent in December 2017, on a seasonally adjusted basis. Wisconsin faces a worker quan ty challenge. The number of re ring Baby Boomers nearly match the influx of new workers, resul ng in a slow growing workforce and placing constraints on the ability by employers across all industries to hire talent. Many businesses report that the lack of available workers has hindered expansion and, in some cases, even curtailed their ability to meet current product orders. The blue line, orange line graph to the right illustrates the situa on in Wisconsin and other upper Midwest states. While Wisconsin's popula on will con nue to grow over the next twenty years, the workforce faces serious constraints. The labor force par cipa on rate (LFPR), defined as the labor force (sum of employed and unemployed) divided by the total popula on ages 16 and older, measures the popula on's engagement in the workforce and serves as an indicator in determining how Wisconsin's workforce will be constrained. The overall LFPR peaked in the late 1990s and has been trending lower ever since. The LFPR of peaks across Source: Local Area Unemployment Sta s cs, Bureau of Labor Sta s cs the age cohort at over ninety percent and decreases rapidly into the single digits by age seventy. Baby Boomers have and con nue to exit with respect to their LFPR. The mass of Baby Boomers has moved into the work lifecycle stage of declining LFPRs, with the tail end of the cohort turning 55 in Source: Bureau of Labor Sta s cs A recent development is the change in the labor force par cipa on rate trend. The LFPR of older workers (those aged 55 years and older) has turned upwards, resul ng in fla ening of the overall LFPR. More boomers are staying in the workforce longer, which may portend higher workforce growth over the coming years. Due to the size of the Baby Boomer cohort and the sensi vity of the LFPR to workforce growth rates, a rela vely small change in the LFPR of older workers would significantly boost the number in the workforce. 1


4 Popula on and Demographics Source: Demographic Services Center, Wisconsin Department of Administra on The chart above lists Waukesha County s ten largest municipali es and compares popula on growth since 2010 at the municipal, county, state, and na onal level. Popula on growth in Wisconsin and Waukesha County was slow as compared to the United States, although Waukesha's growth rate was somewhat higher than the state s. County growth of 6,558 residents or 1.7 percent was distributed differently among municipali es. The City of Pewaukee, with growth of 7.2 percent during the period, was the fastest growing municipality listed. The Village of Menomonee Falls grew at half the rate of Pewaukee, but due its larger size, added the most residents. The graph to the right displays the components of popula on growth in Waukesha County, the state, and the na on. The components include migra on, which is movement of residents into and out of the area, and natural increases and decreases resul ng from births and deaths. Components of Popula on Change Unlike Wisconsin, which lost more people to migra on than it gained, net migra on in Waukesha County was posi ve. Natural increases in popula on are closely correlated with age demographics. Strong natural increases generally occur in younger popula ons, which have higher fer lity and birth rates and lower death rates. At 42.8 years, the median age of Waukesha County residents was older than the state median of Source: Demographic Services Center, Wisconsin Department of Administra on 2
5 Labor Force Dynamics 39.0 and the Source: Local Area Unemployment Sta s cs, Bureau of Labor Sta s cs county s rate of natural increase of 0.9 percent was correspondingly lower. The graph above tracks the monthly unemployment rate in Waukesha County since 2000 and compares it to state and na onal rates during the same me. Since this unemployment data has not been seasonally adjusted, or smoothed, the graph also shows seasonal employment varia ons within each year. The seasonality of the county s labor market is moderate and typical, with normal peaks of unemployment early in the year and again in summer as students enter the job market in search of work, and normal troughs late in the year. A er peaking in early 2010, rates fell steadily as the economy recovered from the Great Recession. Waukesha County s average annual unemployment rate in 2016 was 3.6 percent, substan ally lower than the na onal rate of 4.9 percent and state rate of 4.1 percent. Source: Local Area Unemployment Sta s cs, Bureau of Labor Sta s cs The unemployment rate represents the por on of an area s labor force that is unemployed. The chart to the le displays those components as annual averages 3

6 Industry Employment and Wages and tracks labor force growth over me. Between 2000 and 2016, Waukesha County's labor force grew by 13,678 labor force par cipants or 6.5 percent, which was higher than 4.9 percent state average labor force growth dur ing the same period. The employment and wage distribu on graph above displays the economic impact of the various industry sectors in Waukesha County from both an employment and payroll perspec ve. Some data has been suppressed for con fiden ality. Waukesha County s job base grew by 3,292 jobs or 1.4 percent during Average annual statewide job growth was also 1.4 percent in Strongest employment growth occurred in professional and business services, with the management subsector accoun ng for 73 percent of the 948 job gains in the industry. Trade, transporta on, and u li es and educa on and health services also saw sub stan al employment growth, with the retail trade and health care subsectors com prising most of the growth in the two sectors. Manufactur ing lost the most jobs in 2016 but remains Waukesha s larg est sector in terms of payroll and second largest in terms of jobs. The table to the le shows 4
7 Employment Projec ons annual average wage by industry in Waukesha County, compares those wages to the statewide average, and displays the county s one year change in each of the sectors. Waukesha s average annual wage of $53,100 is the highest among Wisconsin s 72 coun es. It is 15.4 percent higher than the state average and increased at a slightly faster rate, 1.6 percent in Waukesha County compared to 1.4 percent in Wisconsin. Above average wages were paid in all sectors except leisure and hospitality and public administra on. The table above presents ten year regional employment projec ons by industry sector for the W O W Workforce Development Area, which is comprised of Waukesha, Ozaukee, and Washington coun es. The change in the number of jobs from 2014 to 2024 represents new jobs expected to be created during the period. In 2014, Waukesha had the largest share of the region s employment, with 71 percent of the region s jobs. Ozaukee and Washington coun es had 13 and 16 percent, respec vely. Ten year regional employment is projected to exceed projected statewide job growth of six percent. Jobs in the three county area are expected to increase seven percent between 2014 and 2024, with average annual growth of 0.7 percent or 2,753 jobs per year. Employment in the area exceeded projec ons, growing by 5,550 new jobs or 1.7 percent during The professional and business services sector, which provides professional, technical, and administra ve services to businesses, and educa on and health services sector and are projected to add the most jobs between 2014 and Within the larger educa on and health services sector, health services employment is expected to grow faster than educa onal services. This is due, in part, to demographic trends, with the elderly por on of the popula on expanding while the school age por on is shrinking. Large investments in new schools, classrooms, and teaching jobs are not an cipated, however this does not mean we won t need many new teachers. 5
8 Employment ProjecƟons Source: Office of Economic Advisors, Wisconsin Department of Workforce Development, September 2015 To get a be er idea of the types of jobs included in employment projec ons, we can also look at expected job growth by occupa on. The table above displays projected total job openings through 2024, which includes both openings resul ng from crea on of new jobs (Change column) and replacement openings in previously created jobs that are an cipated to occur as incumbent workers leave those posi ons, necessita ng the hiring of new workers to replace them (Replacement Openings column). Large numbers of Baby Boomers are expected to re re within the next few years, which is why projected replacement openings exceed the number of openings expected to occur because of job growth. This phenomenon is occurring not only in the W O W region, but throughout the state economy as well. Large numbers of annual job openings are projected in sales and related, food prepara on and serving, and office and administra ve support, which is expected to have the most job openings despite few new projected jobs in the occupa on. And many replacement openings are projected in other occupa ons that are not expected to grow significantly, such as produc on and educa on, training and library. This is especially common in occupa ons with older workforces and large numbers of an cipated re re ments during the projec on period, as well as low wage occupa ons which tend to have younger workforces but higher rates of employee turnover. 6


9 The workforce age distribu on within each of W O W Workforce Development Area s major industries displayed above presents a detailed view of the area's workforce age demographics. Considerable differences in age composi on among industry sectors are evident. Industries which commonly base pay on seniority, such as manufacturing and public administra on, employ the oldest workers. Other industries like construc on or leisure and hospitality typically employ the youngest workers because many of their jobs are physically demanding and/or seasonal or part me in nature, making them either unsuitable or unappealing to older workers. The highest rates of workforce par cipa on are seen among those who are of prime working age, which is generally considered to be between 25 and 54 years. Sixty two percent of the area s workers in all industries are of prime working age, with the age group accoun ng for 22 percent of the workforce, the largest share. Almost one quarter (23 percent) of area workers in all sectors are older than age 54. Public administra on has the highest por on of workers age 55 and older (31 percent), but it is a rela vely small sector employing only three percent of the area s workforce. In manufacturing, the second largest employment sector behind Trade, Transporta on and U li es, 27 percent of workers are age 55 and older. This explains, in part, why 83% of projected Produc on occupa on openings discussed on the previous page are to replace exi ng workers rather than to fill new jobs. The large number of older workers across all industries is concerning because when they inevitably re re, employers may encounter difficulty finding younger workers with the skills and experience necessary to replace them. For More Informa on: Wandy Miezio Regional Economist WOW WDA Phone: (262) wandy.miezio@dwd.wisconsin.gov 7
2017 ECONOMIC AND WORKFORCE PROFILE Washington County
 2017 ECONOMIC AND WORKFORCE PROFILE Washington County STATE OF WISCONSIN DETI-17957-WGT-P (R. 3/2018) Percentage of Total Popula on, Ages 65 and Older Wisconsin now has more people employed and more private
2017 ECONOMIC AND WORKFORCE PROFILE Walworth County
 2017 ECONOMIC AND WORKFORCE PROFILE Walworth County STATE OF WISCONSIN DETI-17957-WLW-P (R. 3/2018) Percentage of Total Popula on, Ages 65 and Older Wisconsin now has more people employed and more private
2017 ECONOMIC AND WORKFORCE PROFILE Florence County
 2017 ECONOMIC AND WORKFORCE PROFILE Florence County STATE OF WISCONSIN DETI-17957-FLO-P (R. 3/2018) Percentage of Total Popula on, Ages 65 and Older Wisconsin now has more people employed and more private
2017 ECONOMIC AND WORKFORCE PROFILE Kewaunee County
 2017 ECONOMIC AND WORKFORCE PROFILE Kewaunee County STATE OF WISCONSIN DETI-17957-KEW-P (R. 3/2018) Percentage of Total Popula on, Ages 65 and Older Wisconsin now has more people employed and more private
2017 ECONOMIC AND WORKFORCE PROFILE Douglas County
 2017 ECONOMIC AND WORKFORCE PROFILE Douglas County STATE OF WISCONSIN DETI-17957-DOU-P (R. 3/2018) Percentage of Total Popula on, Ages 65 and Older Wisconsin now has more people employed and more private
2017 ECONOMIC AND WORKFORCE PROFILE Winnebago County
 2017 ECONOMIC AND WORKFORCE PROFILE Winnebago County STATE OF WISCONSIN DETI-17957-WIN-P (R. 3/2018) Percentage of Total Popula on, Ages 65 and Older Wisconsin now has more people employed and more private
2017 ECONOMIC AND WORKFORCE PROFILE Green Lake County
 2017 ECONOMIC AND WORKFORCE PROFILE Green Lake County STATE OF WISCONSIN DETI-17957-GRL-P (R. 3/2018) Percentage of Total Popula on, Ages 65 and Older Wisconsin now has more people employed and more private
2017 ECONOMIC AND WORKFORCE PROFILE Brown County
 2017 ECONOMIC AND WORKFORCE PROFILE Brown County STATE OF WISCONSIN DETI-17957-BRW-P (R. 3/2018) Percentage of Total Popula on, Ages 65 and Older Wisconsin now has more people employed and more private
2017 ECONOMIC AND WORKFORCE PROFILE Monroe County
 2017 ECONOMIC AND WORKFORCE PROFILE Monroe County STATE OF WISCONSIN DETI-17957-MON-P (R. 3/2018) Percentage of Total Popula on, Ages 65 and Older Wisconsin now has more people employed and more private
2017 ECONOMIC AND WORKFORCE PROFILE Buffalo County
 2017 ECONOMIC AND WORKFORCE PROFILE Buffalo County STATE OF WISCONSIN DETI-17957-BUF-P (R. 3/2018) Percentage of Total Popula on, Ages 65 and Older Wisconsin now has more people employed and more private
2017 ECONOMIC AND WORKFORCE PROFILE Grant County
 2017 ECONOMIC AND WORKFORCE PROFILE Grant County STATE OF WISCONSIN DETI-17957-GRT-P (R. 3/2018) Percentage of Total Popula on, Ages 65 and Older Wisconsin now has more people employed and more private
2017 ECONOMIC AND WORKFORCE PROFILE Wood County
 2017 ECONOMIC AND WORKFORCE PROFILE Wood County STATE OF WISCONSIN DETI-17957-WOD-P (R. 3/2018) Percentage of Total Popula on, Ages 65 and Older Wisconsin now has more people employed and more private
2017 ECONOMIC AND WORKFORCE PROFILE Clark County
 2017 ECONOMIC AND WORKFORCE PROFILE Clark County STATE OF WISCONSIN DETI-17957-CLK-P (R. 3/2018) Percentage of Total Popula on, Ages 65 and Older Wisconsin now has more people employed and more private
2017 ECONOMIC AND WORKFORCE PROFILE Vernon County
 2017 ECONOMIC AND WORKFORCE PROFILE Vernon County STATE OF WISCONSIN DETI-17957-VRN-P (R. 3/2018) Percentage of Total Popula on, Ages 65 and Older Wisconsin now has more people employed and more private
2017 ECONOMIC AND WORKFORCE PROFILE Dodge County
 2017 ECONOMIC AND WORKFORCE PROFILE Dodge County STATE OF WISCONSIN DETI-17957-DOD-P (R. 3/2018) Percentage of Total Popula on, Ages 65 and Older Wisconsin now has more people employed and more private
2017 ECONOMIC AND WORKFORCE PROFILE Sauk County
 2017 ECONOMIC AND WORKFORCE PROFILE Sauk County STATE OF WISCONSIN DETI-17957-SAK-P (R. 3/2018) Percentage of Total Popula on, Ages 65 and Older Wisconsin now has more people employed and more private
2017 ECONOMIC AND WORKFORCE PROFILE Dane County
 2017 ECONOMIC AND WORKFORCE PROFILE Dane County STATE OF WISCONSIN DETI-17957-DAN-P (R. 3/2018) Percentage of Total Popula on, Ages 65 and Older Wisconsin now has more people employed and more private
2017 ECONOMIC AND WORKFORCE PROFILE Pierce County
 2017 ECONOMIC AND WORKFORCE PROFILE Pierce County STATE OF WISCONSIN DETI-17957-PRC-P (R. 3/2018) Percentage of Total Popula on, Ages 65 and Older Wisconsin now has more people employed and more private
2017 ECONOMIC AND WORKFORCE PROFILE St. Croix County
 2017 ECONOMIC AND WORKFORCE PROFILE St. Croix County STATE OF WISCONSIN DETI-17957-STC-P (R. 3/2018) Percentage of Total Popula on, Ages 65 and Older Wisconsin now has more people employed and more private
2017 ECONOMIC AND WORKFORCE PROFILE Chippewa County
 2017 ECONOMIC AND WORKFORCE PROFILE Chippewa County STATE OF WISCONSIN DETI-17957-CHP-P (R. 3/2018) Percentage of Total Popula on, Ages 65 and Older Wisconsin now has more people employed and more private
2017 ECONOMIC AND WORKFORCE PROFILE Barron County
 2017 ECONOMIC AND WORKFORCE PROFILE Barron County STATE OF WISCONSIN DETI-17957-BRN-P (R. 3/2018) Percentage of Total Popula on, Ages 65 and Older Wisconsin now has more people employed and more private
Racine County DETI RAC-P (N. 3/2016)
") Racine County DETI-17957-RAC-P (N. 3/2016) Average Household Income By County Na onal and State Economic Outlook Robust economic growth a er the Great Recession remains an cipated. The recession ended
Racine County DETI-17957-RAC-P (N. 3/2016) Average Household Income By County Na onal and State Economic Outlook Robust economic growth a er the Great Recession remains an cipated. The recession ended
Kenosha County DETI KEN-P (N. 3/2016)
") Kenosha County DETI-17957-KEN-P (N. 3/2016) Average Household Income By County Na onal and State Economic Outlook Robust economic growth a er the Great Recession remains an cipated. The recession ended
Kenosha County DETI-17957-KEN-P (N. 3/2016) Average Household Income By County Na onal and State Economic Outlook Robust economic growth a er the Great Recession remains an cipated. The recession ended
Columbia County DETI COL-P (N. 3/2016)
") Columbia County DETI-17957-COL-P (N. 3/2016) Average Household Income By County Na onal and State Economic Outlook Robust economic growth a er the Great Recession remains an cipated. The recession ended
Columbia County DETI-17957-COL-P (N. 3/2016) Average Household Income By County Na onal and State Economic Outlook Robust economic growth a er the Great Recession remains an cipated. The recession ended
Dane County DETI DAN-P DAN (N. 3/2016)
") Dane County DETI-17957-DAN-P DAN (N. 3/2016) Average Household Income By County Na onal and State Economic Outlook Robust economic growth a er the Great Recession remains an cipated. The recession ended
Dane County DETI-17957-DAN-P DAN (N. 3/2016) Average Household Income By County Na onal and State Economic Outlook Robust economic growth a er the Great Recession remains an cipated. The recession ended
Burnett County DETI BNT-P (N. 3/2016)
") Burnett County DETI-17957-BNT-P (N. 3/2016) Average Household Income By County Na onal and State Economic Outlook Robust economic growth a er the Great Recession remains an cipated. The recession ended
Burnett County DETI-17957-BNT-P (N. 3/2016) Average Household Income By County Na onal and State Economic Outlook Robust economic growth a er the Great Recession remains an cipated. The recession ended
Price County DETI PRI-P P (N. 3/2016)
") Price County DETI-17957-PRI-P P (N. 3/2016) Average Household Income By County Na onal and State Economic Outlook Robust economic growth a er the Great Recession remains an cipated. The recession ended
Price County DETI-17957-PRI-P P (N. 3/2016) Average Household Income By County Na onal and State Economic Outlook Robust economic growth a er the Great Recession remains an cipated. The recession ended
Rock County DETI RCK-P (N. 3/2016)
") Rock County DETI-17957-RCK-P (N. 3/2016) 2015 Rock County Economic and Workforce Profile Na onal and State Economic Outlook Robust economic growth a er the Great Recession remains an cipated. The recession
Rock County DETI-17957-RCK-P (N. 3/2016) 2015 Rock County Economic and Workforce Profile Na onal and State Economic Outlook Robust economic growth a er the Great Recession remains an cipated. The recession
Eau Claire County DETI ECL-P ECL (N. 3/2016)
") Eau Claire County DETI-17957-ECL-P ECL (N. 3/2016) Average Household Income By County Na onal and State Economic Outlook Robust economic growth a er the Great Recession remains an cipated. The recession
Eau Claire County DETI-17957-ECL-P ECL (N. 3/2016) Average Household Income By County Na onal and State Economic Outlook Robust economic growth a er the Great Recession remains an cipated. The recession
Outagamie County DETI OUT-P (N. 3/2016)
") Outagamie County DETI-17957-OUT-P (N. 3/2016) Average Household Income By County Na onal and State Economic Outlook Robust economic growth a er the Great Recession remains an cipated. The recession ended
Outagamie County DETI-17957-OUT-P (N. 3/2016) Average Household Income By County Na onal and State Economic Outlook Robust economic growth a er the Great Recession remains an cipated. The recession ended
Jackson County DETI JAK-P (N. 3/2016)
") Jackson County DETI-17957-JAK-P (N. 3/2016) 2015 Jackson County Economic and Workforce Profile Na onal and State Economic Outlook Robust economic growth a er the Great Recession remains an cipated. The
Jackson County DETI-17957-JAK-P (N. 3/2016) 2015 Jackson County Economic and Workforce Profile Na onal and State Economic Outlook Robust economic growth a er the Great Recession remains an cipated. The
Guernsey Economic Overview
 Guernsey Economic Overview Issue date: 19 May 17 The Guernsey Economic Overview brings together the most recent official Guernsey sta s cs and provides an overview of economic condi ons in Guernsey and
Economy Overview. Eagle County, CO. Emsi Q Data Set
 Eagle County, CO Emsi Q4 2018 Data Set www.economicmodeling.com Contents. Economy........ Overview......................................................................................... 1... Historic.......&..
Economy Overview. Pitkin County, CO. Emsi Q Data Set
 Pitkin County, CO Emsi Q4 2018 Data Set www.economicmodeling.com Contents. Economy........ Overview......................................................................................... 1... Historic.......&..
County Economic Profile Lee County, MS extension.msstate.edu/economic profiles
 County Economic Profile Lee County, MS extension.msstate.edu/economic profiles Demographics* Lee Mississippi United States Total Popula on, 2017 (Popula on Es mates) 84,933 2,984,100 325,719,178 Percent
2012 ALBANY COUNTY EXECUTIVE BUDGET
 2012 ALBANY COUNTY EXECUTIVE BUDGET INTRODUCTION AND HIGHLIGHTS Economic Forecast MICHAEL G. BRESLIN County Execu ve INTRODUCTION This sec on of the budget provides a survey of economic indicators and
County Economic Profile Copiah County, MS extension.msstate.edu/economic profiles
 County Economic Profile Copiah County, MS extension.msstate.edu/economic profiles Demographics* Copiah Mississippi United States Total Popula on, 2017 (Popula on Es mates) 28,516 2,984,100 325,719,178
County Economic Profile Marion County, MS extension.msstate.edu/economic profiles
 County Economic Profile Marion County, MS extension.msstate.edu/economic profiles Demographics* Marion Mississippi United States Total Popula on, 2017 (Popula on Es mates) 25,069 2,984,100 325,719,178
County Economic Profile Jasper County, MS extension.msstate.edu/economic profiles
 County Economic Profile Jasper County, MS extension.msstate.edu/economic profiles Demographics* Jasper Mississippi United States Total Popula on, 2017 (Popula on Es mates) 16,582 2,984,100 325,719,178
County Economic Profile Monroe County, MS extension.msstate.edu/economic profiles
 County Economic Profile Monroe County, MS extension.msstate.edu/economic profiles Demographics* Monroe Mississippi United States Total Popula on, 2017 (Popula on Es mates) 35,872 2,984,100 325,719,178
Quarterly Labour Market Report. August 2017
 Quarterly Labour Market Report August 2017 MB14363 August 2017 Ministry of Business, Innovation and Employment (MBIE) Hikina Whakatutuki - Lifting to make successful MBIE develops and delivers policy,
County Economic Profile Leflore County, MS extension.msstate.edu/economic profiles
 County Economic Profile Leflore County, MS extension.msstate.edu/economic profiles Demographics* Leflore Mississippi United States Total Popula on, 2017 (Popula on Es mates) 29,223 2,984,100 325,719,178
County Economic Profile Bolivar County, MS extension.msstate.edu/economic profiles
 County Economic Profile Bolivar County, MS extension.msstate.edu/economic profiles Demographics* Bolivar Mississippi United States Total Popula on, 2017 (Popula on Es mates) 31,945 2,984,100 325,719,178
County Economic Profile Tunica County, MS extension.msstate.edu/economic profiles
 County Economic Profile Tunica County, MS extension.msstate.edu/economic profiles Demographics* Tunica Mississippi United States Total Popula on, 2017 (Popula on Es mates) 10,024 2,984,100 325,719,178
County Economic Profile Coahoma County, MS extension.msstate.edu/economic profiles
 County Economic Profile Coahoma County, MS extension.msstate.edu/economic profiles Demographics* Coahoma Mississippi United States Total Popula on, 2017 (Popula on Es mates) 23,154 2,984,100 325,719,178
County Economic Profile Lamar County, MS extension.msstate.edu/economic profiles
 County Economic Profile Lamar County, MS extension.msstate.edu/economic profiles Demographics* Lamar Mississippi United States Total Popula on, 2017 (Popula on Es mates) 61,374 2,984,100 325,719,178 Percent
Economy Overview. Summit County, CO. Emsi Q Data Set
 Summit County, CO Emsi Q4 2018 Data Set www.economicmodeling.com Contents. Economy........ Overview......................................................................................... 1... Historic.......&..
County Economic Profile Clarke County, MS extension.msstate.edu/economic profiles
 County Economic Profile Clarke County, MS extension.msstate.edu/economic profiles Demographics* Clarke Mississippi United States Total Popula on, 2017 (Popula on Es mates) 15,828 2,984,100 325,719,178
County Economic Profile Smith County, MS extension.msstate.edu/economic profiles
 County Economic Profile Smith County, MS extension.msstate.edu/economic profiles Demographics* Smith Mississippi United States Total Popula on, 2017 (Popula on Es mates) 16,078 2,984,100 325,719,178 Percent
Quarterly Labour Market Report. August 2018
 Quarterly Labour Market Report August 2018 Ministry of Business, Innovation and Employment (MBIE) Hikina Whakatutuki - Lifting to make successful MBIE develops and delivers policy, services, advice and
La Crosse County, WI
 La Crosse County, WI Mississippi River Regional Planning Commission 1707 Main Street, Suite 435 La Crosse, Wisconsin 54601 Emsi Q4 2018 Data Set www.economicmodeling.com Contents. Economy........ Overview.........................................................................................
Quarterly Labour Market Report. November 2017
 Quarterly Labour Market Report November 2017 MBIE 3518 November 2017 Ministry of Business, Innovation and Employment (MBIE) Hikina Whakatutuki - Lifting to make successful MBIE develops and delivers policy,
Camden County, MO. Economy Overview. Michele Kroll, Community Development Specialist,
 Camden County, MO Michele Kroll, Community Development Specialist, krollm@missouri.edu Emsi Q1 2018 Data Set www.economicmodeling.com Contents. Economy........ Overview.........................................................................................
Pennington County, SD
 Pennington County, SD 730 E. Watertown Street, Suite 102 Rapid City, South Dakota 57701 Emsi Q2 2018 Data Set www.economicmodeling.com Contents. Economy........ Overview.........................................................................................
Allegan County, MI. Economy Overview. Michigan Economic Development Corpora on. 300 N. Washington Square, Lower Level Lansing, Michigan 48913
 Allegan County, MI Michigan Economic Development Corpora on 300 N. Washington Square, Lower Level Lansing, Michigan 48913 Emsi Q4 2018 Data Set www.economicmodeling.com Contents. Economy........ Overview.........................................................................................
14 Coun es. Economy Overview. West Virginia Department of Commerce Capitol Complex, Bldg. 6, Room 525 Charleston, West Virginia 25305
 14 Coun es West Virginia Department of Commerce Capitol Complex, Bldg. 6, Room 525 Charleston, West Virginia 25305 Emsi Q4 2018 Data Set www.economicmodeling.com Contents. Economy........ Overview.........................................................................................
Economy Overview. Grand County, CO. Emsi Q Data Set
 Grand County, CO Emsi Q4 2018 Data Set www.economicmodeling.com Contents. Economy........ Overview......................................................................................... 1... Historic.......&..
Miller County, MO. Economy Overview. Michele Kroll, Community Development Specialist,
 Miller County, MO Michele Kroll, Community Development Specialist, krollm@missouri.edu Emsi Q1 2018 Data Set www.economicmodeling.com Contents. Economy........ Overview.........................................................................................
Economy Overview. Esmeralda County, NV. Emsi Q Data Set
 Esmeralda County, NV Emsi Q3 2018 Data Set www.economicmodeling.com Economy Overview 795 403 $43.1K Popula on (2017) Jobs (2017) Median Household Income (2016) Popula on grew by 26 over the last 5 years
O awa County, MI. Economy Overview. Michigan Economic Development Corpora on. 300 N. Washington Square, Lower Level Lansing, Michigan 48913
 O awa County, MI Michigan Economic Development Corpora on 300 N. Washington Square, Lower Level Lansing, Michigan 48913 Emsi Q4 2018 Data Set www.economicmodeling.com Contents. Economy........ Overview.........................................................................................
Environmental Justice Task Force
 Attachment 5 Year 2050 Population and Economic Forecasts #211068v1 Environmental Justice Task Force April 16, 2013 1 Introduction Population and economic projections serve as a basis for updating the regional
The Advisors Inner Circle Fund II
 The Advisors Inner Circle Fund II A Class Shares PROSPECTUS June 1, 2018 Frost Total Return Bond Fund (FAJEX) Frost Credit Fund (FCFBX) Investment Adviser: Frost Investment Advisors, LLC The U.S. Securi
WORKFORCE RESULTS. October 1 December 31, 2013 Second Quarter, Program Year 2013
 WORKFORCE RESULTS October 1 December 31, 2013 Second Quarter, Program Year 2013 WORKFORCE RESULTS Submi ed By: The Department of Workforce Services provides this overview of performance for the period
Bucks County, PA. Economy Overview. Bucks County Workforce Development Board, Inc Veterans Highway Bristol, Pennsylvania 19007
 Bucks County, PA Bucks County Workforce Development Board, Inc. 1268 Veterans Highway Bristol, Pennsylvania 19007 Emsi Q4 2018 Data Set www.economicmodeling.com Contents. Economy........ Overview.........................................................................................
Burnett County Workforce Profile
 Percentage of working-age population aged 60 years and older in 2020 23.2% - 30.0% 30.1% - 40.0% 40.1% - 49.3% State average 29.4% Office of Economic Advisors OEA-10599-P Beverly Gehrke 15618 Windrose
3 New Hampshire ZIPs
 3 New Hampshire ZIPs New Hampshire Economic Development 172 Pembroke Rd Concord, New Hampshire 03301 Emsi Q4 2018 Data Set www.economicmodeling.com Contents. Economy........ Overview.........................................................................................
2 North San Joaquin Valley Index. Prepared by: Jeffrey A. Michael and Thomas E. Pogue
 Prepared by: Jeffrey A. Michael and Thomas E. Pogue This report has been prepared by the Center for Business and Policy Research at the University of the Pacific. This publica on was supported by JP Morgan
Table of Contents. Long Range Financial Plan 27. Report Introduction 1
 Table of Contents Report Introduction 1 Water/Wastewater Long Range Financial Planning 2 Principles of Financial Sustainability 4 Importance of a Long Range Financial Plan 5 General Approach to Preparing
Superior Trade Zone. Economy Overview. Lake Superior Community Partnership. 501 S. Front Street Marque e, Michigan 49855
 Superior Trade Zone Lake Superior Community Partnership 501 S. Front Street Marque e, Michigan 49855 Emsi Q3 2018 Data Set www.economicmodeling.com Contents. Economy........ Overview.........................................................................................
Putting Maine Job Growth in Context, Report for Labor Commissioner Jeanne Paquette, May, 2014
 Maine State Library Maine State Documents Center for Workforce Research and Information Documents Labor 9-4-2014 Putting Maine Job Growth in Context, Report for Labor Commissioner Jeanne Paquette, May,
Economy Overview. Monroe County, WI. Emsi Q Data Set
 Monroe County, WI Emsi Q4 2017 Data Set www.economicmodeling.com Contents. Economy........ Overview......................................................................................... 1... Historic.......&..
Deputy Finance Director Recruitment
 Deputy Finance Director Recruitment The City of Cape Girardeau, serving a growing popula on of 39,000, is succession planning for their Finance Director. The city is located between St. Louis and Memphis
CHAPTER I. Contextual background on Moldova. A. Historical and poli cal context. Table 2: General facts about Moldova
 CHAPTER I Contextual background on Moldova A. Historical and poli cal context Moldova is a small, landlocked country situated towards the east of the UNECE region, bordering Romania and Ukraine. It has
Economy Overview. Hunt County, TX. Emsi Q Data Set
 Hunt County, TX Emsi Q4 2018 Data Set www.economicmodeling.com Contents. Economy........ Overview......................................................................................... 1... Historic.......&..
Palo Pinto County, TX
 Palo Pinto County, TX Emsi Q3 2018 Data Set www.economicmodeling.com Contents. Economy........ Overview......................................................................................... 1... Historic.......&..
Economy Overview. Ellis County, TX. Emsi Q Data Set
 Ellis County, TX Emsi Q3 2018 Data Set www.economicmodeling.com Contents. Economy........ Overview......................................................................................... 1... Historic.......&..
Tessa Conroy, Matt Kures, and Steven Deller
 WIndicators Labor Shortage: Signs and Symptoms Volume 1, Number 5 Tessa Conroy, Matt Kures, and Steven Deller In Wisconsin, the labor market has been the focus of recent public and political discourse,
which looks like a credit card, but is electronically connected to the cardholder s bank account.
 U C C T C Y F A L 1.4.1.F1 Credit is derived from the La n word credo meaning I believe. Credit is when goods, services, or money is received in exchange for a promise to pay a definite sum of money at
Florida: An Economic Overview
 Florida: An Economic Overview December 26, 2018 Presented by: The Florida Legislature Office of Economic and Demographic Research 850.487.1402 http://edr.state.fl.us Shifting in Key Economic Variables
Communica on with Local Communi es. Hiring Local Manpower and Resources. Office Open in Belgrade
 Defining and adopting the Stakeholder Engagement Plan (SEP) Rakita has defined the Stakeholder Engagement Plan (SEP), which represents the base-line for communica on and cooperaon with target audiences
Economy Overview. Collin County, TX. Emsi Q Data Set
 Collin County, TX Emsi Q3 2018 Data Set www.economicmodeling.com Contents. Economy........ Overview......................................................................................... 1... Historic.......&..
Economy Overview. Denton County, TX. Emsi Q Data Set
 Denton County, TX Emsi Q1 2018 Data Set www.economicmodeling.com Contents. Economy........ Overview......................................................................................... 1... Historic.......&..
Rocky Mountain ECONOMIST: Labor force participation rates have fallen sharply THE
 THE Rocky Mountain ECONOMIST: Economic information for Colorado, New Mexico and Wyoming 1 st Quarter 201 4 Effect of Aging on Labor Force Participation Rates in the Mountain States by Alison Felix, Economist
New England Economic Partnership May 2012: Massachusetts
 Executive Summary and Highlights MASSACHUSETTS ECONOMIC OUTLOOK The Massachusetts economy has been in an expansion phase since the summer of 2009. The pace of expansion appears to have slowed from the
Economy Overview. Navarro County, TX. Emsi Q Data Set
 Economy Overview Navarro County, TX Emsi Q3 2017 Data Set www.economicmodeling.com Economy Overview Contents. Economy........ Overview.........................................................................................
Bloomberg Survey of Economists
 Bloomberg Survey of Economists December 2018 Economists Lower Rate Forecasts but Expect Economy to Con nue Growing in 2019 Economists revised their 2019 growth forecasts slightly lower and expect interest
The Fron er Line. GLI Benchmarks. Thought Leadership and insights from Fron er Advisors. Issue 103, March 2015
 Thought Leadership and insights from Fron er Advisors GLI Benchmarks Issue 103, March 2015 Fron er Advisors has been at the forefront of ins tu onal investment advice in Australia for over two decades
Polk County Labor Market Review
 Polk County Labor Market Review Polk County has a labor force of approximately 281,000 with 265,000 of them employed as of June 2016. The labor force reversed the 2014 2015 trend by growing 0.22% between
NORTH CAROLINA EDUCATION LOTTERY POPULAR ANNUAL FINANCIAL REPORT FISCAL YEAR ENDED JUNE 30, 2015
 NORTH CAROLINA EDUCATION LOTTERY POPULAR ANNUAL FINANCIAL REPORT FISCAL YEAR ENDED JUNE 30, 2015 ABOUT THE POPULAR ANNUAL FINANCIAL REPORT The North Carolina Educa on Lo ery (NCEL) finance division is
Her Majesty the Queen in Right of Canada (2018) All rights reserved
 All rights reserved") 0 Her Majesty the Queen in Right of Canada (2018) All rights reserved All requests for permission to reproduce this document or any part thereof shall be addressed to the Department of Finance Canada.
0 Her Majesty the Queen in Right of Canada (2018) All rights reserved All requests for permission to reproduce this document or any part thereof shall be addressed to the Department of Finance Canada.
Marshall & Lyon County Economic Update
 Marshall & Lyon County Economic Update Cameron Macht, Regional Analyst Minnesota Department of Employment and Economic Development 320-231-5174 ext. 7535 cameron.macht@state.mn.us www.deed.state.mn.us/lmi
THE RHODE ISLAND ECONOMIC OUTLOOK AND FORECAST: MATCHING SKILLS TO JOBS
 THE RHODE ISLAND ECONOMIC OUTLOOK AND FORECAST: MATCHING SKILLS TO JOBS Through April of 2012, Rhode Island continued to have the second highest unemployment rate in the United States with 62,178 people
Population by Year. Ray County, Missouri 23,712 23,541. Population by Age. Ray County, Missouri 27% 27% 22%
 emographics, popula on has decreased by 3 percent since 2 and its popula on now stands at 22,754. or more informa on on Ray County, please visit www.raycountymo.com. Popula on by Year Population by Year
Monthly Financial Status Report
 Prepared by the Financial Services Department Key Revenue Indicators Overview The ad valorem tax revenues are derived from taxes levied on Property Tax real property, personal property and state assessed
Massachusetts Outlook,
 Massachusetts Outlook, 2016-2020 Highlights The state s economic growth will be pulled by two forces in opposite directions. Constraining growth will be a slower increase in the availability of workers
Monthly Financial Status Report
 Prepared by the Financial Services Department Key Revenue Indicators Overview The ad valorem tax revenues are derived from taxes levied on Property Tax real property, personal property and state assessed
Economy Overview. Greater Lima Region. Emsi Q Data Set
 Greater Lima Region Emsi Q3 2017 Data Set www.economicmodeling.com Contents. Economy........ Overview......................................................................................... 1... Historic.......&..
The Province of Prince Edward Island Employment Trends and Data Poverty Reduction Action Plan Backgrounder
 The Province of Prince Edward Island Employment Trends and Data Poverty Reduction Action Plan Backgrounder 5/17/2018 www.princeedwardisland.ca/poverty-reduction $000's Poverty Reduction Action Plan Backgrounder:
Economic and Market Review Fourth Quarter 2017
 Redstone Advisors Tax law is like the world s biggest game of chess with all sorts of weird conundrums about ethics and civics and consent of the governed built in. David Foster Wallace Financial markets
City of Guelph. Financial Condi on Assessment. September 24, 2015
 City of Guelph Financial Condi on Assessment September 24, 2015 62 Table of Contents Exeuctive Summary Introduction 1 Trend Analysis 2 Peer Analysis 2 Questions to Consider 3 Key Indicators 4 Section 1