Retirement Intentions 2006
|
|
|
- Magdalen Sheena McCarthy
- 5 years ago
- Views:
Transcription


1 Survey of Western Australian public sector employees 45 years and older Department of the Premier and Cabinet Government of Western Australia
2 Survey of Western Australian public sector employees 45 years and older
3 Copyright 2007 by the Public Sector Management Division, Department of the Premier & Cabinet, The Department has no objection to this document being copied in whole or part, provided there is due acknowledgement of any material quoted from this document. Copies of this document are available in alternative formats upon request. 197 St Georges Terrace, Perth WA 6000 Internet : admin@dpc.wa.gov.au Phone: ii
4 Foreword The retaining of wisdom Retirement Intentions 2006 Along with the Western Australian community, the State government workforce is ageing. This research paper into the retirement intentions of older public sector employees contributes to a larger body of work on the ageing workforce that has been undertaken by the Department of the Premier and Cabinet over several years i. The 2006 Retirement Intentions survey replicates a survey of Western Australian public sector employees conducted in The 2006 research targeted employees approaching retirement in order to gain a better understanding of their work and retirement intentions. One of the key findings presented in the paper is that the retirement intentions reported in the previous survey of employees 45 years or older undertaken back in 2000, are similar to the separation behaviour of older employees from 2001 to This implies that as the 2006 Retirement Intentions survey is considerably larger and a good representation of the public sector workforce 45 years or older, this paper provides a valuable insight into the retirement intentions of employees over the next 5 to 10 years. In general, respondents to the 2006 Retirement Intentions survey feel positive about retirement. They look forward to leaving and have ideas about what they will do in their retirement. Almost a third of the employees surveyed intend to retire from the public sector in the next 5 years and around two thirds intend to retire in the next 10 years. Many of these employees perform key functions across the sector and represent a highly skilled and experienced component of the workforce. Indeed, almost three quarters of those respondents intending to retire in less than 10 years have 15 years or more experience working in the Western Australian public sector. The challenge to be faced If the public sector is to manage the transition of employees from the workplace over the next decade it will need to address the perceived barriers to continuing work after retirement age. Many of the issues regarding whether to retire or whether to remain in the workforce centre around flexible work arrangements. The survey findings suggest that while many respondents are interested in flexible working arrangements before retiring, comparatively few have taken up a flexible work option. Clearly, the barriers to continued employment such as employee reluctance and/or negative organisational culture need to be further explored and openly discussed in more detail. Similarly, the sector needs to ensure that valued employees at all levels of government are provided with opportunities to access flexible work options and are supported in their choice. Balancing the personal, social and health needs of older employees at the same time as transferring knowledge and experience will require innovative and committed management throughout the Sector. The survey findings also imply that there is a widespread lack of retirement and work transition planning by individual employees. Preparation is a key to successful work/retirement transition for all employees and ensuring a greater understanding throughout the sector of the options already available as well as their financial implications, is an area that requires further attention. iii
5 A future full of opportunity With over half of Western Australian full time permanent public sector employees aged 45 years or older, the profile of the sector is destined to change ii. The shift in the workforce which will occur as baby boomers leave public sector employment will create many opportunities to transform what and how services are provided to the community. It is anticipated that productivity improvements and advances in technology will support this transformation over the coming decades. With nearly one in five respondents intending to continue to work after they retire from the public sector, opportunity also exists to encourage employees to remain in some form of employment and share their considerable knowledge and experience. The sector needs to embrace this opportunity to retain these interested and committed employees. In conclusion, I would like to recommend this publication to all researchers and policy makers throughout the sector who are required to manage and plan for the workforce of tomorrow. My Department is charged with responsibility for coordinating a response to the ageing public sector workforce and ensuring that the employment arrangements available to employees support both their needs and the requirements of their agencies. We intend to work closely with other key government bodies also committed to managing the public sector workforce to ensure a united and coordinated policy response. We also aim to support individual Departments to ensure they embrace any opportunity for change to the profile and structure of their workforce. Lastly, I would like to thank all those involved in this worthwhile project. In particular, I would like to acknowledge the support and commitment of liaison staff in the 43 agencies involved with the survey. I would also like to sincerely thank all those public sector employees who took the time to complete and submit the surveys. I believe that by focusing on the needs and aspirations of older employees, we can maximise employment opportunities for all employees as well as the public sector as a whole. M C Wauchope DIRECTOR GENERAL DEPARTMENT OF THE PREMIER AND CABINET iv
6 TABLE OF CONTENTS 1 CHANGING FACE OF THE STATE GOVERNMENT WORKFORCE POPULATION AGEING FUTURE CHALLENGE FOR THE STATE PUBLIC SECTOR WORKFORCE AGEING IN THE WESTERN AUSTRALIAN PUBLIC SECTOR Need for Research and Planning The 2006 Retirement Intentions Survey EFFECTS OF AN AGEING WORKFORCE TIMING OF RETIREMENT AGE AT RETIREMENT CHARACTERISTICS OF RESPONDENTS WITH DIFFERENT RETIREMENT TIMING INTENTIONS Age and Timing of Retirement Gender Salary Occupational Differences LOSS OF EXPERIENCE COMPARISON WITH OTHER RETIREMENT INTENTIONS SURVEYS Western Australian Public Sector Retirement Intentions Survey Interstate Retirement Intention Surveys Australian Bureau of Statistics ACTUAL RETIREMENT 2001 TO Retirement Timing Retirement Age RETIREMENT INFLUENCES AND ASPIRATIONS ATTITUDES TO RETIREMENT General Attitudes to Retirement THE RETIREMENT DECISION Factors in Determining When to Retire The Importance of Financial Security for Retirement FLEXIBLE WORKING ARRANGEMENTS Awareness of Available Options Interest in Flexible Working Arrangements Flexible Work Arrangements Already Taken Interest versus take-up of Flexible Working Arrangements Employees Perceptions of Obstacles to Accessing Flexible Arrangements OPTIONS AVAILABLE OTHER THAN RETIREMENT Working Beyond Eligible Retirement Age Discussion of Barriers to Working Beyond Eligible Retirement Age Intention to Work after Retiring from the Public Sector Employment after Retiring from the WAPS v
7 4 FINANCIAL PLANNING FOR RETIREMENT PERCEIVED FINANCIAL SECURITY Perceived Financial Security and Knowledge of Superannuation RETIREMENT PLANNING Superannuation, Income and Financial Planning COMPARISON WITH OTHER RETIREMENT INTENTIONS SURVEYS Western Australian Public Sector Retirement Intentions Survey Other Retirement Intentions Surveys APPENDIX A. SURVEY METHODOLOGY AND DEMOGRAPHIC INFORMATION A.1. SURVEY DETAILS A.1.1. Introduction A.1.2. Agency Consultation A.1.3. Survey Population A.1.4. Survey Instrument A.1.5. Survey Implementation A.1.6. Responses A.1.7. Data Preparation and Cleaning A.1.8. Question Responses A.2. ANALYSIS AND INTERPRETATION A.2.1. Demographic Comparison Between Respondents and the Workforce: 2000 and A.2.2. Profile and Representativeness of Respondents A.2.3. Representativeness of the Sample for an Agency A /07 FEDERAL BUDGET XVI EFFECT ON RESPONSES B. SURVEY DOCUMENT BIBLIOGRAPHY vi
8 LIST OF TABLES Retirement Intentions 2006 Table 1: Intended Age of Retirement by Gender Table 2: Intended Years to Retirement by Gender Table 3: Intended Age of Retirement Occupations Table 4: Intended Years to Retirement by Primary and Secondary Occupations Table 5: Intended Years to Retirement by Experience in the WAPS Table 6: Loss of Experience within 10 Years by Region Table 7: Loss of Experience within 10 Years by Southern Regions and Occupation Table 8: Loss of Experience within 10 Years by Large Public Sector Agencies Table 9: Loss of Experience within 10 Years by Medium to Small Public Sector Agencies Table 10: Intended Years to Retirement: Other Survey Results Table 11: Intended Age of Retirement: Other Survey Results Table 12: Separations of Permanent Employees 55 Years or Older Table 13: Gender, Age and Salary of Respondents Agreeing with Attitude Statements Table 14: Factors in Determining when to Retire by Age Table 15: Perceived Barriers to Retirement by Gender, Age and Salary Table 16: Interest in Flexible Working Arrangements by Age Table 17: Flexible Working Arrangements by Gender, Age and Salary Table 18: Position on Flexible Work Options by Respondents Planning to Retire Within 5 Years Table 19: Position on Flexible Work options by Respondents Planning to Retire Within 5 Years by Occupation Table 20: Interest in Gradual Reduction in Hours Over a Number of Years Leading up to Retirement by Respondents Planning to Retire Within 5 Years Table 21: Comparison of the Intended Age of Retirement from Paid Employment and from the WAPS (By Gender) Table 22: Main Source and Adequacy of Retirement Income for Retirement Table 23: Adequacy of Superannuation and Income by Gender, Age and Salary Table 24: Occupation by Adequacy of Superannuation and Income Table 25: Knowledge of Superannuation Amount and Adequacy of Superannuation and Income in Retirement Table 26: Financial Planning by Gender, Age and Salary Table 27: Financial Planning by Occupation Table 28: Financial Planning by Experience in WAPS and Level of Education Table 29: Financial Planning by Knowledge of Superannuation Amount Table 30: Financial Planning by Attitude to Retirement and Adequacy of Income Table 31: Financial Planning and Adequacy of Superannuation and Income: Comparison to Other Survey Results Table 32: Targeted Employees and Response Rates for Large Agencies Table 33: Targeted Employees and Response Rates for Medium to Small Agencies Table 34: Responses by the SES Table 35: Lower Response Rate Questions Table 36: Demographic Profile of Respondents 2000 and 2006 Survey Table 37: Demographic Profile of Respondents 2000 and 2006 Survey Continued Table 38: Under or Over Represented Demographic Groups vii
9 LIST OF FIGURES Figure 1: Projected Age Distribution Western Australia... 2 Figure 2: Ageing Affects all Australian States and Territories: Figure 3: Change in Participation Rates 2003 to Figure 4: Western Australian Public Sector by Age to Figure 5: Western Australian Public Sector Age Profile Figure 6: Intended Years to Retirement from the WAPS... 9 Figure 7: Intended Age of Retirement from the WAPS... 9 Figure 8: Intended Age of Retirement by Current Age Figure 9: Intended Years to Retirement by Current Age Figure 10: Intended Years to Retirement by Salary Figure 11: Intended Age of Retirement by Salary Figure 12: Intended Age of Retirement by Occupation Figure 13: Intended Years to Retirement by Occupation Figure 14: Loss of Experienced Employees in the Next 10 Years by Qualifications and Occupation Figure 15: Intended Age of Retirement: WA Public Sector and Australia Wide Figure 16: Overall Attitudes Toward Retirement Figure 17: Factors in Determining when to Retire Figure 18: Overall Perceived Barriers to Retiring at Preferred Time Figure 19: Interest in Flexible Working Arrangements and Awareness of Changes to Superannuation Figure 20: Interest in Flexible Working Arrangements by Gender Figure 21: Currently Working in a Flexible Work Arrangement by Gender Figure 22: Barriers to Working Beyond Eligible Retirement Age Figure 23: Intention to Retire from Paid Employment at the Same or Later Age than WAPS by Occupation Figure 24: Intention to Retire from Paid Employment at the Same or Later Age than WAPS by Interest in Flexible Arrangements Figure 25: Intention to Retire from Paid Work at the Same or Later Age than WAPS by Barriers to Working Beyond Eligible Retirement Age Figure 26: Adequacy of Superannuation and Income for Retirement Figure 27: Financial Planning for Retirement Figure 28: Employment Status by Gender Figure 29: Responses by Age and Gender Figure 30: Full-time and Part-Time Respondents by Age Figure 31: Age and Occupation Figure 32: Occupation and Gender Figure 33: Occupation and Salary Figure 34: Gender and Salary Figure 35: Experience in WAPS and Gender Figure 36: Percentage of Unsure Answers, Pre and Post 2006/07 Federal Budget Figure 37: Percentage of Respondents who were NOT Unsure Answers, Pre and Post 2006/07 Federal Budget viii
10 1 Changing Face of the State Government Workforce 1.1 Population Ageing With every passing year the average age of the Australian population is increasing. While there is common agreement that Australian communities will age over the next forty to fifty years, the nature and extent of the social and economic impact of this gradual yet unavoidable transformation remains to be seen. There is little doubt that services required by the community will change as they have always changed over time. There will be proportionately less children to nurture and educate, while older Australians will consume more government services in terms of health, aged care and pensions iii. It is also anticipated that older people will live longer, healthier and wealthier lives than their predecessors and will make significant ongoing economic and social contributions to their communities. For instance, the amount of voluntary work increases with age, while compulsory savings will go some way to providing financial independence to many older Australians as they age iv. The population of Western Australia, like all other States and Territories throughout Australia, is projected to increase both in size as well as age over the next 50 years. It is estimated that the population of Perth alone will increase from 1.5 million as at June 2004, to somewhere in the region of 2 to 3 million by the middle of this century v. This growth, however, will be disproportionately distributed across the population in terms of age. This effect is largely due to the generation born in an era of increased fertility after World War II. These so called baby boomers will turn 65 years old between 2011 and 2031 iii. The three different graphs in Figure 1 represent the best current estimate of future population growth and change from 2006 to These 2005 Australian Bureau of Statistics (ABS) population projections suggest that the proportion of young people (0-14 years of age) will reduce from around 20% of the Western Australian population in 2006, to between 13% and 16% by Conversely, the proportion of people aged 65 years or older will increase from approximately 12% in 2006, to around 26% to 29% of the population in 2051 v. Recent demographic statistics, however, suggest an increase in fertility across Australia. Indeed, rates have increased to a ten year high for the financial year ending June 30, 2005 vi. Likewise, overseas and inter migration into Western Australia appears to be increasing vii. It is too early to determine if these changes in fertility and migration will be sustained over time, however, should this eventuate then future population projections may present a slightly different picture. Even so, it is likely that the proportion of older Western Australians will be considerably larger 50 years from now. 1
11 Figure 1: Projected Age Distribution Western Australia Males Females % 7% 6% 5% 4% 3% 2% 1% 0% 0% 1% 2% 3% 4% 5% 6% 7% 8% Males Females % 7% 6% 5% 4% 3% 2% 1% 0% 0% 1% 2% 3% 4% 5% 6% 7% 8% Males Females 8% 7% 6% 5% 4% 3% 2% 1% 0% 0% 1% 2% 3% 4% 5% 6% 7% 8% Description: Projected age distribution Western Australia. Source: Australian Bureau of Statistics (2005) Population Projections Australia. Catalogue Number According to the Australian Bureau of Statistics the average age at retirement for recent retirees (those who retired in the last five years) is 60 years, with very little variation between the sexes viii. Therefore, if current retirement trends continue to 2051, a much larger proportion of the population will not be actively participating in the labour market than exists today. 2
12 According to a recent report by the Australian Productivity Commission iii, in comparison to the rest of Australia, Western Australia will experience more than its fair share of the population ageing affect. As shown in Figure 2, Western Australia as a State will have the third highest concentration of the old by only exceeded by South Australia and Tasmania. Figure 2: Ageing Affects all Australian States and Territories: Increase in aged share (percentage points) NT NSW VIC Australia ACT QLD WA SA TAS Description: Change in aged share from to Source: Australian Productivity Commission (2005) : Economic Implications of an Ageing Australia. Australian Government. March 24, 2005 (p.xv) 1.2 Future Challenge for the State Public Sector The challenges facing the Western Australian State public sector (WAPS) over the next 20 years will be considerable, such as planning for, and servicing a larger, as well as older, community. Although significant growth is not anticipated for youth related segments of the public sector such as education, as the population increases these services are unlikely to reduce in size. By contrast, the demand for health and age related care provided by the public sector will progressively increase with every passing decade ix. Another feature of population ageing that will directly influence the public sector s capacity to adapt and change over time is workforce ageing. As the total labour force ages, it is anticipated that labour participation rates 1,x will decline resulting in a contraction in the supply of labour. Indeed, according to the Australian Productivity Commission iii report, the State of Western Australia will have the third greatest decline in participation rates across the Nation (see Figure 3). In Figure 3 the projected change in participation rates for Australia as a whole is shaded in black. 1 The labour force participation rate is defined as the labour force (persons employed or unemployed) expressed as a percentage of the population. 3
13 Figure 3: Change in Participation Rates 2003 to 2045 Change in participation rates (% points) NT NSW ACT AUST QLD VIC WA SA TAS Description: Change in aggregate participation rates from to Source: Australian Productivity Commission: Economic Implications Of An Ageing Australia. March 24, 2005 (p.xv) 1.3 Workforce Ageing in the Western Australian Public Sector The ageing of the WAPS has been monitored over many years. Figure 4 shows a continual increase in the proportion of employees 45 years or older since In fact, the number of employees 55 years or older and therefore eligible to access Government superannuation has grown to almost 20% of the total full-time permanent workforce in Figure 4: Western Australian Public Sector by Age to % 90% 80% 70% 60% 50% 40% 30% 20% 10% 0% < Description: The number of full time permanent employees in each age group as a proportion of all full-time permanent employees over the period 1988 to Source: Public Service Staff Census ; Human Resource Minimum Obligatory Information Requirements

14 In 2006 the youngest of the so called baby boomers (born between 1946 to 1965 xi ) turned 41 years of age, whilst the oldest celebrated their sixtieth birthday. The domination of this cohort in the WAPS is evident in Figure 5. The shaded section on the graph shows the number of baby boomers employed in the WAPS. Figure 5: Western Australian Public Sector Age Profile 2005 No. of Employees Age Description: The number of full time permanent employees by individual age year. Source: Human Resource Minimum Obligatory Information Requirements; June 2005 Over the next 5 to 10 years a sizable number of this cohort will either have turned, or be turning, 55 years of age. It is at this age when State Government superannuation becomes accessible and it is likely that these employees will be considering their options with regard to their future working careers: Do they remain working? Do they want to work in the same manner and role? Do they want to keep working for the Government? or Do they want to try something different? The research presented in this paper was designed to specifically ask older public sector employees these and other important questions related to work and retirement. The information provided through this study will contribute to the understanding of mature 2 employees preferences and requirements, and ultimately enable better planning that takes into account the ageing of the public sector workforce. 2 The term mature used throughout this document refers to employees 45 years older. 5
15 1.3.1 Need for Research and Planning Over recent years the Western Australian Department of the Premier and Cabinet (DPC) has undertaken a number of research studies into the impact of population and workforce ageing on the State Government workforce. In 2003 for instance, DPC commissioned a joint research project with the Centre for Labour Market Research into the impact of population ageing on the Western Australian public sector workforce ix. This study broadly looked at the anticipated demand for public sector services from 2002 to 2022 and the projected size of the public sector workforce required to service the community over this period. One of the key findings from this research was the important role older employees will be required to play if continuity of service is to be maintained across the public sector. The significant contribution made by older public sector employees was also investigated in another study undertaken by DPC in 2000 into the retirement intentions of employees aged 45 years or older. This research provided the first insight into the work and retirement aspirations of mature 2 public sector employees. Similar studies have since been undertaken xii, xiii. in a number of other public sector jurisdictions throughout Australia The 2006 Retirement Intentions Survey In order to build on the previous research and reassess the intentions of mature 2 public sector employees, a second survey was commissioned by DPC in Independent consultant Data Analysis Australia was engaged to work with DPC and conduct this research. The remainder of this report will present the findings from the 2006 Retirement Intentions survey. The results are broadly discussed in terms of: 1. the Effect of an Ageing Workforce on the State public sector; 2. the Retirement Influences and Aspirations of employees; and 3. Financial Planning for Retirement due to the significant influence financial security has on the decision to retire. The 2006 retirement intentions survey predominately provides quantitative information and majority of the findings in this report are presented in the form of numbers and statistics. One of the final questions in the survey, however, asked the following: Are there any other comments or issues you would like to make about retirement from the WA State Public Sector? This open ended question enabled employees to provide a written response to the survey. In total 3,500 written comments were received. This qualitative information provides depth and meaning to a range of issues canvassed in the survey and presented in this report. A selection of relevant comments have been used to illustrate various points throughout the report. 6
16 The key findings for each of these sections are summarised at the beginning of each chapter. A comprehensive description of the survey methodology for the 2006 Retirement Intentions survey is presented in Appendix A to this report. This includes a detailed discussion of the demographic distribution of the respondents across the WAPS. Prior to presenting the overall findings from the research, however, it is useful to note a number of specific details concerning the 2006 survey. Key Survey Details 1. The 2006 survey was based upon the 2000 Retirement Intentions survey instrument. After extensive consultation with key stakeholders a number of additional questions were added to the survey to capture employees attitudes to retirement in greater detail. The 2006 survey form is presented in Appendix B. 2. The Retirement Intentions survey was conducted from March to May The survey was distributed to approximately 54,000 public sector employees aged 45 years or older. 4. A total of 43 public sector agencies participated in this research. Combined these agencies employ over 95% of all public sector employees aged 45 years or older in the State Government workforce. 5. The survey was administered via e-survey (approximately 22,000) and paper survey (approximately 32,000). 6. The total number of usable responses (after data cleaning) was 18,373. This provided an overall response rate of 33%. 7. Thirty three of the 43 agencies involved in the research had a final response rate of 25% or greater. 8. The response rate for most questions was greater than 97%. Questions with a response rate of 97% or less are given in Appendix A Analysis of respondents demographic profile suggests a reasonable representation of the entire public sector workforce aged 45 years or older was achieved. Areas or agencies where a misrepresentation occurred are given in Appendix A The analysis presented in this report focuses on permanent public sector employees, those on long fixed term contacts of two years or more and members of the Senior Executive Service. 11. Due to the interdependence of the responses to many of the questions and the demographic profile of the respondents, responses to questions cannot be viewed without considering the demographic make up of those that responded. Throughout this report cautionary notes regarding the interpretation of survey responses are given, however, the reader is directed to Appendices A.2 and A.3 for a detailed demographic profile of respondents. 7
17 2 Effects of an Ageing Workforce In this first chapter of the report, the effects of an ageing public sector workforce are examined. The discussion provides an indication of not only the timing of future retirements, but also the impact on corporate knowledge across the sector as experienced staff leave employment. The results from the 2006 Retirement Intentions survey are compared to other research undertaken across Australia. In addition, the actual retirement behaviour of employees since the 2000 survey is investigated. Key Findings 1. The survey indicated that 64% of respondents intend to retire from the public sector within the next 10 years, with 32% intending to leave in less than five years. 2. The most popular intended age range for retirement is between 60 to 64 years of age (32%). 3. Gender and salary has little effect on the intended timing of retirement. 4. There are some differences in the timing of retirement across occupations. In particular, protective service workers indicate they intend to retire younger when compared with other professions. 5. Seventy one percent of respondents intending to retire in less than 10 years have 15 years or more experience working in the WAPS. 6. The most affected professions are protective services, natural and physical sciences and management. More than 80% of these respondents intending to retire in the next 10 years have more than 15 years experience. 7. The agencies with 80% or more respondents intending to retire within 10 years with 15 years or more experience include Western Australian Police (89%); Department of Treasury and Finance (89%); Main Roads (87%), Conservation and Land Management 3 (85%); Department of Land Information 4 (82%); Department of Agriculture and Food (80%) and Fire and Emergency Services Authority (80%). 8. The 2006 WA public sector survey showed very similar results to the 2005 NSW public sector (NSWPS) research in terms of years until retirement. The NSWPS survey was of a similar size and scope to the 2006 WAPS study. 9. The intended timing of retirement from the public sector reported in the 2000 Retirement Intentions survey is similar to the actual separation rates for public sector employees (55 years and older) between 2001 and Since the survey was completed CALM and components of the Enviornment Group have amalgamated to form the Department of Environment and Conservation (1/7/2006). The Department of Land Information has been retitled to Western Australian Land Information Authority. 8
18 2.1 Timing of Retirement With 45% of full time permanent employees 45 years or older ii, the WAPS is faced with a situation where the majority of these employees will be retiring within the next 15 years. In fact, of the survey respondents that indicated when they intend to retire from the public sector, 86% intend to retire within the next 15 years, with 64% intending to retire in less than 10 years and 32% in less than five years. A further 1,577 respondents (9%) stated they are unsure when they will retire and 350 respondents (2%) chose not to answer the question. Figure 6: Intended Years to Retirement from the WAPS No. of Respondents % 32.2% 63.7% 86.4% 96.9% 99.8% 100.0% 100% 80% 60% 40% 20% % of Respondents 0 > 1year % Respondents 594 4,268 4,747 3,439 1, Cumulative % 3.9% 32.2% 63.7% 86.4% 96.9% 99.8% 100.0% Years Until Retirement Description: Number and cumulative percentage of respondents on permanent or fixed term contracts of two years or more (respondents unsure of the number of years until they plan to retire were excluded). Source: 2006 Retirement Intentions Survey 2.2 Age at Retirement The most popular intended age to retire is between 60 and 64 years of age, with 32% of respondents planning to retire in this age range. Twenty seven percent of respondents intend to retire between 55 and 59 years, while 24% intend to retire when they are 65 years of age or older (see Figure 7). Figure 7: Intended Age of Retirement from the WAPS No. of Respondents Unsure Respondents ,424 5,398 4,029 1,910 % of Respondents 1% 4% 27% 32% 24% 12% Intended Age of Retirement Description: Number and percent of respondents on permanent or fixed term contracts of two years or more by intended age of retirement from the WAPS. Source: 2006 Retirement Intentions Survey 9
19 Most respondents intend to retire from the public sector after the age of 55 years as from this age the vast majority of respondents will become eligible to access their superannuation. In fact, the survey responses indicated that only 5% of respondents plan to retire before they reach 55 years of age (see Figure 7). There is, however, some uncertainty about retirement age, with 12% of respondents unsure at what age they will retire. This is more prevalent in females, where 14% of women state they are unsure at what age they will retire, compared with 7% of men. 2.3 Characteristics of Respondents with Different Retirement Timing Intentions. With such a large proportion intending to retire in the next 15 years, it is important to gain an understanding of who will be leaving the workforce. In this section, the relationship between respondents intentions to retire and their demographic profile will be explored Age and Timing of Retirement It is natural that the intended age of retirement increases with the increasing age of the respondent and this is seen in Figure 8. For example, for those aged 50 to 54 the most common intended age to retire is between 55 and 59 and for those aged 55 to 59 the most common intended age of retirement is between 60 and 64. It is worth noting that the number of respondents who were unsure decreases with age from a high of 16% (792) for the 45 to 49 year age group compared to only 7% (23) of those aged over 65 years. This is not surprising, as not only is it expected that younger respondents are more uncertain about when they plan to retire, older respondents have fewer age group options to choose. Figure 8: Intended Age of Retirement by Current Age 6,000 5,000 4,000 3,000 2,000 1, Age of Retirement Unsure , ,114 1,615 1, ,572 1, Total 4,886 5,437 4,244 1, Current Age of Respondent Description: Number of respondents on permanent or fixed term contracts of two years or more for each age group. Source: 2006 Retirement Intentions Survey 10
20 Although it may appear there is a difference between age groups, great care should be taken when drawing any conclusions based on Figure 8. It would appear that older people intend to retire on average older than younger people. For instance, a respondent aged years can not retire aged years and there will naturally be less choosing to retire in the age group as it is likely that a number of employees who would have been in this category have retired. Another way of looking at current age and the way in which it relates to retirement intentions is to view the responses to the question In how many years do you intend to retire?. The three age groups 45 to 49, 50 to 54, and 55 to 59 make up 90% of the responses (not including unsure responses) and these have been shown in Figure 9. As expected, as the age group increases the expected years until retirement reduces. For instance 7% of those aged between 45 to 49 years intend to retire in one to four years time compared to 43% of those aged 55 to 59 years. Once again, due to the confounding influence of age and timing of retirement, it is not feasible to draw further conclusions from this graph. Figure 9: Intended Years to Retirement by Current Age 100% 80% 60% 40% 20% Years Until Retirement 0% (n=4258) (n=4940) (n=3948) >=15 33% 11% 3% % 29% 13% % 37% 36% 1-4 7% 21% 43% <1 1% 2% 5% Current Age of Respondent Description: Percentage of respondents on permanent or fixed term contracts of two years or more in each age group intending to retire from the WAPS within various time periods. Unsure responses excluded. Source: 2006 Retirement Intentions Survey Gender There is little difference between genders in the intended timing of retirement, as is seen in Table 1 and Table 2. The main difference between the sexes is where they are uncertain at what age they intend to retire. Indeed, 14% of females state they are uncertain at what age they intend to retire compared to 7% of males. Similarly, when asked how many years until they intend to retire, 12% of females are unsure compared to 6% of males. Table 1 shows that a slightly higher proportion of females (5%) plan to retire between the age of 50 and 54 than males (3%), while a slightly higher proportion of males (29%) intend to retire between the age of 55 and 59 than females (25%). Of the male respondents 28% intend to retire over the age of 65 years compared to females of which 22% intend to retire at this age. This represents a difference of just over 6%. 11
21 Table 1: Intended Age of Retirement by Gender Intended Age Of Retirement Female Male Difference n=10,393 n=6, % 1% 0% % 3% 2% % 29% 4% % 32% 1% % 28% 6% Unsure 14% 7% 7% Total 100% 100% Description: Percentage of respondents on permanent or fixed term contracts of two years or more by planned age of retirement from the WAPS and gender. Includes difference between the proportion of each gender by age group. Source: 2006 Retirement Intentions Survey Table 2: Intended Years to Retirement by Gender Intended Years To Retirement Female Male Difference n=10,417 n=6,239 < 1 3% 4% 1% % 28% 4% % 29% 1% % 20% 1% % 10% 1% % 3% 0% 30+ 0% 0% 0% Unsure 12% 6% 6% Total 100% 100% Description: Percentage of respondents on permanent or fixed term contracts of two years or more by intended years to retirement from the WAPS and gender. Includes difference between the proportion of each gender by age group. Source: 2006 Retirement Intentions Survey Table 2, shows there is even less of a difference between genders in the intended years to retirement. For each response the difference is less than 1% except for the proportion intending to retire in one to four years, where 4% more males choose this option. The difference in the responses by gender is very small and is possibly related to the difference in the age distribution of respondents from each of the genders, rather than a real gender bias. In fact, males respondents are on average slightly older than females (see Appendix A.2.2.2). 12
22 2.3.3 Salary It would appear from the findings that salary is not a significant influence on the timing of retirement (see Figure 10). For example, the proportion of respondents with a salary of less than $50,000 who intend to retire in five to nine years is 27%. There are similar proportions for those earning between $50,000 and $70,000 (29%), and for those that earn more than $70,000 (30%). The only discernable difference between the salary levels is that more respondents on lower incomes are uncertain of when they intend to retire compared with those on higher incomes. It is not possible to give a conclusive reason for the difference in uncertainty. Although it may appear this could be linked to financial security, it is just as likely this difference could be due to gender. For instance, on average females earn less than males (refer to Appendix A.2.2.4) and as was found in Section 2.3.2, more females are uncertain about when they will retire than males. Figure 10: Intended Years to Retirement by Salary 50% 40% 30% 20% 10% Years Until Retirement 0% Under $50K $50K-$70K $70K % 28% 32% % 29% 30% % 22% 21% % 13% 11% Unsure 12% 8% 6% Description: Percentage of respondents on permanent or fixed term contracts of two years or more by intended years to retirement and salary group. Source: 2006 Retirement Intentions Survey Planned age of retirement by salary is given in Figure 11. It could be expected that higher salary earners are more likely to invest more money in their retirement schemes compared to lower salary earners allowing them to retire earlier. However, the survey results show a strong similarity between salary groups, which is even more apparent when the unsure group has been excluded. Figure 11 reveals that the intended age of retirement for those earning less than $50,000 and between $50,000 and $70,000 are almost identical. Those earning more than $70,000 have a slightly higher proportion intending to retire between the ages of 55 and 64 years. Although salary has little impact on when respondents intend to retire, this is not the case in matters relating to superannuation. In fact the survey results show that salary has a strong positive relationship with adequate superannuation and retirement, which is discussed in section
23 Figure 11: Intended Age of Retirement by Salary Percentage of Salary Group 100% 80% 60% 40% 20% 0% Under $50K $50K-$70K $70K+ Salary Description: Percentage of respondents on permanent or fixed term contracts of two years or more planned age of retirement and salary group. Unsure responses excluded. Source: 2006 Retirement Intentions Survey Occupational Differences Differences were identified in the intended age of retirement across occupational groups (Figure 12). For example, more respondents in protective services intend to retire between the age of 55 and 59 (45%) than other occupations. However, respondents from the protective services tend to be younger than those from other occupations (see Appendix A.2.2.3) and as already seen, intended age of retirement increases with the age of the respondent. It is also apparent in Figure 12, that more respondents from the community and social service professions (35%) intend to delay retirement until they are 65 years or older. Figure 12: Intended Age of Retirement by Occupation 100% 90% 80% 70% Age Until Retirement 60% 50% 40% 30% 20% 10% 0% Protective Natural and Community Education Admin and Service Management Physical and Social and Tafe Clerical Workers Science Services Health All Other Unsure 6% 9% 11% 12% 10% 12% 12% 17% % 20% 19% 28% 25% 35% 26% 36% % 36% 33% 30% 39% 27% 35% 26% % 31% 30% 25% 24% 21% 21% 17% < 55 3% 4% 7% 5% 2% 5% 6% 4% Description: Proportion of respondents on permanent or fixed term contracts of two years or more in each occupational category by preferred age of retirement. Source: 2006 Retirement Intentions Survey 14
24 Figure 13: Intended Years to Retirement by Occupation Years Until Retirement 100% 90% 80% 70% 60% 50% 40% 30% 20% 10% 0% Protective Service Workers Management Education and Tafe Admin and Clerical Natural and Physical Science Community and Social Services Health All Other Unsure 4% 7% 10% 10% 9% 8% 9% 13% >=15 14% 11% 10% 13% 11% 13% 15% 12% % 22% 20% 21% 21% 23% 20% 20% % 30% 28% 29% 26% 31% 27% 27% % 27% 28% 24% 29% 22% 25% 24% <1 4% 3% 4% 3% 4% 3% 4% 4% Description: Proportion of respondents on permanent or fixed term contracts of two years or more in each occupational category by intended years to retirement. Source: 2006 Retirement Intentions Survey Intended years to retirement by occupation shown in Figure 13, gives a slightly different perspective of when respondents intend to retire compared to Figure 12. Firstly, less respondents working in protective services reported that they are unsure about when they are intending to retire than other professions. The findings also suggest that while employees from protective services plan to retire younger, when compared to other professions there does not appear to be much difference in terms of years until retirement. This is related to the fact that respondents from the protective service are on average younger than those from other professions (see Appendix A.2.2.3). The opposite is seen in the natural and physical sciences where a third of the respondents intend to retire within the next four years. This still equates to the high proportion of natural and physical scientists (39%) intending to retire between the ages of 60 and 64 years (see Figure 13). This is largely due to the age of the respondents from the natural and physical sciences as a reasonably large proportion of these respondents (43%) are over the age of 55 years (see Appendix A.2.2.3). In Table 3 and Table 4 a more detailed summary of occupation is presented. Table 3 shows the intended age of retirement and Table 4 shows the intended years until retirement of respondents for a number of key occupations in the public sector including the Senior Executive Service. 15
25 Table 3: Intended Age of Retirement Occupations Primary Secondary Intended Age of Retirement Occupations Occupations No. of Respondents Unsure Total Administration Accounting and Finance % 31% 33% 9% 100% Administrative Professionals % 33% 24% 10% 100% Clerical 1,160 30% 29% 27% 14% 100% Human Resources % 25% 20% 15% 100% Information and Communication Technology % 29% 31% 13% 100% Inspection and Investigation % 29% 29% 9% 100% Legal % 25% 32% 16% 100% Reception and Admissions % 29% 31% 18% 100% Retail and Property 62 39% % % Secretaries and Personal Assistants % 35% 32% 11% 100% Community Community and Social Welfare % 25% 37% 11% 100% Hospitality % 33% 26% 16% 100% Education Education Aides % 30% 18% 18% 100% Education Support % 32% 23% 13% 100% Primary Teaching 1,716 39% 35% 16% 10% 100% Secondary Teaching 1,113 41% 32% 19% 8% 100% Tertiary Education % 24% 39% 14% 100% Health Dental % 28% 24% 14% 100% Enrolled Nursing % 34% 29% 13% 100% Health Therapy and Diagnostic % 37% 25% 12% 100% Medical Practice % 38% 41% 7% 100% Registered Nursing 1,376 30% 35% 23% 12% 100% Management Education Management % 40% 15% 8% 100% Health Management % 37% 19% 14% 100% Management 1,116 35% 32% 24% 9% 100% Sciences Building and Engineering % 37% 25% 9% 100% Natural and Physical Science % 40% 26% 10% 100% Protective Services Emergency Services 23 74% % Police, Prisons and Security % 28% 19% 6% 100% All Other Arts and Media % 28% % Garden, Farm and Forestry % 22% 49% 13% 100% Technical and Trade % 21% 41% 15% 100% Transport Unknown % 28% 23% 18% 100% Cleaners and Laundry Workers % 30% 32% 19% 100% Senior Executive Service % 35% 18% 9% 100% Total 16,107 32% 32% 24% 12% 100% Description: Proportion of respondents on permanent or fixed term contracts of two years or more in a secondary occupational category by intended age of retirement. Source: 2006 Retirement Intentions Survey 5 For privacy reasons some statistics have not been provided. 16
26 Table 4: Intended Years to Retirement by Primary and Secondary Occupations Retirement Intentions 2006 Primary Secondary Intended Years to Retirement Occupations Occupations No. of Respondents < Unsure Total Administration Accounting and Finance % 30% 25% 16% 6% 100% Administrative Professionals % 28% 21% 13% 9% 100% Clerical 1,158 27% 30% 20% 12% 11% 100% Human Resources % 29% 23% 14% 12% 100% Information and Communication Technology % 30% 19% 17% 12% 100% Inspection and Investigation % 34% 16% 15% 6% 100% Legal % 25% 25% 11% 12% 100% Reception and Admissions % 28% 24% 17% 12% 100% Retail and Property 62 37% 32% 15% 15% 1% 100% Secretaries and Personal Assistants % 24% 20% 14% 12% 100% Community Community and Social Welfare % 29% 24% 15% 8% 100% Hospitality % 39% 20% 7% 9% 100% Education Education Aides % 28% 20% 13% 15% 100% Education Support % 29% 17% 9% 11% 100% Primary Teaching 1,721 31% 29% 22% 9% 9% 100% Secondary Teaching 1,120 38% 27% 18% 9% 8% 100% Tertiary Education % 28% 22% 10% 12% 100% Health Dental % 24% 20% 19% 13% 100% Enrolled Nursing % 26% 22% 16% 9% 100% Health Therapy and Diagnostic % 27% 18% 15% 11% 100% Medical Practice % 29% 18% 18% 5% 100% Registered Nursing 1,381 29% 27% 22% 13% 9% 100% Management Education Management % 33% 22% 7% 6% 100% Health Management % 23% 22% 14% 12% 100% Management 1,119 28% 28% 22% 14% 8% 100% Science Building and Engineering % 27% 20% 10% 8% 100% Natural and Physical Science % 27% 21% 11% 11% 100% Protective Services Emergency Services Police, Prisons and Security % 32% 22% 15% 3% 100% All Other Arts and Media % 33% % Garden, Farm and Forestry % 20% 18% 13% 13% 100% Technical and Trade % 37% 14% 16% 6% 100% Transport Unknown % 27% 21% 9% 16% 100% Cleaners and Laundry Workers % 28% 21% 10% 15% 100% Senior Executive Service % 34% 20% 7% 6% 100% Total 15,868 29% 29% 21% 12% 9% 100% Description: Proportion of respondents on permanent or fixed term contracts of two years or more in a secondary occupational category by time until retirement. Source: 2006 Retirement Intentions Survey 6 For privacy reasons some statistics have not been provided. 17
27 2.4 Loss of Experience With 64% of respondents intending to retire in the next 10 years (see Figure 6) - all of whom are 45 years or older- it is anticipated that the WAPS will be losing many experienced staff. As shown in Table 5, the majority (63%) of respondents in the survey indicated they had 15 years or more experience in the WAPS. Indeed, 71% of the respondents intending to retire in less than 10 years have 15 years or more experience working in the WAPS. Table 5: Intended Years to Retirement by Experience in the WAPS Intended Years to Retirement Experience <10 years 10+ years Unsure Total <1 year 86 (1%) 111 (2%) 31 (2%) 228 (2%) 1-4 years 579 (6%) 696 (13%) 168 (11%) 1443 (9%) 5-14 years 2,014 (22%) 1,691 (32%) 515 (34%) 4220 (26%) 15+ years 6,548 (71%) 2,760 (53%) 808 (53%) 10,116 (63%) Unsure 13 (<0.5%) 7 (<0.5%) 8 (<0.5%) 28 (<0.5%) Total 9,240 (100%) 5,265 (100%) 1,530 (100%) 16,035 (100%) Description: Number of respondents on permanent or fixed term contracts of two years or more by intended years to retirement and length of experience in years. The percentage represent the percentage of respondents who intend to retire in each time class with that experience level. Source: 2006 Retirement Intentions Survey As 71% of respondents who are intending to retire in less than 10 years have 15 or more years experience, it is important to understand where this skill base will be lost to better plan for the impact of retirement on the State public sector. Figure 14 provides a breakdown of qualifications by occupation for experienced employees who intend to retire in the next 10 years. Protective service workers, natural and physical sciences as well as management will be most affected with in excess of 80% of the respondents that intend to retire in the next 10 years, having more than 15 years of WAPS experience. Given the current labour shortage, recruitment to replace retirees will be more difficult, especially for employees with specialised qualifications and experience. Currently, the majority of employees in health, education, management and the natural and physical sciences have university qualifications. Similarly, other professions have large numbers of employees with trade certificates (Figure 14). The lead time to train and develop qualified and experienced professionals to replace those retiring can in many cases take several years. 18
28 Figure 14: Loss of Experienced Employees in the Next 10 Years by Qualifications and Occupation Protective Service Workers Natural and Physical Science Management Education and TAFE Health Administration Professionals and Clerical Community and Social Services All Other 0% 10% 20% 30% 40% 50% 60% 70% 80% 90% Trade certificate or TAFE University Other Description: The percentage of employees who intend to retire in the next 10 years with more than 15 years experience by occupational group and qualification. Source: 2006 Retirement Intentions Survey Some regions will feel the loss of experience over the next 10 years to a greater degree than others (see Table 6). The South West region for instance, has the highest percentage of employees (75%) intending to retire in the next 10 years with 15 or more years of experience. This is closely followed by Metropolitan (72%), Peel (71%), Great Southern (69%) and, Wheatbelt (66%) regions. The more northern and inland regions will feel a lesser impact with approximately 10% less of their employees retiring in the next 10 years having more than 15 years WAPS experience. Table 6: Loss of Experience within 10 Years by Region Region Total No. of Respondents Retiring In The Next 10 Years Percentage With 15 Years Or More Experience South West 1, % Metropolitan 12,258 6,646 72% Peel % Great Southern % Wheatbelt % Mid West % Gascoyne % Goldfields-Esperance % Kimberley % Pilbara % Total 16,518 9,093 55% Description: The number of respondents in each region on permanent or fixed term contracts of two years or more who are planning to retire in the next 10 years, and the percentage of these who have 15 years experience or more. Source: 2006 Retirement Intentions Survey 19
29 Table 7 presents the occupational areas where the loss of experienced staff in the southern region will be felt most. The occupations most affected will be education and TAFE, management positions, natural and physical sciences and protective service workers. Table 7: Occupation Loss of Experience within 10 Years by Southern Regions 7 and Occupation Metropolitan Wheatbelt Peel South West Great Southern <10 years 15+ exp <10 years 15+ exp <10 years 15+ exp <10 years 15+ exp <10 years Admin and Clerical 1,761 66% 67 58% 40 68% % 64 64% Community and Social Services % 20 50% % 13 31% Education and TAFE 1,850 78% % % % % Health 1,201 67% 63 67% 26 62% % 55 53% Management 1,066 83% 51 88% 33 91% 74 89% 48 90% Natural and Physical Science % 16 75% % 17 94% Protective Service Workers % % 19 74% All Other % 37 30% 22 45% 57 47% 27 48% Description: The number of respondents in the southern region on permanent or fixed term contracts of two years or more who are planning to retire in the next 10 years, and the percentage of these who have 15 years experience or more by occupation. Source: 2006 Retirement Intentions Survey Table 8 and Table 9 presents the number of employees intending to retire in the next 10 years and the corresponding proportion who have 15 or more years of experience for all agencies involved in the 2006 survey. The mean age for all permanent employees (not just those 45 years or older) for each agency is also provided in the tables. Of the 25 agencies that have more than 300 employees aged 45 years or older, the following have 80% or more respondents with 15 years or more WAPS experience who intend to retire within 10 years: WA Police Service (89%); Department of Treasury and Finance (89%), Main Roads WA (87%); Department of Conservation and Land Management (85%); Department of Land Information (82%); Department of Agriculture and Food (80%); and The Fire and Emergency Services Authority (80%) 9. The Department of Education and Training has almost 4,000 respondents intending to retire in the next 10 years. Seventy-six percent of these have 15 or more years of experience. The Department of Health also has a significant number of respondents intending to retire in the next 10 years (around 2,600), with 63% of these having over 15 years or more experience in the WAPS. 15+ exp For privacy reasons results have not been reported for the northern regions. For privacy reasons some statistics have not been provided. It should be noted that the overall response rate for the Fire and Emergency Services Authority was 14% (n=511) and protective service workers who make up 63% of this workforce were underrepresented in their responses. 20
30 Table 8: Loss of Experience within 10 Years by Large Public Sector Agencies 10 Agency (No. Respondents 11) Percentage retiring in Retiring in Next next 10 years with 10 Years 15 or More Years Experience Mean age ALL permanent employees 12 Western Australian Police Service (316) % 39 Treasury and Finance, Dept of (180) 97 89% 41 Main Roads Western Australia (263) % 44 Conservation & Land Management, Dept of (297) % 44 Land Information, Dept of (168) % 44 Agriculture and Food, Dept of (373) % 46 Fire & Emergency Services Authority (75) 45 80% 43 Education & Training, Dept of (6,771) 3,970 76% 46 Culture & the Arts, Dept of (152) 86 76% 46 Premier & Cabinet, Dept of the (193) % 45 Industry & Resources, Dept of (178) % 45 Housing & Works, Dept of (242) % 44 Community Development, Dept for (238) % 46 Swan TAFE (104) 69 67% 50 Central TAFE (170) 97 66% 48 West Coast TAFE (81) 47 66% 50 Attorney General, Dept of the (243) % 43 Corrective Services, Dept of (552) % 46 Planning and Infrastructure, Dept for (237) % 44 Health, Dept of (4,779) 2,592 63% 44 Environment, Dept of (160) 83 61% 40 Disability Services Commission (281) % 47 Consumer & Employ Protection, Dept of (221) % 44 Challenger TAFE (105) 62 58% 51 South West Regional TAFE (50) 29 52% 47 Total 9,291 71% Description: The number of respondents in each agency on permanent or fixed term contracts of two years or more who are planning to retire in the next 10 years, and the percentage of these who have 15 years experience or more. Source: 2006 Retirement Intentions Survey; Human Resource Minimum Obligatory Information Requirements; June 2006 For the remaining medium to small sized public sector agencies 13, the percentage of respondents retiring in the next 10 years with 15 years or more experience is slightly less. Those agencies with the greatest proportion of experienced staff leaving in the next decade are: Forest Products Commission (79%); Department of Fisheries (73%); Lotteries Commission (71%); and Curriculum Council of Western Australia (71%) Agencies with 300 or more employees 45 years or older. The total number of respondents for each agency including both SES and Non-SES respondents. This column provides the mean age for ALL permanent employees working in the agency as at June Public sector agencies with less than 300 employees who were aged 45 years or older.ccg 21
31 Table 9: Loss of Experience within 10 Years by Medium to Small Public Sector Agencies 14 Agency (No. Respondents 15) Retiring in Next 10 Years Percentage retiring in next 10 years with 15 or More Years Experience Mean age ALL permanent employees 16 Forest Products Commission (30) 14 79% 43 Fisheries, Dept of (46) 30 73% 42 Lotteries Commission (31) 17 71% 46 Curriculum Council of Western Australia (29) 17 71% 49 Legal Aid Western Australia (33) 17 65% 42 Western Australian Tourism Commission (27) 14 64% 41 Great Southern TAFE (36) 21 62% 47 Local Govt and Regional Dev, Dept of (24) 14 57% 48 Government Employees Super Board (55) 31 52% 43 Western Australian Sports Centre Trust (13) X 17 X% Country High School Hostels Authority (19) X 17 X% Sport & Recreation, Dept of (36) 20 50% 42 Indigenous Affairs, Dept of (36) 17 41% 44 Pilbara TAFE (43) 23 35% 46 Racing and Wagering Western Australia (36) 16 31% 42 Kimberley TAFE (23) X 17 X% Central West TAFE (45) 22 27% 48 C Y O'Connor College of TAFE (18) 11 0% 45 Total % Description: The number of respondents in each agency on permanent or fixed term contracts of two years or more who are planning to retire in the next 10 years, and the percentage of these who have 15 years experience or more. Source: 2006 Retirement Intentions Survey; Human Resource Minimum Obligatory Information Requirements; June Comparison with other Retirement Intentions Surveys Western Australian Public Sector Retirement Intentions Survey 2000 Table 10 shows that around 52% of respondents in the 2000 survey suggested they would retire within 10 years of the survey period. By comparison, 64% of respondents plan to retire within the next 10 years according to the 2006 Retirement Intention survey. This finding is consistent with the fact that the baby boom cohort in the public sector has aged six years since the previous survey. Therefore, it would be expected that proportionately more 2006 respondents would be planning to leave the public sector over the next decade Agencies with less than 300 employees over the age of 45 years. The total number of respondents for each agency including both SES and Non-SES respondents. This column provides the mean age for ALL permanent employees working in the agency as at June For privacy reasons some statistics have been replaced by an X. 22
32 On the other hand, according to the 2000 survey responses more employees were planning to retire before the age of 60 than the 2006 results suggest (shown in Table 11). This demonstrates a natural confounding effect found between age and retirement timing. In the 2000 survey, respondents were younger on average than those responding to the 2006 survey. For instance, 74% of respondents were under the age of 55 in the 2000 survey, compared to just 61% of respondents in As seen in Section 2.3, age has a significant effect on retirement intentions with younger respondents generally intending to retire earlier. Table 10: Intended Years to Retirement: Other Survey Results Yrs To Retirement <2 <= 5yrs <= 10yrs <= 15yrs <=20yrs ACTPS 2002 Cumulative % 13% 48% 81% 94% 99% Yrs To Retirement < 2 <5 yrs <10 yrs <15 yrs <20 yrs NSWPS 2005 Cumulative % 9% 31% 65% 87% 97% WAPS 2000 WAPS 2006 Yrs To Retirement < 2 <5 yrs <10 yrs <15 yrs <20 yrs Cumulative % 5% 20% 52% 82% 95% Yrs To Retirement < 1 <5 yrs <10 yrs <15 yrs <20 yrs Cumulative % 4% 32% 64% 86% 97% Description: Cumulative percentage of intended years to retirement comparing the Retirement Intentions survey results to other surveys held in Australia. Sources: 2002 Retirement Intentions Survey for the ACTPS, 2005 Retirement Intentions Survey, NSWPS, 2000 Retirement Intentions Survey, WAPS & 2006 Retirement Intentions Survey, WAPS Table 11: Intended Age of Retirement: Other Survey Results Years To Retirement < Unsure ACTPS % 31% 24% 13% 11% NSWPS % 33% 33% 21% 9% WAPS % 41% 32% 15% 6% WAPS % 27% 32% 24% 12% Description: Percentage of intended age of retirement comparing the Retirement Intentions survey results to other surveys held in Australia. Sources: 2002 Retirement Intentions Survey for the ACTPS, 2005 Retirement Intentions Survey, NSWPS, 2000 Retirement Intentions Survey, WAPS & 2006 Retirement Intentions Survey, WAPS Interstate Retirement Intention Surveys The Australian Capital Territory public service (ACTPS) xii and New South Wales public sector (NSWPS) xiii have also conducted similar retirement intention surveys in 2002 and 2005 respectively. The Victorian Equal Opportunity Commission also undertook a similar survey in 2003, however, their findings are not presented in this section as they only canvassed employees in the Victorian Public Service 55 years or older. 23
33 In comparison to the WAPS 2006 Retirement Intentions survey survey, the 2005 NSWPS research showed very similar results while the findings of the ACTPS survey showed some variation (Table 10 and Table 11). In general, it appears that respondents intend to retire younger in the ACT than in NSW and WA. In fact, 21% of respondents in the ACT intend to retire before they reached 55 years of age compared to around 4%-6% in the other surveys. The respondents to both NSWPS and the ACTPS surveys were on average younger than those responding to the 2006 Retirement Intentions WAPS survey. In this instance, the younger age of the cohorts does not appear to explain why ACTPS respondents expected to leave at a younger age. There are also other differences in the surveys that should be considered. Where the NSW and WA surveys were conducted relatively recently in 2005/06, the ACT survey was undertaken in In addition, the ACT survey also used slightly different year ranges (0-5 years rather than 0-4 years). These factors may have had an effect on the survey findings Australian Bureau of Statistics The Australian Bureau of Statistics (ABS) viii produces a table of Retirement and Retirement Intentions, which is compiled from data collected in the Multi-Purpose Household Survey xiv. The latest data was based on the 2004/2005 survey of persons in the labour force aged 45 years and over who have, at some time, worked for two weeks or more. The ABS data is based on the total labour force, not just the public sector and therefore it is more meaningful to compare this data with respondents intended time of retirement from paid employment rather than their retirement from the WAPS. Figure 15 compares data from the WA 2006 Retirement Intentions survey regarding respondents intended age of retirement from the WAPS, and from paid employment in general, with the results from the ABS survey. It is apparent that the intended retirement from paid employment for the WAPS survey respondents closely mirrors the responses from the ABS survey for the entire Australian workforce for all but the 45 to 49 year old age group. For this age group it seems that the respondents to the WA public sector survey intend to retire earlier than those from the Australia wide survey. On the other hand there is a time lag between when respondents intend to retire from the WAPS and when they intend to retire from paid employment. Similarly, there appears to be a lag between when respondents intend to retire from the WAPS and when the general Australian workforce plans to retire. This difference between when respondents intend to leave the WAPS compared to paid employment is discussed in more detail in Section
34 Figure 15: Intended Age of Retirement: WA Public Sector and Australia Wide 100% 80% 60% 40% 20% 0% Current Age: 45 to Age of Retirement 100% 80% 60% 40% 20% 0% Current Age: 50 to Age of Retirement 100% 80% Current Age: 55 to % 80% Current Age: 60 to 64 60% 60% 40% 40% 20% 20% 0% % Age of Retirement Age of Retirement WAPS PE ABS Intended Age of Retirement Current Age Total WAPS % 39% 27% 19% 100% % 41% 34% 20% 100% % 50% 28% 100% % 54% 100% % 100% PE % 29% 32% 31% 100% % 27% 37% 34% 100% % 42% 45% 100% % 69% 100% % 100% ABS % 27% 26% 41% 100% % 29% 34% 36% 100% % 40% 52% 100% % 70% 100% % 100% Description: Percentage of respondents on permanent or fixed term contracts of two years or more by intended age of retirement by age group from the WAPS and Paid Employment. Compared to the intended age of retirement of the Australian labour force, who at some time have worked for a period of two weeks or more. Source: 2006 Retirement Intentions Survey & Australian Bureau of Statistics, ( ) Multi-Purpose Household Survey. Catalogue Number WAPS Western Australian State Public Sector PE Paid Employment ABS Australian Bureau of Statistics viii 25
35 2.6 Actual Retirement 2001 to 2005 More than 5 years have passed since the 2000 Retirement Intentions survey was undertaken and therefore it is now possible to compare the intended retirements of respondents with the actual behaviour observed in the workforce. Prior to presenting this analysis it is important to note that the 2000 survey was based on a sample of 2,416 employees selected from a cross-section of the workforce. Although it was expected that the responses from this research would give an indication of intended timing of retirement, the sample was not a precise representation of the workforce 45 years or older (see Appendix A.2.1). For instance, the responses to the 2000 survey had an overrepresentation of male respondents, respondents on higher salaries and respondents working in management. Where possible in this report, however, an attempt has been made to match the cohorts. For instance, the separation 21 data for 2001 to 2005 relate specifically to the permanent employees 22. The actual separation information has also been calculated using data from agencies with more than 300 employees 45 years or older. This subset of agencies was selected to match the agencies surveyed in Retirement Timing According to the data presented in Table 12, 7,026 permanent employees aged 55 years or older 23 have left the public sector over the period 2001 to Table 12: Separations of Permanent Employees 55 Years or Older from selected Agencies Total Separations 55 yrs+ 1,328 1,385 1,243 1,503 1,567 7,026 Description: Number of permanent employees 55 years or older leaving the State public sector from 2001 to 2005 (selected Agencies only). Source: Human Resource Minimum Obligatory Information Requirements 1 July to 30 June each year from 2001 to The survey undertaken in 2000 found approximately 22% of respondents on permanent or long term contracts intended to leave the public sector after the age of 55 years and during the five year period between 2001 and Extrapolating this finding to the total permanent workforce 45 years or older as reported in the 2000 report (33,350), it would be anticipated that the number of employees who would have retired during this five year period would be somewhere in the region of 7, This estimate is surprisingly similar to the actual number (7,026) of permanent employees 55 years or older 25 who have separated from the public sector over the period 2001 to Separations include employees who resigned, retired or took voluntary redundancy from the public sector. It is not possible to identify employees on long fixed term contracts. However, as the vast majority of the survey cohort is made up of permanent employees (approx. 30,000), the exclusion of this subset does not greatly affect the findings. In normal circumstances only employees 55 years or older are eligible to retire and subsequently receive superannuation payments. Calculated as 22% of current permanent employees 45 years or older as reported in the 2000 survey (approx 33,350). Only employees 55 years or older are eligible to retire and subsequently receive superannuation payments. 26
36 2.6.2 Retirement Age Consistency was also found between the intended age of retirement as reported in the 2000 Retirement Intentions survey and the actual age of separations from the WAPS during the period 2001 to More specifically, comparisons were made for employees who planned to leave the public sector after they reached 55 years of age and during the five year period from According to the 2000 Retirement Intentions survey, around 56% of respondents who planned to leave the public sector before 2005 having reached 55 years of age, anticipated retiring between 55 and 60. This compares to approximately 53% of employees between the age of 55 and 60 who actually separated from the sector from 2001 to Similarly, 91% of the 2000 survey respondents who planned to leave the public sector before 2005, having reached 55 years of age, anticipated retiring between 55 and 65. Around 87% of employees between the age of 55 and 65 actually separated from the sector over this five year period. While some caution should be applied to the interpretation of Sections and 2.6.2, the findings do suggest that the intentions, as elicited from the 2000 survey, in terms of retirement age and timing, were similar to the separation behaviour demonstrated by permanent employees 55 years or older from 2001 to Given that the 2006 Retirement Intentions survey was distributed to a much larger sample and the demographic profile of respondents is more representative of employees 45 years and older, it is anticipated that the 2006 findings reflect more accurately the workforce aged 45 years or older than the results from the 2000 survey. 27
37 3 Retirement Influences and Aspirations The previous sections of this report suggest the public sector (along with the workforce in general) is likely to face a number of challenges resulting from the ageing workforce and consequent loss of experienced employees. The following section outlines the attitudes and preferences of employees approaching retirement age, and their interest in flexible working arrangements. These areas present many opportunities for workforce planning strategies to retain employees who would like to continue working, and to ensure corporate knowledge is passed on and not lost to agencies when experienced employees retire. Key Findings 1. Overall respondents have a positive attitude to retirement. 2. The top five factors that influence employees decision to retire include: financial security (97%); job satisfaction (93%); work/life balance (91%); leisure activities (84%); and job stress (84%). 3. The three most common barriers to working beyond eligible retirement age are: own health issues (47%); do not want to/unable to continue working at current pace in current job (44%); and inability to access greater flexibility in working arrangements in current job (41%). 4. Many respondents are not confident that they will be able to retire when they would like, primarily due to insufficient retirement funds. 5. Respondents indicated limited knowledge or awareness of recent changes to superannuation arrangements and the financial impact that these changes have on accessing flexible work arrangements. 6. Over 15,000 respondents (93%) are interested in flexible working arrangements, the most popular being a gradual reduction in hours or contract work after leaving the WAPS. 7. Gradual reduction in hours over a number of years leading up to retirement is most popular flexible option, however only 13% of respondents planning to retire in 1-4 years have taken up this option, while 63% are interested but have not done so. 8. Nearly one in five respondents intend to continue in paid employment after retiring from the WAPS. 9. Fifty three percent of respondents planning to retire from the public sector but continue working in paid employment indicated they do not want to continue working at their current pace. 10. Similarly, 50% of respondents planning to retire from the public sector but intend to continue working in paid employment, perceive difficulties in accessing flexible work arrangements in the public sector. 28
38 3.1 Attitudes to Retirement General Attitudes to Retirement Overall, respondents have a positive attitude to retirement. As shown in Figure 16, the majority of respondents (83%) feel their family and friends would be supportive of the decision to retire. Most agreed that they look forward to being able to retire (70%) and have some plans or ideas for what they will do in retirement (72%). The general comments reflected the appealing aspects of retirement such as the ability to travel, spend more time on hobbies, engage in volunteer work or other pursuits, and have more time to spend with family. For instance: Ideally, we want to be free of ongoing work responsibilities with the financial capacity to enjoy our remaining years to the full (caravanning, travel, more family time, volunteer work, hobbies etc). (Female, 55-59) Figure 16: Overall Attitudes Toward Retirement My family and friends will be supportive of my decision to retire 83% 2% 15% I have some plans / ideas for what I will do when I retire 72% 15% 13% I look forward to be able to retire 70% 12% 18% Decision as to when to retire will be difficult 44% 39% 17% I think I will be financially able to retire at the time convenient to me 43% 22% 35% 0% 10% 20% 30% 40% 50% 60% 70% 80% 90% 100% Agree Disagree Unsure Description: The percentage of respondents on permanent or fixed term contracts of two years or more who agree, disagree or are unsure with each attitude statement. Source: 2006 Retirement Intentions Survey The comments also indicate that retirement offers a way out for those unsatisfied with their current jobs. For example: My view is the over bureaucratic nature of the Public Sector is the main reason people want to leave it. (Male, 50-54) Stress in working for an under funded agency. (Male, 50-54) Currently considering retiring due to the poor leadership, falling standards and low morale within my division. (Male, 55-59) 29
39 Older respondents are less likely to agree that they look forward to being able to retire (see Table 13). Of respondents less than 60 years of age, approximately 70% look forward to being able to retire. This figure decreases as age categories increases (63% for employees aged 60-64, and 37% for employees aged 65 and over). This may be due to the likelihood that many people who strongly want to retire, have already done so, and therefore will not be a respondent of the higher age brackets. Table 13: Gender, Age and Salary of Respondents Agreeing with Attitude Statements My family and friends will be supportive of my decision to retire I have some plans / ideas for what I will do when I retire I look forward to be able to retire Decision as to when to retire will be difficult I think I will be financially able to retire at the time convenient to me Gender Age Salary Female Male <$50K $50K-$70K $70K+ 84% 82% 81% 83% 84% 85% 80% 81% 84% 85% 70% 74% 65% 73% 76% 77% 68% 67% 74% 76% 68% 73% 71% 72% 70% 63% 37% 68% 72% 70% 45% 43% 43% 44% 45% 45% 49% 44% 45% 44% 39% 49% 38% 42% 46% 50% 58% 38% 41% 57% Description: The percentage of respondents on permanent or fixed term contracts of two years or more who agree with each attitude statement, by gender, age and salary. Source: 2006 Retirement Intentions Survey It should be noted that income also has an influence on respondents attitude to retirement and this will be discussed in Section The Retirement Decision Factors in Determining When to Retire Previous research xii,xiii,xv has established a number of work-related and personal issues that are important in determining when to retire. The survey asked people to rate the importance of 15 potential influences on their decision of when to retire from the WA public sector. The total importance rating for each factor is calculated as the percentage of respondents who rated the factor as either important or very important. Figure 17 shows the importance rating of each factor in determining when to retire from the WA public sector. The top five factors, rated as important by over 80% of respondents, are: Financial security (97%) Job satisfaction (93%) Work/life balance (91%) More time to pursue leisure activities (84%) Job stress/pressure (84%). 30
40 Figure 17: Factors in Determining when to Retire Financial Security Job satisfaction Work / life balance Job stress Leisure activities Own health issues / disability Appropriate age Alternative lifestyle Lack of interesting work Eligible age Care for children / grandchildren Care for other family members Partner's retirement Care for elderly parents Number of dependants still at home 0% 20% 40% 60% 80% 100% Female Male Description: The percentage of respondents on permanent or fixed term contracts of two years or more who rated each factor as important or very important in determining when to retire from the WAPS. Source: 2006 Retirement Intentions Survey It is worth noting that these findings are consistent with the results from the 2000 survey as well as other interstate research. In the 2000 survey for instance, financial security was the factor rated by the highest percentage of respondents (98%) as important in determining when to retire, followed by job stress (79%). In both the NSWPS xiii xii and ACTPS surveys financial security was the most frequently identified factor determining when to retire. Job satisfaction, work/life balance and job pressure also featured as significant influences in these research studies. In regard to the current findings, it would appear that four of the top five factors influencing the intended timing of retirement are work-related. Job satisfaction is rated as important by 93% of respondents, nearly as many have rated financial security an important factor (97%). Work/life balance is also rated as important by 91% of respondents. The high importance of work-related factors may be of interest to employers, as it suggests that workplace strategies addressing job satisfaction, work/life balance, and job stress or pressure may encourage employees to continue working in the public sector. In general, male and female respondents give similar ratings to factors that will be important in influencing their retirement decisions, but there are some differences related to family responsibilities (see Figure 17). More male respondents (40%) than female respondents (32%) consider the number of dependents still at home as an important factor in determining when to retire. A higher percentage of female respondents (35%) than male respondents (24%) feel that caring for elderly parents is an important factor in deciding when to retire. A similar pattern is found for caring for grandchildren (rated as an important influence on retirement decisions by 41% of females and 32% of males), and caring for other family members (rated as an important factor by 39% of females and 31% of males). 31
41 Table 14: Factors in Determining when to Retire by Age Gender Age Female Male Financial Security 97% 97% 98% 97% 97% 96% 90% Job satisfaction 93% 92% 94% 93% 93% 89% 86% Work / life balance 91% 90% 93% 92% 90% 84% 75% Job stress / pressure 85% 82% 88% 86% 82% 74% 58% More time to pursue leisure activities 84% 85% 88% 86% 83% 78% 65% Own health issues / disability 74% 70% 78% 74% 68% 64% 59% Reaching appropriate age / too old to work 67% 62% 68% 65% 65% 65% 49% For alternative lifestyle 65% 66% 71% 68% 63% 55% 40% Lack of interesting work 63% 66% 72% 65% 61% 51% 46% Reaching eligible retirement age 57% 56% 59% 59% 54% 51% 27% To care for children / grandchildren 41% 32% 44% 38% 33% 31% 27% Coincide with partner 39% 38% 46% 42% 34% 27% 18% To care for other family members 39% 31% 46% 37% 30% 26% 25% To care for elderly parents / parents-in-law 35% 24% 43% 33% 24% 14% 9% Number of dependants still at home 32% 40% 52% 37% 24% 15% 14% Description: The percentage of respondents on permanent or fixed term contracts of two years or more who rated each factor as important or very important in determining when to retire from the WAPS, by gender, age and salary. Source: 2006 Retirement Intentions Survey In general the factors determining when to retire are rated as important by less respondents as age increases (see Table 14). The trend may be due to changing attitudes to retirement as people get older, or different attitudes to retirement held by different generations or cohorts. Alternatively, it is possible that among the older age groups, a greater number of people who potentially would have rated some of these factors as important have already retired. Even though there is a decreasing trend with age, many of the previously identified key factors are still rated as important influences on retirement timing by those in the over 65 age bracket, particularly financial security (90%), job satisfaction (86%) and work-life balance (75%). Respondents were asked to specify any other factors important to them in deciding when to retire from the WAPS. No new major themes emerged, with most of the comments expanding on factors in Figure 17. Comments about job satisfaction, a key factor in employee retention, include issues with management and resourcing, feeling respected and valued, having meaningful or interesting work, and having opportunities such as promotions. I enjoy working and particularly appreciate the opportunities I have had in the Department. (Male, 50-54) As an older worker I do feel I am seen as less valuable from time to time. This is quite demoralising. (Female, 50-54) 32
42 Although some older employees are keen to retire in order to devote their time to their interests, or leave behind the demands of their work, many others would prefer to keep working as long as they are able to access flexible working arrangements and continue to be valued within their organisation: If I'm enjoying work and feel as if I'm making a useful contribution, I'd like to work as long as I can though I might want to reduce my hours. (Male, 50-54) Will miss the social aspect of working and making a contribution - would work longer if part time was available. (Female, 50-54) The Importance of Financial Security for Retirement Although respondents are generally positive about the idea of retirement, many are not confident that they will be able to retire when they would like to (see Figure 16). The primary concern is having insufficient retirement funds (80% of respondents as shown in Figure 18). Figure 18: Overall Perceived Barriers to Retiring at Preferred Time Insufficient savings or superannuation to retire on Dependent children still at home Important work projects/s not completed I will have nothing worthwhile to do when I retire 0% 10% 20% 30% 40% 50% 60% 70% 80% 90% Description: The percentage of respondents on permanent or fixed term contracts of two years or more who felt each of these issues could be/ have been barriers to retiring when the respondent wants to. Source: Retirement Intentions Survey
43 Table 15: Perceived Barriers to Retirement by Gender, Age and Salary Insufficient savings or superannuation to retire on Dependent children still at home Important work projects/s not completed I will have nothing worthwhile to do when I retire Gender Age Salary Female Male <$50K $50K-$70K $70K+ 81% 79% 83% 81% 78% 76% 69% 81% 83% 74% 23% 27% 37% 27% 16% 9% 10% 22% 26% 28% 15% 17% 17% 15% 16% 14% 20% 12% 15% 23% 10% 11% 9% 10% 11% 13% 26% 11% 9% 12% Description: The percentage of respondents on permanent or fixed term contracts of two years or more who felt each of these issues could be/ have been barriers to retiring when the respondent wanted to, by gender, age and salary. Source: 2006 Retirement Intentions Survey As can be seen in Table 15, insufficient savings or superannuation for retirement is perceived as a potential barrier to retiring at a convenient time for the majority of respondents, regardless of gender, age and salary. However, respondents in the higher age brackets, and respondents with an income of $70,000 or greater are slightly less likely to consider this a barrier. As discussed in Section 3.1, less than half the respondents (43%) feel that they are financially able to retire at a time convenient to them. Women are less likely than men to believe they have sufficient finances to retire when they want to (39% of women compared to 49% of men). Income also has a bearing on respondents financial ability to retire, at the time they desire (refer to Table 13). Approximately one third (38%) of respondents with an income less than $50,000 per year expect to be financially able to retire when they want to, compared to 57% of respondents with an income over $70,000. Older respondents are also more likely to think they will be able to afford to retire at a convenient time. It is interesting to note that there is a discrepancy between the percentage of respondents who feel that insufficient savings or superannuation could be or has been a barrier to retiring when they want to (80%, as shown in Figure 18), and the percentage of respondents who disagree or are unsure that they will be financially able to retire at a convenient age (57%, as shown in Figure 16). The reason for this discrepancy is not clear. In discussing financial issues surrounding retirement, it is important to remember that financial security or having enough money to retire can mean different things to different people depending on their circumstances and expectations, as illustrated by the financial goals of these respondents: Being debt free and eligible for pension. (Female, 50-54) Ample savings to cover home/car maintenance, health expenses, lifestyle, hobbies, etc during retirement years. (Female, 45-49) 34
44 3.3 Flexible Working Arrangements Awareness of Available Options One way of assisting employees to create the work/life balance many are interested in as they approach eligible retirement age is to provide flexible working arrangements. There have recently been changes to superannuation to make it easier for employees to work in more flexible arrangements. In order to assess the level of awareness of these changes, respondents were asked whether they are aware of changes in superannuation that a) make it easier to work part-time without significantly affecting your super; and b) allow you to work part-time and access superannuation once you have reached retirement age. Over three quarters of respondents who are interested or currently working in a flexible work arrangement, are not fully aware of the changes to superannuation. As shown in Figure 19, 37% of respondents who are interested in, or who are already working in a flexible arrangement, have not heard of the changes that make it easier to work part-time without significantly affecting superannuation. A further 40% have heard something about the changes but are not sure of the details. Similarly, 36% have not heard of the changes allowing employees to work part-time and access superannuation once they have reached retirement age, and 42% have heard something but are unsure of the details. Figure 19: Interest in Flexible Working Arrangements and Awareness of Changes to Superannuation Aware of changes that make it easier to work part-time without significantly affecting your superannuation Aware of the changes that allow you to work part-time and access superannuation once you have reached retirement age 45% 40% 35% 30% 25% 20% 15% 10% 5% 0% 45% 40% 35% 30% 25% 20% 15% 10% 5% 0% No Had heard something Yes No Had heard something Yes Taken &/or Interested in a Flexible Option Not Interested in Flexible Options Description: The percentage of respondents on permanent or fixed term contracts of two years or more who are aware of the changes regarding superannuation, by position on flexible working arrangements (that make it easier to work part-time without significantly affecting your super n=16710 or allow you to work part-time and access superannuation once you have reached retirement age n=16621). Source: 2006 Retirement Intentions Survey As shown in Figure 19, similar proportions of respondents interested in or currently in flexible working arrangements and those not interested in taking up a flexible work arrangement stated they were not aware of the changes to superannuation. Surprisingly, 35
45 compared to respondents not interested in flexible work options, respondents who are interested or already working flexible arrangements were less likely to indicate they were aware of the changes. This would appear counter intuitive. They were, however, more likely to say that they had heard something, but were not sure of the details. One possible explanation is that people who were interested in the changes wanted more detailed information (as the changes to superannuation would affect them if they took up the flexible options) compared with people who were not hoping to adopt a flexible working arrangement and therefore would not be affected by the changes. If this is indeed the case, then the difference may not lie in the amount of actual information or awareness the two groups have about the changes, rather a perceptual difference in whether they feel their level of knowledge is sufficient for their needs Interest in Flexible Working Arrangements According to the survey findings, there appears to be widespread interest in flexible working arrangements. Indeed, over 15,000 respondents (93%) are interested in some form of flexible working arrangements. A list of flexible work options was included in the questionnaire and respondents were asked to indicate whether they were interested, not interested, or had already taken up each option. The flexible options listed were: Gradual reduction in hours over a number of years leading up to retirement (assuming minimal impact on superannuation) Contract or casual employment in the WA State public sector after retirement Alternative job opportunities - at the same salary level Continuing part time work while partially accessing superannuation Reduced level of responsibility (while maintaining existing superannuation conditions) prior to retirement Access to purchased leave (eg.44/52) Access to deferred salary (eg. 4/5) Working from home for a period leading up to retirement Alternative job opportunities - at a lower salary level. 36
46 Figure 20: Interest in Flexible Working Arrangements by Gender Retirement Intentions 2006 Gradual reduction in hours Contract in WAPS after retirement Alternative jobs - same salary Part time work, access part super Reduced level of responsibility Purchased leave Deferred salary Working from home Alternative jobs - lower salary 0% 10% 20% 30% 40% 50% 60% 70% 80% 90% Female Male Description: The percentage of respondents on permanent or fixed term contracts of two years or more interested in taking up each flexible working arrangement, by gender. Source: 2006 Retirement Intentions Survey As shown in Table 16 the most popular alternative working arrangement is a gradual reduction in hours over a number of years (assuming minimal impact on superannuation) (76%). There is also a lot of interest in contract or casual work within the public sector (73%), alternative job opportunities at the same salary level (69%), and continuing part-time work while partially accessing superannuation (65%). Most of the other flexible working arrangements options are of interest to over a third of employees. Table 16: Interest in Flexible Working Arrangements by Age Age Groups Total Gradual reduction in hours over a number of years leading up to retirement (assuming minimal impact on 80% 78% 74% 65% 56% 76% superannuation) Contract or casual employment in the WA State public sector after retirement 76% 75% 72% 66% 57% 73% Alternative job opportunities - at the same salary level 79% 72% 64% 50% 41% 69% Continuing part time work while partially accessing superannuation 72% 68% 61% 53% 45% 65% Reduced level of responsibility (while maintaining existing superannuation 54% 51% 48% 40% 33% 50% conditions) prior to retirement Access to purchased leave (eg.44/52) 57% 48% 38% 30% 28% 46% Access to deferred salary (eg. 4/5) 56% 44% 31% 23% 17% 42% Working from home for a period leading up to retirement 47% 41% 35% 25% 17% 39% Alternative job opportunities - at a lower salary level 24% 20% 17% 12% 12% 19% Description: The percentage of respondents on permanent or fixed term contracts of two years or more interested in taking up each flexible working arrangement, by age. Source: 2006 Retirement Intentions Survey 37
47 Interest in flexible working arrangements is particularly high among the younger age groups (see Table 16). For example 80% of year old respondents expressed an interest in gradual reduction in hours over a number of years (assuming minimal impact on superannuation), compared to 56% of respondents aged over 65. However, it is important to note that respondents in higher age groups are more likely to be in part-time work or flexible arrangements already (more detail of age differences and employment arrangements are provided in Section and Appendix A.2.2.2). Support for flexible working arrangements is reflected in a large number of comments, such as: I very much appreciate the thought of a flexible approach to ease into retirement. I believe this can be a win-win situation where valuable knowledge and experience can be utilised, while freeing up promotional positions for younger people. (Female, 45-49) Flexibility in work arrangements - may defer retirement if I can 'transition' (revert to parttime). (Male, 45-49) I am already in 'phased retirement', working 4/5ths, and it is a great work/leisure balance. (Male, 60-64) New and exciting role has resulted in delayed retirement for me I have a new role with flexible working arrangements - great! (Male, 60-64) Flexible Work Arrangements Already Taken Flexible work arrangements have already been made available at a number of agencies and taken up by 10% of respondents. As can be seen in Figure 21, the percentage of employees that have already taken up a flexible work arrangement increases with the age groups. Women are more likely to already be working in a flexible working arrangement than men, but the gap between men and women in accessing flexible working arrangements decreases with age, particularly in the over 65 age group. The most common flexible arrangement that has already been taken is a gradual reduction in hours over a number of years, which has been taken up by 10% of female respondents and 3% of male respondents. Figure 21: Currently Working in a Flexible Work Arrangement by Gender 30% 25% 20% 15% 10% 5% 0% (n =4,987) (n =5,546) (n =4,357) (n =1,804) 65+ (n =336) Female 9% 12% 15% 23% 26% Male 3% 5% 6% 10% 21% Total 7% 9% 12% 17% 23% Age of Respondents Description: The percentage of respondents on permanent or fixed term contracts of two years or more currently working a flexible work arrangement, by gender and age. Source: 2006 Retirement Intentions Survey 38
48 3.3.4 Interest versus take-up of Flexible Working Arrangements Retirement Intentions 2006 As the sections above show, there appears to be a large difference between interest in flexible working arrangements and the number of people actually taking up these options. Table 17 shows the percentages of respondents from various demographic groups who are already working a flexible arrangement. Table 17: Flexible Working Arrangements by Gender, Age and Salary Gradual reduction in hours over a number of years leading up to retirement (assuming minimal impact on superannuation) Contract or casual employment in the WA State public sector after retirement Alternative job opportunities - at a lower salary level Continuing part time work while partially accessing superannuation Reduced level of responsibility (while maintaining existing superannuation conditions) prior to retirement Gender Age Salary F M <$50K $50K- $70K $70K + 10% 3% 4% 6% 8% 14% 21% 13% 3% 1% 0% 0% 0% 0% 0% 1% 1% 1% 0% 0% 1% 0% 0% 1% 1% 1% 2% 1% 1% 0% 2% 1% 1% 1% 1% 2% 4% 2% 0% 0% 3% 1% 1% 2% 3% 5% 10% 4% 1% 1% Access to purchased leave (eg.44/52) 2% 2% 2% 2% 2% 2% 2% 2% 2% 0% Access to deferred salary (e.g. 4/5) 1% 1% 1% 1% 1% 2% 1% 1% 2% 1% Working from home for a period leading up to retirement Alternative job opportunities - at the same salary level 0% 0% 0% 0% 0% 1% 1% 1% 0% 0% 0% 0% 0% 0% 1% 1% 1% 1% 0% 0% Description: The percentage of respondents on permanent or fixed term contracts of two years or more who are already working each flexible arrangement by gender, age and salary. Source: 2006 Retirement Intentions Survey Flexible Working Arrangements Approaching Retirement As flexible working arrangements are often adopted as a transition to retirement, or an alternative to completely stopping paid work upon retirement, it would be expected that there would be higher levels of flexible working arrangements among respondents close to retirement. Table 18 shows the position of respondents planning to retire in less than 5 years with regards to flexible work options. Despite the fact that the vast majority of this group are interested in taking up a flexible arrangement, only 19% have taken up a flexible arrangement, while 72% are interested but not currently in a flexible arrangement. Table 18: Position on Flexible Work Options by Respondents Planning to Retire Within 5 Years No. Of Respondents % Of Respondents Taken a flexible arrangement and not interested in others 92 4% Taken a flexible arrangement and interested in others % Not taken a flexible arrangement but interested in taking up one 1,791 72% Not taken a flexible arrangement and not interested 210 9% Total 2, % Description: The percentage of respondents on permanent or fixed term contracts of two years or more and intending to retire in less than 5 years by position on flexible working arrangements. Source: 2006 Retirement Intentions Survey 39
49 Table 19 shows interest and take up of flexible arrangements among respondents within five years of retirement by occupation. It suggests that while managers (86%) and protective service workers (84%) are interested in flexible work options, their take up of such roles in limited (8% and 3% respectively). Greater opportunities for flexible positions appear to be available to education and TAFE (23%) and health (28%) professionals. Table 19: Position on Flexible Work options by Respondents Planning to Retire Within 5 Years by Occupation Occupation Taken a flexible arrangement and not interested in others Taken a flexible arrangement and interested in others Not taken a flexible arrangement but interested in taking up one Not taken a flexible arrangement and not interested Management 1% 7% 86% 6% Protective Service Workers 0% 3% 84% 13% Natural and Physical Science 0% 13% 75% 12% Administration Professionals and 3% 13% 75% 9% Clerical Community and Social Services 6% 15% 75% 4% Education and TAFE 5% 18% 68% 9% Health 6% 22% 66% 6% All Other 6% 12% 69% 13% Description: The percentage of respondents on permanent or fixed term contracts of two years or more and intending to retire in less than 5 years by position on flexible working arrangements and occupation group. Source: 2006 Retirement Intentions Survey Given the substantial interest in flexible work arrangements for all professions, the findings raise questions as to why the take-up rate is not higher. While the questionnaire did not specifically address this question, the next section, which covers respondents perceived barriers to working past retirement age, highlights that there may be social barriers to accessing flexible arrangements in some departments. Over a third of respondents cite negative perceptions at work towards flexible arrangements, and over 40% cited inability to access greater flexibility in their working arrangements as a barrier to continuing to work. Not all of the flexible options presented are available for all occupations before retirement. However, the most popular option is gradual reduction in hours over a number of years leading up to retirement (assuming minimal impact on superannuation), which would be taken up in the years preceding retirement. People who are not planning to retire for many years are likely to be interested in this option only for the future, so naturally would have a much higher level of interest than take-up of the option. Those with less than a year to retirement would not have time to reduce hours over a number of years unless they have already begun to do so (or they change their retirement plans), therefore they may show a lower rate of interest. 40
50 Table 20 shows the interest in this option of people intending to retire in the next 1 to 4 years, as this is the group for whom the option could be taken up now, and therefore best represent the disparity between interest and take-up of flexible options. Table 20: Interest in Gradual Reduction in Hours Over a Number of Years Leading up to Retirement by Respondents Planning to Retire Within 5 Years Interested in gradual reduction in hours over a number of years leading up to retirement No. Of Respondents % Of Respondents Yes 1,399 63% No % Option already taken % Total 2, % Description: The percentage of respondents on permanent or fixed term contracts of two years or more and intending to retire in less than 5 years interested in Gradual reduction in hours over a number of years leading up to retirement (assuming minimal impact on superannuation) (n=2,213). Source: 2006 Retirement Intentions Survey Of the respondents planning to retire in 1-4 years, 13% have taken up the option of gradually reducing hours, while 63% are interested but have not done so Employees Perceptions of Obstacles to Accessing Flexible Arrangements Even though flexible working arrangements are available in many agencies, employees perceive a stigma with accessing such arrangements. For instance, an employee who expressed an interest in flexible arrangements saw work culture as a barrier to continuing to work beyond eligible retirement age: The current culture that promotional positions mean you have to work harder, longer. (Male, 45-49) The comments show that a number respondents feel that their organisation or section has a work harder, longer culture and that as a result flexible arrangements are viewed negatively by their managers or colleagues. Some employees stated that because of this inflexibility they are likely to retire rather than continue working in a way that is not supported by their managers or colleagues. The following comments indicate that not all respondents are confident that flexible arrangements will be available and supported in their workplace: The ability to access more flexible working conditions are entirely dependent on the whims of the Manager and the size of the department. Thus in a small work area the chances of part time or flexible hours is non-existent. (Female, 55-59) Lip service is paid to things like working from home and valuing work-life balance. (Female, 55-59) I would like to see a lot more flexibility in the program in which I work, particularly opening up part time, job share opportunities and flexible working arrangements with management's wholehearted endorsement. (Female, 50-54) I am working part-time (0.8FTE) but I find that the rest of the work group finds this very hard to cope with and I am left out of important issues/decisions. This makes working unsatisfying. (Female, 55-59) 41
51 There may also be a need to improve access to flexible arrangements for people in regional areas, and higher classification levels. The perception that flexible arrangements are harder for some employees to access is illustrated in the following comments: More flexibility for those in regional areas. (Male, 50-54) There is excessive work load pressure on branch Managers' and to be in the work place full time. My experience is that there is no acceptance of the need to support school age children, elderly or disabled relatives. (Female, 50-54) Our Agency's culture is very work/project focussed. I feel a part-time option may not be very well received at my level. (Male, 50-54) Lack of flexibility for SES officers; difficulty accessing lower classification positions part time. (Female, 55-59) 3.4 Options Available Other than Retirement Working Beyond Eligible Retirement Age As shown in Figure 22, health issues are considered by nearly half (47%) of the respondents as a potential barrier to continuing to work after reaching eligible retirement age. Other commonly cited potential barriers to continued employment include not wanting or not being able to continue working at their current pace (44%) and inability to access greater flexibility in working arrangements in their current job (41%). General comments from respondents support these findings. It is also worth noting that only 10% felt that pressure from family to retire would be a barrier to continuing to work past eligible retirement age. This is useful to know as pressure from family is clearly a factor that cannot be influenced by employers (although it may be eased by flexible work arrangements). There was some variation across the occupational groups in how frequently different factors were reported as barriers to continuing work after eligible retirement age, for instance: Not wanting/able to continue at my current pace in my current job is seen as a barrier to continue to work beyond the eligible age of retirement by 44% of respondents. Occupational groups that are more likely to view this issue as a barrier are education (50%), health (49%), and management (46%). Inability to access greater flexibility in working arrangements in my current job is seen as a barrier to continue working past eligible retirement age by 41% of respondents. Occupational groups that are more likely to consider this issue a barrier are management (51%), community and social services (45%), and protective services workers (43%). Negative attitudes at work to accessing more flexible working arrangements is more commonly rated as a barrier among the following occupational groups: protective services workers (43%); community and social services (40%); and management (39%). 42
52 Perceptions that my job could not be done with fewer hours spent at my workplace is most often rated as a barrier to continued working past eligible retirement age by management (42%). Between 30% and 34% of respondents in the other occupational categories considered this issue to be a barrier. Lack of promotional opportunities is seen as a barrier to continue working past eligible retirement age by 33% of respondents. Occupational groups that are more likely to rate this issue as a barrier are protective services workers (43%), community and social services (41%) and natural and physical sciences (40%). Figure 22: Barriers to Working Beyond Eligible Retirement Age Pressure from family to retire 10% Lack of promotional opportunities Perceptions that my job could not be done with fewer hours spent at my workplace Negative attitudes at work to accessing more flexible working arrangements Inability to access greater flexibility in working arrangements in my current job Do not want to/not able to continue to work at my current pace in my current job Own health issues 33% 34% 35% 41% 44% 47% 0% 5% 10% 15% 20% 25% 30% 35% 40% 45% 50% Description: The percentage of respondents on permanent or fixed term contracts of two years or more who felt each of these issues could be/ have been barriers to continuing to work after reaching eligible retirement age. Source: 2006 Retirement Intentions Survey Discussion of Barriers to Working Beyond Eligible Retirement Age The support for flexible working arrangements is again highlighted, with over a third of respondents citing the lack of flexible arrangements, or negative attitudes at work to flexible arrangements, as a barrier to continuing to work past the age of eligible retirement. Comments suggested that, for a number of respondents rather than slowing down they want the opportunity to continue to develop their skills and advance in their career, as highlighted by this comment from a respondent: I enjoy my work and in particular the pace and time that is needed to stay ahead of the game. I have no intention of retiring until I am no longer able to fulfil my duties to everyone's satisfaction. (Male, 65+) 43
53 However, as shown in Figure 22, 33% of respondents saw lack of promotional opportunities as a barrier to working after retirement age. The comments below reflect the concern that older employees are not given the career opportunities they would like: There are barriers to promotion and opportunity to workers over 45. Current management seems to think that this group is automatically zeroing in on retirement. This thinking belongs to a past generation. (Male, 50-54) I am currently seeking promotion after acting in promotional positions. My age seems to be a stumbling block which may force me to retire earlier than planned. (Female, 50-54) I would just like to repeat the need to value older employees. They are expected to perform at a high level - but the younger people get all the opportunities for seminars, conferences, membership of committees & promotion. (Male, 65+) The NSWPS 2006 Retirement Intentions survey xi found similar perceptions of age discrimination operating in some workplaces. This is an important issue to address both for the well-being of employees and the associated morale and retention issues. From a positive perspective, the fact that a number of the barriers to continuing to work are work-related presents an opportunity. By addressing these issues, the public sector has the potential to reduce the barriers for employees who would like to work beyond eligible retirement age Intention to Work after Retiring from the Public Sector This section explores employees intention to continue working after they have retired from the public sector. Table 21 shows the retirement plans of employees who nominated the age of retirement from the WAPS and paid employment. A total of 84% of respondents who answered these questions nominated an intended retirement age, while 16% of respondents are unsure about when they will retire. Of the respondents who nominated an intended age of retirement from the WAPS and paid employment: 78% plan to retire from all paid employment when they retire from the WAPS; and 22% intend to continuing working in paid employment after they retire from the WAPS. 44
54 Table 21: Comparison of the Intended Age of Retirement from Paid Employment and from the WAPS (By Gender) Intention to retire from paid employment Gender at same age or later than WAPS Female Male Total At the same age 5,109 (81%) 3,240 (74%) 8,349 (78%) At a later age 1,169 (19%) 1,154 (26%) 2,323 (22%) Total 6,278 4,394 10,672 Description: The percentage of respondents on permanent or fixed term contracts of two years or more who intend to retire from paid employment at the same age or a later age than they intend to retire from the WA public sector ( Unsure responses excluded), by gender. Source: 2006 Retirement Intentions Survey A higher percentage of males (26%) than females (19%) intend to work in paid employment after retiring from the WAPS. There are also differences among occupational groups (see Figure 23). Employees working in management are more likely to plan to work elsewhere before retirement, with 41% planning to retire from paid employment later than the WAPS. Natural and physical sciences is another occupation with a comparatively high proportion (36%) of respondents planning to continue working in paid employment after retiring from the WAPS. Figure 23: Intention to Retire from Paid Employment at the Same or Later Age than WAPS by Occupation Management (n=2,058) 59% 41% Natural and Physical Science (n=614) Education and TAFE (n=3,651) 64% 71% 36% 29% Protective Service Workers (n=451) 71% 29% Administration Professionals and Clerical (n=3,351) 72% 28% Health (n=2,309) 73% 27% Community and Social Services (n=479) All Other (n=649) 74% 80% 26% 20% 0% 10% 20% 30% 40% 50% 60% 70% 80% 90% 100% Retire Same Age Retire at a Later Time Description: The percentage of respondents on permanent or fixed term contracts of two years or more who intend to retire from paid employment at the same age or a later age than retiring from the WA public sector, by occupation. Source: 2006 Retirement Intentions Survey 45
55 3.4.4 Employment after Retiring from the WAPS As discussed in the previous section, more than one in five respondents intend to continue in paid employment after retiring from the public sector. Other studies (eg Retirement Intentions survey for the ACT Public Service, July 2002 xii ) have suggested this subset of employees present an opportunity to encourage interested workers to remain working in the public sector. As can be seen from Figure 24, those employees who intend to continue working after leaving the public sector are more likely to be interested in flexible working arrangements. For example, 85% of respondents who indicated that they intend to continue working after retirement from the WAPS indicated they would be interested in contract or casual employment in the WAPS, compared to 70% of those who indicated that they plan to leave employment altogether when they retire from WAPS. Figure 24: Intention to Retire from Paid Employment at the Same or Later Age than WAPS by Interest in Flexible Arrangements Contract or casual employment in the WA State public sector after retirement Gradual reduction in hours over a number of years leading up to retirement (assuming minimal impact on superannuation) Alternative job opportunities - at the same salary level 70% 85% 69% 79% 77% 66% Part time work while partially accessing superannuation 61% 74% Reduced responsibility (same Super conditions) 45% 55% Working from home leading up to retirement Access to purchased leave (eg.44/52) 36% 50% 50% 44% Access to deferred salary (eg. 4/5) 47% 40% Retire at a Later Time Retire Same Age Alternative job opportunities - at a lower salary level 17% 27% 0% 10% 20% 30% 40% 50% 60% 70% 80% 90% Description: The percentage of respondents on permanent or fixed term contracts of two years or more who are interested in each flexible arrangement by intention to retire from paid employment at the same age (n=8,349) or at a later age than retiring from the WA public sector (n=2,323). Source: 2006 Retirement Intentions Survey As shown in Figure 25, respondents intending to stay in the workforce after retiring from the public sector are also more likely to consider a number of work-related issues to be barriers to continuing to work past retirement. In particular, respondents planning to work elsewhere prior to retirement are more likely to feel that difficulties in accessing flexible work arrangements will be a barrier to continuing to work after eligible retirement age than respondents planning to retire from all paid work when they leave the public sector (50% and 35% respectively). 46
56 These results suggest that improving accessibility and support for flexible working arrangements could be particularly useful for retaining this group of employees. However, it is worth noting an alternative interpretation of the results: that the differences between the two groups are due to differing levels of job satisfaction and attitudes to work, in which case flexible working arrangements alone may not be enough to retain these employees. Unfortunately it is not possible to determine which of these interpretations is more accurate based on the present data. Figure 25: Intention to Retire from Paid Work at the Same or Later Age than WAPS by Barriers to Working Beyond Eligible Retirement Age Do not want to/ not able to continue at my current pace Inability to access flexible work arrangements 35% 42% 53% 50% Own health issues Negative attitudes at work to flexible arrangements Perceptions job could not be done with fewer hours at workplace 30% 30% 45% 42% 41% 40% Lack of promotional opportunities Pressure from family to retire 11% 11% 27% 37% Retire at a Later Time Retire Same Age 0% 10% 20% 30% 40% 50% 60% 70% 80% 90% Description: The percentage of respondents on permanent or fixed term contracts of two years or more who considered these issues barriers to working after eligible retirement age by intention to retire from paid employment at the same age (n=8,349) or a later age than retiring from the WA public sector (n=2,323). Source: 2006 Retirement Intentions Survey 47
57 4 Financial Planning For Retirement In the previous chapter, financial security was identified as a key factor in determining when to retire. Similarly, the adequacy of savings and superannuation for retirement are highlighted as concerns for many WA State government employees. In this chapter the financial considerations of employees prior to retirement is examined, along with the extent to which retirement planning is being undertaken by public sector employees 45 years or older. Key Findings 1. Survey responses implied a general lack of knowledge and understanding of superannuation and retirement planning by public sector employees. 2. Regardless of the superannuation scheme, people do not feel confident in the adequacy of their superannuation funds for retirement (87% consider it inadequate or are unsure). 3. Seventy six percent of respondents are either unsure or do not believe that their total income will be adequate for retirement. 4. Only 9% of women thought that their super will be adequate in retirement, compared to 21% of men. 5. Not surprisingly, a strong positive relationship exists between salary and whether respondents thought they have enough superannuation or income for retirement. 6. Forty six percent of employees 45 years or older are either not planning, or not seriously planning, for their retirement. This is consistent with the finding in the 2000 Retirement Intentions survey which indicated 42% were not planning or not seriously considering their financial future. 7. Respondents who are less likely to be seriously planning for retirement are those less than 50 years of age and those with salaries less than $50,000 per annum. 8. University graduates and employees who had been working in the public sector for 15 years or more are more likely to be planning for retirement. 48
58 4.1 Perceived Financial Security Table 22 displays respondents main source of retirement income and the adequacy of their superannuation for retirement by each WA Government fund. Most respondents considered West State superannuation (42%) or Gold State superannuation (37%) to be one of their main sources of retirement income. In terms of other income, respondents are more likely to consider investments to be a main source of retirement funds (17%). Table 22: Main Source and Adequacy of Retirement Income for Retirement Income Source Percentage of Respondents Superannuation Considered Adequate. (n=14,553) Yes No Unsure WA Government Funds Other Income West State Super 42% 10% 57% 33% Gold State Super 37% 20% 42% 38% Other WA Government Super/Pension Scheme 3% 19% 53% 28% Other approved super scheme 6% 22% 39% 39% Investments rent / properties / business / interest / stocks / 17% shares etc Age / service / widow's / war widow's pension 13% Savings / sale of assets 10% Other Australian superannuation funds 7% Casual or occasional paid work 7% Self managed Superannuation fund 5% Other Government superannuation funds (e.g. 1% Commonwealth or other States) Overseas pensions or superannuation funds 1% No other retirement income sources 1% Disability support (Invalid) / war disability pension or sickness 1% allowance Carer's / special / other benefits pensions <1% Other 5% Description: Percentage of respondents on permanent or fixed term contracts of two years or more who considered superannuation funds their main source of income in retirement, 26 and the percentage of those who considered a WA Government Fund a main source by the adequacy of their superannuation in retirement. Source: 2006 Retirement Intentions Survey 26 Respondents were allowed to indicate more than one fund as a main source of retirement income. 49
59 Regardless of the superannuation scheme, people do not feel confident in the adequacy of their superannuation fund for retirement, with 31% of respondents saying they are unsure whether their superannuation scheme will be adequate in retirement and a further 56% feeling it will be inadequate in retirement (Figure 26). Respondents in Gold State Super felt more confident their superannuation will be adequate than those on West State Super with 20% of respondents on Gold State Super feeling their superannuation will be adequate in retirement compared to just 10% of respondents on West State Super. Respondents also lack confidence in their overall income after retirement with just 24% of respondents feeling their income will be adequate for retirement (Figure 26). Figure 26: Adequacy of Superannuation and Income for Retirement 100% 80% 60% 40% 20% 0% Adequacy of Superannuation (n=16,784) Adequacy of Income (n=16,642) No 56% 38% Unsure 31% 38% Yes 13% 24% Description: Percentage of respondents on permanent or fixed term contracts of two years or more who felt their superannuation or income will be adequate for them in retirement. Source: 2006 Retirement Intentions Survey As is evident in Table 23, proportionately less women are confident in the adequacy of their superannuation and income than men. Only 9% of women thought their superannuation will be adequate in retirement compared with 21% of men. Likewise, 19% of women thought their income will be adequate in retirement compared with 32% of men. Older respondents appear to have more confidence in the adequacy of their superannuation and income. Approximately 10% more respondents aged 65 years and older answered that their superannuation will be adequate for them in retirement compared with respondents aged between 45 and 49. The same is true for income. This increase with age is not followed by a corresponding decrease in those who feel their superannuation or income is inadequate for retirement. Rather, it is the proportion of respondents who are unsure that decreases with age (Table 23). 50
60 There is a strong relationship between salary and respondents thoughts on whether they will have enough superannuation or income in retirement. It is mainly employees with salaries less than $50,000 who do not think they will have enough superannuation (64%) or income (47%) for retirement. Table 23: Adequacy of Superannuation and Income by Gender, Age and Salary Adequate Super Adequate Income Gender Age Salary $50K- Female Male <$50K $70K $70K+ n=10,544 n=6,208 n=4,919 n=5,459 n=4,293 n=1,768 n=330 n=6,921 n=5,857 n=3,701 Yes 9% 21% 11% 13% 16% 16% 19% 8% 13% 26% No 62% 46% 54% 57% 55% 57% 53% 64% 54% 41% Unsure 29% 33% 35% 30% 29% 27% 28% 28% 33% 33% n=10,435 n=6,176 n=4,876 n=5,422 n=4,258 n=1,750 n=323 n=6,841 n=5,824 n=3,677 Yes 19% 32% 21% 24% 27% 27% 32% 16% 23% 40% No 43% 30% 37% 40% 37% 38% 34% 47% 37% 23% Unsure 38% 38% 42% 36% 36% 35% 34% 37% 40% 37% Description: Percentage of respondents on permanent or fixed term contracts of two years or more, from various demographic categories, who felt their superannuation/ income will be adequate for them in retirement. Source: 2006 Retirement Intentions Survey Interestingly, the effect of salary cannot be explained by employment status. It was found that 64% of full-time employees earning less than $50,000 and 64% of part time employees earning less than $50,000 do not feel their superannuation will be adequate in retirement. On the other hand, gender is strongly related to these figures with greater proportions of females earning less than $50,000 per annum compared with male employees (Appendix A.2.2.4). From Table 24, it can be seen that the occupational groups also reflect the strong relationship between salary and confidence in superannuation. Respondents from occupational groups with high percentages of respondents earning salaries over $70,000, specifically management, natural and physical sciences and protective services 27, are more likely to be confident in the adequacy of their superannuation funds in retirement (Appendix A.2.2.4). 27 It is worth noting that even though respondents from the protective services earn higher salaries on average, this is not necessarily reflective of all protective service workers. For details of response rates and the demographic distribution of respondents refer to Appendix A. 51
61 Table 24: Occupation by Adequacy of Superannuation and Income Adequate Income Adequate Super Occupation No. of Respondents Yes No Unsure No. of Respondents Yes No Unsure Administration Professionals and 3,957 21% 42% 37% 3,975 12% 57% 31% Clerical Community and Social Services % 44% 38% % 61% 29% Education and TAFE 4,619 22% 44% 34% 4,666 12% 59% 29% Health 2,862 22% 43% 35% 2,912 11% 58% 31% Management 2,313 34% 29% 37% 2,322 22% 44% 34% Natural and Physical Science % 26% 41% % 43% 36% Protective Service Workers % 33% 38% % 43% 39% All Other % 51% 33% 902 9% 62% 29% Description: Percentage of respondents on permanent or fixed term contracts of two years or more, from each primary occupational group, who felt their superannuation/income will be adequate for them in retirement. Source: 2006 Retirement Intentions Survey Social factors also have an influence on perceived financial security. Survey comments highlighted issues such as the financial impact of divorce on both men and women, for instance: Having to pay ex wife large amount of my super - need to get $$ up. (Male, 50-54) Single parent. After divorce insufficient funds for retirement. (Female, 50-54) For women, taking time out from their careers to raise a family often means that they have less superannuation available in retirement. The following comment illustrates the cost for many women of not having been in continuous employment: After 24 years of marriage and raising a family I found myself forced in to the work place I have only 5 years of super and am the main income provider for my family. I am terrified of retirement as I have no way to support myself. (Female, 50-54) In addition, women who began their careers in an era where it was assumed their husbands income and superannuation would be sufficient for both partners may be affected in their current retirement plans by past inequalities. For instance: In the past the WA State public sector would not allow women working part-time to access superannuation, this indirect discrimination should be acknowledged and something done about it. (Female 50-54) 52
62 4.1.1 Perceived Financial Security and Knowledge of Superannuation Retirement Intentions 2006 Forty five percent of respondents do not know how much superannuation they will receive when they retire. Table 25 shows that knowledge of how much superannuation a respondent has is related to their perception that their superannuation and/or income is adequate in retirement. Table 25: Knowledge of Superannuation Amount and Adequacy of Superannuation and Income in Retirement Know Superannuation Amount Adequate Adequate Income Superannuation Yes No Unsure Yes (n=9,141) Yes 22% 0% 0% 22% No 10% 31% 9% 50% Unsure 4% 0% 24% 28% Total 36% 31% 33% 100% No (n=7,513) Yes 3% 0% 0% 3% No 4% 47% 11% 62% Unsure 3% 0% 32% 35% Total 10% 47% 43% 100% Description: Percentage of respondents on permanent or fixed term contracts of two years or more, who know how much superannuation they will receive when they retire and feel their superannuation/ income will be adequate for them in retirement. Source: 2006 Retirement Intentions Survey Approximately a third (35%) of respondents who do not know how much superannuation they will receive, are unsure if their superannuation will be adequate in retirement. For those who do know how much superannuation they will receive, the uncertainty regarding the adequacy of their superannuation is less (28%) but surprisingly the proportion is still quite high. Half of the respondents who know how much superannuation they will receive do not feel that it will be adequate for retirement. This is higher for respondents who do not know how much superannuation they will receive with 62% feeling their superannuation will not be adequate for them in retirement. Respondents who know approximately how much superannuation they have, are more likely to feel their superannuation and income will be adequate in retirement (22%) compared to respondents who do not know how much superannuation they will receive (3%). Of the respondents who know how much superannuation they will receive, 36% think their income will be adequate. However, only 22% of these feel their superannuation will be adequate for retirement. Of the respondents who do not know how much superannuation they will receive, only 10% think their income will be adequate. Not surprisingly, only 3% of these respondents feel their superannuation will be adequate for retirement. Total 53
63 4.2 Retirement Planning As seen in Figure 27, 54% of respondents are actively planning for financial security in their retirement. Figure 27: Financial Planning for Retirement Not seriously 27% Yes 54% No 19% Description: The percentage of respondents on permanent or fixed term contracts of two years or more who are planning for retirement. Source: 2006 Retirement Intentions Survey The following comments suggest reasons why a considerable number of people are not planning for, or not seriously planning for, financial independence in retirement: Financial planning is a mine field which many people find daunting. This is because there are many people out there who offer their services, however, how do we rate those services. Who are the good ones and who are the bad? (Male, 45-49) My comment that I am not interested in seeking financial advice relates to the fact that, after paying my mortgage and accounts (insurances etc), there is no money left over to invest or spend on anything, no matter how good the advice. (Female, 55-59) Table 26 shows a slightly larger proportion of the male respondents (59%) are actively planning for retirement compared with females (51%). Respondents between the ages of 55 to 64 are most likely to be actively planning for financial independence in retirement (Table 26). Interestingly, the proportion of respondents not actively planning for financial independence increases with age, while those not seriously planning decreases with age. Salary also appears to affect the likelihood that a respondent is actively planning for retirement, with over two thirds of the respondents earning $70,000 per annum or more, actively planning for financial independence compared to less than 45% of respondents earning less than $50,000 per annum (Table 26). 54
64 Table 26: Financial Planning by Gender, Age and Salary Retirement Intentions 2006 Financial Gender Age Salary Planning $50K- Female Male <$50K $70K $70K+ n=10,535 n=6,222 n=4,923 n=5,476 n=4,286 n=1,763 n=327 n=6,910 n=5,868 n=3,707 Yes 51% 59% 49% 54% 59% 58% 53% 44% 57% 68% No 22% 15% 19% 19% 18% 22% 25% 27% 16% 10% Not seriously 27% 26% 32% 27% 23% 20% 22% 29% 27% 22% Description: The percentage of respondents on permanent or fixed term contracts of two years or more from various demographic groups, who are planning for retirement. Source: 2006 Retirement Intentions Survey All occupation categories, except community and social services and the all other category, had at least 50% of employees actively planning for financial independence in retirement (Table 27). Employees from management and the protective services are more likely to financially plan for retirement. Interestingly, these employees are among the higher income earners (see Appendix A.2.2.4) which is reflected in the high proportion of respondents actively planning who earned salaries greater than $70,000. It is unclear from this data whether it is the salary that influences financial planning or the nature of the occupation of these employees. Table 27: Financial Planning by Occupation Occupation No. of Respondents Are You Actively Planning For Financial Independence After Retirement? Not Yes No seriously Administration Professionals and Clerical 3,963 50% 21% 29% Community and Social Services % 22% 30% Education and TAFE 4,628 55% 19% 26% Health 2,874 56% 19% 25% Management 2,320 64% 11% 25% Natural and Physical Science % 14% 28% Protective Service Workers % 14% 24% All Other % 36% 29% Description: The percentage of respondents on permanent or fixed term contracts of two years or more from different occupational groups, who are planning for retirement. Source: 2006 Retirement Intentions Survey Table 28 suggests that as the number of years working in the WA public sector increases, so does the proportion of respondents actively planning for financial independence after retirement. Fifty eight percent of those working for 15 years or more are actively planning for financial independence, which is at least 10% more than those respondents who had worked less than 15 years. Respondents with university degrees are also more likely to plan for retirement than those with other qualifications (Table 28). 55
65 Table 28: Financial Planning by Experience in WAPS and Level of Education Experience Education Financial Trade Planning < Secondary Secondary certificate years years years Unsure Primary (1-3 yrs) (4-5 yrs) or TAFE University n=1,787 n=4,418 n=10,537 n=32 n=89 n=2,178 n=2,073 n=2,695 n=9,211 Yes 46% 48% 58% 25% 33% 41% 47% 48% 61% No 26% 23% 16% 34% 28% 31% 23% 23% 14% Not seriously 28% 29% 26% 41% 39% 28% 30% 29% 25% Description: The percentage of respondents on permanent or fixed term contracts of two years or more with difference experience levels, who are planning for retirement. Source: 2006 Retirement Intentions Survey Superannuation, Income and Financial Planning Not surprisingly, respondents who are planning for financial independence are much more likely to know how much superannuation they will receive (Table 29). In fact, 69% of respondents who are planning for financial independence know how much they will receive compared to 36% of those who are not planning, and 40% of those who are not seriously planning for retirement. Table 29: Financial Planning by Knowledge of Superannuation Amount Financial Know Superannuation Amount Planning Yes No Total Yes 69% 31% 100% No 36% 64% 100% Not seriously 40% 60% 100% Description: The percentage of respondents on permanent or fixed term contracts of two years or more and are planning for retirement that know their superannuation amount. Source: 2006 Retirement Intentions Survey In general, irrespective of whether employees are actively planning for financial independence in retirement or not, they feel that insufficient savings or superannuation will be a barrier to retirement (Table 30). Although 15% fewer employees who are actively planning feel insufficient savings or superannuation is a barrier to retirement when compared with those not planning at all, it is still surprising that their proportion is 73%. Of respondents who are not actively or not seriously planning for financial independence in retirement, only 8% feel that their income will be adequate in retirement. Of the respondents who are actively planning, 38% feel that their income will be adequate in retirement (see Table 30). Of these, similar proportions feel that insufficient savings or superannuation will be a barrier to retiring at the desired time (18%) as those who feel that it will not be a barrier (20%). 56
66 Table 30: Financial Planning by Attitude to Retirement and Adequacy of Income Actively Planning For Retirement Insufficient Savings To Adequate Income Retire At Preferred Time Yes No Unsure Total Yes (n=8,879) Yes 18% 25% 30% 73% No 20% 2% 5% 27% Total 38% 27% 35% 100% No (n=3,151) Yes 4% 63% 21% 88% No 4% 4% 4% 12% Total 8% 67% 25% 100% Not seriously (n=4,375) Yes 5% 38% 45% 88% No 3% 2% 7% 12% Total 8% 40% 52% 100% Description: The percentage of respondents on permanent or fixed term contracts of two years or more from various demographic groups and are planning for retirement that have sufficient savings or adequate income in retirement. Source: 2006 Retirement Intentions Survey It would appear that there is much uncertainty surrounding superannuation, financial planning and retirement income. This is despite the importance respondents placed on financial security as the most important factor in deciding when to retire. There is clearly scope for greater support and education on the financial aspects of retirement. In addition, comments suggest a need for more information, in a clear, easy to access format, on many aspects of superannuation and retirement finances and planning. For instance: Provide projections of superannuation to various ages. Also where possible provide the PS employee with the tools to calculate their super. (Male, 45-49) There is absolutely no information on retirement from our Department. This could be improved - social and financial information +/or discussions would be great, even some recently retired staff coming back to tell us of the good things & pitfalls. (Male, 55-59) I wish that information on superannuation was written in such a way that I could understand it. It appears to me to be an absolute minefield of different taxes and fees and rules that I simply do not understand. (Male, 45-49) Generally I don't think people are encouraged enough in their 40's to identify 1) how much they need when they retire 2) what annual income their current super will provide when they retire & 3) how much they need to invest to reach their preferred annual salary. (Male, 45-49) 57
67 4.3 Comparison with other Retirement Intentions Surveys Western Australian Public Sector Retirement Intentions Survey Comparing the results of the 2006 WAPS Retirement Intention survey with those of the 2000 survey, some differences in the responses to the financial questions in the survey were found. From Table 31 it is clear that 4% fewer respondents indicated that they are planning for financial independence in retirement in It is also apparent that more respondents from the 2006 survey are unsure if their superannuation or income will be adequate in retirement than was found in the 2000 survey. However, as previously discussed, there are a number of differences between the two survey samples that should be considered before conclusions can be drawn. In 2006, 37% of the survey respondents were male compared with 55% in 2000 (see Table 36). Similarly, 42% of 2006 respondents had salaries in the lowest wage bracket compared with 30% in There is also a greater proportion of respondents who were managers in 2000 (20%) compared with 2006 (14%) (shown in Table 37). As a consequence, it would be expected that fewer respondents to the 2006 survey would be planning for financial independence in retirement compared to those of the 2000 survey. The above factors are also likely to cause a difference in the level of uncertainty regarding superannuation and income between the two surveys. In addition, the proposed superannuation changes that were announced as part of the 2006/07 Federal Budget xvi during the last part of the data collection period, were suspected to have the effect of increasing the uncertainty about the adequacy of superannuation. As over half of the survey responses were received 28 after the announcement was made, it is possible, although not conclusive, that this is related to the difference in figures across the two surveys. Further discussion and analysis of the 2006/07 Federal Budget xvi effects on responses to the survey is discussed in Appendix A Although they were received after the announcement, there is no record of the actual date that these (paper-based) surveys were completed by the respondent. 58
68 Table 31: Financial Planning and Adequacy of Superannuation and Income: Comparison to Other Survey Results Financial Planning Adequate Income Adequate Super ACTPS NSWPS WAPS 2000 WAPS 2006 Yes 69% 58% 54% No 8% 16% 19% Not Seriously 23% 26% 27% Yes 27% 28% 25% 24% No 45% 36% 42% 38% Unsure 28% 36% 34% 38% Yes 20% 12% 13% No 50% 65% 56% Unsure 30% 23% 31% Description: Comparison of survey results to other surveys held in Australia. Sources: 2002 Retirement Intentions Survey for the ACTPS, 2005 Retirement Intentions Survey, NSWPS, 2000 Retirement Intentions Survey, WAPS & 2006 Retirement Intentions Survey Other Retirement Intentions Surveys The main difference between the WAPS survey and the 2002 ACTPS retirement intentions research was that respondents of the ACTPS were more likely to be planning for financial independence in retirement than indicated by the WA respondents. In addition, the ACTPS respondents had more certainty around the adequacy of their income than both the 2005 NSWPS retirement intention survey respondents and the 2006 WAPS retirement intention survey respondents. This decrease in unsure answers is matched by a corresponding increase in the number of respondents who thought their income would be inadequate in retirement (Table 31). From the data available the reason for the difference between the ACTPS and other surveys is not clear. It appears that the respondents demographics are similar for the 2002 ACTPS survey and the 2006 WAPS survey. However, it is possible that the earlier time in which the ACT survey was conducted may have some influence on responses No comparable data for the adequacy of superannuation in retirement question could be extracted from the ACT retirement intentions survey. No comparable data for the financial planning question could be extracted from the NSW retirement intentions survey. 59
69 Appendix A. Survey Methodology and Demographic Information A.1. Survey Details A.1.1. Introduction The 2006 Retirement Intentions survey was conducted by independent consultants, Data Analysis Australia, in consultation with the Department of the Premier and Cabinet. The purpose of the survey is to canvas issues related to retirement timing, the factors influencing the decision to retire, as well as retirement financial planning. The survey was intended to replicate a similar survey conducted in The results from the survey will be used to inform public sector workforce planners of retirement issues, and to provide information to individual public sector agencies so they are in the best position to assist their employees in their decision-making and transition to retirement. A.1.2. Agency Consultation Prior to commencing the retirement intentions research, a reference group was formed consisting of representatives from the following agencies: Department of the Premier and Cabinet Department of Consumer and Employment Protection Government Employee Superannuation Board Department of Health Department of Education and Training Western Australian Police Service Department of Attorney General Department of Industry and Resources. This Reference Group provided valuable input into the structure and content of the survey as well as the selection of the consultants who subsequently undertook the research. Once these details had been finalised by the Reference Group, all agencies with more than 60 employees 45 years or older were invited to participate in the study. Nominated representatives from agencies employing more than 300 employees 45 years or older were then invited to attend a workshop at which the purpose, process and agency requirements were explained. Smaller agencies taking part in the survey were sent a detailed folder containing information concerning the Retirement Intentions survey. 60
70 A.1.3. Survey Population The sample size for the 2006 Retirement Intentions survey was greatly increased from the 2000 survey. As noted above, all agencies with more than 60 employees over the age of 45 years were invited to take part in the survey. In total, 43 agencies participated in this research. Combined, these agencies employ over 95% of all public sector employees 45 years or older. Table 32 lists the 25 larger agencies who employ more than 300 employees 45 years or older, and Table 33 shows the remaining 18 smaller agencies who also participated in the study. All permanent and fixed term contract staff over the age of 45 years employed in these agencies were given the opportunity to complete the survey. Some agencies also included employees under different employment contracts, however this varied across agencies. The total sample size was estimated at over 54,000 employees, compared to 11,050 employees in Table 32: Targeted Employees and Response Rates for Large Agencies Targeted/Sample 31 Responses Department Permanent Other Total Total Rate Education & Training, Dept of 16,267 2,235 18,502 7,380 40% Health, Dept of 12,841 4,158 16,999 5,125 30% Western Australian Police Service 1, , % Corrective Services, Dept of 1, , % Disability Services Commission , % Swan TAFE , % Attorney General, Dept of the % Agriculture and Food, Dept of % Community Development, Dept for % Planning and Infrastructure, Dept for % Challenger TAFE % Central TAFE % Conservation & Land Management, Dept of % Housing & Works, Dept of % Main Roads Western Australia % Fire & Emergency Services Authority % Culture & the Arts, Dept of % Industry & Resources, Dept of % Consumer & Employment Protection, Dept of % Land Information, Dept of % Premier & Cabinet, Dept of the % South West Regional TAFE % Environment, Dept of % Treasury and Finance, Dept of % West Coast TAFE % Total Large Agencies 52,783 17,467 33% Description: Employees targeted from large agencies with total responses and response rates (excluding SES members). Sources: 2006 Retirement Intentions Survey 31 It should be noted that while the report is based on permanent employees and those on fixed term contracts of two years or more, these responses represent the TOTAL responses (excluding SES members) for each agency. 61
71 Table 33: Targeted Employees and Response Rates for Medium to Small Agencies Targeted/Sample 32 Responses Department Permanent Other Total Total Rate Great Southern TAFE % Fisheries, Dept of % Pilbara TAFE % Forest Products Commission % Legal Aid Western Australia % Western Australian Sports Centre Trust % Government Employees Superannuation % Racing and Wagering Western Australia % Lotteries Commission % Country High School Hostels Authority % Central West TAFE % C Y O'Connor College of TAFE % Curriculum Council of Western Australia % Indigenous Affairs, Dept of % Local Government and Regional % Western Australian Tourism Commission % Sport & Recreation, Dept of % Kimberley TAFE % Unknown agency 4 Total Small Agencies 1, % Description: Employees targeted from medium to small agencies with total responses and response rates (excluding SES members). Source: 2006 Retirement Intentions Survey Members of the SES were also targeted as part of this research. A total of 340 members were identified as 45 years or older and therefore eligible to complete the Retirement Intention survey (Table 34). Table 34: Responses by the SES Targeted Responses Rate SES % Description: SES employees targeted, SES responses, and response rates. Sources: 2006 Retirement Intentions Survey A.1.4. Survey Instrument The survey instrument was based on a similar survey conducted by the Department of the Premier and Cabinet in 2000 xv. The Reference Group referred to in Section A.1.2, amended and updated a number of the existing survey questions, although few substantial changes were made to the structure of the 2000 survey questions to allow for comparisons between the two surveys. In addition to these core questions, a number of questions (Q2,3,4,7,9,10iii,10iv,18, and 26) were added to capture employees attitudes toward retirement. A question was also added to the survey in order to identify members of the SES. 32 It should be noted that while the report is based on permanent employees and those on fixed term contracts of two years or more, these responses represent the TOTAL responses (excluding SES members) for each agency.. 62
72 Agencies with more than 300 employees over the age of 45 years were given the option of including up to three additional questions to the survey document. To gather information most relevant to these agencies, the allowable responses to two of the question were also customised. The questions were: Which of the following categories best describes your occupation ; and In what area of agency name are you employed. A.1.5. Survey Implementation The survey was primarily conducted as an online e-survey administered by Data Analysis Australia and hosted on the Data Analysis Australia website. In addition, agencies with more than 300 employees over the age of 45 years were given the option of supplementing the online survey with a scannable paper-based survey. Six of the 25 agencies used the paper-based options. The survey was released in three stages. A small sample of the targeted population was selected to trial the first release of the survey, which was conducted between February and February This release, which piloted the survey, was used to identify problems with the survey document or the implementation of the survey. A report was presented at the end of the first release containing a summary of the piloting process along with the recommendations given by the consultants. xvii. The second phase of the survey was conducted between March and April All agencies except for the Department of Health, the Department of Fisheries and Legal Aid Western Australia were involved in this release. The Department of Education and Training offered the e-survey to a small sample of their staff who had ready access to the Internet during this phase of the research. For various logistic reasons a third release was also conducted between May and May where the agencies that were not ready to administer the survey in the second release were allowed to conduct the survey. This included around 17,000 paper-based surveys sent to employees of the Department of Education and Training as well as approximately 15,000 distributed throughout the Department of Health. A E-Survey Nominated agency representatives were required to send all employees an at the commencement of the survey period. This informed eligible employees of the survey and provided them with a link to the website where the e-survey was hosted. At the commencement of the survey each respondent was given an automatically generated password, enabling the survey to be completed in multiple sessions. Agencies were sent follow up s over the survey period reminding employees of their chance to complete the survey. Data was captured at the time of entry into a database maintained by Data Analysis Australia. 63
73 A Paper Survey Scannable forms were mailed to targeted employees along with an enclosed reply paid or stamped envelope addressed to Data Analysis Australia and an information cover letter. Returned surveys were sent to a scanning company who processed the surveys and returned the responses to Data Analysis Australia in electronic form. A Respondent Assistance A help desk was established by Data Analysis Australia to provide assistance to respondents completing either the paper-based or the online survey. An information website was also established and hosted by the Public Sector Management Division of the Department of the Premier and Cabinet. This provided background information for respondents regarding the intentions of the survey and a link to relevant information. A SES Members Due to the effectiveness of the e-survey it was not considered necessary to conduct a follow up phone interview with SES members, as was done in the 2000 Retirement Intentions survey. A.1.6. Responses In an attempt to maximise the response rate to the survey, the Department of the Premier and Cabinet began an extensive promotion of the survey in the months leading up to its implementation. At the workshops referred to in Section A.1.2, agency representatives were provided with considerable promotional material that could be distributed to employees. These included brochures, posters, sample letters, articles for internal publications as well as a staff information PowerPoint presentation suitable for agency intranets. To assist agencies in targeting areas with poor responses, a response rate webpage was also established. This website provided agencies with live response rates from the e-survey broken down into a number of demographic groups. The intention was that agencies could use this information to focus follow up efforts to encourage employees from underrepresented areas to respond to the survey. The total number of responses (after data cleaning) was 18,373 from a total possible 54,908 employees giving an overall response rate of 33%. Most agencies had excellent response rates. Indeed, 33 of the 43 agencies involved in the research had a final response rate of 25% or greater. Individual agency response rates are provided in Table 32 and Table 33. As noted previously, the Department of the Premier and Cabinet specifically targeted members of the SES. In addition to the promotional material sent to all employees by their agency representatives, SES members were personally contacted via and asked to participate in the research. The final response rate for SES members was 88%, eliminating the need to proceed with a costly phone interview process. 64
74 A.1.7. Data Preparation and Cleaning At the completion of the data collection phase there were four data sets containing responses from the survey: 1. Scanned data from the first release (pilot). 2. E-survey data from the first release (pilot). 3. Scanned data from the second and third releases. 4. E-survey data from the second and third releases. As there were some changes to the survey after the first release it was necessary to ensure that the data from the first release was directly comparable to that of the second and third releases. In addition, due to different technical requirements between the scannable surveys and the e- surveys some recoding of data values was required to integrate the data sets. An extensive data checking process was then applied. During this process surveys were assessed for: 1. Correctness of responses. 2. Consistency of responses between questions. 3. Completeness of the questionnaire. Correctness of responses: A feature of the e-survey was the ability to check responses as respondents were entering the data. Only allowable values could be entered and multiple values could only be entered for questions where this was appropriate. However, as the scanned surveys were completed by the respondents on paper, invalid responses were possible. The majority of these invalid responses occurred as multiple responses to a question that only allowed one response. In this situation the response to that question was considered invalid and the question was considered unanswered. The scannable survey for the Department of Health also included a question where respondents were required to provide a coded response (Question 28). This allowed the possibility of an incorrect value being entered or poor writing being incorrectly interpreted by the scanning process. These surveys were verified on an individual basis to check for appropriateness of the response and either recoded to the correct value or recorded as a missing response where the correct answer was not clear. Consistency of responses between questions: It was possible for an answer to one question to contradict the response to another question. For example, where the planned age of retirement was less than the current age of the respondent. An extensive number of automatic checks were set up to determine inconsistent responses to questions. Many of these checks were incorporated into the e-survey so that respondents were given warning messages when their responses to one question was not consistent with that of a question already answered. However, again this could not be incorporated into the paper-based survey. 65
75 All data was checked for inconsistency and data was either corrected when the obvious response to a question was apparent or recorded as a missing value when it was not clear. Completeness of the questionnaire: A total of 1,633 surveys with a large number of unanswered questions were removed from the data set. Most of these were the result of e- surveys initiated but not commenced. Many of these were likely to be a result of a thorough testing of the e-survey that was performed by some departments after the commencement of the implementation period of the survey (and therefore could not be deleted automatically). There were 1,048 surveys in total that had a minimum of 20 questions (out of a potential 26 questions 33 ) unanswered. The remaining 585 survey responses were deleted because either few or no demographic questions were answered, or few or no timing of retirement questions were answered. Of those deleted, 192 were either on permanent contracts or on fixed term contracts for 2 years or more, 131 were on other contracts and the remaining 1,310 had no employment type specified. A.1.8. Question Responses After the removal of incomplete surveys, it was found that in general a respondent tended to answer all of the questions in the survey. In fact, most questions were answered by at least 97% of respondents. The eleven questions that had lower responses are summarised in Table 35 along with a number of other questions that will be useful for comparative purposes. The lower response rate for the three parts of question 5 regarding flexible work options might be attributable to a poor understanding of the terminology used or a feeling that these options were not applicable to the respondent. The first possibility was dealt with by providing information to respondents regarding the terminology used, however, it is always possible this information was not accessed. 33 To check the number of questions answered all questions except question 10 (superannuation fund) and questions 28 onward (agency specific questions) were used. 66
76 Table 35: Lower Response Rate Questions Lower Response Rate Comparison Questions Question Response Question Response q5e 95% q5f 95% q5h 90% q6b 83% q6a 97% q7b 80% q7a 98% q8b 80% q8a 98% q10ii 85% q10i 99% q10iii 75% q10iv 29% q27 97% q29 96% Description: Questions that had a responses rate less than 97% and questions relevant for comparison. Sources: 2006 Retirement Intentions Survey Questions 6b, 7b and 8b relating to paid employment (ie, outside the public sector) were poorly answered in comparison to their part (a) counterparts. It is possible that this could be due to respondents not wanting to release this information, but it is more likely that respondents were unsure how to answer these questions. It is recommended that for future surveys the format of this question be reviewed making it clear to respondents what is required of them. It is probably best to have separate questions for the various parts. This was identified as a potential problem during the pilot and some modification was made to the setting out of the questions to help alleviate the problem. It is not unexpected that components of question 10 were poorly answered. The question relates to an employee's superannuation and is long and involved. Parts (iii) and (iv) are of less concern as it is possible that respondents who felt this was inapplicable to them chose not to answer the question at all. A.2. Analysis and Interpretation As retirement intentions vary between genders, occupational groups and other characteristics of respondents, any interpretation of the information presented in this report must also take into account the demographic profile of respondents to the survey. Furthermore, in trying to understand the representativeness of the survey results to the whole public sector, it is also important to consider whether the profile of respondents is similar to the actual demographic profile of the whole public sector. In this section, the representativeness of the survey responses for all employees on permanent contracts, fixed term contracts of two years or more and the SES is investigated. Only these employees are explored, as they are the subject of this report and the only groups consistently targeted across all agencies. 67
77 A.2.1. Demographic Comparison Between Respondents and the Workforce: 2000 and From the figures available, it seems that the WA public sector was well represented by the respondents from the 2006 WAPS survey with only the age group being under represented in the survey and an over representation of respondents in the higher salary groups. On the other hand there are considerable differences between the 2000 WAPS Retirement Intentions survey respondents and the 2006 WAPS survey respondents. In 2000, a much greater proportion of the respondents were males compared with those of the The 2006 survey had a higher proportion of respondents from the lowest salary category compared to the 2000 survey. The 2000 survey also showed a greater proportion of respondents were from management, administration and clerical professions than in the 2006 survey. These differences must be considered whenever a comparison between the two survey results is made as they clearly influence the responses of respondents. Table 36: Demographic Profile of Respondents 2000 and 2006 Survey Total Respondents WAPS 2000 Total PS Workforce WAPS 2000 xiii Total Respondents WAPS 2006 Total PS Workforce WAPS 2006 GENDER (n=2,409) (n=33,350) (n=17,003) (n=43,877) Male 55% 41% 37% 37% Female 45% 59% 63% 63% AGE (n=2,409) (n=33,350) (n=16,993) (n=42,970) 45 to 49 years 36% 38% 29% 35% 50 to 54 years 38% 34% 32% 32% 55 to 59 years 19% 19% 26% 23% 60 to 64 years 6% 7% 11% 10% 65 years and over 1% 2% 2% 0% YEARS IN PUBLIC SECTOR (n=2,370) (n=16,953) (n=41,543) Less than 5 years 7% 11% 5 to less than 10 years 11% 14% 10 to less than 15 years 16% 13% 15 to less than 20 years 14% 16% 20 to less than 30 years 32% 28% 30 years or more 20% 18% INCOME (ANNUAL SALARY BEFORE TAX) (n=2,392) (n=32017) (n=16,561) (n=43,821) Category % 43% 42% 45% Category 2 42% 45% 36% 40% Category 3 28% 12% 22% 15% LOCATION OF CURRENT WORKPLACE (n=1,797) (n=33,350) (n=18,085) (n=41,857) Metropolitan Region 77% 79% 73% 75% Peel 3% 2% South West 7% 7% 8% 7% Great Southern Region 5% 5% 4% 3% Wheatbelt 4% 5% Goldfields Area 3% 3% 2% 2% Kimberley 1% 2% Pilbara 2% 2% Gascoyne <0.5% <0.5% Mid West 3% 2% Central Region 4% 3% Northern Region 4% 3% Description: Demographic distribution of respondents on permanent or fixed term contract of 2 years or more, compared to overall distribution of entire workforce. Sources: 2000 Retirement Intentions Survey; 2006 Retirement Intentions Survey; Human Resource Minimum Obligatory Information Requirements For comparison salary categories vary between the surveys to account for inflation. Categories 1, 2 & 3 are <$40,000, $40,000- $60,000 & >60,000 for the 2000 survey, respectively and <$50,000, $50,000-$70,000 & >70,000 for the 2006 survey. 68
78 Table 37: Retirement Intentions 2006 Demographic Profile of Respondents 2000 and 2006 Survey Continued Total Respondents WAPS 2000 Total PS Workforce WAPS 2000 Total Respondents WAPS 2006 Total PS Workforce WAPS 2006 HIGHEST LEVEL OF EDUCATION (n=2,376) (n=16,483) School (Primary or secondary) 25% 27% Trade or technical course 18% 17% Undergraduate / postgraduate degree 57% 56% EMPLOYMENT TYPE (n=2,282) (n=17,037) Permanent 94% 98% Fixed term contract 2 or more years 6% 2% OCCUPATION (n=2,145) (n=216) (n=16,793) (n=43,877) Administration Professionals and Clerical 31% 24% 25% Community and Social Services 2% 4% 9% Education and TAFE 24% 28% 25% Health 14% 17% 17% Management 20% 14% 12% Natural and Physical Science 0% 4% 3% Protective Service Workers 4% 3% 6% All Other 5% 6% 3% Description: Demographic distribution of respondents on permanent or fixed term contract of 2 years or more, compared to overall distribution of entire workforce. Sources: 2000 Retirement Intentions Survey & 2006 Retirement Intentions Survey A.2.2. Profile and Representativeness of Respondents Although the survey respondents show a reasonable representation of the entire public sector it is still necessary to understand the demographic make up of the respondents to give full meaning to the survey results. In the rest of this section the demographic profile of the respondents is explored. A Gender The survey was well responded to by both genders, with females making up 63% of the respondents (Figure 28). This proportion is exactly equal to the estimated demographic profile of the target audience (Table 36). It is important to note that female employees account for a larger proportion (88%) of the part-time workforce. Figure 28: Employment Status by Gender Male Part-time 3% Female Part-time 23% Male Full-time 34% Female Full-time 40% Description: Profile of respondents on perm or fixed term contract of 2 yrs or more by gender and working status. Sources: 2006 Retirement Intentions Survey 69
79 A Age The majority of respondents were aged between 45 years and 59 years (Figure 29). Little difference in the age distribution of respondents was found between genders. Slightly more females were in the year age groups while slightly more males were in the age group. Figure 29: Responses by Age and Gender Number of Responses % 32% 26% 11% 2% No. of Respondents 4,969 5,537 4,351 1, % of Respondents 29% 32% 26% 11% 2% % of Females 30% 33% 25% 10% 2% % of Males 27% 32% 27% 12% 2% Age of Respondents Description: Percentage of respondents and percentage of each gender on permanent or fixed term contract of 2 years or more in each age group. Sources: 2006 Retirement Intentions Survey Employees over the age of 65 years were more likely to be working part time than employees from other age groups. It is also apparent that higher proportions of part time employees in the and age groups. Figure 30: Full-time and Part-Time Respondents by Age 6,000 5,000 No. of Respondents 4,000 3,000 2,000 1, Part-time 1,341 1,296 1, Full-time 3,630 4,233 3,312 1, Age of Respondents Description: Number of full-time and part-time respondents on permanent or fixed term contract of 2 years. Sources: 2006 Retirement Intentions Survey 70
80 A Occupation From Figure 31 it is clear that there is a significant difference between the age distributions of respondents from different occupations. Protective service workers stand out, where 74% of respondents are between years of age as compared to 65% for education, the occupation with the next highest proportion. Figure 31: Age and Occupation 100% 80% 60% 40% 20% Age of Respondents 0% Admin and Clerical Community and Social Services Education and TAFE Health Management Natural and Physical Science Protective Service Workers All Other 65+ 2% 3% 2% 2% 1% 2% 0% 6% % 14% 9% 12% 8% 13% 6% 19% % 27% 24% 24% 27% 28% 20% 27% % 31% 35% 30% 35% 31% 35% 27% % 25% 30% 32% 29% 26% 39% 21% Description: Profile of respondents on permanent or fixed term contract of 2 years or more by age and occupation Sources: 2006 Retirement Intentions Survey Although protective services have a different age demographic to other occupations, they make up a much smaller proportion of the respondents (see Figure 32). A greater number of respondents work in administration and clerical services, education and TAFE, health, and management. Males made up a greater proportion of management (59%), natural sciences (89%), and protective services (86%), whereas females made up greater proportions of education (77%) and health (79%) (Figure 32). Figure 32: Occupation and Gender 5,000 No. of Respondents 4,500 4,000 3,500 3,000 2,500 2,000 1,500 1, Admin and Clerical Community and Social Education and TAFE Health Management Natural and Physical Protective Service All Other Male 1, , , Female 2, ,610 2, Description: Profile of respondents on permanent or fixed term contract of 2 years or more by gender and occupation. Sources: 2006 Retirement Intentions Survey 71
81 A Salaries Respondents from management, natural and physical sciences and protective services tend to be in higher income brackets (see Figure 33). This relationship is apparent in survey responses and care should always be taken when interpreting results. For instance, in Section 4.2 respondents working in management and protective services were more likely to plan for retirement. Whether the tendency to financially plan for retirement is influenced by occupation, by salary levels, or by a combination of these, is unclear from this data. Figure 33: Occupation and Salary Management Admin and Clerical Health Natural and Physical Science Education and TAFE Protective Service Workers Community and Social Services All Other 0% 20% 40% 60% 80% 100% Under $50K $50K-$70K $70K+ Description: Profile of respondents on permanent or fixed term contract of 2 years or more by salary and occupation. Sources: 2006 Retirement Intentions Survey It is also important to note that administration and clerical workers, health and education have a large proportion of employees in the lower income brackets and that these occupations are highly represented in the responses. Salary will also affect responses by different genders. It is clear in Figure 34 that females in general are on lower salaries than males. Although some of this will be related to the fact that the majority of the part time workforce is comprised mainly of females, it is clear that even within different employment categories a greater proportion of males are on higher salaries. 72
82 Figure 34: Gender and Salary 100% 90% 80% 70% 60% 50% 40% 30% 20% 10% 0% Female Part-time Male Part-time Female Full-time Male Full-time $70K+ 2% 21% 16% 43% $50K-$70K 15% 21% 43% 41% Under $50K 83% 58% 41% 16% Description: Profile of respondents on permanent or fixed term contract of 2 years or more by salary, gender and working status. Sources: 2006 Retirement Intentions Survey A Experience within the Public Sector The majority of respondents have in excess of 15 years experience in WAPS which is not surprising considering the survey only targeted employees aged 45 years and older. Male respondents tended to have more WAPS experience with 73% of males having in excess of 15 years experience compared to 57% of females (see Figure 35). Figure 35: Experience in WAPS and Gender No. of Respondents 5,000 4,500 4,000 3,500 3,000 2,500 2,000 1,500 1, Less than 1year Male ,928 1,915 Female 155 1,078 1,704 1,664 2,013 2,817 1,219 Experience (years) Description: Profile of respondents on permanent or fixed term contract of 2 years or more by experience level and gender. Sources: 2006 Retirement Intentions Survey 73
83 A.2.3. Representativeness of the Sample for an Agency Agencies were asked to supply information regarding the survey population targeted for their agency by region and occupation. The demographic distribution of those targeted was compared to the distribution of those who responded to the survey. In Table 38 details of agencies that showed a 10% or higher difference in the proportions of those targeted and those responding within a demographic grouping are given. All agencies except the Disability Services Commission showed a reasonable representation of responses across regional areas of WA. For this agency, it appears that the metropolitan area is over represented in the survey, while the Wheatbelt is under represented. A number of agencies showed unbalanced responses across occupational groups. For the Disability Services Commission for instance, community and social services were under represented. It is possible that this will be related to the under representation of respondents from the Wheatbelt, however based on information available it was not possible to determine this relationship. The WA Police Service showed an over representation of protective service workers while being under represented by their community and social service employees. On the other hand the Fire and Emergency Services Authority was under represented by their protective service workers, while over represented in management. It should therefore be understood that any relationship found for protective service workers are particularly related to the Police Service and are not necessarily representative of Protective Service workers from the Fire and Emergency Services Authority. The Department of Housing and Works responses has an under representation of their administration professionals and clerical employees, while management and the natural and physical sciences were over represented. The survey responses from the Department of the Premier and Cabinet had an over representation of administration professionals and clerical employees yet an under representation of those in management. As seen in Table 32, many of the TAFEs suffered from poor response rates. From Table 38 it is clear that these poor response rates were among employees working in the educational professions. 74
84 Table 38: Under or Over Represented Demographic Groups Agency Demographic % Targeted In Area % Of Responses In Area % Difference Disability Service Commission W A Police Service Fire & Emergency Services Authority Housing & Works Premier & Cabinet Swan TAFE Metropolitan 56% 93% 37% Wheatbelt 38% 1% -37% Community and Social Services 76% 57% -20% Community and Social Services 24% 0% -24% Protective Service Workers 48% 68% 20% Management 12% 38% 25% Protective Service Workers 63% 30% -33% Administration Professionals and Clerical 75% 48% -27% Management 18% 32% 14% Natural and Physical Science 4% 16% 12% Administration Professionals and Clerical 51% 70% 19% Management 41% 27% -14% Administration Professionals and Clerical 23% 35% 12% Education and TAFE 68% 42% -26% Central TAFE Education and TAFE 69% 46% -23% Challenger TAFE West Coast TAFE South West Regional TAFE Education and TAFE 63% 39% -24% Management 4% 16% 12% Administration Professionals and Clerical 30% 46% 16% Education and TAFE 65% 40% -25% Administration Professionals and Clerical 24% 48% 24% Education and TAFE 69% 33% -35% Community Development, Dept of Management 29% 16% -13% Culture & the Arts, Dept of Conservation & Land Management Administration Professionals and Clerical 59% 71% 11% Community and Social Services 11% 1% -11% Management 9% 20% 11% All Other 26% 14% -12% Attorney General Management 14% 25% 12% Description: Occupation and regions within an agency that showed a significant difference between the demographic of the responses to the demographic of those targeted. Source: 2006 Retirement Intentions Survey 75
85 A /07 Federal Budget xvi Effect on Responses The 2006/07 Federal Budget released on May 10, 2006 included proposed changes to superannuation rules. It was hypothesised that these changes influenced responses to survey questions. As the budget announcement occurred during the third release of the survey it was possible to compare results prior and post budget release. It was found that 320 full-time employees of the Department of Health submitted an e-survey after May 10, These were compared with the 89 full-time employees of the Department of Health who responded to the survey before May 9, Question 14, which asked Do you think your superannuation will be adequate for you in retirement?, was chosen to detect the influence of the budget release. It is immediately apparent from Figure 36 that there was an increase (13%) in the proportion of respondents who are unsure whether their superannuation would be sufficient in retirement. Figure 36 also shows that there is an increase in the proportion of both males (11%) and females (15%) who are unsure whether their superannuation would be sufficient in retirement. Figure 36: Percentage of "Unsure" Answers, Pre and Post 2006/07 Federal Budget 100% 90% 80% 70% 60% 50% 40% 30% 20% 30% 43% 25% 40% 36% 47% 10% 0% Total Female Male Pre Post Description: Percentage of respondents by gender who were unsure of whether their superannuation would be adequate in retirement and responded before May 9 th (pre), compared to those who responded after May 9 th (post). Sources: 2006 Retirement Intentions Survey 35 Paper surveys could not be used for this purpose as no definite date can be linked to the responses and few were received prior to this date. There were no significant responses to the e-survey from other departments after this date as all other large agencies were surveyed during the first release. There was only a small group of part time respondents after this date. Within the Health Dept, the three occupations with a sufficient response rate were Administration, Health and Management. As department, occupation and employment type were likely to influence the response to Question 14, this restriction seemed best for comparison purposes. 76
86 Aside from the difference in certainty of the adequacy of superannuation, there was no overall difference in responses to this question after the budget announcement, with 22% of respondents who gave a yes or no answer feeling that their superannuation is adequate in retirement (Figure 37). However, Figure 37 shows, the budget announcement had a different effect on the genders. More woman appear to feel their superannuation will be adequate in retirement (an increase of 7%), while less men felt their income would be adequate in retirement (a decrease of 11%). Figure 37: Percentage of Respondents who were NOT Unsure Answers, Pre and Post 2006/07 Federal Budget 100% 90% 80% 70% 60% 50% 40% 30% 37% 26% 20% 10% 0% Total 22% 22% 19% 12% Female Male Pre Post Description: Percentage of respondents by gender who were not unsure and felt their superannuation would be adequate in retirement and responded before May 9 th compared to that responded after May 9 th. Sources: 2006 Retirement Intentions Survey Unfortunately with only 320 respondents from one agency to use for analysis purposes it is not possible to generalise the effect across different occupations and other demographic groups or extrapolate it to the whole public sector. However, it should be remembered that 11,678 paper-based surveys were received after May 10 with unknown completion dates that potentially have been influenced by the budget announcement. 77

87 B. Survey Document 78

88 79 Retirement Intentions 2006
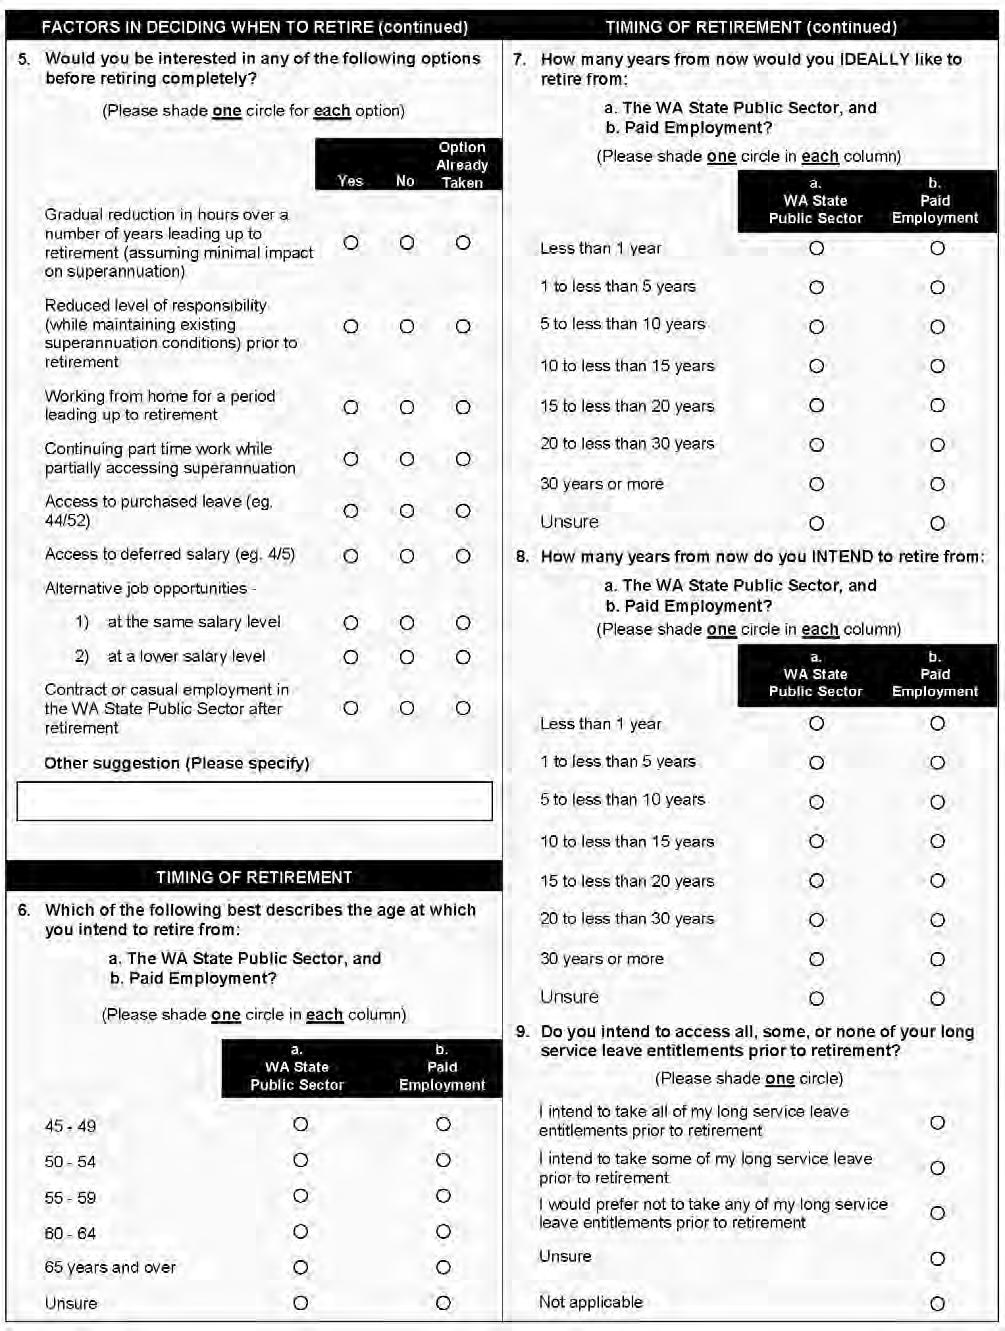
89 80

90 81 Retirement Intentions 2006
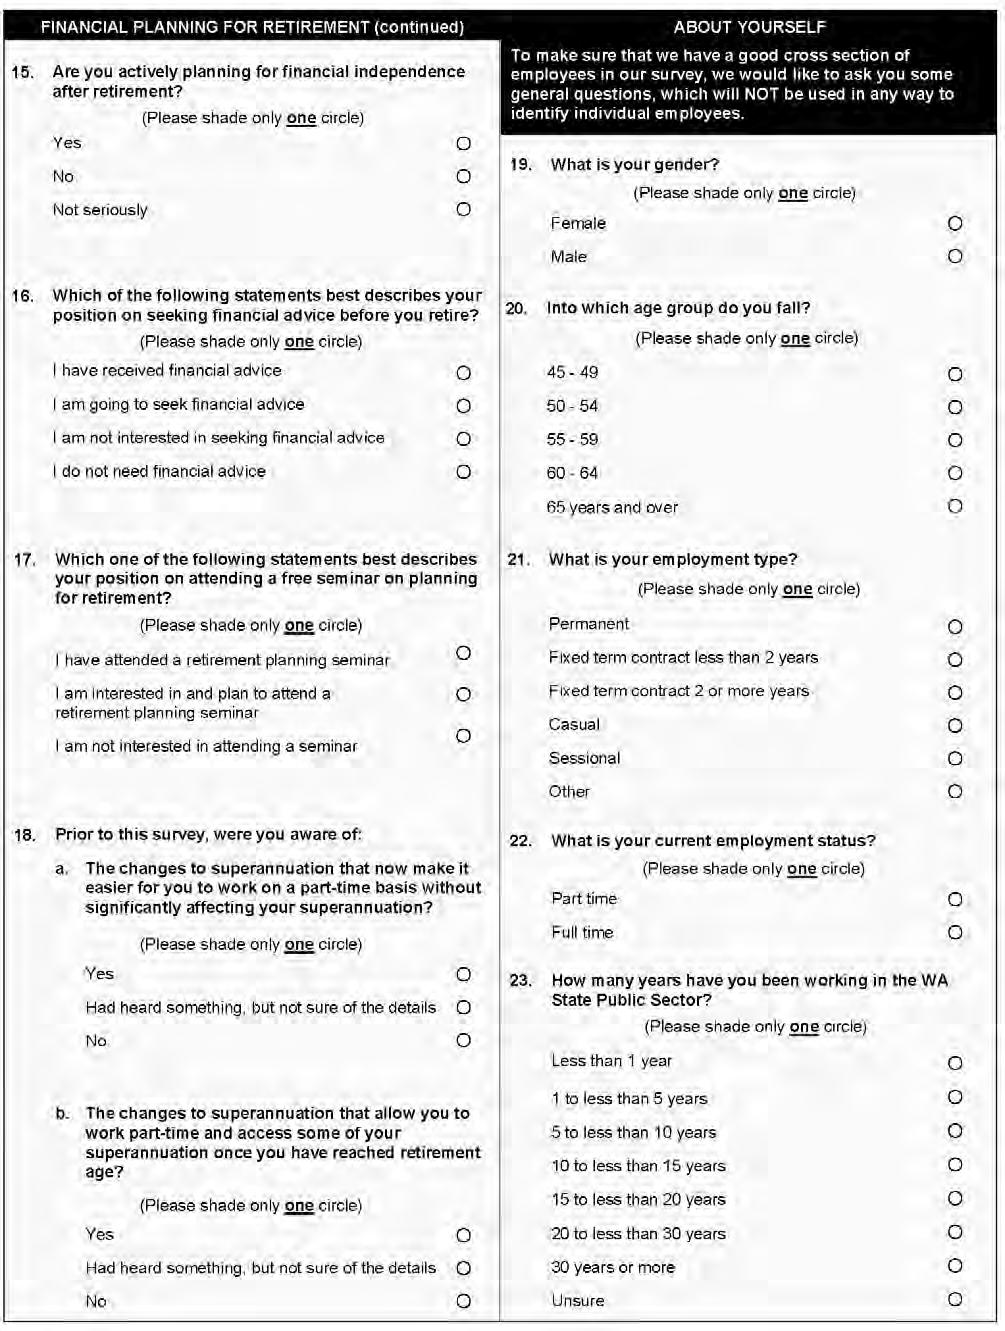
91 82
Superannuation account balances by age and gender
 Superannuation account balances by age and gender October 2017 Ross Clare, Director of Research ASFA Research and Resource Centre The Association of Superannuation Funds of Australia Limited (ASFA) PO
NATIONAL PROFILE OF SOLICITORS 2016 REPORT
 NATIONAL PROFILE OF SOLICITORS 2016 REPORT 24 AUGUST 2017 PREPARED FOR THE LAW SOCIETY OF NEW SOUTH WALES STAFF RESPONSIBLE FOR THIS REPORT WERE: Director Senior Consultant Graphic Designers Project Code
2014 Law Society National Profile
 2014 Law Society National Profile Final Report APRIL 2015 Prepared by Urbis for The Law Society of New South Wales xdisclai mer x STAFF RESPONSIBLE FOR THIS REPORT WERE: Director Senior Consultants Consultant
Business Trends Report
 Business Trends Report June 2014 Introduction The Bankwest Business Trends Report tracks working trends for people that run a business either as an employer or as an own account worker. The report looks
Employment Outlook for. Public Administration and Safety
 Employment Outlook for Contents INTRODUCTION... 3 EMPLOYMENT GROWTH... 4 EMPLOYMENT PROSPECTS... 5 VACANCY TRENDS... 8 WORKFORCE AGEING... 11 EMPLOYMENT BY GENDER AND FULL-TIME/PART-TIME... 13 HOURS WORKED...
The Business of Ageing Update 2015
 INTRODUCTION i The Business of Ageing Update 2015 This report provides an update to the report: Realising the Economic Potential of Older People in New Zealand: 2051 ii THE BUSINESS OF AGEING UPDATE 2015
Employment Outlook for. Administration and Support Services
 Employment Outlook for Administration and Support Services Contents INTRODUCTION... 3 EMPLOYMENT GROWTH... 4 EMPLOYMENT PROSPECTS... 6 VACANCY TRENDS... 9 WORKFORCE AGEING... 11 EMPLOYMENT BY GENDER AND
Superannuation balances of the self-employed
 Superannuation balances of the self-employed March 2018 Andrew Craston, Senior Research Advisor ASFA Research and Resource Centre The Association of Superannuation Funds of Australia Limited (ASFA) PO
NEW STATE AND REGIONAL POPULATION PROJECTIONS FOR NEW SOUTH WALES
 NEW STATE AND REGIONAL POPULATION PROJECTIONS FOR NEW SOUTH WALES Tom Wilson The New South Wales Department of Planning recently published state and regional population projections for 06 to 36. This paper
Charles Sturt An Overview
 Charles Sturt An Overview Evolution of the City and Moving Forward Charles Sturt is one of the oldest local government areas in the State. Our eastern boundaries border on the Adelaide city area, while
Why is understanding our population forecasts important?
 % Population Growth per annum Population Why is understanding our population forecasts important? Understanding the ACT s population growth and its demographic trends, is fundamental to longterm strategic
Submission on the Productivity Commission s commissioned study. Economic Implications of an Ageing Australia
 Submission on the Productivity Commission s commissioned study Economic Implications of an Ageing Australia October 2004 1 About Volunteering Australia Volunteering Australia is the national peak body
Coping with Population Aging In China
 Coping with Population Aging In China Copyright 2009, The Conference Board Judith Banister Director of Global Demographics The Conference Board Highlights Causes of Population Aging in China Key Demographic
Monitoring the Performance
 Monitoring the Performance of the South African Labour Market An overview of the Sector from 2014 Quarter 1 to 2017 Quarter 1 Factsheet 19 November 2017 South Africa s Sector Government broadly defined
Why can t a woman be more like a man gender differences in retirement savings
 The ASFA 2004 National Conference and Super Expo Super: Saving 4 the Nation Adelaide Convention Centre 10-12 November 2004 Why can t a woman be more like a man gender differences in retirement savings
Growth and change. Australian jobs in Conrad Liveris conradliveris.com
 Growth and change Australian jobs in 2018 Conrad Liveris conradliveris.com +61 430 449 116 Executive Summary The labour market is more complex than month-to-month statistical releases. A more meaningful
Baby Boomers and Housing Markets. Presentation by Clare Wall, SGS Associate 7 th National Housing Conference October 2012
 Baby Boomers and Housing Markets Presentation by Clare Wall, SGS Associate 7 th National Housing Conference October 2012 This report has been prepared on behalf of 7th National Housing Conference. SGS
INDIGENOUS DARWIN AND THE REST OF THE NORTHERN TERRITORY
 POPULATION STUDIES RESEARCH BRIEF ISSUE Number 2009026 School for Social and Policy Research 2008 Population Studies Group School for Social and Policy Research Charles Darwin University Northern Territory
Final Report. Cost/Benefit Analysis Relating to the Implementation of a Common School Starting Age and Associated Nomenclature by 1 January 2010
 Final Report Cost/Benefit Analysis Relating to the Implementation of a Common School Starting Age and Associated Nomenclature by 1 January 2010 Volume 3 Appendices Report submitted to the Australian Government
Are retirement savings on track?
 RESEARCH & RESOURCE CENTRE Are retirement savings on track? Ross Clare ASFA Research & Resource Centre June 2007 The Association of Superannuation Funds of Australia ACN: 002 786 290 Po Box 1485 Sydney
RAMS First Home Buyers Pulse Check Survey 2013
 RAMS First Home Buyers Pulse Check Survey 2013 Australian attitudes and behaviours towards buying their first home August 2013 Strictly Embargoed: 12:01am AEST, 23 August 2013 Contents Highlights.....3
Labor Force Participation Rates by Age and Gender and the Age and Gender Composition of the U.S. Civilian Labor Force and Adult Population
 May 8, 2018 No. 449 Labor Force Participation Rates by Age and Gender and the Age and Gender Composition of the U.S. Civilian Labor Force and Adult Population By Craig Copeland, Employee Benefit Research
NSW Long-Term Fiscal Pressures Report
 NSW Long-Term Fiscal Pressures Report NSW Intergenerational Report 2011-12 Budget Paper No. 6 Table of Contents Executive Summary... i Chapter 1: Background to the Report 1.1 Fiscal Sustainability... 1-1
Investment Company Institute and the Securities Industry Association. Equity Ownership
 Investment Company Institute and the Securities Industry Association Equity Ownership in America, 2005 Investment Company Institute and the Securities Industry Association Equity Ownership in America,
2008-based national population projections for the United Kingdom and constituent countries
 2008-based national population projections for the United Kingdom and constituent countries Emma Wright Abstract The 2008-based national population projections, produced by the Office for National Statistics
Exploring the rise of self-employment in the modern economy
 Exploring the rise of self-employment in the modern economy A guide to demographics and other trends in the UK s self-employed workforce in 2017 1 About IPSE IPSE is the largest association of independent
InsightTWO. The Changing Nature of Work in Tasmania INSTITUTE INSIGHTS. Institute for the Study of Social Change. Key findings since 2006:
 02 Insight The Changing Nature of Work in Tasmania Social Change INSTITUTE INSIGHTS InsightTWO The second Institute Insight on the Changing Nature of Work in Tasmania explores how the global transition
State of the Elderly in Singapore
 State of the Elderly in Singapore 2008/2009 Release 2: Employment and Incomes and Assets Contents Chapter 3 Employment and Incomes and Assets...3 A. Employment...3 Economic Activity Status...3 Labour Force
AIST. 22 October Sex Discrimination Commissioner Australian Human Rights Commission Level 3, 175 Pitt St SYDNEY NSW 200. Dear Ms Broderick,
 22 October 2012 Sex Discrimination Commissioner Australian Human Rights Commission Level 3, 175 Pitt St SYDNEY NSW 200 Dear Ms Broderick, Application by Rice Warner Thank you for the opportunity to comment
2005 Survey of Owners of Non-Qualified Annuity Contracts
 2005 Survey of Owners of Non-Qualified Annuity Contracts Conducted by The Gallup Organization and Mathew Greenwald & Associates for The Committee of Annuity Insurers 2 2005 SURVEY OF OWNERS OF NON-QUALIFIED
NEW ZEALAND PATHOLOGIST WORKFORCE STUDY 2018
 New Zealand Pathologist Workforce Study 2018 NEW ZEALAND PATHOLOGIST WORKFORCE STUDY 2018 WORKFORCE PROFILE AND TRENDS The New Zealand Pathologist workforce has shown significant growth between 2011 and
An Economic Portrait of Eastern Riverina
 An Economic Portrait of Eastern Riverina compared with NSW September 2013 The residents Working residents Economic indicators Industries The Eastern Riverina workforce The nature of local jobs The labour
Short- Term Employment Growth Forecast (as at February 19, 2015)
") Background According to Statistics Canada s Labour Force Survey records, employment conditions in Newfoundland and Labrador showed signs of weakening this past year. Having grown to a record level high
Background According to Statistics Canada s Labour Force Survey records, employment conditions in Newfoundland and Labrador showed signs of weakening this past year. Having grown to a record level high
AusIMM Professional Employment Survey October 2015
 AusIMM Professional Employment Survey 2015 October 2015 1 Table of contents Section Page Introduction 3 Respondent demographics 4 The unemployed 12 The employed 23 Future outlook 27 Students 33 2 Introduction
Australian Public Service Commission Research Insight APS Workforce Trends
 Australian Public Service Commission Research Insight 4-12 APS Workforce Trends Alastair Warren Elyse Allan Heather Earl Leah Solomon Tegan Wone Tony Cotton November 2012 APS Workforce Trends Alastair
Women in the Labor Force: A Databook
 Cornell University ILR School DigitalCommons@ILR Federal Publications Key Workplace Documents 12-2011 Women in the Labor Force: A Databook Bureau of Labor Statistics Follow this and additional works at:
GAO GENDER PAY DIFFERENCES. Progress Made, but Women Remain Overrepresented among Low-Wage Workers. Report to Congressional Requesters
 GAO United States Government Accountability Office Report to Congressional Requesters October 2011 GENDER PAY DIFFERENCES Progress Made, but Women Remain Overrepresented among Low-Wage Workers GAO-12-10
Financial Implications of an Ageing Population
 Financial Implications of an Ageing Population Presentation to Aged & Community Care Victoria s State Congress and Trade Exhibition Saul Eslake Chief Economist ANZ Flemington Racecourse Melbourne 25 th
Trends in union membership in Australia
 RESEARCH PAPER SERIES, 2018 19 15 OCTOBER 2018 Trends in union membership in Australia Geoff Gilfillan and Chris McGann Statistics and Mapping Section Executive summary The number of union members in Australia
Giving, Volunteering & Participating
 2007 CANADA SURVEY OF Giving, Volunteering & Participating Lindsey Vodarek David Lasby Brynn Clarke Giving and Volunteering in Québec Findings from the Canada Survey of Giving, Volunteering, and Participating
Women in the Labor Force: A Databook
 Cornell University ILR School DigitalCommons@ILR Federal Publications Key Workplace Documents 12-2010 Women in the Labor Force: A Databook Bureau of Labor Statistics Follow this and additional works at:
ALLIANCE FACT SHEET. Who will be affected by the denial of cash franking credit refunds?
 ALLIANCE FACT SHEET The ALP s policy to remove cash refunds on franking credits was according to Bill Shorten targeted at the wealthiest 10% of SMSFs i. As analysis of ATO data and the Treasury ii reveals,
Analysis MySuper vs Choice
 Analysis MySuper vs Choice Australian Institute of Superannuation Trustees 11 September 2018 SYDNEY MELBOURNE ABN 35 003 186 883 Level 1 Level 20 AFSL 239 191 2 Martin Place Sydney NSW 2000 303 Collins
Toward Active Participation of Women as the Core of Growth Strategies. From the White Paper on Gender Equality Summary
 Toward Active Participation of Women as the Core of Growth Strategies From the White Paper on Gender Equality 2013 Summary Cabinet Office, Government of Japan June 2013 The Cabinet annually submits to
Older Workers: Employment and Retirement Trends
 Cornell University ILR School DigitalCommons@ILR Federal Publications Key Workplace Documents September 2005 Older Workers: Employment and Retirement Trends Patrick Purcell Congressional Research Service
Research notes Basic Information on Recent Elderly Employment Trends in Japan
 Research notes Basic Information on Recent Elderly Employment Trends in Japan Yutaka Asao The aim of this paper is to provide basic information on the employment of older people in Japan over the last
The Impact of Demographic Change on the. of Managers and
 The Impact of Demographic Change on the Future Availability of Managers and Professionals in Europe Printed with the financial support of the European Union The Impact of Demographic Change on the Future
Public sector defined contribution plans. Retirement in review, 2012:
 Retirement in review, 2012: Public sector defined contribution plans Looking at Defined Contribution plans and participants in Public Sector workplaces: State and Local Goverment Higher Education K-12
BANKWEST CURTIN ECONOMICS CENTRE INEQUALITY IN LATER LIFE. The superannuation effect. Helen Hodgson, Alan Tapper and Ha Nguyen
 BANKWEST CURTIN ECONOMICS CENTRE INEQUALITY IN LATER LIFE The superannuation effect Helen Hodgson, Alan Tapper and Ha Nguyen BCEC Research Report No. 11/18 March 2018 About the Centre The Bankwest Curtin
2016 SKILLS SURVEY RESULTS
 SKILLS SURVEY RESULTS TABLE OF CONTENTS ABOUT CONSULT AUSTRALIA INTRODUCTION RESULTS 1 What is the current skills situation at your firm? 3 2 What actions/strategies will you take in the next 12 months?
SOCIAL WELFARE STRATEGY
 SOCIAL WELFARE STRATEGY ACTU Congress September 1989 1. INTRODUCTION 1.1 The post 1983 Accord Process has enabled the union movement, through participation in government, to play a significant role in
Workforce participation of mature aged women
 Workforce participation of mature aged women Geoff Gilfillan Senior Research Economist Productivity Commission Productivity Commission Topics Trends in labour force participation Potential labour supply
australia Statistical Profile introduction to australia australia statistical profile no.14 november 2009
 australia australia australia Statistical Profile Tia Di Biase, Joanne Goodall, Annie Chen and Philip Taylor introduction to australia Australia Papua New Guinea About this Statistical Profile Organizations
The Province of Prince Edward Island Employment Trends and Data Poverty Reduction Action Plan Backgrounder
 The Province of Prince Edward Island Employment Trends and Data Poverty Reduction Action Plan Backgrounder 5/17/2018 www.princeedwardisland.ca/poverty-reduction $000's Poverty Reduction Action Plan Backgrounder:
Employment, Industry and Occupations of Inuit in Canada,
 Employment, Industry and Occupations of Inuit in Canada, 1981-2001 Inuit Tapiriit Kanatami and Research and Analysis Directorate January, 2007 Research Project Manager: Sacha Senécal, Strategic Research
EMPLOYEE OUTLOOK. Winter EMPLOYEE VIEWS ON WORKING LIFE FOCUS. Employee attitudes to pay and pensions
 EMPLOYEE OUTLOOK EMPLOYEE VIEWS ON WORKING LIFE Winter 2016 17 FOCUS Employee attitudes to pay and pensions The CIPD is the professional body for HR and people development. The not-for-profit organisation
Profile of the Francophone Community in CHAMPLAIN 2010
 Profile of the Francophone Community in CHAMPLAIN 2010 Table of Contents Introduction... 4 Highlights of the Francophone Community in Champlain... 5 Champlain Area Map... 7 Demographics... 8 Overview...
Environment Expenditure Local Government
 46.0 46.0 ENVIRONMENT EXPENDITURE, LOCAL GOVERNMENT, AUSTRALIA 000 0 Environment Expenditure Local Government Australia 000 0 4600007005 ISSN 444-390 Recommended retail price $4.00 Commonwealth of Australia
NCVER AUSTRALIAN VOCATIONAL EDUCATION AND TRAINING STATISTICS. Financial information 2002
 NCVER AUSTRALIAN VOCATIONAL EDUCATION AND TRAINING STATISTICS Financial information 2002 2002 2003 Australian National Training Authority Australian vocational education & training statistics: Financial
Gender Pay Differences: Progress Made, but Women Remain Overrepresented Among Low- Wage Workers
 Cornell University ILR School DigitalCommons@ILR Federal Publications Key Workplace Documents 10-2011 Gender Pay Differences: Progress Made, but Women Remain Overrepresented Among Low- Wage Workers Government
Demographics Working arrangements Vacancies Retirement intentions Wellbeing GP income
 THE ROYAL NEW ZEALAND COLLEGE OF GENERAL PRACTITIONERS 2018 general practice workforce survey Demographics Working arrangements Vacancies Retirement intentions Wellbeing GP income 1 PART Published by The
WHO S LEFT TO HIRE? WORKFORCE AND UNEMPLOYMENT ANALYSIS PREPARED BY BENJAMIN FRIEDMAN JANUARY 23, 2019
 JANUARY 23, 2019 WHO S LEFT TO HIRE? WORKFORCE AND UNEMPLOYMENT ANALYSIS PREPARED BY BENJAMIN FRIEDMAN 13805 58TH STREET NORTH CLEARNWATER, FL, 33760 727-464-7332 Executive Summary: Pinellas County s unemployment
Older Workers: Employment and Retirement Trends
 Cornell University ILR School DigitalCommons@ILR Federal Publications Key Workplace Documents 9-15-2008 Older Workers: Employment and Retirement Trends Patrick Purcell Congressional Research Service; Domestic
TSB Community Trust: Research Overview 2014
 TSB Community Trust: Research Overview 2014 1 P a g e Revised Version Final 1.1 This version of the Final report 1.1 is the current version of the TSB Community Trust Census 2013 Report. Revised in September
Estimating Internet Access for Welfare Recipients in Australia
 3 Estimating Internet Access for Welfare Recipients in Australia Anne Daly School of Business and Government, University of Canberra Canberra ACT 2601, Australia E-mail: anne.daly@canberra.edu.au Rachel
High risk worker cohorts
 MONASH MEDICINE, NURSING & HEALTH SCIENCES High risk worker cohorts Dr Shannon Gray Post-doctoral Research Fellow, Insurance Work and Health Group, Faculty of Medicine Nursing and Health Sciences, Monash
Overview - State Tax Review Discussion Paper
 Overview - State Tax Review Discussion Paper FEBRUARY 2015 WWW.YOURSAY.SA.GOV.AU Why Are We Reviewing Our State Tax System? South Australia is already a great place to live and we value that as a community.
AUGUST THE DUNNING REPORT: DIMENSIONS OF CORE HOUSING NEED IN CANADA Second Edition
 AUGUST 2009 THE DUNNING REPORT: DIMENSIONS OF CORE HOUSING NEED IN Second Edition Table of Contents PAGE Background 2 Summary 3 Trends 1991 to 2006, and Beyond 6 The Dimensions of Core Housing Need 8
Focus On: The Age of the NHS Wales Workforce 2015
 Partneriaeth Cydwasanaethau Gwasanaethau r Gweithlu, Addysg a Datblygu Shared Services Partnership Workforce, Education and Development Services Focus On: The Age of the NHS Wales Workforce 2015 GIG NHS
Insurance Council of Australia Home & Motor Insurance. April 2016 Job number: 16009
 Insurance Council of Australia Home & Motor Insurance April 2016 Job number: 16009 Sections of this report Section Page # Research background and methodology 3 Home insurance 5 Top 5 findings 9 Attitudes
DISPOSABLE INCOME INDEX
 DISPOSABLE INCOME INDEX Q1 2018 A commissioned report for Scottish Friendly CREDIT CARD 1234 5678 9876 5432 JOHN SMITH Executive summary The Scottish Friendly Disposable Income Index uses new survey data
Socio-economic Series Long-term household projections 2011 update
 research highlight October 2011 Socio-economic Series 11-008 INTRODUCTION This Research Highlight presents an update of the projections of household growth for Canada reported in the 2009 Canadian Housing
CONSTITUENCY PROFILE: DUBLIN SOUTH-WEST
 CONSTITUENCY PROFILE: DUBLIN SOUTH-WEST CONTENTS Introduction 2 Glossary 3 Demographics 4 Families 8 Education 10 Employment 12 Households and housing 16 Voting and turnout 20 This profile is based on
Populations: an Introduction to Demography. Population Trends In Canada
 Populations: an Introduction to Demography Population Trends In Canada Demography Demography is the study of populations over time and over place. The three major components of demography are: (1) mortality,
Legal Services in BC. Final Report. Nobody s Unpredictable. September 2009
 Legal Services in BC Final Report September 2009 Nobody s Unpredictable Table of Contents EXECUTIVE SUMMARY 3 BACKGROUND, OBJECTVES AND METHODOLOGY 10 Background 11 Objectives 12 Research Methodology 13
Pensions for Longer Life. Linking Australia's pension age with life expectancy. David Knox CEDA INFORMATION PAPER 89
 Pensions for Longer Life Linking Australia's pension age with life expectancy David Knox CEDA INFORMATION PAPER 89 About this paper Information Paper 89 Pensions for Longer Life: Linking Australia's pension
Ageing and jobs in Adelaide - North
 Ageing and jobs in Adelaide - North Given the considerable movement of labour and employment within and around regions, the City of Playford and Adelaide - North labour markets and policies are inextricably
Alternative methods of determining the number of House of Representatives seats for Australia s territories
 AUSTRALIAN POPULATION STUDIES 2017 Volume 1 Issue 1 pages 13 25 Alternative methods of determining the number of House of Representatives seats for Australia s territories Tom Wilson* Charles Darwin University
Manchester Jewish Housing Association : A study of the housing needs of the Jewish communities in Greater Manchester : Executive summary
 Manchester Jewish Housing Association : A study of the housing needs of the Jewish communities in Greater Manchester : Executive summary Scullion, LC and Steele, A Title Authors Type URL Published Date
National Consumer Perceptions Survey 2012
 National Consumer Perceptions Survey 2012 About ACCAN The Australian Communications Consumer Action Network (ACCAN) is the peak body that represents all consumers on communications issues including telecommunications,
MYOB Australian Small Business Survey
 MYOB Australian Small Business Survey July 2008 Small Business Survey Report Prepared for MYOB Australia MYOB Contact: Naomi Helleren Tel: (03) 9222 9951 Email: naomi.helleren@myob.com Web: www.myob.com.au
Rise of the Grudge Workforce
 Rise of the Grudge Workforce A research report November 2013 Introduction A quarter of Australia s Baby Boomers say they will be working into their 80s because they don t have enough money for retirement,
Is the Credit Rating Tail Wagging the Budgetary Dog? - preliminary Analysis of the South Australian Budget
 4 Is the Credit Rating Tail Wagging the Budgetary Dog? - preliminary Analysis of the South Australian Budget 2010-11 John Spoehr Barry Burgan with assistance from Julian Morrison and Lisa Rippin EconSearch
Women in the Labor Force: A Databook
 Cornell University ILR School DigitalCommons@ILR Federal Publications Key Workplace Documents 9-2007 Women in the Labor Force: A Databook Bureau of Labor Statistics Follow this and additional works at:
Government health expenditure and tax revenue
 Health Expenditure Government health expenditure and tax revenue 21 16 $ The Australian Published May 218 Government spent 27.% of taxation revenue on health in 21 16 This report looks at how health expenditure
Saving Tomorrow. The saving and spending patterns of Australians
 Saving Tomorrow The saving and spending patterns of Australians AMP.NATSEM Income and Wealth Report Issue 25 - APRIL 2010 C O N T E N T S Foreword 1 Introduction 3 The big picture 5 Best and worst savers
Superannuation: the Right Balance?
 FINANCIAL ADVISORY SERVICES Superannuation: the Right Balance? November 2004 Contents FINANCIAL ADVISORY SERVICES Superannuation: the Right Balance? November 2004 i Financial Advisory Services CPA Australia
Guernsey Quarterly Population, Employment and Earnings Bulletin
 Guernsey Quarterly Population, Employment and Earnings Bulletin 31st December 2015-30th June 2016 Issue date 28th October 2016 The Guernsey Quarterly Population, Employment and Earnings Bulletin provides
EBRI EMPLOYEE BENEFIT RESEARCH INSTITUTE
 T-107 EBRI EMPLOYEE BENEFIT RESEARCH INSTITUTE Testimony of Dallas L. Salisbury President, Employee Benefit Research Institute (EBRI) Chairman, American Savings Education Council (ASEC) Before The House
Average income from employment in 1995 was
 Abdul Rashid Average income from employment in 1995 was $26,500. It varied widely among different occupations, from $4,300 for sports officials and referees to $120,600 for judges (Statistics Canada, 1999).
WOMEN'S CURRENT PENSION ARRANGEMENTS: INFORMATION FROM THE GENERAL HOUSEHOLD SURVEY. Sandra Hutton Julie Williams Steven Kennedy
 WOMEN'S CURRENT PENSON ARRANGEMENTS: NFORMATON FROM THE GENERAL HOUSEHOLD SURVEY Sandra Hutton Julie Williams Steven Kennedy Social Policy Research Unit The University of York CONTENTS Page LST OF TABLES
16 November 2018 AUSTRALIAN ECONOMIC DEVELOPMENTS
 16 November 2018 AUSTRALIAN ECONOMIC DEVELOPMENTS Australia s labour market continues to expand strongly in 2018. Jobs growth seems to be stronger than had been anticipated by the RBA, Government and financial
Prudential Retirement s Fifth Annual Workplace Report on Retirement Planning
 Prudential Retirement s Fifth Annual Workplace Report on Retirement Planning Quantitative research with America s youngest and oldest workers to test attitudes about the new auto-pilot retirement plans.
Retirement in review: A look at 2012 defined contribution participant experience*
 Retirement in review: A look at 2012 defined contribution participant experience* * Based on a Voya Financial analysis of 5.1 million participants in Voya -administered Defined Contribution plans for Government,
The benefits of an ageing population
 THE AUSTRALIA INSTITUTE The benefits of an ageing population Judith Healy Australian National University Discussion Paper Number 63 March 2004 ISSN 1322-5421 ii The Australia Institute This work is copyright.
Labour. Labour market dynamics in South Africa, statistics STATS SA STATISTICS SOUTH AFRICA
 Labour statistics Labour market dynamics in South Africa, 2017 STATS SA STATISTICS SOUTH AFRICA Labour Market Dynamics in South Africa 2017 Report No. 02-11-02 (2017) Risenga Maluleke Statistician-General
Report on the Findings of the Information Commissioner s Office Annual Track Individuals. Final Report
 Report on the Findings of the Information Commissioner s Office Annual Track 2009 Individuals Final Report December 2009 Contents Page Foreword...3 1.0. Introduction...4 2.0 Research Aims and Objectives...4
Employment Outlook to November 2019
 Employment Outlook to November 2019 Based on the Department of Employment s 2015 employment projections Table of Contents Table of Contents... 1 Introduction... 2 Projected employment growth by industry...
Women in the Labor Force: A Databook
 Cornell University ILR School DigitalCommons@ILR Federal Publications Key Workplace Documents 2-2013 Women in the Labor Force: A Databook Bureau of Labor Statistics Follow this and additional works at:
Retirement Readiness. A Comparative Analysis of Australia, the United Kingdom & the United States. October 2017
 Retirement Readiness A Comparative Analysis of Australia, the United Kingdom & the United States October 2017 RETIREMENT READINESS: A Comparative Analysis 1 Retirement Readiness A Comparative Analysis