Measuring Inequality and Poverty in the United States: Challenges and Opportuni;es in the Interna;onal Context
|
|
|
- Dustin Dawson
- 5 years ago
- Views:
Transcription
1 Measuring Inequality and Poverty in the United States: Challenges and Opportuni;es in the Interna;onal Context Trudi Renwick Assistant Division Chief Economic Characteris9cs Social, Economic and Housing Sta9s9cs Division U.S. Census Bureau June 28, 2018 The views expressed in this presenta0on are solely those of the author and do not necessarily reflect the official posi0ons or policies of the U.S. Census Bureau.
2 Outline Measurement of poverty and inequality in the United States Concepts and measures Sources of data Public access to inequality data Involvement in interna9onal ini9a9ves SDG 2030 Working Groups and Repor9ng PlaQorm Par9cipa9on in the UNECE Expert Group on Income and Poverty Annual conferences Guide on poverty measurement Working group on disaggrega9on of poverty sta9s9cs Contribute to the OECD interna9onal data base 2


3 Two basic dimensions of economic inequality Separate but inter-related: income and wealth Source: Pew Research Center 3
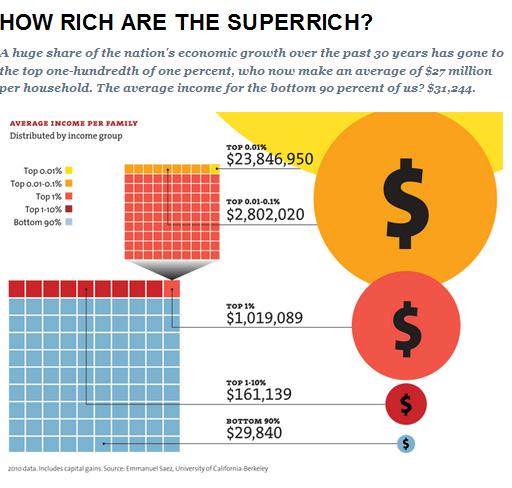
4 Economic inequality metrics Single index numbers to describe inequality (e.g. Gini index) that allow comparisons across 9me and geography Descrip9ons of the income/wealth distribu9on Income amounts that define points in the income distribu9on, e.g. the middle, the top 5%, the top 1% Share of wealth, income or income growth received by each fi]h of the popula9on Ra9os of the cutoffs for groups e.g. Income amount that define the top quin9le divided by the bo`om quin9le cutoff Poverty rates, poverty gaps, income to poverty ra9os Size and/or well-being of the middle class Mobility likelihood of moving up or down the income distribu9on 4
 Other index numbers reported by the Census Bureau: Theil index (0.425) Mean logarithmic devia9on of income (0.")
5 Income inequality indices GINI index (2016=0.481) Most commonly used measure. Area between the Lorenz curve and hypothe9cal line of absolute equality. (0 perfect equality, 1 perfect inequality) Other index numbers reported by the Census Bureau: Theil index (0.425) Mean logarithmic devia9on of income (0.601) Atkinson measures (0.103, 0.201, 0.306) 5

6 Descrip;ons of the income distribu;on Examine income cutoffs for each segment of the distribu9on: lowest quin9le, median, highest quin9le, 95 th percen9le Ra9o of two cutoffs, th /10 th = th /20 th =
7 Inequality measures based on shares Shares of aggregate income received by each quin9le Some analyses look at the share of growth by quin9le SDG 10.1 indicator is growth of per capita income of the bo`om 40 percent compared to per capita income growth of the total popula9on Share of Income by Quintile: ,5 22,9 14,2 8,3 3,1 Lowest 2nd Middle 4th Highest Source: Current Popula9on Survey Annual Social and Economic Supplement 7
8 Poverty measures Poverty official or supplemental poverty measures Head count how many people have income below the poverty thresholds? Poverty gap what is the difference between the poverty thresholds and income for those in poverty Income-to-poverty ra9os how many people have income below 50% of poverty thresholds; below 125% of poverty thresholds, etc. Mul9-dimensional poverty expand concept beyond income to include health, housing, neighborhoods, educa9onal opportuni9es, employment, etc. 8

 Note: Green = More Upward Mobility, Red = Less Upward Mobility Source: : h`p://www.equality-of-opportunity.")
9 The Geography of Upward Mobility in the United States Average Individual Income for Males with Parents Earning $25,000 (25 th percentile) Salt Lake City $31.2k Sea`le $27.6k Dubuque $31.7k Cleveland $24.6k San Francisco Bay Area $28.8k Newark $30.1k Washington DC $27.8k Los Angeles $27.6k Atlanta $23.1k Charlo`e $22.5k 56.9 ($34.5k) 49.0 ($27.6k) 42.9 ($22.8k) Note: Green = More Upward Mobility, Red = Less Upward Mobility Source: : h`p:// Race and Economic Opportunity in the United States: An Intergenera9onal Perspec9ve
 Black Men White Men Boston $24k Newark $20k Boston $31k Newark $32k San Francisco $19k Atlanta $18k San Francisco $31k")
 Note: Green = More Upward Mobility, Red = Less Upward Mobility; Grey = Insufficient Data Source: : h`p://www.")
10 Two Americas: The Geography of Upward Mobility by Race Average Individual Income of Males with Parents Earning $25,000 (25 th percentile) Black Men White Men Boston $24k Newark $20k Boston $31k Newark $32k San Francisco $19k Atlanta $18k San Francisco $31k Atlanta $26k <36.5 ($17k) 45.8 ($25k) >56.9 ($35k) Note: Green = More Upward Mobility, Red = Less Upward Mobility; Grey = Insufficient Data Source: : h`p:// Race and Economic Opportunity in the United States: An Intergenera9onal Perspec9ve
![How to measure resources? Income vs. wealth vs. consump9on vs. earnings Measurement concerns A]er tax payments and tax credits Include the value of noncash benefits e.g. SNAP, housing assistance Include value of health insurance?](/docs-images/82/85288383/images/11-0.jpg "Adjust for differences in family size equivalence adjustment Adjust for geographic differences in the cost of living Source: U.S. Census Bureau 11")
11 How to measure resources? Income vs. wealth vs. consump9on vs. earnings Measurement concerns A]er tax payments and tax credits Include the value of noncash benefits e.g. SNAP, housing assistance Include value of health insurance? Adjust for differences in family size equivalence adjustment Adjust for geographic differences in the cost of living Source: U.S. Census Bureau 11
12 U.S. Poverty by Different Poverty Measures: ,7 Percentage of People in Poverty by Different Poverty Measures: 2016 (In Percent) 18,0 15,2 14,0 Official Poverty SPM Consump9on 14,5 13,3 11,6 9, ,0 4,1 2,8 2,2 0 All people Under 18 years 18 to 64 years 65 years and over Sources: Official and Supplemental Poverty Measure, 2017 Annual Social and Economic Supplement. Consump9on poverty es9mates from American Enterprise Ins9tute, Annual Report on U.S. Consump9on Poverty:
13 Gini Index 2014 OECD - Disposable Income 0,394 CBO: After-Tax 0,44 Census Bureau: Equivalence Adjusted Income 0,464 Census Bureau: Money Income 0,48 13
14 Sources of Data Household surveys: CPS ASEC na9onal data, long 9me series American Community Survey smaller geographies Survey of Income and Program Par9cipa9on - wealth Consumer Expenditure Survey - consump9on Federal Reserve Survey of Consumer Finances - wealth Administra9ve Data IRS Sta9s9cs of Income sample of tax returns Bureau of Economic Analysis Per capita income Gross domes9c product 14
15 How we disseminate data Reports Websites Table packages Infographics Maps Tools Microdata files Applica9on Programming Interface
16 Interna;onal Ini;a;ves 16

17 SDG 2030 hpps://sdg.data.gov/ 17

18 18

19 19

20 20
21 21
22 UNECE Expert Task Force on Poverty and Inequality Annual mee9ngs with other poverty and inequality measurement experts: Geneva 2016 Montenegro 2017 Vienna 2018 Opportunity to share experiences and challenges with colleagues from many different countries Other interna9onal ini9a9ves: UN Expert Group Mee9ng on Time Use Sta9s9cs OECD/OCDE data base Eurostat/OECD Expert Group on Income, Consump9on and Wealth 22

23 Guide on Poverty Measurement Chapter 1 Introduc9on Chapter 2 Overview of poverty and related concepts Chapter 3 Income and consump9on expenditure measures Chapter 4 Non-monetary depriva9ons Chapter 5 Mul9- dimensional poverty Chapter 6 Challenges for the future 23
24 Task Force on Disaggregated Poverty Measures Introduc9on: measurement of poverty for policy relevant target groups Standard core variables for disaggrega9on Addressing coverage problems in poverty measurement Improving response rates and sampling precision for target groups Improving accuracy of measurement Summary of recommenda9ons on the produc9on, analysis and dissemina9on of disaggregated indicators Topics for further work 24

25 OECD/OCDE Contribute to the OECD Database
26 Contact Informa;on Trudi Renwick U.S. Census Bureau
27 Government Reports on Income and Wealth Inequality: Census Bureau: Income and Poverty in the United States (September 2017). h`ps:// Congressional Budget Office: The Distribu9on of Household Income and Federal Taxes, 2014 (November 2014). Combines Census and SOI data. h`ps:// Internal Revenue Service - Individual Income Tax Return (Form 1040) Sta9s9cs. (Spring 2015). h`p:// Joint Economic Commi`ee: Income Inequality in the United States (January 2014). h`p:// U.S. Department of Commerce: Middle Class in America (January 2010). h`p:// Board of Governors of the Federal Reserve System: Report on the Economic Well-Being of U.S. Households in 2017 (May 2018). h`ps:// Bureau of Labor Sta9s9cs: A look at pay at the top, the bo`om, and in between (May 2015). h`p:// 27
28 International Reports on Income and Wealth Inequality: Organiza9on for Economic Coopera9on and Development (OECD) In It Together Why Less Inequality Benefits All. h`p:// The World Bank, Taking on Inequality: Poverty and Shared Prosperity 2016 h`p:// World Inequality Lab, World Inequality Report, 2018 h`p://wir2018.wid.world/files/download/wir2018-full-report-english.pdf 28
29 Tables: Census Bureau income and poverty websites. Include detailed tables for each year and historical tables h`ps:// Internal Revenue Service Sta9s9cs of income h`p:// Bureau of Economic Analysis Personal income h`p:// Bureau of Labor Sta9s9cs Consumer expenditures h`ps:// 29
30 Census Bureau Data Tools: American FacQinder ACS Data h`p://facqinder.census.gov/faces/nav/jsf/pages/index.xhtml Median household/family income Poverty rates/gini coefficients CPS ASEC Table Creator h`p:// Customize income defini9ons Poverty rates/median income Small Area Income and Poverty Es9mates h`ps:// Poverty rates by county h`p:// Census Applica9on Programming Interface (API) h`p:// 30
31 Inequality Maps: h`p:// h`p:// h`p:// h`p:// h`p:// h`p:// 31
32 Infographics: h`p:// h`p:// h`ps:// h`p:// h`p://budgetandpolicy.org/schmudget/infographic-income-inequality-is-pulling-washingtonstate-apart h`p://randycoffeyillustra9on.com/wp-content/uploads/the-distribu9on-of-wealth-in-theu.s.pdf h`p:// h`p://visual.ly/inequality-wealth 32
33 Inequality Related Websites: h`p://inequality.is/real (Economic Policy Ins9tute) h`p://inequality.org h`p:// h`p://wealthinequality.org/ h`p:// 33


34 34

35 35


36 36


37 37


38 38


39 39

40 40


41 41


42 42


43 43


44 44
Data disaggregated by income and/or other dimensions of poverty
 ESA/STAT/AC.320/8 Expert Group Meeting on Data Disaggregation 27-29 June 2016 New York Data disaggregated by income and/or other dimensions of poverty By Leonardo Athias 2016 Expert Group Mee,ng on Data
Older People Social Inclusion : Interna?onal Policies and Monitoring Indicators
 Older People Social Inclusion : Interna?onal Policies and Monitoring Indicators Professor Shereen Hussein King s College London The United Kingdom Antalya, 10-12 October 2017 Social Inclusion of older
In my presenta7on I will be looking at informa7on that helps to portray where we are today, the path we ve traveled in the last decade and a half, and
 I am pleased to be with you this morning to share a demographer s perspec7ve on the characteris7cs and dynamics of the workforce in the Food and Beverage Manufacturing industries. Thank you to NYATEP,
Funding provided by the Re2rement Research Founda2on in a grant to the Na2onal Commi:ee to Preserve Social Security & Medicare Founda2on
 Funding provided by the Re2rement Research Founda2on in a grant to the Na2onal Commi:ee to Preserve Social Security & Medicare Founda2on 1 2 The state of re2rement security in our country is nothing short
Understanding Poverty Measures Used to Assess Economic Well-Being in California
 calbudgetcenter.org Understanding Poverty Measures Used to Assess Economic Well-Being in California @alissa_brie @skimberca @CalBudgetCenter ALISSA ANDERSON, SENIOR POLICY ANALYST SARA KIMBERLIN, SENIOR
Law and Economic Justice
 University of Oklahoma College of Law From the SelectedWorks of Jonathan B. Forman April 29, 2011 Law and Economic Justice JONATHAN B FORMAN, University of Oklahoma Available at: https://works.bepress.com/jonathan_forman/170/
Poverty and Income Distribution
 Poverty and Income Distribution SECOND EDITION EDWARD N. WOLFF WILEY-BLACKWELL A John Wiley & Sons, Ltd., Publication Contents Preface * xiv Chapter 1 Introduction: Issues and Scope of Book l 1.1 Recent
The Philippine Statistics Authority (PSA) Small Area Poverty Estimation Project By Bernadette Balamban
 Small Area Poverty Estimation Project By Bernadette Balamban") ESA/STAT/AC.320/28 Expert Group Mee6ng on Data Disaggrega6on 27-29 June 2016 New York The (PSA) Small Area Poverty Estimation Project By Bernadette Balamban The (PSA) Small Area Poverty Estimation Project
ESA/STAT/AC.320/28 Expert Group Mee6ng on Data Disaggrega6on 27-29 June 2016 New York The (PSA) Small Area Poverty Estimation Project By Bernadette Balamban The (PSA) Small Area Poverty Estimation Project
Income Inequality and Health in Washington State
 Slide 1 of 31 Income Inequality and Health in Washington State Donald L. Patrick, Jesse J. Plascak, Shirley A.A. Beresford University of Washington Autumn Quarterly Meeting Biobehavioral Cancer Prevention
INOGATE Energy Statistics Network Meeting
 IEA Energy Statistics Co-operation INOGATE Energy Statistics Network Meeting 8 October, 2013 The Role of the IEA in the harmonisation of energy statistics and energy balances with international standards
Income Changes in Metro Atlanta: Meandering Through The Research
 Income Changes in Metro Atlanta: Meandering Through The Research Atlanta Regional Commission For more information, contact: mcarnathan@atlantaregional.com The Highlights Per Capita Income in metro Atlanta
Measuring Suburban Poverty: Concepts and Data Sources Hofstra University September 26, 2013
 Measuring Suburban Poverty: Concepts and Data Sources Hofstra University September 26, 2013 Trudi Renwick Poverty Statistics Branch Social, Economic and Housing Statistics Division U.S. Bureau of the Census
Small Area Health Insurance Estimates from the Census Bureau: 2008 and 2009
 October 2011 Small Area Health Insurance Estimates from the Census Bureau: 2008 and 2009 Introduction The U.S. Census Bureau s Small Area Health Insurance Estimates (SAHIE) program produces model based
Southeast Asia: a SWOT analysis by the OECD
 Southeast Asia: a SWOT analysis by the OECD ECMI Symposium on Marketing and Innovation Rotterdam, 28 May 2014 Yves Leterme Deputy Secretary-General Organization for Economic Cooperation and Development
Towards comparable measures of income inequality and poverty
 Reunión Interregional del Grupo de Expertos Priorizando la igualdad en la Agenda 2030 27 al 28 de junio de 2018 Towards comparable measures of income inequality and poverty Xavier Mancero Sta.s.cs Division
How the Census Bureau Measures Poverty With Selected Sources of Poverty Data
 How the Census Bureau Measures Poverty With Selected Sources of Poverty Data Alemayehu Bishaw Poverty Statistics Branch Social, Economic and Housing Statistics Division U. S. Census Bureau November 15-16,
2016 Adequacy. Bureau of Legislative Research Policy Analysis & Research Section
 2016 Adequacy Bureau of Legislative Research Policy Analysis & Research Section Equity is a key component of achieving and maintaining a constitutionally sound system of funding education in Arkansas,
Poverty in the United Way Service Area
 Poverty in the United Way Service Area Year 4 Update - 2014 The Institute for Urban Policy Research At The University of Texas at Dallas Poverty in the United Way Service Area Year 4 Update - 2014 Introduction
Implementa)on of the Shared Environmental Informa)on System (SEIS) principles and prac)ces in the Eastern Partnership countries
on of the Shared Environmental Informa)on System (SEIS) principles and prac)ces in the Eastern Partnership countries") Implementa)on of the Shared Environmental Informa)on System (SEIS) principles and prac)ces in the Eastern Partnership countries The ENI SEIS II East project (2016-2020) Partnerships and Networks Programme
Implementa)on of the Shared Environmental Informa)on System (SEIS) principles and prac)ces in the Eastern Partnership countries The ENI SEIS II East project (2016-2020) Partnerships and Networks Programme
Poverty and Labor Force Statistics in the United States
 Poverty and Labor Force Statistics in the United States Marcella S. Jones-Puthoff Statistician, Age and Special Populations Branch Population Division U. S. Census Bureau Presentation for the Global Forum
G- 20 Data Gaps Ini#a#ve (DGI)
") G- 20 Data Gaps Ini#a#ve (DGI) Mee#ng on Financial Informa#on Needs for Sta#s#cs, Macro- pruden#al Regula#on and Supervision in Central Banks of La#n America and the Caribbean Mexico City- Mexico May 15
G- 20 Data Gaps Ini#a#ve (DGI) Mee#ng on Financial Informa#on Needs for Sta#s#cs, Macro- pruden#al Regula#on and Supervision in Central Banks of La#n America and the Caribbean Mexico City- Mexico May 15
INCOME INEQUALITY AND OTHER FORMS OF INEQUALITY. Sandip Sarkar & Balwant Singh Mehta. Institute for Human Development New Delhi
 INCOME INEQUALITY AND OTHER FORMS OF INEQUALITY Sandip Sarkar & Balwant Singh Mehta Institute for Human Development New Delhi 1 WHAT IS INEQUALITY Inequality is multidimensional, if expressed between individuals,
An Intelligent Consumer s Guide to Poverty Measurement
 IRP Webinar: An Intelligent Consumer s Guide to Poverty Measurement Timothy Smeeding University of Wisconsin Madison Kathleen Short U.S. Census Bureau May 14, 2014 Research Training Policy Practice Disclaimers
Estimating the Supplemental Poverty Measure from the 2014 Panel of the Survey of Income and Program Participation
 Estimating the Supplemental Poverty Measure from the 2014 Panel of the Survey of Income and Program Participation FCSM March 7, 2018 Lewis Warren Liana Fox Ashley Edwards U.S. Census Bureau U.S. Census
A Guide to Statistics on Historical Trends in Income Inequality
 Updated October 11, 2017 A Guide to Statistics on Historical Trends in Income Inequality By Chad Stone, Danilo Trisi, Arloc Sherman, and Emily Horton 1 The broad facts of income inequality over the past
Poverty in the United States in 2014: In Brief
 Joseph Dalaker Analyst in Social Policy September 30, 2015 Congressional Research Service 7-5700 www.crs.gov R44211 Contents Introduction... 1 How the Official Poverty Measure is Computed... 1 Historical
Income Inequality, Mobility and Turnover at the Top in the U.S., Gerald Auten Geoffrey Gee And Nicholas Turner
 Income Inequality, Mobility and Turnover at the Top in the U.S., 1987 2010 Gerald Auten Geoffrey Gee And Nicholas Turner Cross-sectional Census data, survey data or income tax returns (Saez 2003) generally
Trend Analysis of Changes to Population and Income in Philadelphia, using American Community Survey (ACS) Data
 Data") OFFICE OF THE PRESIDENT FINANCE AND BUDGET TEAM City Council of Philadelphia 9.22.17 Trend Analysis of Changes to Population and Income in Philadelphia, using 2010-2016 American Community Survey (ACS)
OFFICE OF THE PRESIDENT FINANCE AND BUDGET TEAM City Council of Philadelphia 9.22.17 Trend Analysis of Changes to Population and Income in Philadelphia, using 2010-2016 American Community Survey (ACS)
National Equity Atlas Data & Methods: Technical Documentation
 National Equity Atlas Data & Methods: Technical Documentation Prepared by PolicyLink and the USC Program for Environmental and Regional Equity March 5, 2015 This document provides more detailed information
Many studies have documented the long term trend of. Income Mobility in the United States: New Evidence from Income Tax Data. Forum on Income Mobility
 Forum on Income Mobility Income Mobility in the United States: New Evidence from Income Tax Data Abstract - While many studies have documented the long term trend of increasing income inequality in the
A Consistent Data Series to Evaluate Growth and Inequality in the National Accounts
 A Consistent Data Series to Evaluate Growth and Inequality in the National Accounts David Johnson with D. Fixler, A. Craig, K. Furlong, Bureau of Economic Analysis Frontiers of Measuring Household Economic
Employment Equity in Southern States: Detailed Methodology
 Employment Equity in Southern States: Detailed Methodology Prepared by PolicyLink and the USC Program for Environmental and Regional Equity November 2017 Unless otherwise noted, data and analyses presented
The Moldovan experience in the measurement of inequalities
 The Moldovan experience in the measurement of inequalities Veronica Nica National Bureau of Statistics of Moldova Quick facts about Moldova Population (01.01.2015) 3 555 159 Urban 42.4% Rural 57.6% Employment
Affordability of Na/onal Flood Insurance Program Premiums Report 2
 Affordability of Na/onal Flood Insurance Program Premiums Report 2 Commi?ee on the Affordability of Na/onal Flood Insurance Program Premiums Water Science and Technology Board Board on Mathema5cal Sciences
Topic 11: Measuring Inequality and Poverty
 Topic 11: Measuring Inequality and Poverty Economic well-being (utility) is distributed unequally across the population because income and wealth are distributed unequally. Inequality is measured by the
The Knowledge Problem
 The Knowledge Problem March 28, 2014 copies of this presentation can be found at www.antonydavies.org www.antonydavies.org 1 The Players and the Goals In this experiment, each of you is a member of a community.
Introduction to Taxes and Transfers: Income Distribution, Poverty, Taxes and Transfers (loosely follows Gruber Chapters 17-18)
") Introduction to Taxes and Transfers: Income Distribution, Poverty, Taxes and Transfers (loosely follows Gruber Chapters 17-18) 131 Undergraduate Public Economics Emmanuel Saez UC Berkeley 1 Recall: Two
Introduction to Taxes and Transfers: Income Distribution, Poverty, Taxes and Transfers (loosely follows Gruber Chapters 17-18) 131 Undergraduate Public Economics Emmanuel Saez UC Berkeley 1 Recall: Two
ECON 256: Poverty, Growth & Inequality. Jack Rossbach
 ECON 256: Poverty, Growth & Inequality Jack Rossbach Measuring Poverty Many different definitions for Poverty Cannot afford 2,000 calories per day Do not have basic needs met: clean water, health care,
Income distribution and redistribution
 Income distribution and redistribution HMRC-HMT Economics of Taxation http://darp.lse.ac.uk/hmrc-hmt Frank Cowell, 7 December 2015 Overview... Income distribution and redistribution Income distribution
Health Status, Health Insurance, and Health Services Utilization: 2001
 Health Status, Health Insurance, and Health Services Utilization: 2001 Household Economic Studies Issued February 2006 P70-106 This report presents health service utilization rates by economic and demographic
Poverty, Inequality and the Welfare State
 Poverty, Inequality and the Welfare State Lectures 3 and 4 Le Grand, Propper and Smith (2008): Chp 9 Stiglitz (2000): Chp 14 Connolly and Munro (1999): Chp 14, 15, 16, 17 Outline Income and wealth defined
2016 HEALTH INSURANCE COVERAGE ESTIMATES
 2016 HEALTH INSURANCE COVERAGE ESTIMATES SHADAC Webinar Featuring U.S. Census Bureau Experts September 19, 2017 1:00 PM EDT You will be connected to broadcast audio through your computer. You can also
Poverty and Income in 2008: A Look at the New Census Data and What the Numbers Mean. Brookings Workshop. David Johnson September 10, 2009
 Poverty and Income in 2008: A Look at the New Census Data and What the Numbers Mean Brookings Workshop David Johnson September 10, 2009 Ron and Belle, thanks for inviting me. I think Ron invited me this
Detailed Technical Appendix for Pollin, Heintz, Arno, and Wicks-Lim, "Economic Analysis of Health California"
 "Economic Analysis of Health California" In this appendix, we provide a more complete set of the details on the data and methods we used to produce the estimates presented in Section 4: Impact on Individual
Economic Development. Problem Set 1
 Economic Development Problem Set 1 Sherif Khalifa DueTuesday,March,8th,2011 1. (a) What is the usual indicator of living standards? (b) How is it calculated? (c) What are the problems with this indicator?
Inequality: Why should we care?
 Inequality: Why should we care? Byron Gangnes Professor of Economics Senior Research Fellow, UHERO University of Hawaii at Manoa VLI February 2019 Hawaii Island Economic inequality Inequality a central
ASMBS Compensa.on and Prac.ce Style Survey. Teresa LaMasters MD, FACS John Morton, MD, MPH, FACS, FASMBS
 ASMBS Compensa.on and Prac.ce Style Survey Teresa LaMasters MD, FACS John Morton, MD, MPH, FACS, FASMBS Thank you Robin Blackstone, MD ASMBS Past President Georgeann Mallory, RD ASMBS Execu.ve Director
Poverty, Inequality and the Millennium Development Goals in La:n America. Nora Lus)g Professor, Tulane University Nonresident Fellow, CGD and IAD
g Professor, Tulane University Nonresident Fellow, CGD and IAD") Poverty, Inequality and the Millennium Development Goals in La:n America Nora Lus)g Professor, Tulane University Nonresident Fellow, CGD and IAD OECD, Paris, February 27, 2012 1 La:n America and MDGs Significant
Poverty, Inequality and the Millennium Development Goals in La:n America Nora Lus)g Professor, Tulane University Nonresident Fellow, CGD and IAD OECD, Paris, February 27, 2012 1 La:n America and MDGs Significant
An Agenda for Sustainable and Inclusive Growth for Emerging Markets. Joseph E. S+glitz ASSA Mee+ngs San Francisco January 2016
 An Agenda for Sustainable and Inclusive Growth for Emerging Markets Joseph E. S+glitz ASSA Mee+ngs San Francisco January 2016 Outline 1. Brief descrip+on of the current global economy 2. Explana+on: lack
Using Refundable Tax Credits to Help Lowincome
 Using Refundable Tax Credits to Help Lowincome Taxpayers by Jon Forman Alfred P. Murrah Professor of Law University of Oklahoma Norman, Oklahoma & ATAX Fellow, UNSW University of Melbourne Melbourne, Australia
Income inequality and mobility in Australia over the last decade
 Income inequality and mobility in Australia over the last decade Roger Wilkins Meeting of National Economic Research Organisations, OECD Headquarters, 18 June 2012 1993-94 1994-95 1995-96 1996-97 1997-98
Gender Pay Differences: Progress Made, but Women Remain Overrepresented Among Low- Wage Workers
 Cornell University ILR School DigitalCommons@ILR Federal Publications Key Workplace Documents 10-2011 Gender Pay Differences: Progress Made, but Women Remain Overrepresented Among Low- Wage Workers Government
the regional distribution of income
 the regional distribution of income The Distribution Of Household Income In Hampton Roads F. Scott Fitzgerald: The very rich are different from you and me. Ernest Hemingway: Yes, they have more money.
How State Policies Impact Local Property Taxes. Adam H. Langley
 How State Policies Impact Local Property Taxes Adam H. Langley 1 Pennsylvania Tax Swap Property Tax Independence Act (SB 67) Eliminate school property tax, except for debt service Income tax: 3.07% to
Introduction to Taxes and Transfers: Income Distribution, Poverty, Taxes and Transfers. 131 Undergraduate Public Economics Emmanuel Saez UC Berkeley
 Introduction to Taxes and Transfers: Income Distribution, Poverty, Taxes and Transfers 131 Undergraduate Public Economics Emmanuel Saez UC Berkeley 1 REMINDER: Two General Rules for Government Intervention
Dignity for All: Ensuring Economic Security as America Ages. A Senior Poverty Forum
 Dignity for All: Ensuring Economic Security as America Ages A Senior Poverty Forum November 15, 2016 Panel 1:Understanding Low-Income Older Adults through Research and Data Moderator: Emily Allen, AARP
Financial Health of Residents: A City-Level Dashboard
 Financial Health of Residents: A City-Level Dashboard Technical Appendix Caroline Ratcliffe, Cary Lou, Diana Elliott, and Signe-Mary McKernan Technical Appendix Creating City Peer Groups We use cluster
County Economic Status and Distressed Areas in the Appalachian Region
 County Economic Status and Distressed Areas in the Appalachian Region Kostas Skordas, Director Regional Planning & Research Division Appalachian Regional Commission Washington, DC Appalachian Regional
Whither Retirement Strategies?
 Whither Retirement Strategies? Discussion of Byrne & Reilly and Fitchner & Seligman papers PENSION RESEARCH COUNCIL 2017 CONFERENCE Emily Kessler, FSA, Society of Actuaries 04 May 2017 How do you prepare
GAO GENDER PAY DIFFERENCES. Progress Made, but Women Remain Overrepresented among Low-Wage Workers. Report to Congressional Requesters
 GAO United States Government Accountability Office Report to Congressional Requesters October 2011 GENDER PAY DIFFERENCES Progress Made, but Women Remain Overrepresented among Low-Wage Workers GAO-12-10
An Interactive Overview of Small Area Health Insurance Estimates (SAHIE) Walter Lee Holmes Jr. U.S. Census Bureau September 20, 2013
 Walter Lee Holmes Jr. U.S. Census Bureau September 20, 2013") An Interactive Overview of Small Area Health Insurance Estimates (SAHIE) Walter Lee Holmes Jr. U.S. Census Bureau September 20, 2013 1 Presentation Overview About SAHIE Why SAHIE SAHIE Timeline Methodology
An Interactive Overview of Small Area Health Insurance Estimates (SAHIE) Walter Lee Holmes Jr. U.S. Census Bureau September 20, 2013 1 Presentation Overview About SAHIE Why SAHIE SAHIE Timeline Methodology
Freddie Mac Community Lender Presentation State of AAPI Housing August 23 rd, 2016
 Freddie Mac Community Lender Presentation State of AAPI Housing August 23 rd, 2016 TABLE OF CONTENTS I. Introduction to AREAA a. Brief History b. Current membership c. Geographic Distribution d. Policy
Market Competition Works: Proposed Silver Premiums in the 2014 Individual and Small Group Markets Are Nearly 20% Lower than Expected
 ASPE ISSUE BRIEF Market Competition Works: Proposed Silver Premiums in the 2014 Individual and Small Group Markets Are Nearly 20% Lower than Expected By: Laura Skopec and Richard Kronick, ASPE A goal of
The Material Well-Being of the Poor and the Middle Class since 1980
 The Material Well-Being of the Poor and the Middle Class since 1980 by Bruce Meyer and James Sullivan Comments by Gary Burtless THEBROOKINGS INSTITUTION October 25, 2011 Washington, DC Oct. 25, 2011 /
Program on Retirement Policy Number 1, February 2011
 URBAN INSTITUTE Retirement Security Data Brief Program on Retirement Policy Number 1, February 2011 Poverty among Older Americans, 2009 Philip Issa and Sheila R. Zedlewski About one in three Americans
Measuring the Cost of Employment: Work-Related Expenses in the Supplemental Poverty Measure. No. 279 SEHSD No
 THE SURVEY OF INCOME AND PROGRAM PARTICIPATION Measuring the Cost of Employment: Work-Related in the Supplemental Poverty Measure Revised November 13, 2017 No. 279 SEHSD No. 2017-43 Abinash Mohanty Ashley
Economics 448: Lecture 14 Measures of Inequality
 Economics 448: Measures of Inequality 6 March 2014 1 2 The context Economic inequality: Preliminary observations 3 Inequality Economic growth affects the level of income, wealth, well being. Also want
Income Inequality versus Opportunity 26 November 2012
 Income Inequality versus Opportunity 26 November 2012 There is a significant difference between income inequality and income opportunity. Income inequality represents a rearward view on how much money
Advancing Health Equity and Inclusive Growth in the Sacramento Region: Narrative and Data for an Equity Policy Agenda
 Advancing Health Equity and Inclusive Growth in the Sacramento Region: Narrative and Data for an Equity Policy Agenda Equity is the Superior Growth Model Racial inequities hinder economic prosperity Sacramento
A Global Database of Foreign Affiliate Activity
 A Global Database of Foreign Affiliate Activity Tani Fukui U.S. Interna0onal Trade Commission Csilla Lakatos U.S. Interna0onal Trade Commission April 6, 2012 The views in this presentation are strictly
POVERTY IN AUSTRALIA: NEW ESTIMATES AND RECENT TRENDS RESEARCH METHODOLOGY FOR THE 2016 REPORT
 POVERTY IN AUSTRALIA: NEW ESTIMATES AND RECENT TRENDS RESEARCH METHODOLOGY FOR THE 2016 REPORT Peter Saunders, Melissa Wong and Bruce Bradbury Social Policy Research Centre University of New South Wales
Small Area Estimates Produced by the U.S. Federal Government: Methods and Issues
 Small Area Estimates Produced by the U.S. Federal Government: Methods and Issues Small Area Estimation Conference Maastricht, The Netherlands August 17-19, 2016 John L. Czajka Mathematica Policy Research
Universal Social Protection
 Universal Social Protection Universal pensions in South Africa Older Persons Grant South Africa is ranked as an upper-middle income country but characterized by high poverty incidence and inequality among
Pathways Fall The Supplemental. Poverty. Measure. A New Tool for Understanding U.S. Poverty. By Rebecca M. Blank
 10 Pathways Fall 2011 The Supplemental Poverty Measure A New Tool for Understanding U.S. Poverty By Rebecca M. Blank 11 How many Americans are unable to meet their basic needs? How is that number changing
STATISTICS ON INCOME AND LIVING CONDITIONS (EU-SILC))
)") GENERAL SECRETARIAT OF THE NATIONAL STATISTICAL SERVICE OF GREECE GENERAL DIRECTORATE OF STATISTICAL SURVEYS DIVISION OF POPULATION AND LABOUR MARKET STATISTICS HOUSEHOLDS SURVEYS UNIT STATISTICS ON INCOME
GENERAL SECRETARIAT OF THE NATIONAL STATISTICAL SERVICE OF GREECE GENERAL DIRECTORATE OF STATISTICAL SURVEYS DIVISION OF POPULATION AND LABOUR MARKET STATISTICS HOUSEHOLDS SURVEYS UNIT STATISTICS ON INCOME
How to use ADePT for Social Protection Analysis
 How to use ADePT for Social Protection Analysis Public Disclosure Authorized Public Disclosure Authorized Public Disclosure Authorized Social Safety Nets Core Course Washington D.C. - April 25 May 6, 2016
Social experiment. If you have P500 pesos in your wallet, what would you do with it?
 Social experiment If you have P500 pesos in your wallet, what would you do with it? xxxxxxx xxxxxxx Anna from Infanta, Quezon, 10 years old and is the 3 rd among children of 7 Dropped out of school at
Poverty and Income Inequality in Scotland: 2013/14 A National Statistics publication for Scotland
 Poverty and Income Inequality in Scotland: 2013/14 A National Statistics publication for Scotland EQUALITY, POVERTY AND SOCIAL SECURITY This publication presents annual estimates of the percentage and
Filene Research Ins.tute Accessible Financial Services Incubator. Non- prime Auto Lending
 Filene Research Ins.tute Accessible Financial Services Incubator Non- prime Auto Lending 1 Introduc.ons Leading the Incubator Project Lois Kitsch is the Na.onal Program Manager with the Na.onal Credit
ICI RESEARCH PERSPECTIVE
 ICI RESEARCH PERSPECTIVE 1401 H STREET, NW, SUITE 1200 WASHINGTON, DC 20005 202-326-5800 WWW.ICI.ORG JULY 2017 VOL. 23, NO. 5 WHAT S INSIDE 2 Introduction 4 Which Workers Would Be Expected to Participate
Salt Lake City 2010 Population by 5-Year Age Groups and Sex
 age Structure City has relatively more young adults (20- to 40- year-olds) and a greater share of elderly (75 years and older) in its 2010 population than does County. This means that, compared with the
Report on Adjusting Poverty Thresholds for Geographic Price Differences
 Report on Adjusting Poverty Thresholds for Geographic Price Differences Edgar O. Olsen* Department of Economics University of Virginia Charlottesville, VA 22904 Prepared for Research Forum on Cost of Living
HIGH AND WIDE: INCOME INEQUALITY GAP IN THE DISTRICT ONE OF BIGGEST IN THE U.S. By Wes Rivers
 An Affiliate of the Center on Budget and Policy Priorities 820 First Street NE, Suite 510 Washington, DC 20002 (202) 408-1080 Fax (202) 325-8839 www.dcfpi.org March 13, 2014 HIGH AND WIDE: INCOME INEQUALITY
Wealth inequality in the euro area
 Wealth inequality in the euro area Results of the Household Finance and Consumption Surveys 2010 and 2014 Aurel Schubert 23 June 2017 The views expressed are those of the speaker and not necessarily those
Income Inequality and the Safety Net in California Technical Appendices
 Income Inequality and the Safety Net in California Technical Appendices CONTENTS Appendix A: Data Sources 2 Appendix B: Methodology 4 Appendix C: Detailed Estimates 7 Sarah Bohn and Caroline Danielson
Sustainable Returns Presentation
 Sustainable Returns Presentation Wanjiru Kirima April 2012 SUSTAINABLE RETURNS IN PARTNERSHIP WITH for pensions and society an industry-led initiative 1 Sustainable Returns Project for pensions and society
Striving for Growth in a perilous environment: an economic outlook. Joseph E. S+glitz December 2015 Montevideo
 Striving for Growth in a perilous environment: an economic outlook Joseph E. S+glitz December 2015 Montevideo Weak global economy 2015 slated to be worse year since Global Financial Crisis And apart from
Intermediate Macroeconomic Theory. Costas Azariadis. Costas Azariadis. Lecture 3: Productivity and Labor
 Lecture 3: Productivity and Labor 1. THE ISSUES a)productivity most important determinant of living standards in the long run 2008 U.S. GDP per worker employed (current $) $100,000 per worker per year
A Profile of Non-Labor Income
 A Profile of Non-Labor Income County Region Blaine County ID, Custer County ID Produced by Economic Profile System-Human Dimensions Toolkit EPS-HDT September 27, 2011 About the Economic Profile System-Human
A Profile of Non-Labor Income
 A Profile of Non-Labor Income Selected Geographies: Shawano County, WI Benchmark Geographies: U.S. Produced by Economic Profile System EPS January 12, 2016 About the Economic Profile System (EPS) About
Roundtable on Income Equality, Social Inclusion and Mobility OECD Paris
 National Issues in the USA in Economic Development, Mobility and Income Inequality Roundtable on Income Equality, Social Inclusion and Mobility OECD Paris April 4,5 2016 Intent of this Paper This paper
How to use ADePT for Social Protection Analysis
 How to use ADePT for Social Protection Analysis Pension Core Course Washington D.C. - May 2015 Objective To learn how to use ADePT Social Protection while analyzing the performance of specific SPL programs
Sources of Income for Older Persons, 2006
 Fact Sheet Sources of for Older Persons, 2006 AARP Public Policy Institute Older persons with low income depend heavily on Social Security. Over the past 11 years, earnings have become a more important
A Profile of Non-Labor Income
 A Profile of Non-Labor Income Selected Geographies: Yellowstone County, MT Benchmark Geographies: Produced by Economic Profile System EPS May 21, 2015 About the Economic Profile System (EPS) About EPS
Interaction of household income, consumption and wealth - statistics on main results
 Interaction of household income, consumption and wealth - statistics on main results Statistics Explained Data extracted in June 2017. Most recent data: Further Eurostat information, Main tables and Database.
Fiscal Transfers in the Republic of the Sudan. Introduction to fiscal transfers. Fiscal transfers in the Sudan. Comparative fiscal transfer formulae
 Fiscal Transfers in the Republic of the Sudan Introduction to fiscal transfers Fiscal transfers from the national level are intended to help subnational levels of government meet their expenses. Fiscal
Mul$ Sector Geospa$al Mapping Project. Data point collec,on - Methodology
 Mul$ Sector Geospa$al Mapping Project Data point collec,on - Methodology Project Summary Scope: Brandworx was tasked with conduc,ng a second round of geospa,al mapping of data points in Zambia. Only certain
Evaluating the BLS Labor Force projections to 2000
 Evaluating the BLS Labor Force projections to 2000 Howard N Fullerton Jr. Bureau of Labor Statistics, Office of Occupational Statistics and Employment Projections Washington, DC 20212-0001 KEY WORDS: Population
Independence, MO Data Profile 2015
 , MO Data Profile 2015 5 year American Community Survey (ACS) Jackson County, Missouri Data sources: U.S. Census Bureau, American Community Survey (ACS), 2011 2015 (released December 8, 2016), compared
4/20/16. Legal Disclaimer. Learning Objectives. Considering Background Screening? Discover Best Prac6ces and Revenue Opportuni6es
 Considering Background Screening? Discover Best Prac6ces and Revenue Opportuni6es The presenta1on will begin shortly. While you are wai1ng, please subscribe to our Ac1onable Insight NewsleAers at haps://peopletrail.com/compliance-