Introduction to Taxes and Transfers: Income Distribution, Poverty, Taxes and Transfers (loosely follows Gruber Chapters 17-18)
|
|
|
- Griselda Davis
- 6 years ago
- Views:
Transcription
1 Introduction to Taxes and Transfers: Income Distribution, Poverty, Taxes and Transfers (loosely follows Gruber Chapters 17-18) 131 Undergraduate Public Economics Emmanuel Saez UC Berkeley 1
2 Recall: Two General Rules for Government Intervention 1) Market Failures: Government intervention can help if there are market failures 2) Redistribution: Free market generates inequality. Public cares about economic disparity. Govt taxes and spending can reduce inequality 2
3 Role 2: Redistribution Even with no market failures, free market outcome might generate substantial inequality Inequality matters because people evaluate their economic well-being relative to others, not in absolute terms Public cares about inequality In advanced economies, people pool 30-50% of their income through their government to fund many transfer programs Do taxes and transfers affect economic behavior? Generates an efficiency and equity trade-off (size of economic pie vs. distribution of the economic pie) 3
4 Income Inequality: Labor vs. Capital Income Individuals derive market income (before tax) from labor and capital: z = wl + rk where w is wage, l is labor supply, k is capital, r is rate of return on capital 1) Labor income inequality is due to differences in working abilities (education, talent, physical ability, etc.), work effort (hours of work, effort on the job, etc.), and luck (labor effort might succeed or not) 2) Capital income inequality is due to differences in wealth k (due to past saving behavior and inheritances received), and in rates of return r Capital Income (or wealth) is much more concentrated than Labor Income 4
5 Macro-aggregates: Labor vs. Capital Income Labor income wl 75% of market income z Capital income rk 25% of market income z Capital stock k % of market income z Rate of return on capital r 5 6% In GDP, gross capital share is higher (35%) because it includes depreciation of capital National Income = GDP - depreciation of capital + net foreign income 5
6 40% Figure 12: Capital shares in factor-price national income % 30% 25% 20% 15% USA Japan Germany France UK Canada Australia Italy 10% Source: Piketty and Zucman (2014) 43
7 800% Figure 5.1. Private and public capital: Europe and America, % Value of private an nd public capital (% national income) 600% 500% 400% 300% 200% 100% 0% Private capital Public capital United States Europe -100% The fluctuations of national capital in the long run correspond mostly to the fluctuations of private capital (both in Europe and in the U.S.). Sources and series: see piketty.pse.ens.fr/capital21c. Source: Piketty (2014)
8 Income Inequality Measurement Inequality can be measured by indexes such as Gini coefficient, quantile income shares which are functions of the income distribution F (z) Most famous inequality index: Gini coefficient Gini = 2 * area between 45 degree line and Lorenz curve Lorenz curve L(p) at percentile p is fraction of total income earned by individuals below percentile p 0 L(p) p Gini=0 means perfect equality Gini=1 means complete inequality (top person has all the income) 8
9 100% 90% 80% 70% 60% 50% 40% 30% 20% 10% 0% Gini Coefficient California pre-tax income, 2000, Gini=62.1% Lorenz Curve 45 degree line 0% 10% 20% 30% 40% 50% 60% 70% 80% 90% 100% Source: Annual Report 2001 California Franchise Tax Board
10 Key Empirical Facts on Income Inequality 1) In the US, labor income inequality has increased substantially since 1970: debate between skilled biased technological progress view vs. institution view (min wage and Unions) [Autor-Katz 99] 2) Gender gap has decreased but remains substantial especially at the very top 3) In the US, top income shares dropped dramatically from 1929 to 1950 and increased dramatically since ) Bottom 50% pre-tax income per adult have stagnated since 1980 in spite of a 60% increase in average national income 4) Fall in top income shares from happened in most OECD countries. Surge in top income shares has happened primarily in English speaking countries, not as much in Continental Europe and Japan [Atkinson, Piketty, Saez JEL 11] 10
11 0.50 Figure 1: Gini coefficient Gini coefficient All Workers Men Women Source: Kopczuk, Saez, Song QJE'10: Wage earnings inequality Year
12 Men still make 85% of the top 1% of the labor income distribution 50% Share of women in the employed population, by fractile of labor income 45% 40% 35% 30% 25% All Top 10% 20% 15% 10% 5% Top 1% Top 0.1% 0% Source: Appendix Table II-F1.
13 50% Share of national income going to top 10% adults (pre-tax) % of national income 45% 40% 35% 30% Source: Appendix Tables II-B1 and II-C1
14 Average, bottom 90%, bottom 50% real incomes per adult Average income in constant 2014 dollars 60,000 50,000 40,000 30,000 20,000 10,000 Average national income per adult: 61% growth from 1980 to Bottom 90% pre-tax: 30% growth from 1980 to 2014 Bottom 50% pre-tax: 1% growth from 1980 to 2014
15 22% Top 1% and Bottom 50% Adults pre-tax national income shares % of national income 20% 18% 16% 14% 12% 10% Top 1% Bottom 50%
16 Top 1% share: English Speaking countries (U-shaped) Top 1% Income Share (in %) United States United Kingdom Canada
17 Source: THE WORLD TOP INCOMES DATABASE
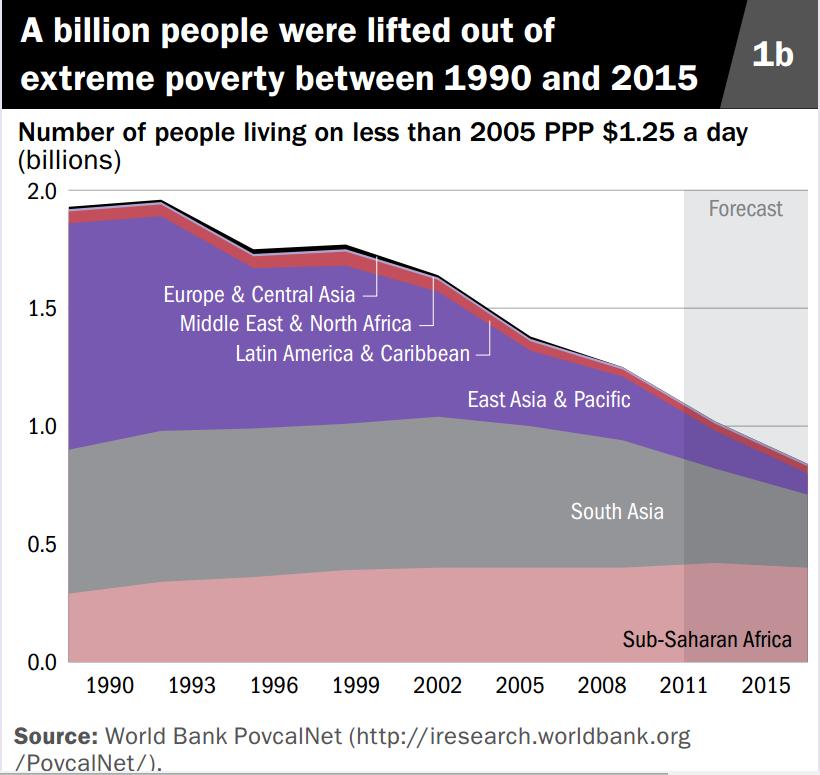
18 POVERTY RATE DEFINITIONS 1) Absolute: Fraction of population with disposable income (normalized by family size) below poverty threshold z fixed in real terms (e.g., World Bank now uses $1.90/day in 2011 dollars) 2) Relative: Fraction of population with disposable income (normalized by family size) below poverty threshold z fixed relative to median (European Union defines poverty threshold as 60% of median) Absolute poverty falls in the long run with economic growth [nobody in the US is World Bank poor] but relative poverty does not Absolute poverty captures both growth and inequality effects while relative poverty captures only inequality effects The fact that inequality stays in the debate in spite of huge growth since 1800 shows that relative income matters (see e.g. Luttmer 2005 for an empirical study) 16
19
20 Poverty Rate Disposable Income Definition Most intuitive notion of poverty is based on consumption c [not pre-tax income z] c = z T (z) + B(z) + E s where T (z) is tax, B(z) govt transfers, E net private transfers (charity, family, friends), s is net savings (change in assets) Consumption c is difficult to measure Disposable Income z T (z) + B(z) [post-tax income] measured in traditional Current Population Survey (CPS) 18
21 FAMILY SCALE Ideally, poverty should be defined at the individual level based on individual consumption [e.g., kids better off when mother or grandmother controls income instead of father, Duflo 03] However, many consumption goods are shared within the family [e.g., housing, joint meals, etc.] and it is difficult to measure consumption at individual level Measured poverty is therefore based on consumption or disposable income at the family level [or unit sharing resources] and everybody within the family has same poverty status Bigger families need more resources but economies of scale in consumption: scale disposable income by family size 19
22 US POVERTY RATE DEFINITION Based on money income = market income before taxes + cash govt transfers + cash private transfers In-kind market income and transfers (employer health insurance, Medicaid, nutrition, public housing) do NOT count Income and employee payroll taxes are NOT deducted, Income tax credits (EITC, Child Tax Credit) are NOT added Threshold depends on household size/structure: e.g., $20K/year for single parent with 2 kids Thresholds adjusted annually using the official CPI 20
23 17.1 Poverty Lines by Family Size (2012) C H A P T E R 1 7 I N C O M E D I S T R I B U T I O N A N D W E L F A R E P R O G R A M S Size of Family Unit Poverty Line 1 $11, , , , ,010 For each additional person, add 3,960 Public Finance and Public Policy Jonathan Gruber Fourth Edition Copyright 2012 Worth Publishers 9 of 35
24 f percent for 2015 and percent r Figure 4. Number in Poverty and Poverty Rate: 1959 to Numbers in millions Recession Number in poverty 43.1 million 25 Percent Poverty rate 13.5 percent Note: The data for 2013 and beyond reflect the implementation of the redesigned income questions. The data points are placed at the midpoints of the respective years. For information on recessions, see Appendix A. For information on confidentiality protection, sampling error, nonsampling error, and definitions, see <www2.census.gov/programs-surveys/cps/techdocs/cpsmar16.pdf>. Source: U.S. Census Bureau, Current Population Survey, 1960 to 2016 Annual Social and Economic Supplements.
25 48 Journal of Economic Perspectives Figure 1 Trends in Individual Poverty Rates and Real GDP per Capita, All Nonelderly Children Elderly GDP per capita 40,000 35,000 Poverty rate ,000 25,000 20,000 15,000 10,000 GDP per capita (2003$) 5 5, Source: Poverty rates are from U.S. Bureau of the Census, Current Population Survey, Annual Social and Economic Supplements. The GDP per capita series is from the Economic Report of the President (2005). Note: The poverty rate data are unavailable for some subgroups for declined steadily during this period, falling from 24.6 percent in 1970 to 10.2 percent in 2003.
26 Factors Explaining Evolution of Poverty Based on Hoynes-Page-Stevens JEP 06 1) Increasing pre-tax inequality: stagnant bottom wages in spite of economic growth per capita [large effect] 2) Changes in family structure: single parent families from 7% in 1967 to 14.4% in 2003 Increases poverty rate by 4 pts [large effect] 3) Increase in female labor force participation Reduces poverty rate [significant effect only since 1980] 4) Immigration: accounts for about 0.7 points in the poverty rate increase from 1969 to 1999 [small effect] 5) Means-tested transfers [medium effect because they are concentrated below poverty line] 23
27 ISSUES WITH US POVERTY RATE DEFINITION Definition was close to disposable income when measuring poverty started but no longer: 1) In-kind transfers have grown substantially [Medicaid] 2) Payroll tax and Income tax credits (EITC, Child Tax Credit) have grown substantially for low income families 3) Official CPI overstates inflation [and understates real economic growth] because it is not chained [i.e., does not take into account that relative price changes lead to changes in consumption] Politically difficult to change definition 24
28 Recomputing Poverty Rate: Meyer-Sullivan NBER 09 1) Change the scaling for family size (no strong effect) 2) Change the price index: shift to CPI-U-RS instead of official CPI-U (large legitimate effect, CPI-U-RS better index) 3) Shift to households [people living in same unit] instead of family [people in same unit related by blood/adoption]: not clear which is best, depends on sharing [some effect] 4) Shift to after-tax income [deduct income/payroll taxes, add tax credits]: large legitimate effect 5) Add non-cash benefits [nutrition, housing, health insurance]: tiny net effect [medicaid, other programs ] 6) Shift to consumption [modest effect on poverty rate, huge effect on deep poverty] 25
29 Figure 1: Official and Alternative Income Poverty Rates, Fraction Poor Official Income Poverty (CPI-U) Rates anchored at the official rate in 1980 Money Income (NAS Scale, CPI-U-RS) After-Tax Money Income (NAS Scale, CPI-U-RS) After-Tax Income + Noncash Benefits Excluding Home Equity (NAS Scale, CPI-U-RS) Notes: The rates are anchored at the official rate in Data are from the CPS-ASEC/ADF. Official Income Poverty follows the U.S. Census definition of income poverty using official thresholds. For measures other than the official one, the threshold in 1980 is equal to the value that yields a poverty rate equal to the official poverty rate in 1980 (13.0 percent). The thresholds in 1980 are then adjusted overtime using the CPI-U-RS. Poverty status is determined at the family level and then person weighted. After-Tax Money Income includes taxes and credits (calculated using TAXSIM). After-Tax Money Income + Noncash Benefits Excluding Home Equity also includes food stamps and CPS-imputed measures of housing and school lunch subsidies, and the fungible value of Medicaid and Medicare. This last series is only available starting with the 1980 CPS-ASEC/ADF. See Data Appendix for more details. Source: Meyer, Bruce D., and James X. Sullivan (2009)
30 Measuring Intergenerational Income Mobility Strong consensus that children s success should not depend too much on parental income Studies linking adult children to their parents can measure link between children and parents income Simple measure: average income rank of children by income rank of parents (Chetty et al. 14) 1) US has less mobility than European countries (especially Scandinavian countries such as Denmark) 2) Substantial heterogeneity in mobility across cities in the US 3) Places with low segregation, low income inequality, good K-12 schools, high social capital, high family stability tend to have high mobility [this is a correlation and not necessarily causal] 27
31 A. Mean Child Income Rank vs. Parent Income Rank in the U.S. Mean Child Income Rank Rank-Rank Slope (U.S) = (0.0003) Parent Income Rank Source: Chetty, Hendren, Kline, Saez (2014)
32 B. United States vs. Denmark Mean Child Income Rank Rank-Rank Slope (Denmark) = (0.0063) Parent Income Rank Denmark United States Source: Chetty, Hendren, Kline, Saez (2014)
33 The American Dream? Probability that a child born to parents in the bottom fifth of the income distribution reaches the top fifth: USA Chetty, Hendren, Kline, Saez % UK Blanden and Machin % Denmark Boserup, Kopczuk, and Kreiner % Canada Corak and Heisz % à Chances of achieving the American Dream are almost two times higher in Canada than in the U.S.

34 The Geography of Upward Mobility in the United States Probability of Reaching the Top Fifth Starting from the Bottom Fifth US average 7.5% [kids born ] Note: Lighter Color = More Upward Mobility Download Statistics for Your Area at
35 The Geography of Upward Mobility in the United States Odds of Reaching the Top Fifth Starting from the Bottom Fifth US average 7.5% [kids born ] Indianapolis 4.9% Santa Rosa 10.0% SF 12.2% SJ 12.9% SB 11.3% LA 9.6% San Diego 10.4% Sacramento 9.7% Modesto 9.4% Fresno 7.5% Bakersfield 12.2% Washington DC 11.0% Charlotte 4.4% Atlanta 4.5% Note: Lighter Color = More Upward Mobility Download Statistics for Your Area at
36 40 economic mobility Table 1. Upward Mobility in the 50 Largest Metro Areas: The Top 10 and Bottom 10 Rank Commuting Zone Odds of Reaching Top Fifth from Bottom Fifth Rank Commuting Zone Odds of Reaching Top Fifth from Bottom Fifth 1 San Jose, CA 12.9% 41 Cleveland, OH 5.1% 2 San Francisco, CA 12.2% 42 St. Louis, MO 5.1% 3 Washington, D.C. 11.0% 43 Raleigh, NC 5.0% 4 Seattle, WA 10.9% 44 Jacksonville, FL 4.9% 5 Salt Lake City, UT 10.8% 45 Columbus, OH 4.9% 6 New York, NY 10.5% 46 Indianapolis, IN 4.9% 7 Boston, MA 10.5% 47 Dayton, OH 4.9% 8 San Diego, CA 10.4% 48 Atlanta, GA 4.5% 9 Newark, NJ 10.2% 49 Milwaukee, WI 4.5% 10 Manchester, NH 10.0% 50 Charlotte, NC 4.4% Note: This table reports selected statistics from a sample of the 50 largest commuting zones (CZs) according to their populations in the 2000 Census. The columns report the percentage of children whose family income is in the top quintile of the national distribution of child family income conditional on having parent family income in the bottom quintile of the parental national income distribution these probabilities are taken from Online Data Table VI of Chetty et al., 2014a. Source: Chetty et al., 2014a. that much of the variation in upward mobility across areas may be driven by a causal effect of the local environment rather than differences in the characteristics of the people white and black low-income individuals ad we find a strong negative correlation between sures of racial and income segregation and u
37 Govt Redistribution with Taxes and Transfers Govt taxes individuals based on income and consumption and provides transfers: z is pre-tax income, y = z T (z) + B(z) is post-tax income 1) If inequality in y is less than inequality in z tax and transfer system is redistributive (or progressive) 2) If inequality in y is more than inequality in z tax and transfer system is regressive a) If y = z (1 t) with constant t, tax/transfer system is neutral b) If y = z (1 t) + G where G is a universal transfer, then tax/transfer system is progressive Actual tax/transfer systems in rich countries roughly like b) with G welfare state transfers [education, health, retirement] 29
38 US Distributional National Accounts Piketty-Saez-Zucman NBER 16 distribute both pre-tax and post-tax US national income across adult individuals National income = GDP - depreciation of capital + net foreign income = broadest measure of income Pre-tax income is income before taxes and transfers: z Post-tax income is income net of all taxes and adding all transfers and public good spending: y = z T (z) + G Both concepts add up to national income and provide a comprehensive view of the mechanical impact of government redistribution 30
39 National Income Distribution 2014 from Piketty, Saez, and Zucman NBER '16 Pre-tax income Post-tax income Income group Number of adults Average income Income share Average income Income share Full Population 234,400,000 $64, % $64, % Bottom 50% 117,200,000 $16, % $25, % Middle 40% 93,760,000 $65, % $67, % Top 10% 23,440,000 $304, % $252, % Top 1% 2,344,000 $1,300, % $1,010, % Top 0.1% 234,400 $6,000, % $4,400, % Top 0.01% 23,440 $28,100, % $20,300, % Top 0.001% 2,344 $122,000, % $88,700, %
40 50% Top 10% national income share: pre-tax vs. post-tax % of national income 45% 40% 35% 30% Post-tax 25% Pre-tax Source: Appendix Tables II-B1 and II-C1
41 Average vs. bottom 50% income growth per adult Average income in constant 2014 dollars 60,000 50,000 40,000 30,000 20,000 10,000 Average national income per adult: 61% growth from 1980 to Bottom 50% post-tax: 21% growth from 1980 to 2014 Bottom 50% pre-tax: 1% growth from 1980 to 2014
42 Federal US Tax System: Overview 1) Individual income tax (on both labor+capital income) [progressive](40% of fed tax revenue) 2) Payroll taxes (on labor income) financing social security programs [about neutral] (40% of revenue) 3) Corporate income tax (on capital income) [progressive if incidence on capital income] (15% of revenue) 4) Estate taxes (on capital income) [very progressive] (2% of revenue) 5) Minor excise taxes (mostly labor income) [regressive] (3% of revenue) 33
43 State+Local Tax System: Overview 1) Individual+Corporate income taxes [progressive] (30% of state+local tax revenue) 2) Sales + Excise taxes (tax on consumption = income - savings) [slightly regressive] (30% of revenue) 3) Real estate property taxes (on capital income) [slightly progressive] (30% of revenue) 34
44 US Tax System: Progressivity and Evolution 1) Medium Term Changes: Federal Tax Progressivity has declined since 1970 but govt redistribution remains substantial especially when including transfers (Medicaid, Social Security, UI, DI, various income support programs) 2) Long Term Changes: Before 1913, US taxes were primarily tariffs, excises, and real estate property taxes [slightly regressive], no transfer programs (and hence small govt) 35
45 Tax progressivity has declined since the 1960s 45% 40% Average tax rates by pre-tax income group % of pre-tax income 35% 30% 25% 20% 15% Top 1% All Bottom 50% 10% 5% 0% Source: Appendix Table II-G1. Source: Piketty, Saez, Zucman (2016)
46 25% Figure S.13: Average individualized transfer by post-tax income group (including Social Security) % of average national income 20% 15% 10% 5% Middle 40% Top 10% All 0% Bottom 50% Source: Appendix Table II-G4b.
47 Plan for Lectures on Taxation/Redistribution 1) Tax incidence (who bears the burden of taxation), efficiency costs of taxation, optimal commodity taxation 2) Taxation of labor income: Optimal design of labor income taxation and means-tested transfers Empirical analysis of tax and transfer programs on labor supply and earnings 3) Taxation of capital income (savings, wealth, and corporate profits) 38
48 REFERENCES Jonathan Gruber, Public Finance and Public Policy, Fifth Edition, 2016 Worth Publishers, Chapter 17 and Chapter 18 Alvaredo, F., Atkinson, A., T. Piketty, E. Saez, and G. Zucman World Wealth and Income Database, (web) Atkinson, Anthony B., Thomas Piketty, and Emmanuel Saez. Top Incomes in the Long Run of History. Journal of Economic Literature 49.1 (2011): 3-71.(web) Blanden, J and Machin, S (2008) Up and down the generational income ladder in Britain: Past changes and future prospects National Institute Economic Review 205 (1) Boserup, Simon, Wojciech Kopczuk, and Claus Kreiner Stability and Persistence of Intergenerational Wealth Formation: Evidence from Danish Wealth Records of Three Generations, October 2014 (web) Chetty, Raj, Nathan Hendren, Patrick Kline, and Emmanuel Saez, Where is the Land of Opportunity? The Geography of Intergenerational Mobility in the United States, Quarterly Journal of Economics, 129(4), 2014, (web) 39
49 Chetty, Raj, Nathan Hendren, Patrick Kline, Emmanuel Saez, and Nicholas Turner Is the United States Still a Land of Opportunity? Trends in Intergenerational Mobility Over 25 Years, NBER Working Paper No , January (web) Corak, Miles, and Andrew Heisz, The Intergenerational Earnings and Income Mobility of Canadian Men: Evidence from Longitudinal Income Tax Data, Journal of Human Resources, 34, no. 3 (1999), (web) Duflo, Esther. Grandmothers and Granddaughters: Old-Age Pensions and Intrahousehold Allocation in South Africa, The World Bank Economic Review Vol. 17, 2003, 1-25 (web) Hoynes, Hilary W., Marianne E. Page, and Ann Huff Stevens. Poverty in America: Trends and explanations. The Journal of Economic Perspectives 20.1 (2006): (web) Katz, Lawrence F., and David H. Autor. Changes in the wage structure and earnings inequality. Handbook of Labor Economics 3 (1999): (web) Kopczuk, Wojciech, Emmanuel Saez, and Jae Song. Earnings inequality and mobility in the United States: evidence from social security data since The Quarterly Journal of Economics (2010): (web) Luttmer, Erzo FP. Neighbors as negatives: Relative earnings and wellbeing. Quarterly Journal of Economics (2005): (web)
50 Meyer, Bruce D., and James X. Sullivan. Consumption and Income Inequality in the US: (2010).(web) Piketty, Thomas, and Emmanuel Saez. Income inequality in the United States, The Quarterly Journal of Economics (2003): 1-41.(web) Piketty, Thomas, and Emmanuel Saez. How Progressive is the US Federal Tax System? A Historical and International Perspective. The Journal of Economic Perspectives 21.1 (2007): 3-24.(web) Piketty, Thomas, Emmanuel Saez, and Gabriel Zucman, Distributional National Accounts: Methods and Estimates for the United States, NBER Working Paper No , (web) US Census Bureau, Income and Poverty in the United States: 2015, report P (web)
Introduction to Taxes and Transfers: Income Distribution, Poverty, Taxes and Transfers. 131 Undergraduate Public Economics Emmanuel Saez UC Berkeley
 Introduction to Taxes and Transfers: Income Distribution, Poverty, Taxes and Transfers 131 Undergraduate Public Economics Emmanuel Saez UC Berkeley 1 REMINDER: Two General Rules for Government Intervention
Lecture 1: Income Distribution, Poverty, Taxes and Transfers
 1 74 Lecture 1: Income Distribution, Poverty, Taxes and Transfers Stefanie Stantcheva Fall 2017 My research I do mostly public, but mixed with labor, macro, and (some) political economy. Both theory and
Graduate Public Economics Introduction and Road Map. Emmanuel Saez
 Graduate Public Economics Introduction and Road Map Emmanuel Saez 1 PUBLIC ECONOMICS DEFINITION Public economics = Study of the role of the government in the economy Government is instrumental in most
EC230B: Graduate Public Economics Introduction and Road Map. Hilary Hoynes
 EC230B: Graduate Public Economics Introduction and Road Map Hilary Hoynes 1 EC230B Contacting me: hoynes@berkeley.edu Course web site = bcourses.berkeley.edu Office hours Tuesday 3-5, sign up on wejoinin
ECONOMIC COMMENTARY. Income Inequality Matters, but Mobility Is Just as Important. Daniel R. Carroll and Anne Chen
 ECONOMIC COMMENTARY Number 2016-06 June 20, 2016 Income Inequality Matters, but Mobility Is Just as Important Daniel R. Carroll and Anne Chen Concerns about rising income inequality are based on comparing
IGE: The State of the Literature
 PhD Student, Department of Economics Center for the Economics of Human Development The University of Chicago setzler@uchicago.edu March 10, 2015 1 Literature, Facts, and Open Questions 2 Population-level
Law and Economic Justice
 University of Oklahoma College of Law From the SelectedWorks of Jonathan B. Forman April 29, 2011 Law and Economic Justice JONATHAN B FORMAN, University of Oklahoma Available at: https://works.bepress.com/jonathan_forman/170/
Poverty and the Safety Net After the Great Recession
 Poverty and the Safety Net After the Great Recession Deep Issues of the 2012 Elections: Equality, Liberty and Democracy, Cornell University Hilary Hoynes University of California, Davis November 2012 In
Taxable Income Elasticities. 131 Undergraduate Public Economics Emmanuel Saez UC Berkeley
 Taxable Income Elasticities 131 Undergraduate Public Economics Emmanuel Saez UC Berkeley 1 TAXABLE INCOME ELASTICITIES Modern public finance literature focuses on taxable income elasticities instead of
State and Local Government Expenditures. 131 Undergraduate Public Economics Emmanuel Saez UC Berkeley
 State and Local Government Expenditures 131 Undergraduate Public Economics Emmanuel Saez UC Berkeley 1 FISCAL FEDERALISM optimal fiscal federalism: The question of which activities should take place at
HIGH AND WIDE: INCOME INEQUALITY GAP IN THE DISTRICT ONE OF BIGGEST IN THE U.S. By Wes Rivers
 An Affiliate of the Center on Budget and Policy Priorities 820 First Street NE, Suite 510 Washington, DC 20002 (202) 408-1080 Fax (202) 325-8839 www.dcfpi.org March 13, 2014 HIGH AND WIDE: INCOME INEQUALITY
Top MTR. Threshold/Averag e Income. US Top Marginal Tax Rate and Top Bracket Threshold. Top MTR (Federal Individual Income Tax)
") Source: IRS, Statistics of Income Division, Historical Table 23 Top Marginal Tax Rate and Top Bracket Threshold Top MTR (Federal Individual Income Tax) 100% 90% 80% 70% 60% 50% 40% 30% 20% 10% Top MTR
Source: IRS, Statistics of Income Division, Historical Table 23 Top Marginal Tax Rate and Top Bracket Threshold Top MTR (Federal Individual Income Tax) 100% 90% 80% 70% 60% 50% 40% 30% 20% 10% Top MTR
Poverty, Inequality, and Discrimination. Wen-Jui Han New York University
 Poverty, Inequality, and Discrimination Wen-Jui Han New York University Share of poor population below 50% of the poverty line 50.0% 45.0% 40.0% 35.0% 30.0% 25.0% 1975 1976 1977 1978 1979 1980 1981
Topic 11: Measuring Inequality and Poverty
 Topic 11: Measuring Inequality and Poverty Economic well-being (utility) is distributed unequally across the population because income and wealth are distributed unequally. Inequality is measured by the
Global economic inequality: New evidence from the World Inequality Report
 WID.WORLD THE SOURCE FOR GLOBAL INEQUALITY DATA Global economic inequality: New evidence from the World Inequality Report Lucas Chancel General coordinator, World Inequality Report Co-director, World Inequality
The intergenerational transmission of wealth
 The intergenerational transmission of wealth Miles Corak PhD program in Economics, and the Stone Center on Socio-Economic Inequality The Graduate Center, City University of New York MilesCorak.com @MilesCorak
Poverty and Income Distribution
 Poverty and Income Distribution SECOND EDITION EDWARD N. WOLFF WILEY-BLACKWELL A John Wiley & Sons, Ltd., Publication Contents Preface * xiv Chapter 1 Introduction: Issues and Scope of Book l 1.1 Recent
Real Median Family Income is Falling. Family incomes have stagnated since the mid-1980s. Income in 2012 ($51,017) is lower than in 1989 ($51,681).
 is lower than in 1989 ($51,681).") U.S. Income 1 Real Median Family Income is Falling Family incomes have stagnated since the mid-1980s. Income in 2012 ($51,017) is lower than in 1989 ($51,681). 2 Labor Income Share Falls As Profits Rise
U.S. Income 1 Real Median Family Income is Falling Family incomes have stagnated since the mid-1980s. Income in 2012 ($51,017) is lower than in 1989 ($51,681). 2 Labor Income Share Falls As Profits Rise
Heterogeneity in the Impact of Economic Cycles and the Great Recession: Effects Within and Across the Income Distribution
 Heterogeneity in the Impact of Economic Cycles and the Great Recession: Effects Within and Across the Income Distribution Marianne Bitler Department of Economics, UC Irvine and NBER mbitler@uci.edu Hilary
Extract from Income Inequality, Equality of Opportunity, and Intergenerational Mobility
 Extract from, Equality of Opportunity, and Intergenerational Mobility by Miles Journal of Economic Perspectives, 27(3): 79 102. (2013). James J. Heckman University of Chicago AEA Continuing Education Program
Income and Wealth Concentration in Switzerland over the 20 th Century
 September 2003 Income and Wealth Concentration in Switzerland over the 20 th Century Fabien Dell, INSEE Thomas Piketty, EHESS Emmanuel Saez, UC Berkeley and NBER Abstract: This paper presents homogeneous
Figure 1.1 Inequality, Economic Growth, Employment Growth, and Real Income Growth in Sweden, Germany, and the United States, 1980s and 1990s
 Figure 1.1 Inequality, Economic Growth, Employment Growth, and Real Income Growth in Sweden, Germany, and the United States, 198s and 199s Posttax-Posttransfer Individual Earnings Inequality Household
Page 1. Long-term Economic Growth
 Page 1 Long-term Economic Growth Economic Growth and Wages Logic and Experience Tell Us Economic Growth per Capita is a Necessary but Not a Sufficient Condition for the Improvement of Living Standards
Distributional National Accounts DINA
 Distributional National Accounts DINA Facundo Alvaredo Anthony B. Atkinson Thomas Piketty Emmanuel Saez Gabriel Zucman Meeting of Providers of OECD IDD Data OECD, Paris, February 18-19, 2016 Envision a
Optimal Labor Income Taxation. Thomas Piketty, Paris School of Economics Emmanuel Saez, UC Berkeley PE Handbook Conference, Berkeley December 2011
 Optimal Labor Income Taxation Thomas Piketty, Paris School of Economics Emmanuel Saez, UC Berkeley PE Handbook Conference, Berkeley December 2011 MODERN ECONOMIES DO SIGNIFICANT REDISTRIBUTION 1) Taxes:
Poverty and income inequality
 Poverty and income inequality Jonathan Cribb Public Economics Lectures, Institute for Fiscal Studies 17 th December 2012 Overview The standard of living in the UK Income Inequality The UK income distribution
Striking it Richer: The Evolution of Top Incomes in the United States (Updated with 2017 preliminary estimates)
") Striking it Richer: The Evolution of Top Incomes in the United States (Updated with 2017 preliminary estimates) Emmanuel Saez, UC Berkeley October 13, 2018 What s new for recent years? 2016-2017: Robust
Striking it Richer: The Evolution of Top Incomes in the United States (Updated with 2017 preliminary estimates) Emmanuel Saez, UC Berkeley October 13, 2018 What s new for recent years? 2016-2017: Robust
Capitalism, Inequality & Globalization. Public University of Navarre Pamplona, Spain May 21 st 2018 J. E. Stiglitz
 Capitalism, Inequality & Globalization Public University of Navarre Pamplona, Spain May 21 st 2018 J. E. Stiglitz In many ways, most advanced economies not been performing well US worst example, most European
TOP INCOMES IN THE UNITED STATES AND CANADA OVER THE TWENTIETH CENTURY
 TOP INCOMES IN THE UNITED STATES AND CANADA OVER THE TWENTIETH CENTURY Emmanuel Saez University of California, Berkeley Abstract This paper presents top income shares series for the United States and Canada
Consumption and Income Poverty for Those 65 and Over
 Consumption and Income Poverty for Those 65 and Over Bruce D. Meyer University of Chicago and NBER and James X. Sullivan University of Notre Dame Prepared for the 9th Annual Joint Conference of the Retirement
The welfare state in the US and Europe: why so different?
 The welfare state in the US and Europe: why so different? Rodolfo Debenedetti Lecture November 20th, 2002 Alberto Alesina Harvard University and IGIER Bocconi Question: Why there is less redistribution
Effective Anti-poverty Programs in the U.S
 Effective Anti-poverty Programs in the U.S Hilary Hoynes, University of California, Davis SIEPR Policy Forum on Reducing Global Poverty May 2008 1 Roadmap of talk Poverty: Definitions Poverty: Facts Government
GLOBAL INEQUALITY AND AUSTRALIA S ROLE
 GLOBAL INEQUALITY AND AUSTRALIA S ROLE PRESENTATION TO A RECEPTION HOSTED BY OXFAM AUSTRALIA GOVERNMENT HOUSE, HOBART, TASMANIA 29 TH MAY 217 The good news: global poverty has fallen by almost 6% over
The Economic Program. June 2014
 The Economic Program TO: Interested Parties FROM: Alicia Mazzara, Policy Advisor for the Economic Program; and Jim Kessler, Vice President for Policy RE: Three Ways of Looking At Income Inequality June
Effective Policy for Reducing Inequality: The Earned Income Tax Credit and the Distribution of Income
 Effective Policy for Reducing Inequality: The Earned Income Tax Credit and the Distribution of Income Hilary Hoynes, UC Berkeley Ankur Patel US Treasury April 2015 Overview The U.S. social safety net for
Notes and Definitions Numbers in the text, tables, and figures may not add up to totals because of rounding. Dollar amounts are generally rounded to t
 CONGRESS OF THE UNITED STATES CONGRESSIONAL BUDGET OFFICE The Distribution of Household Income and Federal Taxes, 2013 Percent 70 60 50 Shares of Before-Tax Income and Federal Taxes, by Before-Tax Income
Why SNAP Matters * January 25, Food Insecurity, Poverty and the SNAP s place in the U.S. Social Safety Net
 Why SNAP Matters * Hilary Hoynes, Haas Distinguished Professor of Economic Disparities, Professor of Public Policy and Economics, University of California, Berkeley January 25, 2016 1. Food Insecurity,
Wealth Returns Dynamics and Heterogeneity
 Wealth Returns Dynamics and Heterogeneity Andreas Fagereng (Statistics Norway) Luigi Guiso (EIEF) Davide Malacrino (Stanford) Luigi Pistaferri (Stanford) Wealth distribution In many countries, and over
Working paper series. Simplified Distributional National Accounts. Thomas Piketty Emmanuel Saez Gabriel Zucman. January 2019
 Washington Center Equitable Growth 1500 K Street NW, Suite 850 Washington, DC 20005 for Working paper series Simplified Distributional National Accounts Thomas Piketty Emmanuel Saez Gabriel Zucman January
Graduate Public Finance
 Graduate Public Finance Measuring Income and Wealth Inequality Owen Zidar Princeton Fall 2018 Lecture 12 Thanks to Thomas Piketty, Emmanuel Saez, Gabriel Zucman, and Eric Zwick for sharing notes/slides,
NBER WORKING PAPER SERIES GLOBAL INEQUALITY DYNAMICS: NEW FINDINGS FROM WID.WORLD
 NBER WORKING PAPER SERIES GLOBAL INEQUALITY DYNAMICS: NEW FINDINGS FROM WID.WORLD Facundo Alvaredo Lucas Chancel Thomas Piketty Emmanuel Saez Gabriel Zucman Working Paper 23119 http://www.nber.org/papers/w23119
Over the last 40 years, the U.S. federal tax system has undergone three
 Journal of Economic Perspectives Volume 21, Number 1 Winter 2006 Pages 000 000 How Progressive is the U.S. Federal Tax System? A Historical and International Perspective Thomas Piketty and Emmanuel Saez
Should the Rich Pay for Fiscal Adjustment? Income and Capital Tax Options
 Should the Rich Pay for Fiscal Adjustment? Income and Capital Tax Options Thomas Piketty Paris School of Economics Brussels, ECFIN Workshop, October 18 2012 This talk: two points 1. The rise of European
Income Inequality in France, : Evidence from Distributional National Accounts (DINA)
") Income Inequality in France, 1900-2014: Evidence from Distributional National Accounts (DINA) Bertrand Garbinti 1, Jonathan Goupille-Lebret 2 and Thomas Piketty 2 1 Paris School of Economics, Crest, and
Income Inequality in France, 1900-2014: Evidence from Distributional National Accounts (DINA) Bertrand Garbinti 1, Jonathan Goupille-Lebret 2 and Thomas Piketty 2 1 Paris School of Economics, Crest, and
Notes and Definitions Numbers in the text, tables, and figures may not add up to totals because of rounding. Dollar amounts are generally rounded to t
 CONGRESS OF THE UNITED STATES CONGRESSIONAL BUDGET OFFICE The Distribution of Household Income and Federal Taxes, 2011 Percent 70 60 Shares of Before-Tax Income and Federal Taxes, by Before-Tax Income
Online Appendix of. This appendix complements the evidence shown in the text. 1. Simulations
 Online Appendix of Heterogeneity in Returns to Wealth and the Measurement of Wealth Inequality By ANDREAS FAGERENG, LUIGI GUISO, DAVIDE MALACRINO AND LUIGI PISTAFERRI This appendix complements the evidence
Using Differences in Knowledge Across Neighborhoods to Uncover the Impacts of the EITC on Earnings
 Using Differences in Knowledge Across Neighborhoods to Uncover the Impacts of the EITC on Earnings Raj Chetty, Harvard and NBER John N. Friedman, Harvard and NBER Emmanuel Saez, UC Berkeley and NBER April
Income Distribution and Poverty
 C H A P T E R 15 Income Distribution and Poverty Prepared by: Fernando Quijano and Yvonn Quijano Income Distribution and Poverty This chapter focuses on distribution. Why do some people get more than others?
Optimal Labor Income Taxation. 131 Undergraduate Public Economics Emmanuel Saez UC Berkeley
 Optimal Labor Income Taxation 131 Undergraduate Public Economics Emmanuel Saez UC Berkeley 1 TAXATION AND REDISTRIBUTION Key question: Do/should government reduce inequality using taxes and transfers?
Sarah K. Burns James P. Ziliak. November 2013
 Sarah K. Burns James P. Ziliak November 2013 Well known that policymakers face important tradeoffs between equity and efficiency in the design of the tax system The issue we address in this paper informs
Lecture 6: Taxable Income Elasticities
 1 40 Lecture 6: Taxable Income Elasticities Stefanie Stantcheva Fall 2017 40 TAXABLE INCOME ELASTICITIES Modern public finance literature focuses on taxable income elasticities instead of hours/participation
Wealth inequality and accumulation. John Hills, Centre for Analysis of Social Exclusion, London School of Economics
 Wealth inequality and accumulation John Hills, Centre for Analysis of Social Exclusion, London School of Economics Conference on Economic and Social inequalities: Causes, implications and Some paradoxes
Income distribution and redistribution
 Income distribution and redistribution HMRC-HMT Economics of Taxation http://darp.lse.ac.uk/hmrc-hmt Frank Cowell, 7 December 2015 Overview... Income distribution and redistribution Income distribution
Public Economics Lectures Part 1: Introduction
 Public Economics Lectures Part 1: Introduction John Karl Scholz (borrowing from Raj Chetty and Gregory A. Bruich) University of Wisconsin - Madison Fall 2011 Public Economics Lectures () Part 1: Introduction
Econ 133 Global Inequality and Growth. What is Income? Gabriel Zucman
 Econ 133 Global Inequality and Growth What is Income? zucman@berkeley.edu 1 Roadmap 1. Income = domestic output + net foreign income 2. Income = labor income + capital income 3. Functional vs. personal
Measuring the Trends in Inequality of Individuals and Families: Income and Consumption
 Measuring the Trends in Inequality of Individuals and Families: Income and Consumption by Jonathan D. Fisher U.S. Census Bureau David S. Johnson* U.S. Census Bureau Timothy M. Smeeding University of Wisconsin
AEI Center on Housing Markets and Finance Announces Ten Best and Worst Metro Areas to Be a First Time Homebuyer
 AEI Center on Housing Markets and Finance Announces Ten Best and Worst Metro Areas to Be a First Time Homebuyer Edward Pinto and Tobias Peter November 28th, 2018 New AEI study ranks 50 metros by home price
Econ 133 Global Inequality and Growth. What is Income? Gabriel Zucman
 Econ 133 Global Inequality and Growth What is Income? zucman@berkeley.edu 1 Roadmap 1. Income = domestic output + net foreign 2. Income = labor + capital 3. Functional vs. personal distribution 4. Factor
A. Data Sample and Organization. Covered Workers
 Web Appendix of EARNINGS INEQUALITY AND MOBILITY IN THE UNITED STATES: EVIDENCE FROM SOCIAL SECURITY DATA SINCE 1937 by Wojciech Kopczuk, Emmanuel Saez, and Jae Song A. Data Sample and Organization Covered
Heterogeneity in Returns to Wealth and the Measurement of Wealth Inequality 1
 Heterogeneity in Returns to Wealth and the Measurement of Wealth Inequality 1 Andreas Fagereng (Statistics Norway) Luigi Guiso (EIEF) Davide Malacrino (Stanford University) Luigi Pistaferri (Stanford University
Lecture 3: Tax Incidence and Efficiency Costs of Taxation
 1 50 Lecture 3: Tax Incidence and Efficiency Costs of Taxation Stefanie Stantcheva Fall 2017 19.1 Tax Incidence C H A P T E R 1 9 T H E E Q U I T Y I M P L I C A T I O N S O F T A X A T I O N : T A X
Striking it Richer: The Evolution of Top Incomes in the United States (Updated with 2009 and 2010 estimates)
") Striking it Richer: The Evolution of Top Incomes in the United States (Updated with 2009 and 2010 estimates) Emmanuel Saez March 2, 2012 What s new for recent years? Great Recession 2007-2009 During the
Striking it Richer: The Evolution of Top Incomes in the United States (Updated with 2009 and 2010 estimates) Emmanuel Saez March 2, 2012 What s new for recent years? Great Recession 2007-2009 During the
The State of the Safety Net in the Post- Welfare Reform Era
 The State of the Safety Net in the Post- Welfare Reform Era Marianne Bitler (UC Irvine) Hilary W. Hoynes (UC Davis) Paper prepared for Brookings Papers on Economic Activity, Sept 21 Motivation and Overview
Taxing Food for Home Consumption
 Taxing Food for Home Consumption Taxing the Poor: Road Map Regional differences in income poverty & poverty related outcomes Historical patterns of property tax Emergence of supermajority rules Growth
Income Inequality, Mobility and Turnover at the Top in the U.S., Gerald Auten Geoffrey Gee And Nicholas Turner
 Income Inequality, Mobility and Turnover at the Top in the U.S., 1987 2010 Gerald Auten Geoffrey Gee And Nicholas Turner Cross-sectional Census data, survey data or income tax returns (Saez 2003) generally
Fiscal Fact. Reversal of the Trend: Income Inequality Now Lower than It Was under Clinton. Introduction. By William McBride
 Fiscal Fact January 30, 2012 No. 289 Reversal of the Trend: Income Inequality Now Lower than It Was under Clinton By William McBride Introduction Numerous academic studies have shown that income inequality
ECON 361: Income Distributions and Problems of Inequality
 ECON 361: Income Distributions and Problems of Inequality David Rosé Queen s University February 9, 2017 1/35 Last class... Top income share in Canada- Veall (2012( Income inequality in the U.S. - Piketty
CBO MEMORANDUM ESTIMATES OF FEDERAL TAX LIABILITIES FOR INDIVIDUALS AND FAMILIES BY INCOME CATEGORY AND FAMILY TYPE FOR 1995 AND 1999.
 CBO MEMORANDUM ESTIMATES OF FEDERAL TAX LIABILITIES FOR INDIVIDUALS AND FAMILIES BY INCOME CATEGORY AND FAMILY TYPE FOR 1995 AND 1999 May 1998 PESTHBÖTIÖK 8TATCMEMT A Appfoyadl far prabkei r.tea» K> CONGRESSIONAL
The Distribution of Federal Taxes, Jeffrey Rohaly
 www.taxpolicycenter.org The Distribution of Federal Taxes, 2008 11 Jeffrey Rohaly Overall, the federal tax system is highly progressive. On average, households with higher incomes pay taxes that are a
ECON 361: Income Distributions and Problems of Inequality
 ECON 361: Income Distributions and Problems of Inequality David Rosé Queen s University February 7, 2018 1/1 Last class... Top income share in Canada- Veall (2012) Income inequality in the U.S. - Piketty
Comment on Gary V. Englehardt and Jonathan Gruber Social Security and the Evolution of Elderly Poverty
 Comment on Gary V. Englehardt and Jonathan Gruber Social Security and the Evolution of Elderly Poverty David Card Department of Economics, UC Berkeley June 2004 *Prepared for the Berkeley Symposium on
THIRD EDITION. ECONOMICS and. MICROECONOMICS Paul Krugman Robin Wells. Chapter 18. The Economics of the Welfare State
 THIRD EDITION ECONOMICS and MICROECONOMICS Paul Krugman Robin Wells Chapter 18 The Economics of the Welfare State WHAT YOU WILL LEARN IN THIS CHAPTER What the welfare state is and the rationale for it
Inequality: Why should we care?
 Inequality: Why should we care? Byron Gangnes Professor of Economics Senior Research Fellow, UHERO University of Hawaii at Manoa VLI February 2019 Hawaii Island Economic inequality Inequality a central
Inequality in developed countries - how good is a good state. Åsa Hansson Lunds universitet
 Inequality in developed countries - how good is a good state Åsa Hansson Lunds universitet Inequality in developed countries We have seen increased inequality in developed countries How do we combat this
Rethinking Wealth Taxation
 Rethinking Wealth Taxation Thomas Piketty (Paris School of Economics Gabriel Zucman (London School of Economics) November 2014 This talk: two points Wealth is becoming increasingly important relative to
How Progressive is the U.S. Federal Tax System? A Historical and International Perspective
 Revised paper July 2006 How Progressive is the U.S. Federal Tax System? A Historical and International Perspective Thomas Piketty and Emmanuel Saez Abstract (NBER version only): This paper provides estimates
Living Arrangements, Doubling Up, and the Great Recession: Was This Time Different?
 Living Arrangements, Doubling Up, and the Great Recession: Was This Time Different? Marianne Bitler (UC Irvine) Hilary Hoynes (UC Berkeley) AEA session on How Did the Safety Net Perform During the Great
INCOME DISTRIBUTION WITHIN COUNTRIES: RISING INEQUALITY
 Brief INCOME DISTRIBUTION WITHIN COUNTRIES: RISING INEQUALITY August 2016 Kemal Derviş Senior Fellow Global Economy and Development at the Brookings Institution Zia Qureshi Nonresident Senior Fellow Global
INCOME MOBILITY IN THE U.S. FROM 1996 TO 2005 REPORT OF THE
 INCOME MOBILITY IN THE U.S. FROM 1996 TO 2005 REPORT OF THE DEPARTMENT OF THE TREASURY NOVEMBER 13, 2007 SUMMARY This study examines income mobility of individuals over the past decade (1996 through 2005)
131: Public Economics Taxes on Capital and Savings
 131: Public Economics Taxes on Capital and Savings Emmanuel Saez Berkeley 1 MOTIVATION 1) Capital income is about 25% of national income (labor income is 75%) but distribution of capital income is much
Capitalism, Inequality & Globalization. J. E. Stiglitz Davidson College March 2018
 Capitalism, Inequality & Globalization J. E. Stiglitz Davidson College March 2018 Outline 1. Multiple ways in which the US economy has not been performing well for large parts of the country 2. The macro-economic
Understanding Inequality, Poverty and Intergenerational Mobility
 Hong Kong Ideas Centre: 7 March 2014 Understanding Inequality, Poverty and Intergenerational Mobility Y C Richard Wong The University of Hong Kong Outline Politics and Analysis Individual Income Inequality
Paying Out-of-Pocket
 September 2017 Paying Out-of-Pocket The Healthcare Spending of 2 Million US Families Healthcare costs are rising for families. In 2015 the US spent 18 percent of Gross Domestic Product (GDP) on healthcare,
Income Progress across the American Income Distribution,
 Income Progress across the American Income Distribution, 2000-2005 Testimony for the Committee on Finance U.S. Senate Room 215 Dirksen Senate Office Building 10:00 a.m. May 10, 2007 by GARY BURTLESS* *
50-State Property Tax Comparison Study: For Taxes Paid in Executive Summary
 50-State Property Tax Comparison Study: For Taxes Paid in 2017 Executive Summary By Lincoln Institute of Land Policy and Minnesota Center for Fiscal Excellence April 2018 As the largest source of revenue
Econ 230B Spring FINAL EXAM: Solutions
 Econ 230B Spring 2017 FINAL EXAM: Solutions The average grade for the final exam is 45.82 (out of 60 points). The average grade including all assignments is 79.38. The distribution of course grades is:
A Guide to Statistics on Historical Trends in Income Inequality
 Updated October 11, 2017 A Guide to Statistics on Historical Trends in Income Inequality By Chad Stone, Danilo Trisi, Arloc Sherman, and Emily Horton 1 The broad facts of income inequality over the past
Poverty, Inequality and the Welfare State
 Poverty, Inequality and the Welfare State Lectures 3 and 4 Le Grand, Propper and Smith (2008): Chp 9 Stiglitz (2000): Chp 14 Connolly and Munro (1999): Chp 14, 15, 16, 17 Outline Income and wealth defined
Chapter 7. Government Subsidies and Income Support for the Poor
 Chapter 7 Government Subsidies and Income Support for the Poor Copyright 2002 Thomson Learning, Inc. Thomson Learning is a trademark used herein under license. ALL RIGHTS RESERVED. Instructors of classes
Online Appendix for: Consumption Reponses to In-Kind Transfers: Evidence from the Introduction of the Food Stamp Program
 Online Appendix for: Consumption Reponses to In-Kind Transfers: Evidence from the Introduction of the Food Stamp Program Hilary W. Hoynes University of California, Davis and NBER hwhoynes@ucdavis.edu and
Tax Transfer Policy and Labor Market Outcomes
 Final Version Tax Transfer Policy and Labor Market Outcomes Nada Eissa Georgetown University and NBER The Car Barn, #418 Prospect St. Washington DC, 20007 Phone 202 687 0626 Fax 202 687 5544 Email: noe@georgetown.edu
Poverty, the Social Safety Net and the Great Recession
 Poverty, the Social Safety Net and the Great Recession Hilary Hoynes, University of California Berkeley IX Rodolfo Debenedetti Lecture October 15, 2014 Bocconi University Overview The Great Recession led
The Brookings Institution Metropolitan Policy Program Bruce Katz, Director
 The Brookings Institution Metropolitan Policy Program Bruce Katz, Director Diagnosing Cities: Lessons from America Delivering Sustainable Communities Summit February 1st, 2005 Diagnosing Cities Lessons
The SOI Databank: A case study in leveraging administrative data in support of evidence-based policymaking
 Statistical Journal of the IAOS 34 (2018) 99 103 99 DOI 10.3233/SJI-170418 IOS Press The SOI Databank: A case study in leveraging administrative data in support of evidence-based policymaking Raj Chetty
Income inequality an insufficient consumption in China. Li Gan Southwestern University of Finance and Economics Texas A&M University
 Income inequality an insufficient consumption in China Li Gan Southwestern University of Finance and Economics Texas A&M University 目 1 An Introduction of CHFS Contents 2 3 Inequality and Consumption A
FOR IMMEDIATE RELEASE Contact: Ann Marie Gorden/Robert Nihen
 cutting through complexity News FOR IMMEDIATE RELEASE Contact: Ann Marie Gorden/Robert Nihen June 24, 2014 KPMG LLP 201-505-6288/201-307-8296 agorden@kpmg.com / rnihen@kpmg.com CINCINNATI, CLEVELAND, ATLANTA
Inequality Dynamics in France, : Evidence from Distributional National Accounts (DINA)
") Inequality Dynamics in France, 1900-2014: Evidence from Distributional National Accounts (DINA) Bertrand Garbinti 1, Jonathan Goupille-Lebret 2 and Thomas Piketty 2 1 Paris School of Economics, Crest,
Inequality Dynamics in France, 1900-2014: Evidence from Distributional National Accounts (DINA) Bertrand Garbinti 1, Jonathan Goupille-Lebret 2 and Thomas Piketty 2 1 Paris School of Economics, Crest,
The Brookings Institution Center on Urban and Metropolitan Policy Bruce Katz, Director
 The Brookings Institution Center on Urban and Metropolitan Policy Bruce Katz, Director The New Art of Governing Presentation at the Fannie Mae Foundation Annual Housing Conference October 17th, 2003 The
Optimal Labor Income Taxation (follows loosely Chapters of Gruber) 131 Undergraduate Public Economics Emmanuel Saez UC Berkeley
 131 Undergraduate Public Economics Emmanuel Saez UC Berkeley") Optimal Labor Income Taxation (follows loosely Chapters 20-21 of Gruber) 131 Undergraduate Public Economics Emmanuel Saez UC Berkeley 1 TAXATION AND REDISTRIBUTION Key question: Should government reduce
Optimal Labor Income Taxation (follows loosely Chapters 20-21 of Gruber) 131 Undergraduate Public Economics Emmanuel Saez UC Berkeley 1 TAXATION AND REDISTRIBUTION Key question: Should government reduce
Health Insurance Coverage in 2013: Gains in Public Coverage Continue to Offset Loss of Private Insurance
 Health Insurance Coverage in 2013: Gains in Public Coverage Continue to Offset Loss of Private Insurance Laura Skopec, John Holahan, and Megan McGrath Since the Great Recession peaked in 2010, the economic