Should the Rich Pay for Fiscal Adjustment? Income and Capital Tax Options
|
|
|
- Poppy McLaughlin
- 5 years ago
- Views:
Transcription
1 Should the Rich Pay for Fiscal Adjustment? Income and Capital Tax Options Thomas Piketty Paris School of Economics Brussels, ECFIN Workshop, October
2 This talk: two points 1. The rise of European wealth-income ratios - Top income shares much more in US than in Europe - But wealth-income ratios much more in Europe (EU GDP: 12tr ; net private wealth: 60tr = 500% GDP) (memo: China s reserves < 3tr : 20 times smaller) In Europe, main fiscal reserve = wealth taxation (while in US, main reserve = top income taxation) 2. A proposal for a European wealth tax - A comprehensive wealth tax with rate 1% above 1m and 2% above 5m would raise 2% of EU GDP - Other options (top income tax, corporate tax, FTT) are also useful, but raise less revenue
3 1. The Rise of European wealth-income ratios Top income shares much more in US than in Europe World Top Incomes Database: 25 countries, annual series over most of 20 C, largest existing historical data set on income inequality In US, top 10% income share rose from 35% to 50% of national income (top 1% share rose from <10% to >20%) and absorbed 70% of macro growth over In Continental Europe, there was also a rise in top income shares, but it started later (mid 1990s rather than early 1980s) and was quantitatively much smaller F Hollande s 75% top rate above 1m would be much more useful in US than in France
4
5 50% 45% 40% 35% 30% 25% Share of total income going to Top 10% FIGURE 1 The Top Decile Income Share in the United States, Source: Piketty and Saez (2003), series updated to Income is defined as market income including realized capital gains (excludes government transfers).
6 25% 20% 15% 10% 5% 0% Top 1% (incomes above $352,000 in 2010) Top 5-1% (incomes between $150,000 and $352,000) Top 10-5% (incomes between $108,000 and $150,000) FIGURE 2 Decomposing the Top Decile US Income Share into 3 Groups, Share of total income accruing to each group
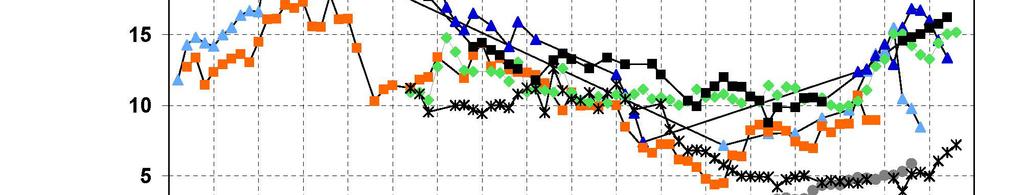
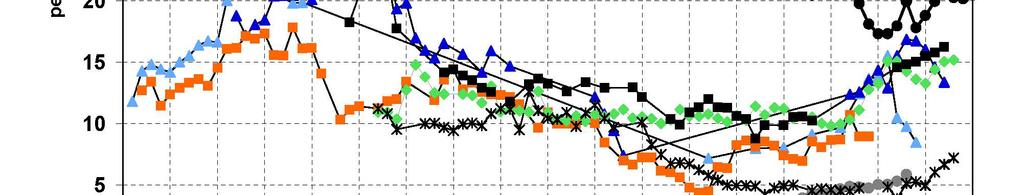
7 Top 1% share: English Speaking countries (U-shaped), Top Percentile Share (in percent) United States United Kingdom Canada Australia Ireland New Zealand
8 Top 1% share: Continental Europe and Japan (L-shaped), Top Percentile Share (in percent) France Germany Netherlands Switzerland Japan Sweden
9 Top 1% share: Continental Europe, North vs South (L-shaped), Top Percentile Share (in percent) France Germany Spain Italy Sweden
10 Share of total income going to top 10% (incl. realized capital gains 50% 45% 40% 35% 30% Top Decile Income Shares U.S. U.K. Germany France 25% Source: World Top Incomes Database, Missing values interpolated using top 5% and top 1% series.
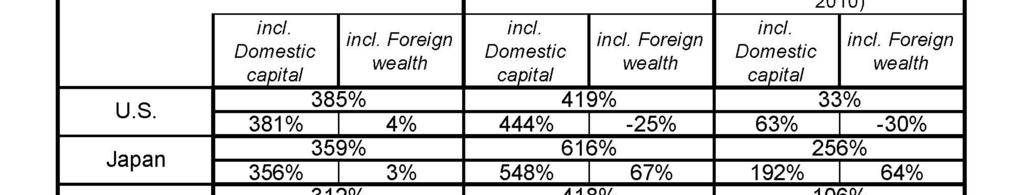
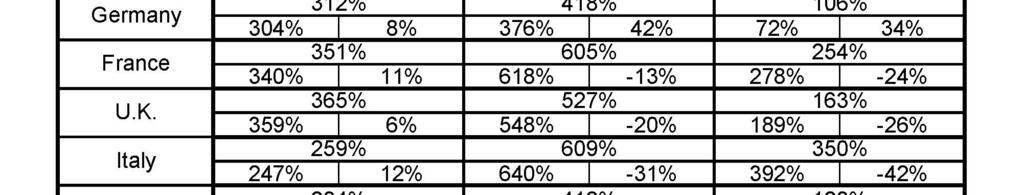
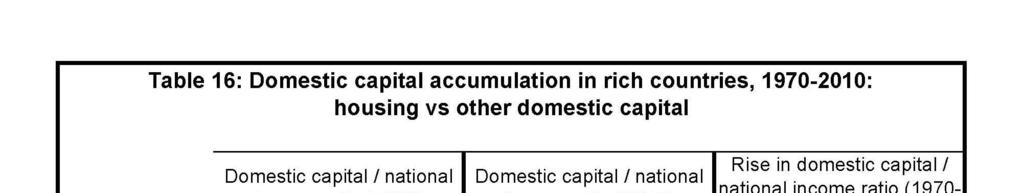
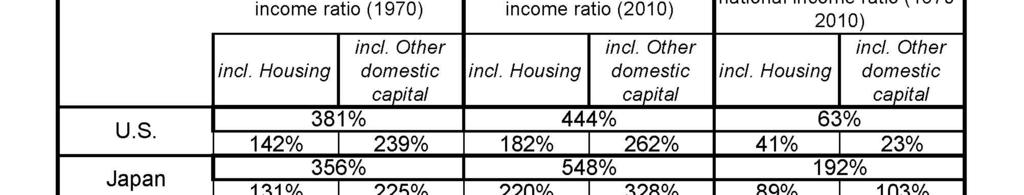
11 But wealth-income ratios much more in Europe Results from Piketty-Zucman, «Capital is Back: Wealth-Income Ratios in Rich Countries » How do aggregate wealth-income ratios evolve in the long run, and why? Until recently, it was impossible to adress properly this basic question: national accounts were mostly about flows on income, output, savings, etc., and very little about stocks of assets and liabilities In this paper we compile a new data set of national balance sheets in order to adress this question: : US, Japan, Germany, France, UK, Italy, Canada, Australia (= top 8 rich countries) : US, Germany, France, UK (official national accounts + historical estimates)
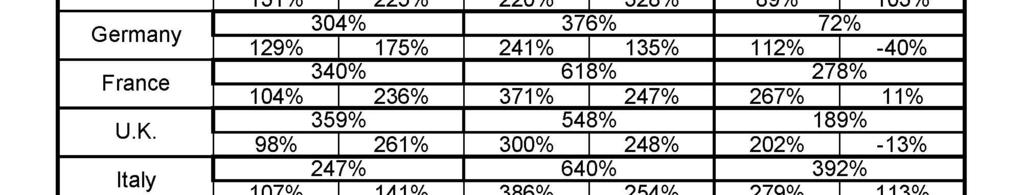
12 Result 1: we find in every country a gradual rise of wealth-income ratios over period, from about 200%-300% in 1970 to 400%-600% in 2010 Result 2: in effect, today s ratios seem to be returning towards the high values observed in 19 c Europe (600%-700%) This can be accounted for by a combination of factors: - Politics: long run asset price recovery effect (itself driven by changes in capital policies since WWs) - Economics: slowdown of productivity and pop growth Harrod-Domar-Solow: wealth-income ratio β = s/g If saving rate s=10% & growth rate g=3%, then β 300% But if s=10% & g=1.5%, then β 600% Explains long run change & level diff Europe vs US
13 800% Private wealth / national income ratios, % 600% USA Germany UK Canada Japan France Italy Australia 500% 400% 300% 200% 100% Authors' computations using country national accounts. Private wealth = non-financial assets + financial assets - financial liabilities (household & non-profit sectors)
14 Private wealth / national income ratios, (incl. Spain) 800% 700% USA Japan Germany France UK Italy Canada Spain Australia 600% 500% 400% 300% 200% 100% Authors' computations using country national accounts. Private wealth = non-financial assets + financial assets - financial liabilities (household & non-profit sectors)
15 800% Private wealth / national income ratios in Europe, % Germany 600% France 500% UK 400% 300% 200% 100% Authors' computations using country national accounts. Private wealth = non-financial assets + financial assets - financial liabilities (household & non-profit sectors)
16 800% Private wealth / national income ratios % USA 600% Europe 500% 400% 300% 200% 100% Authors' computations using country national accounts. Private wealth = non-financial assets + financial assets - financial liabilities (household & non-profit sectors)
17 800% 700% Private vs governement wealth, (% national income) USA Japan Germany France 600% UK Canada Italy Australia 500% 400% 300% 200% 100% Private wealth Government wealth 0% -100% Authors' computations using country national accounts. Government wealth = non-financial assets + financial assets - financial liabilities (govt sector)
18 2. A Proposal for a European Wealth Tax Comprehensive wealth tax based upon market-value personal net worth = non-fin. + financial assets liabilities Very different from 19 c style wealth tax based upon cadastral values ( repealed in Germany, Spain, Sweden..) Closer to French ISF (annual wealth returns with assets valued at market prices; ISF created in late 20 c : inflation) But with a broader tax base than ISF, and with returns prefilled by tax administration on the basis of information transmitted by banks It requires a lot of information, but this is technically doable Key is political: we should not have free trade agreements without automated cross-border information exchange on financial assets and financial flows
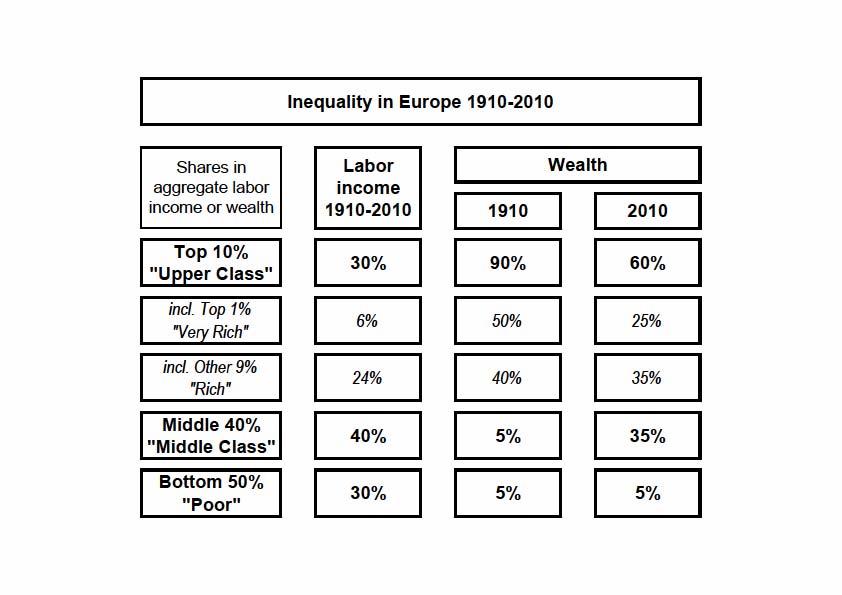
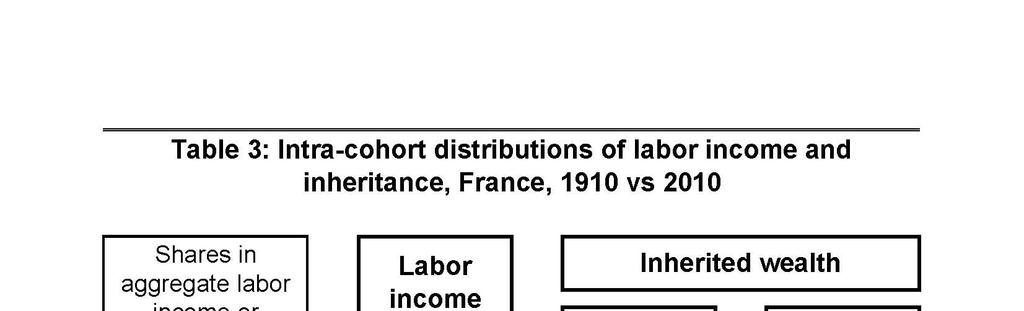
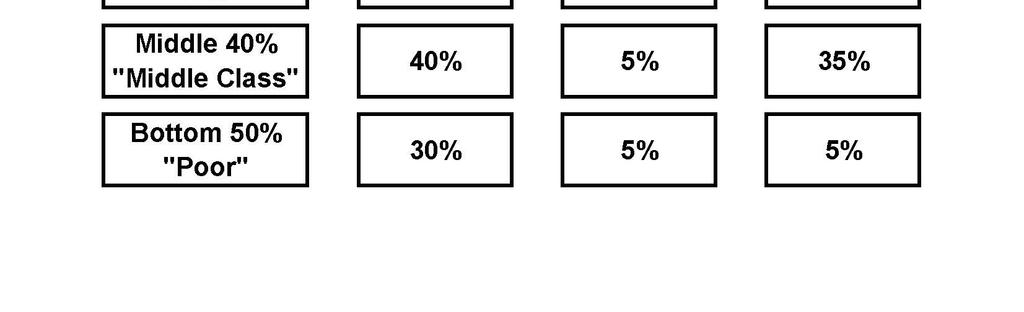
19 An illustrative tax schedule: Marginal tax rate = 1% if net wealth > 1m (about 2,5% of EU pop) Marginal tax rate = 2% if net wealth > 5m (about 0,2% of EU pop) Simulations: this would raise 2% of EU GDP Why so much revenue? For two reasons: (1) Aggregate private wealth is very large : 500% GDP (2) Wealth is highly concentrated: top 10% wealth holders have 60% of aggregate wealth, and top 1% have 25% I.e. top 1% wealth tax base = 125% of GDP (top 2.5% wealth tax base = 200% GDP, top 0.1% = 50%)
20
21 Other options raise less revenue FTT: less than 0,5% GDP (much less if successful) (double dividend illusion) Top income tax: about 0,5% GDP with a 20% supplementary tax rate on top 1% incomes ( ) (top 1% income tax base = 5% GDP) Corporate tax: about 1% GDP with a 10% supplementary tax rate on corporate profits (corporate tax base = 10%-12% GDP) all these options are useful, especially corporate tax, given tax competition and large decline in rates; but in the long run the wealth tax is even more useful
22 38% 36% 34% 32% 30% Corporate tax competition in the EU Average statutory corporate tax rate (EU 27) Average effective corporate tax rate (EU 27) 28% 26% 24% 22% 20% Source: Taxation trends in the EU, Eurostat 2011
23 50% 48% 46% 44% Personal income tax competition in the EU Average top personal income tax rate (Euro zone) Average top personal income tax rate (EU 27) 42% 40% 38% 36% Source: Taxation trends in the EU, Eurostat 2011
24 Summing up Eurotax can be useful if it helps member countries raise the tax revenue (1) that are adapted to their economic fundamentals; (2) which they cannot raise on their own Wealth tax meets the two criteria Top income or corporate tax meets also the two criteria; corporate tax is a tempting and useful option, especially given large decline in tax rate; but in the long run wealth tax is even more useful: it raises more revenue, and in a more efficient manner (better to tax stock rather than flow) VAT or general income or payroll tax increase meets none of the criteria: it is not adapted to economic fundamentals, and countries can easily raise them alone
25 Supplementary slides
26 Share of total income going to Top 10% 50% 45% 40% 35% 30% 25% Including capital gains Excluding capital gains FIGURE 1 The Top Decile Income Share in the United States, Source: Piketty and Saez (2003), series updated to Income is defined as market income including realized capital gains (excludes government transfers).
27
28
29 100% Top Income Tax Rates Top marginal income tax rate applying to top income 90% 80% 70% 60% 50% 40% 30% 20% 10% 0% U.S. U.K. Germany France Source: World Top Incomes Database, 2012.
30 800% The changing nature of national wealth, UK (% national income) 700% 600% 500% 400% 300% 200% Net foreign assets Other domestic capital Housing Agricultural land 100% 0% National wealth = agricultural land + housing + other domestic capital goods + net foreign assets
31 Concepts & methods National income Y = domestic output Y d + r NFA Private wealth W = non-financial assets + financial assets financial liabilities (household & non-profit sector) β = W/Y = private wealth-national income ratio Govt wealth W g = non-fin + fin assets - fin liab (govt sector) National wealth W n = W + W g = K + NFA with K = domestic capital (= land + housing + other domestic k) NFA = net foreign assets β n = W n /Y = national wealth-national income ratio Domestic output Y d = F(K,L) (L = labor input) (e.g. K α L 1-α ) Capital share α = r β (r = average rate of return to wealth)
32 Table 2: Growth rate vs private saving rate in rich countries, Real growth rate of national income Population growth rate Real growth rate of per capita national income Net private saving rate (personal + corporate) (% national income) U.S. 2.8% 1.0% 1.8% 7.7% Japan 2.5% 0.5% 2.0% 14.6% Germany 2.0% 0.2% 1.8% 12.2% France 2.2% 0.5% 1.7% 11.1% U.K. 2.2% 0.3% 1.9% 7.3% Italy 1.9% 0.3% 1.6% 15.0% Australia 3.2% 1.4% 1.7% 9.9%
33 Observed vs predicted private wealth / national income ratio (2010) Observed wealth / income ratio % 650% 600% 550% 500% 450% 400% 350% 300% Italy Japan France U.K. Australia U.S. Canada Germany 300% 350% 400% 450% 500% 550% 600% 650% 700% Predicted wealth / income ratio 2010 (on the basis of 1970 initial wealth and cumulated saving flows) (additive decomposition, incl. R&D)
34
35
36 900% National vs foreign wealth, (% national income) 800% 700% 600% USA Germany UK Canada Japan France Italy Australia 500% 400% 300% 200% 100% National wealth Net foreign wealth 0% -100% Authors' computations using country national accounts. Net foreign wealth = net foreign assets owned by country residents in rest of the world (all sectors)

37
38 110% National income / domestic product ratios, % USA Germany UK Canada Japan France Italy Australia 100% 95% 90% Authors' computations using country national accounts. National income = domestic product + net foreign income
39 900% 800% 700% 600% USA Germany UK Canada Domestic capital / output ratios, Japan France Italy Australia 500% 400% 300% 200% 100% Authors' computations using country national accounts. Domestic capital/output ratio = (national wealth - foreign wealth)/domestic product

40
41 40% 36% 32% 28% Annual inheritance flow as a fraction of disposable income, France Economic flow (computed from national wealth estimates, mortality tables and observed age-wealth profiles) Fiscal flow (computed from observed bequest and gift tax data, inc. tax exempt assets) 24% 20% 16% 12% 8% 4% 0% Source: T. Piketty, "On the long-run evolution of inheritance", QJE 2011
42 40% 36% 32% 28% Figure 1: Annual inheritance flow as a fraction of national income, France Economic flow (computed from national wealth estimates, mortality tables and observed age-wealth profiles) Fiscal flow (computed from observed bequest and gift tax data, inc. tax exempt assets) 24% 20% 16% 12% 8% 4% 0%
43
44 100% 90% 80% 70% U.S. U.K. France Top Inheritance Tax Rates % 50% Germany 40% 30% 20% 10% 0%
Capital is Back: Wealth-Income Ratios in Rich Countries Thomas Piketty & Gabriel Zucman Paris School of Economics October 2012
 Capital is Back: Wealth-Income Ratios in Rich Countries 1870-2010 Thomas Piketty & Gabriel Zucman Paris School of Economics October 2012 How do aggregate wealth-income ratios evolve in the long run, and
Rethinking Wealth Taxation
 Rethinking Wealth Taxation Thomas Piketty (Paris School of Economics Gabriel Zucman (London School of Economics) November 2014 This talk: two points Wealth is becoming increasingly important relative to
Inequality, Capitalism & Crisis in the Long Run. Thomas Piketty Paris School of Economics Paris, AFEP Conference, July 6 th 2012
 Inequality, Capitalism & Crisis in the Long Run Thomas Piketty Paris School of Economics Paris, AFEP Conference, July 6 th 2012 Why inequality keeps rising? Long run distributional trends = key question
FIGURE I.1. Income inequality in the United States,
 FIGURE I.1. Income inequality in the United States, 1910 2010 The top decile share in US national income dropped from 45 50 percent in the 1910s 1920s to less than 35 percent in the 1950s (this is the
Wealth, inequality & assets: where is Europe heading?
 Wealth, inequality & assets: where is Europe heading? Thomas Piketty Paris School of Economics DG ECFIN Annual Research Conference Brussels, November 23 rd 2010 Can we study macro issues without looking
Capital in the 21 st century
 Capital in the 21 st century Thomas Piketty Paris School of Economics Lisbon, April 27 2015 This presentation is based upon Capital in the 21 st century (Harvard University Press, March 2014) This book
Inequality and growth Thomas Piketty Paris School of Economics
 Inequality and growth Thomas Piketty Paris School of Economics Bercy, January 23 2015 This presentation is based upon Capital in the 21 st century (Harvard University Press, March 2014) This book studies
Wealth, Inequality & Taxation. Thomas Piketty Paris School of Economics Berlin FU, June 13 th 2013 Lecture 1: Roadmap & the return of wealth
 Wealth, Inequality & Taxation Thomas Piketty Paris School of Economics Berlin FU, June 13 th 2013 Lecture 1: Roadmap & the return of wealth These lectures will focus primarily on the following issue: how
Capital in the 21 st century
 Capital in the 21 st century Thomas Piketty Paris School of Economics Santiago de Chile, January 13 2015 This presentation is based upon Capital in the 21 st century (Harvard University Press, March 2014)
Income Inequality in France, : Evidence from Distributional National Accounts (DINA)
") Income Inequality in France, 1900-2014: Evidence from Distributional National Accounts (DINA) Bertrand Garbinti 1, Jonathan Goupille-Lebret 2 and Thomas Piketty 2 1 Paris School of Economics, Crest, and
Income Inequality in France, 1900-2014: Evidence from Distributional National Accounts (DINA) Bertrand Garbinti 1, Jonathan Goupille-Lebret 2 and Thomas Piketty 2 1 Paris School of Economics, Crest, and
long run inequality History and Inequality University of Oslo
 long run inequality History and Inequality University of Oslo 5 Figure 8.1. Income inequality in France, 1910-2010 Share of top decile in total (incomes or wages) 45% 4 35% 3 25% Share of top income
Econ 133 Global Inequality and Growth. What is Income? Gabriel Zucman
 Econ 133 Global Inequality and Growth What is Income? zucman@berkeley.edu 1 Roadmap 1. Income = domestic output + net foreign income 2. Income = labor income + capital income 3. Functional vs. personal
Econ 133 Global Inequality and Growth. What is Income? Gabriel Zucman
 Econ 133 Global Inequality and Growth What is Income? zucman@berkeley.edu 1 Roadmap 1. Income = domestic output + net foreign 2. Income = labor + capital 3. Functional vs. personal distribution 4. Factor
Inequality Dynamics in France, : Evidence from Distributional National Accounts (DINA)
") Inequality Dynamics in France, 1900-2014: Evidence from Distributional National Accounts (DINA) Bertrand Garbinti 1, Jonathan Goupille-Lebret 2 and Thomas Piketty 2 1 Paris School of Economics, Crest,
Inequality Dynamics in France, 1900-2014: Evidence from Distributional National Accounts (DINA) Bertrand Garbinti 1, Jonathan Goupille-Lebret 2 and Thomas Piketty 2 1 Paris School of Economics, Crest,
Annuities: a private solution to longevity risk
 Annuities: a private solution to longevity risk Product & Knowledge Fair 2007 Rüschlikon 30 March 2007 Thomas Hess Head of Economic Research & Consulting Veronica Scotti Client Solutions Need for private
Globalization, Inequality, and Tax Justice
 Globalization, Inequality, and Tax Justice Gabriel Zucman (UC Berkeley) November 2017 How can we make globalization and tax justice compatible? One of the most pressing policy questions of our time: Globalization
Growth in OECD Unit Labour Costs slows to 0.4% in the third quarter of 2016
 Growth in OECD Unit Labour Costs slows to.4% in the third quarter of 26 Growth in unit labour costs (ULCs) in the OECD area slowed to.4% in the third quarter of 26 (compared with.6% in the previous quarter)
GLOBAL INEQUALITY AND AUSTRALIA S ROLE
 GLOBAL INEQUALITY AND AUSTRALIA S ROLE PRESENTATION TO A RECEPTION HOSTED BY OXFAM AUSTRALIA GOVERNMENT HOUSE, HOBART, TASMANIA 29 TH MAY 217 The good news: global poverty has fallen by almost 6% over
Capital in the 21 st century. Thomas Piketty Paris School of Economics Cologne, December 5 th 2013
 Capital in the 21 st century Thomas Piketty Paris School of Economics Cologne, December 5 th 2013 This lecture is based upon Capital in the 21 st century (Harvard Univ. Press, March 2014) This book studies
Global economic inequality: New evidence from the World Inequality Report
 WID.WORLD THE SOURCE FOR GLOBAL INEQUALITY DATA Global economic inequality: New evidence from the World Inequality Report Lucas Chancel General coordinator, World Inequality Report Co-director, World Inequality
Demographic Trends and the Real Interest Rate
 Demographic Trends and the Real Interest Rate Noëmie Lisack Rana Sajedi Gregory Thwaites Bank of England November 2017 This does not represent the views of the Bank of England 1 / 43 Disclaimer This does
LECTURE 9: THE RETURN OF CAPITAL IN THE 21 ST CENTURY
 LECTURE 9: THE RETURN OF CAPITAL IN THE 21 ST CENTURY Dr. Aidan Regan Email: aidan.regan@ucd.ie Website: www.aidanregan.com Teaching blog: www.capitalistdemocracy.wordpress.com Twitter: @aidan_regan #CapitalUCD
The euro area in a globalized economy: An ESM perspective
 The euro area in a globalized economy: An ESM perspective Rolf Strauch, Chief Economist, Member of the Management Board 3 rd Annual BBVA European Debt Conference New York, 4 October 217 The euro area:
Global Health and the role of biopharma. Adapting the Innovation Landscape UK Biopharma R&D Sourcebook 2015
 Global Health and the role of biopharma Adapting the Innovation Landscape UK Biopharma R&D Sourcebook 2015 Health Expenditure as a % of GDP 3.1 The growth of total expenditure on health as a share of gross
Statistical annex. Sources and definitions
 Statistical annex Sources and definitions Most of the statistics shown in these tables can be found as well in several other (paper or electronic) publications or references, as follows: the annual edition
Wealth, Inequality & Taxation T. Piketty, IMF Supplementary slides
 Wealth, Inequality & Taxation T. Piketty, IMF 27-09-2012 Supplementary slides Decomposition results: 1870-2010 Annual series for US, Germany, France, UK, 1870-2010 Additive vs multiplicative decomposition
Tax Burden, Tax Mix and Economic Growth in OECD Countries
 Tax Burden, Tax Mix and Economic Growth in OECD Countries PAOLA PROFETA RICCARDO PUGLISI SIMONA SCABROSETTI June 30, 2015 FIRST DRAFT, PLEASE DO NOT QUOTE WITHOUT THE AUTHORS PERMISSION Abstract Focusing
EUROPA - Press Releases - Taxation trends in the European Union EU27 tax...of GDP in 2008 Steady decline in top corporate income tax rate since 2000
 DG TAXUD STAT/10/95 28 June 2010 Taxation trends in the European Union EU27 tax ratio fell to 39.3% of GDP in 2008 Steady decline in top corporate income tax rate since 2000 The overall tax-to-gdp ratio1
Revised and extended national wealth series: Australia, Canada, France, Germany, Italy, Japan, the UK and the USA
 WID.world WORKING PAPER SERIES N 2017/23 Revised and extended national wealth series: Australia, Canada, France, Germany, Italy, Japan, the UK and the USA Luis E. Bauluz December 2017 Revised and extended
The Long-Run Determinants of Inequality: What Can We Learn From Top Income Data?
 The Long-Run Determinants of Inequality: What Can We Learn From Top Income Data? Jesper Roine, Jonas Vlachos and Daniel Waldenström (paper at: www.anst.uu.se/danwa175 ) XXIV International Conference of
STAT/12/ October Household saving rate fell in the euro area and remained stable in the EU27. Household saving rate (seasonally adjusted)
") STAT/12/152 30 October 2012 Quarterly Sector Accounts: second quarter of 2012 Household saving rate down to 12.9% in the euro area and stable at 11. in the EU27 Household real income per capita fell by
STAT/12/152 30 October 2012 Quarterly Sector Accounts: second quarter of 2012 Household saving rate down to 12.9% in the euro area and stable at 11. in the EU27 Household real income per capita fell by
Distributional National Accounts DINA
 Distributional National Accounts DINA Facundo Alvaredo Anthony B. Atkinson Thomas Piketty Emmanuel Saez Gabriel Zucman Meeting of Providers of OECD IDD Data OECD, Paris, February 18-19, 2016 Envision a
Extract from Divided We Stand: Why Inequality Keeps Rising
 Extract from Divided We Stand: Why Inequality Keeps Rising (2011) James J. Heckman University of Chicago AEA Continuing Education Program ASSA Course: Microeconomics of Life Course Inequality San Francisco,
On the distribution of wealth and the share of inheritance
 On the distribution of wealth and the share of inheritance Facundo Alvaredo Paris School of Economics & INET at Oxford & Conicet Presentation based on two papers by F. Alvaredo, Bertrand Garbinti and Thomas
DG TAXUD. STAT/11/100 1 July 2011
 DG TAXUD STAT/11/100 1 July 2011 Taxation trends in the European Union Recession drove EU27 overall tax revenue down to 38.4% of GDP in 2009 Half of the Member States hiked the standard rate of VAT since
Burden of Taxation: International Comparisons
 Burden of Taxation: International Comparisons Standard Note: SN/EP/3235 Last updated: 15 October 2008 Author: Bryn Morgan Economic Policy & Statistics Section This note presents data comparing the national
The Case for Fundamental Tax Reform: Overview of the Current Tax System
 The Case for Fundamental Tax Reform: Overview of the Current Tax System Sources of Federal Receipts Projected for 2016 Excise Taxes 2.9% Estate & Gift Taxes 0.6% Corporate Income Taxes 9.8% Other Taxes
ECON 361: Income Distributions and Problems of Inequality
 ECON 361: Income Distributions and Problems of Inequality David Rosé Queen s University February 7, 2018 1/1 Last class... Top income share in Canada- Veall (2012) Income inequality in the U.S. - Piketty
Introduction of World Wealth and Income Database
 Introduction The World Wealth and Income Database (WID.world) aims to provide open and convenient access to the historical evolution of the world distribution of income and wealth, both within countries
THE FUTURE OF HEALTH SPENDING
 THE FUTURE OF HEALTH SPENDING Joint OECD and ESRI workshop on Long-term prospect of the world economies up to 2060 and its policy implications OECD, Paris 31 Jan 2014 Joaquim OLIVEIRA MARTINS OECD, Public
Measuring Pension Entitlements II
 Measuring Pension Entitlements II Sergi Biletsky HDNSP, World Bank March 7, 23 APEX Pension Models Apex (Analysis of Pension Entitlements across Countries) is a collection of country pension and tax models
Wealth in Spain, A Country of Two Lands
 Wealth in Spain, 1900-2014. A Country of Two Lands Miguel Artola (University Carlos III) Luis E. Bauluz (Paris School of Economics) Clara Martínez-Toledano (Paris School of Economics) December 14, 2017
Discussion: Accounting for Wealth Inequality Dynamics: Methods, Estimates and Simulations for France ( )
") Discussion: Accounting for Wealth Inequality Dynamics: Methods, Estimates and Simulations for France (1800-2014) Philip Vermeulen European Central Bank DG-Research Fifth Conference on Household Finance
Discussion: Accounting for Wealth Inequality Dynamics: Methods, Estimates and Simulations for France (1800-2014) Philip Vermeulen European Central Bank DG-Research Fifth Conference on Household Finance
Why Are Interest Rates So Low? The Role of Demographic Change
 Why Are Interest Rates So Low? The Role of Demographic Change Noëmie Lisack Rana Sajedi Gregory Thwaites Bank of England April 2017 1 / 31 Disclaimer This does not represent the views of the Bank of England
Lecture 3: Income & Wage Taxation Over Time & Across Countries (check on line for updated versions)
") Public Economics: Tax & Transfer Policies (Master PPD & APE, Paris School of Economics) Thomas Piketty Academic year 2015-2016 Lecture 3: Income & Wage Taxation Over Time & Across Countries (check on line
Public Economics: Tax & Transfer Policies (Master PPD & APE, Paris School of Economics) Thomas Piketty Academic year 2015-2016 Lecture 3: Income & Wage Taxation Over Time & Across Countries (check on line
Econ 133 Global Inequality and Growth. Inequality between labor and capital. Gabriel Zucman
 Econ 133 Global Inequality and Growth Inequality between labor and capital zucman@berkeley.edu 1 What we ve learned so far: All income derives from labor or capital The share of income that goes to capital
International Statistical Release
 International Statistical Release This release and additional tables of international statistics are available on efama s website (www.efama.org). wide Regulated Open-ended Fund Assets and Flows Trends
Basic information. Tax-to-GDP ratio Date: 29 November 2010
 Federal Department of Finance FDF Federal Finance Administration FFA Basic information Date: 29 November 2010 Tax-to-GDP ratio 2010 The tax-to-gdp ratio is the sum of all taxes and public levies in relation
2013 Pilot EBA: Individual Country Estimates
 1 2013 Pilot EBA: Individual Country Estimates Introduction The tables in this package contain the estimates from the EBA analysis of current accounts and real exchange rates implemented in Spring 2013.
ECON 361: Income Distributions and Problems of Inequality
 ECON 361: Income Distributions and Problems of Inequality David Rosé Queen s University February 9, 2017 1/35 Last class... Top income share in Canada- Veall (2012( Income inequality in the U.S. - Piketty
IMPLICATIONS OF LOW PRODUCTIVITY GROWTH FOR DEBT SUSTAINABILITY
 IMPLICATIONS OF LOW PRODUCTIVITY GROWTH FOR DEBT SUSTAINABILITY Neil R. Mehrotra Brown University Peterson Institute for International Economics November 9th, 2017 1 / 13 PUBLIC DEBT AND PRODUCTIVITY GROWTH
International Statistical Release
 International Statistical Release This release and additional tables of international statistics are available on efama s website (www.efama.org). Worldwide Regulated Open-ended Fund Assets and Flows Trends
2014 EBA: Individual Country Estimates
 2014 EBA: Individual Country Estimates Introduction The tables in this package contain the estimates from the EBA analysis of current accounts and real exchange rates implemented in Spring 2014. These
GREEK ECONOMIC OUTLOOK
 CENTRE OF PLANNING AND ECONOMIC RESEARCH Issue 29, February 2016 GREEK ECONOMIC OUTLOOK Macroeconomic analysis and projections Public finance Human resources and social policies Development policies and
Table 1: Foreign exchange turnover: Summary of surveys Billions of U.S. dollars. Number of business days
 Table 1: Foreign exchange turnover: Summary of surveys Billions of U.S. dollars Total turnover Number of business days Average daily turnover change 1983 103.2 20 5.2 1986 191.2 20 9.6 84.6 1989 299.9
Table 1. Statutory tax rates on capital income.
 Table 1. Statutory tax rates on capital income. Tax rate on retained corporate income (%) 1 Top personal tax rate on interest income (%) 2 1985 1999 Change 1985-99 1985 1998 Change 1985-98 Small Countries
Second Quarter Trading Update 9 July 2010
 Second Quarter Trading Update 9 July 2010 Michael Page International Second Quarter Trading Update 2010 2 Group gross profit Constant Group gross profit m m Reported exchange 2010 vs 2009 111.5 83.8 +33.1%
Bank of Canada Triennial Central Bank Survey of Foreign Exchange and Over-the-Counter (OTC) Derivatives Markets
 Derivatives Markets") Bank of Canada Triennial Central Bank Survey of Foreign Exchange and Over-the-Counter (OTC) Derivatives Markets Turnover for, and Amounts Outstanding as at June 30, March, 2005 Turnover data for, Table
Bank of Canada Triennial Central Bank Survey of Foreign Exchange and Over-the-Counter (OTC) Derivatives Markets Turnover for, and Amounts Outstanding as at June 30, March, 2005 Turnover data for, Table
Pension Fund Investment and Regulation - An International Perspective and Implications for China s Pension System
 Pension Fund Investment and Regulation - An International Perspective and Implications for China s Pension System Yu-Wei Hu, Fiona Stewart and Juan Yermo Financial Affairs Division OECD, Paris OECD/IOPS
Some Basic Facts about Government Expenditures and Taxation in Canada. Econ 525
 Some Basic Facts about Government Expenditures and Taxation in Canada Econ 525 Revenues and Expenditures in Canada Since we re studying the role of government in this course it is worth considering some
Digital Innovation and the Distribution of Income
 Digital Innovation and the Distribution of Income Caroline Paunov Dominique Guellec I C 13 P A R I S 3 J U L Y 2 0 1 7 The findings expressed in this paper are those of the authors and do not necessarily
Global Environment Facility
 Global Environment Facility LDCF/SCCF Council Meeting November 16, 2007 GEF/LDCF.SCCF.3/Inf.2 November 9, 2007 STATUS REPORT ON THE CLIMATE CHANGE FUNDS AS OF SEPTEMBER 30, 2007 (Prepared by the Trustee)
Structural perspectives on European employment, productivity and growth in a global context Sintra, Portugal, 23 May 2015
 Structural perspectives on European employment, productivity and growth in a global context Sintra, Portugal, 23 May 2015 Catherine L. Mann OECD Chief Economist Key messages Prolonged weak demand has left
The Outlook for Israel s Economy in Light of Current Global Developments
 The Outlook for Israel s Economy in Light of Current Global Developments Dr. Leonardo Leiderman Professor of Economics, Tel-Aviv University and Chief Economic Advisor, Bank Hapoalim To be presented in
Income and Wealth Concentration in Switzerland over the 20 th Century
 September 2003 Income and Wealth Concentration in Switzerland over the 20 th Century Fabien Dell, INSEE Thomas Piketty, EHESS Emmanuel Saez, UC Berkeley and NBER Abstract: This paper presents homogeneous
Financial wealth of private households worldwide
 Economic Research Financial wealth of private households worldwide Munich, October 217 Recovery in turbulent times Assets and liabilities of private households worldwide in EUR trillion and annualrate
From Communism to Capitalism: Private vs. Public Property and Rising. Inequality in China and Russia
 From Communism to Capitalism: Private vs. Public Property and Rising Inequality in China and Russia Filip Novokmet (Paris School of Economics) Thomas Piketty (Paris School of Economics) Li Yang (Paris
Capital in the 21 st century. Thomas Piketty Paris School of Economics Visby, June
 Capital in the 21 st century Thomas Piketty Paris School of Economics Visby, June 30 2014 This presentation is based upon Capital in the 21 st century (Harvard University Press, March 2014) This book studies
The Missing Profits of Nations
 The Missing Profits of Nations Thomas Tørsløv (U. of Copenhagen) Ludvig Wier (U. of Copenhagen) Gabriel Zucman (UC Berkeley) June 2018 Introduction Why are corporate tax rates falling globally? Standard
NBER WORKING PAPER SERIES GLOBAL INEQUALITY DYNAMICS: NEW FINDINGS FROM WID.WORLD
 NBER WORKING PAPER SERIES GLOBAL INEQUALITY DYNAMICS: NEW FINDINGS FROM WID.WORLD Facundo Alvaredo Lucas Chancel Thomas Piketty Emmanuel Saez Gabriel Zucman Working Paper 23119 http://www.nber.org/papers/w23119
Declining productivity in Italy and Europe: facts and explanations
 Declining productivity in Italy and Europe: facts and explanations Francesco Daveri Università Cattolica (sede di Piacenza) Riccardo Faini Memorial Conference, Bank of Italy, Rome, January 13, 2017 10,0
Living with austerity how is it affecting the better-off half of the 99%?
 Living with austerity how is it affecting the better-off half of the 99%? Danny Dorling School of Geography and the Environment University of Oxford Social Research Institute Lecture: July 1 st 2014 Baring
Income Inequality in Korea,
 Income Inequality in Korea, 1958-2013. Minki Hong Korea Labor Institute 1. Introduction This paper studies the top income shares from 1958 to 2013 in Korea using tax return. 2. Data and Methodology In
Labour markets, social transfers and child poverty
 Labour markets, social transfers and child poverty Bruce Bradbury, Markus Jäntti and Lena Lindahl b.bradbury@unsw.edu.au, markus.jantti@sofi.su.se and lena.lindahl@sofi.su.se Objectives o Both earnings
TALL POPPIES IN THE LAND OF THE FAIR GO: WHY HAS AUSTRALIAN INEQUALITY RISEN AND DOES IT MATTER?
 TALL POPPIES IN THE LAND OF THE FAIR GO: WHY HAS AUSTRALIAN INEQUALITY RISEN AND DOES IT MATTER? ACE 2012 Andrew Leigh MP (+many co-authors) The Wealth Ladder 2 Imagine a ladder in which each rung represents
Government Health Care Spending and Gross Domestic Product per Capita in 1970 and 2002 (2002 U.S. Dollars)
") Health Care Spending: What the Future Will Look Like 1 TABLE A-I Government Health Care Spending and Gross Domestic Product per Capita in 1970 and 2002 (2002 U.S. Dollars) 1970 Gov t Health 2002 Gov t
Health Care Spending: What the Future Will Look Like 1 TABLE A-I Government Health Care Spending and Gross Domestic Product per Capita in 1970 and 2002 (2002 U.S. Dollars) 1970 Gov t Health 2002 Gov t
Is Economic Growth Good for Investors? Jay R. Ritter University of Florida
 Is Economic Growth Good for Investors? Jay R. Ritter University of Florida What (modern day) country had the highest per capita income, in the following years? 1500 1650 1800 1870 1900 1920 It is widely
Low employment among the 50+ population in Hungary
 Low employment among the + population in Hungary The role of incentives, health and cognitive capacities Janos Divenyi (Central European University) and Gabor Kezdi (Central European University and IE-CRSHAS)
Macroeconomic Theory and Policy
 ECO 209Y Macroeconomic Theory and Policy Lecture 3: Aggregate Expenditure and Equilibrium Income Gustavo Indart Slide 1 Assumptions We will assume that: There is no depreciation There are no indirect taxes
Aging, the Future of Work and Sustainability of Pension System
 Aging, the Future of Work and Sustainability of Pension System WKÖ & Salzburg Global Seminar Event Dénes Kucsera Agenda Austria Vienna, Austria November 5, 2015 Introduction Increasing pressure on the
New in 2013: Greater emphasis on capital flows Refinements to EBA methodology Individual country assessments
 As in 212: Stock-take: multilaterally consistent assessment of external sector policies of the largest economies Feeds into Article IVs Draws on External Balance Assessment (EBA) methodology/other Identifies
ECFIN-C3 (2009) PART 1 MAIN DEVELOPMENTS
 PART 1 MAIN DEVELOPMENTS") ECFIN-C3 (2009) PART 1 MAIN DEVELOPMENTS Methodological note Since the issue for the second quarter of 2004, nominal and real effective exchange rates presented in this report are calculated based on a
ECFIN-C3 (2009) PART 1 MAIN DEVELOPMENTS Methodological note Since the issue for the second quarter of 2004, nominal and real effective exchange rates presented in this report are calculated based on a
Lowest implicit tax rates on labour in Malta, on consumption in Spain and on capital in Lithuania
 STAT/13/68 29 April 2013 Taxation trends in the European Union The overall tax-to-gdp ratio in the EU27 up to 38.8% of GDP in 2011 Labour taxes remain major source of tax revenue The overall tax-to-gdp
WHAT FUTURE FOR HEALTH AND LONG-TERM CARE SPENDING?
 WHAT FUTURE FOR HEALTH AND LONG-TERM CARE SPENDING? Christine de la MAISONNEUVE Joaquim OLIVEIRA MARTINS OECD The future of health spending and the implications for policy, Bruegel Panel Discussion Brussels,
The Outlook for the U.S. Economy and the Policies of the New President
 The Outlook for the U.S. Economy and the Policies of the New President Jason Furman Senior Fellow, PIIE SNS/SHOF Finance Panel Stockholm June 12, 2017 Peterson Institute for International Economics 1750
Trade and Development Board Sixty-first session. Geneva, September 2014
 UNITED NATIONS CONFERENCE ON TRADE AND DEVELOPMENT Trade and Development Board Sixty-first session Geneva, 15 26 September 2014 Item 3: High-level segment Tackling inequality through trade and development:
Understanding the Macroeconomic Scenario: Global Demand, Global Supply Chains
 Understanding the Macroeconomic Scenario: Global Demand, Global Supply Chains 12 June 2014 Fabio Sdogati, fabio.sdogati@polimi.it Table of Contents 1. Economic Scenario after the Great Recession 2. Structural
2012 Canazei Winter Workshop on Inequality
 2012 Canazei Winter Workshop on Inequality Measuring the Global Distribution of Wealth Jim Davies 11 January 2012 Collaborators Susanna Sandström, Tony Shorrocks, Ed Wolff The world distribution of household
Sources of Government Revenue across the OECD, 2015
 FISCAL FACT Apr. 2015 No. 465 Sources of Government Revenue across the OECD, 2015 By Kyle Pomerleau Economist Key Findings OECD countries rely heavily on consumption taxes, such as the value added tax,
MANDATORY PROVIDENT FUND SCHEMES AUTHORITY. Guidelines on Recognized Exchanges
 Guidelines III.4 MANDATORY PROVIDENT FUND SCHEMES AUTHORITY III.4 Guidelines on Recognized Exchanges INTRODUCTION Section 2 of the Mandatory Provident Fund Schemes (General) Regulation ( the Regulation
10 reasons to invest in France
 October 2009 10 reasons to invest in France IFA Keys to understanding the new France 2 1 An economy with a global outlook Foreign companies employ over 2.8 million people in France at 23,000 different
Corrigendum. OECD Pensions Outlook 2012 DOI: ISBN (print) ISBN (PDF) OECD 2012
 ISBN (PDF) OECD 2012") OECD Pensions Outlook 2012 DOI: http://dx.doi.org/9789264169401-en ISBN 978-92-64-16939-5 (print) ISBN 978-92-64-16940-1 (PDF) OECD 2012 Corrigendum Page 21: Figure 1.1. Average annual real net investment
OECD Pensions Outlook 2012 DOI: http://dx.doi.org/9789264169401-en ISBN 978-92-64-16939-5 (print) ISBN 978-92-64-16940-1 (PDF) OECD 2012 Corrigendum Page 21: Figure 1.1. Average annual real net investment
OECD Report Shows Tax Burdens Falling in Many OECD Countries
 OECD Centres Germany Berlin (49-30) 288 8353 Japan Tokyo (81-3) 5532-0021 Mexico Mexico (52-55) 5281 3810 United States Washington (1-202) 785 6323 AUSTRALIA AUSTRIA BELGIUM CANADA CZECH REPUBLIC DENMARK
Lecture 6: Money, finance and crisis in historical perspective
 Economic History (Master PPD & APE, Paris School of Economics) Thomas Piketty Academic year 2015-2016 Lecture 6: Money, finance and crisis in historical perspective (check on line for updated versions)
The Distribution of US Wealth, Capital Income and Returns since Emmanuel Saez (UC Berkeley) Gabriel Zucman (LSE and UC Berkeley)
 Gabriel Zucman (LSE and UC Berkeley)") The Distribution of US Wealth, Capital Income and Returns since 1913 Emmanuel Saez (UC Berkeley) Gabriel Zucman (LSE and UC Berkeley) March 2014 Is rising inequality purely a labor income phenomenon? Income
The Distribution of US Wealth, Capital Income and Returns since 1913 Emmanuel Saez (UC Berkeley) Gabriel Zucman (LSE and UC Berkeley) March 2014 Is rising inequality purely a labor income phenomenon? Income
Basic information. Tax-to-GDP ratio Date: 24 October 2012
 Federal Department of Finance FDF Federal Finance Administration FFA Basic information Date: 24 October 2012 Tax-to-GDP ratio 2011 The tax-to-gdp ratio is the sum of all taxes and social security levies
Second estimate for the third quarter of 2008 EU27 current account deficit 39.5 bn euro 19.3 bn euro surplus on trade in services
 STAT/09/12 22 January 2009 Second estimate for the third quarter of 20 EU27 current account deficit 39.5 bn euro 19.3 bn euro surplus on trade in According to the latest revisions1, the EU272 external
How Do Labor and Capital Share Private Sector Economic Gains in an Age of Globalization?
 1 How Do Labor and Capital Share Private Sector Economic Gains in an Age of Globalization? Erica Owen Texas A&M Quan Li Texas A&M IPES November 15, 214 Rich vs. Poor (1% vs. 99%) 2 3 Motivation Literature
Money, Finance and the Real Economy: what went wrong?
 Money, Finance and the Real Economy: what went wrong? Anton Brender Rotterdam, December 1, 15 December 15 FIRMS SPENDING BEHAVIOUR RESPONDS LESS TO INTEREST RATES CHANGES Non-financial firms borrowing
Sources of Government Revenue in the OECD, 2016
 FISCAL FACT No. 517 July, 2016 Sources of Government Revenue in the OECD, 2016 By Kyle Pomerleau Director of Federal Projects Kevin Adams Research Assistant Key Findings OECD countries rely heavily on