Wealth, Inequality & Taxation. Thomas Piketty Paris School of Economics Berlin FU, June 13 th 2013 Lecture 1: Roadmap & the return of wealth
|
|
|
- Cecil Garrison
- 5 years ago
- Views:
Transcription
1 Wealth, Inequality & Taxation Thomas Piketty Paris School of Economics Berlin FU, June 13 th 2013 Lecture 1: Roadmap & the return of wealth
2 These lectures will focus primarily on the following issue: how do wealth-income and inheritance-income ratios evolve in the long run, and why? what are the implications for optimal capital vs labor taxation? The rise of top income shares will not be the main focus in these lectures: highly relevant for the US, but less so for Europe In Europe, and possibly everywhere in the very long run, the key issue the rise of wealth-income ratios and the possible return of inherited wealth If you want to know more about top incomes (=not the main focus of these lectures), have a look at "World Top Incomes Database" website; see however lecture 3
3
4 Key issue adressed in these lectures: wealth & inheritance in the long run There are two ways to become rich: either through one s own work, or through inheritance In Ancien Regime societies, as well as in 19 C and early 20 C, it was obvious to everybody that the inheritance channel was important Inheritance and successors were everywhere in the 19 C literature: Balzac, Jane Austen, etc. Inheritance flows were huge not only in novels; but also in 19 C tax data: major economic, social and political issue
5 Question: Does inheritance belong to the past? Did modern growth kill the inheritance channel? E.g. due to the natural rise of human capital and meritocracy? Or due to the rise of life expectancy? I will answer «NO» to this question: I find that inherited wealth will probably play as big a role in 21 C capitalism as it did in 19 C capitalism Key mechanism if low growth g and r > g
6 40% 36% 32% 28% Figure 1: Annual inheritance flow as a fraction of national income, France Economic flow (computed from national wealth estimates, mortality tables and observed age-wealth profiles) Fiscal flow (computed from observed bequest and gift tax data, inc. tax exempt assets) 24% 20% 16% 12% 8% 4% 0%
7 40% 36% 32% 28% Figure 2: Annual inheritance flow as a fraction of disposable income, France Economic flow (computed from national wealth estimates, mortality tables and observed age-wealth profiles) Fiscal flow (computed from observed bequest and gift tax data, inc. tax exempt assets) 24% 20% 16% 12% 8% 4% 0%
8 An annual inheritance flow around 20%-25% of disposable income is a very large flow E.g. it is much larger than the annual flow of new savings (typically around 10%-15% of disposable income), which itself comes in part from the return to inheritance (it s easier to save if you have inherited your house & have no rent to pay) An annual inheritance flow around 20%-25% of disposable income means that total, cumulated inherited wealth represents the vast majority of aggregate wealth (typically above 80%-90% of aggregate wealth), and vastly dominates self-made wealth
9 Main lesson: with g low & r>g, inheritance is bound to dominate new wealth; the past eats up the future g = growth rate of national income and output r = rate of return to wealth = (interest + dividend + rent + profits + capital gains etc.)/(net financial + real estate wealth) Intuition: with r>g & g low (say r=4%-5% vs g=1%-2%) (=19 C & 21 C ), wealth coming from the past is being capitalized faster than growth; heirs just need to save a fraction g/r of the return to inherited wealth It is only in countries and time periods with g exceptionally high that self-made wealth dominates inherited wealth (Europe in 1950s-70s or China today) r > g & g low might also lead to the return of extreme levels of wealth concentration (not yet: middle class bigger today)
10 100% Figure Wealth inequality in France, % 80% 70% 60% 50% 40% 30% 20% 10% Top 10% share in total wealth Top 1% share in total wealth 0%
11 80% Figure Wealth inequality: Paris vs. France, % 60% 50% 40% 30% Top 1% wealth share (Paris) 20% Top 1% wealth share (France) 10% 0%
12 100% Figure Wealth inequality in the UK, % 80% 70% 60% 50% 40% 30% 20% Top 10% wealth share Top 1% wealth share 10% 0%
13 100% Figure Wealth inequality in Sweden, (Roine-Waldenstrom) 90% 80% 70% 60% 50% 40% 30% 20% Top 10% wealth share Top 1% wealth share 10% 0%
14 100% Figure Wealth inequality in the US, % 80% 70% 60% 50% 40% 30% 20% Top 10% wealth share 10% Top 1% wealth share 0%
15 These lectures: three issues (1) The return of wealth (Be careful with «human capital» illusion: human k did not replace non-human financial & real estate capital) (2) The return of inherited wealth (Be careful with «war of ages» illusion: the war of ages did not replace class war; inter-generational inequality did not replace intra-generational inequality) (3) The optimal taxation of wealth & inheritance (With two-dimensional inequality, wealth taxation is useful) (1) : covered in Lecture 1 (now) (2)-(3) : covered in Lectures 2-3
16 Lectures based upon: «On the long-run evolution of inheritance: France », QJE 2011 «Capital is back: wealth-income ratios in rich countries » (with Zucman, WP 2013) «Inherited vs self-made wealth: theory & evidence from a rentier society» (with Postel-Vinay & Rosenthal, 2011) On-going work on other countries (Atkinson UK, Schinke Germany, Roine-Waldenstrom Sweden, Alvaredo US) towards a World Wealth & Income Database «A Theory of Optimal Inheritance Taxation» (with Saez, Econometrica 2013) «Optimal Taxation of Top Labor Incomes» (with Saez & Stantcheva, AEJ:EP 2013) (all papers are available on line at piketty.pse.ens.fr)
17 1. The return of wealth How do aggregate wealth-income ratios evolve in the long-run, and why? Impossible to address this basic question until recently: national accounts were mostly about flows, not stocks We compile a new dataset to address this question: : Official balance sheets for US, Japan, Germany, France, UK, Italy, Canada, Australia : Historical estimates for US, Germany, France, UK : Historical estimates for France, UK
18 The Return of Wealth: W & Y Concepts Wealth Private wealth W = assets - liabilities of households Corporations valued at market prices through equities Government wealth W g National wealth W n = W + W g National wealth W n = K (land + housing + other domestic capital) + NFA (net foreign assets) Income Domestic output Y d = F(K,L) (net of depreciation) National income Y = domestic output Y d + r NFA Capital share α = rβ (r = average rate of return) β = W/Y = private wealth-national income ratio β n = W n /Y = national wealth-national income ratio
19 We Find a Gradual Rise of Private Wealth-National Income Ratios over
20 European Wealth-Income Ratios Appear to be Returning to Their High 18c-19c Values


21 Despite Considerable Changes in the Nature of Wealth: UK,
22 In the US, the Wealth-Income Ratio Also Followed a U-Shaped Evolution, But Less Marked
23 What We Are Trying to Understand: The Rise in Private Wealth-National Income Ratios,
24 How Can We Explain the Evolution? 1. An asset price effect: long run asset price recovery driven by changes in capital policies since world wars 1. A real economic effect: slowdown of productivity and pop growth: Harrod-Domar-Solow: wealth-income ratio β = s/g If saving rate s = 10% and growth rate g = 3%, then β 300% But if s=10% and g =1.5%, then β 600% Countries with low g are bound to have high β. Strong effect in Europe, ultimately everywhere.
25 How Can We Explain Return to 19c Levels? In very long run, limited role of asset price divergence In short/medium run, war destructions & valuation effects paramount But in the very long run, no significant divergence between price of consumption and capital goods Key long-run force is β = s/g One sector model accounts reasonably well for long run dynamics & level differences Europe vs. US
26 Accounting for Wealth Accumulation: One Good Model In any one-good model: At each date t: W t+1 = W t + s t Y t β t+1 = β t (1+g wst )/(1+g t ) 1+g wst = 1+s t /β t = saving-induced wealth growth rate 1+g t = Y t+1 /Y t = output growth rate (productivity + pop.) In steady state, with fixed saving rate s t =s and growth rate g t =g: β t β= s/g (Harrod-Domar-Solow formula) Example: if s = 10% and g = 2%, then β = 500%
27 β = s/g is a pure accounting formula, i.e. it is valid wherever the saving rate s comes from: BU: Bequest-in-utility-function model Max U(c,b)=c 1-s b s (or b s ) c = lifetime consumption, b = end-of-life wealth (bequest) s = bequest taste = saving rate β = s/g DM: Dynastic model: Max Σ U(c t )/(1+δ) t r = δ +ρg, s = αg/r, β = α/r = s/g ( β as g ) ( U(c)=c 1-ρ /(1-ρ), F(K,L)=K α L 1-α ) OLG model: low growth implies higher life-cycle savings in all three models, β = s/g rises as g declines
28 Accounting for Wealth Accumulation: Two Goods Model Two goods: one capital good, one consumption good Define 1+q t = real rate of capital gain (or loss) = excess of asset price inflation over consumer price inflation Then β t+1 = β t (1+g wst )(1+q t )/(1+g t ) 1+g wst = 1+s t /β t = saving-induced wealth growth rate 1+q t = capital-gains-induced wealth growth rate
29 Growth Rates and Private Saving Rates in Rich Countries, Real growth rate of national income Population growth rate Real growth rate of per capita national income Net private saving rate (personal + corporate) (% national income) U.S. 2.8% 1.0% 1.8% 7.7% Japan 2.5% 0.5% 2.0% 14.6% Germany 2.0% 0.2% 1.8% 12.2% France 2.2% 0.5% 1.7% 11.1% U.K. 2.2% 0.3% 1.9% 7.3% Italy 1.9% 0.3% 1.6% 15.0% Canada 2.8% 1.1% 1.7% 12.1% Australia 3.2% 1.4% 1.7% 9.9%
30 Lesson 1a: Capital is Back Low β in mid-20c were an anomaly Anti-capital policies depressed asset prices Unlikely to happen again with free markets Who owns wealth will become again very important β can vary a lot between countries s and g determined by different forces With perfect markets: scope for very large net foreign asset positions With imperfect markets: domestic asset price bubbles High β raise new issues about capital regulation & taxation
31 Private Wealth-National Income Ratios, , including Spain
32 From Private to National Wealth: Small and Declining Government Net Wealth,

33 National vs. Foreign Wealth, (% National Income)
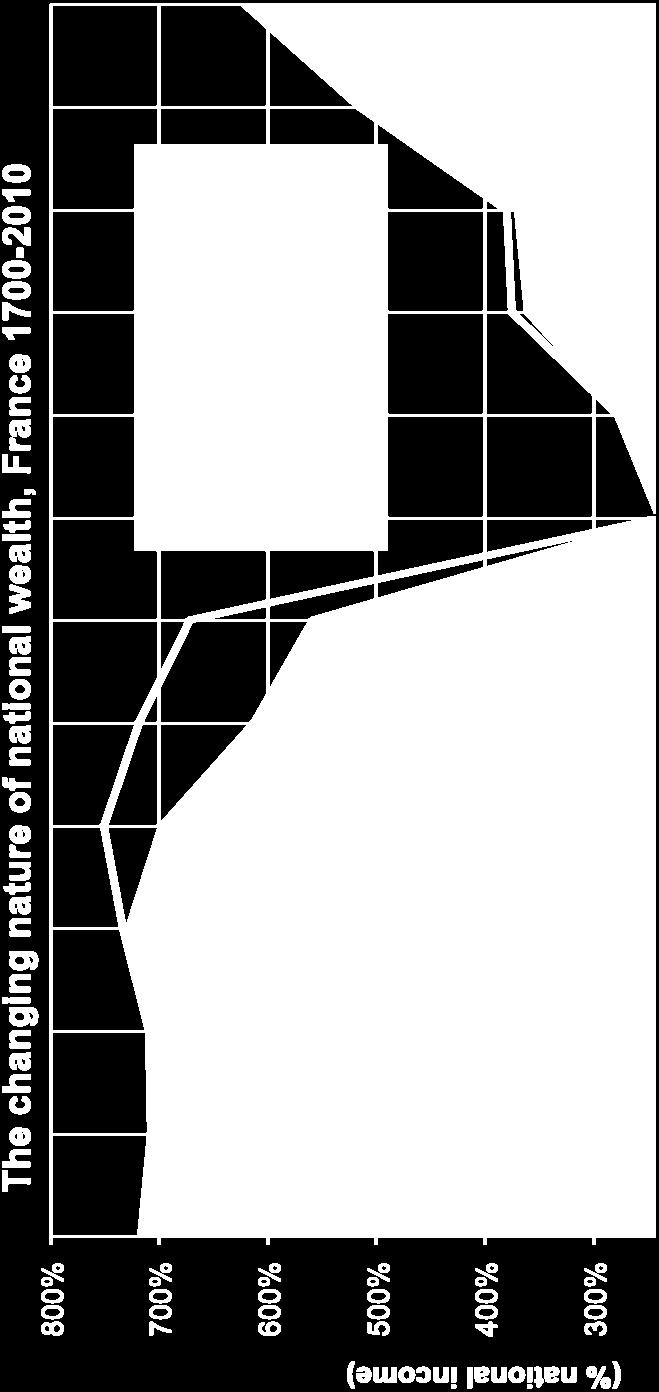
34 Lesson 1b: The Changing Nature of Wealth and Technology In 21 st century: σ >1 Rising β come with decline in average return to wealth r But decline in r smaller than increase in β capital shares α =rβ increase Consistent with K/L elasticity of substitution σ >1 In 18 th century: σ <1 In 18c, K = mostly land In land-scarce Old World, α 30% In land-rich New World, α 15% Consistent with σ < 1: when low substitutability, α large when K relatively scarce
35 800% The changing nature of national wealth, UK (% national income) 700% 600% 500% 400% 300% 200% Net foreign assets Other domestic capital Housing Agricultural land 100% 0% National wealth = agricultural land + housing + other domestic capital goods + net foreign assets

36
37 600% 500% The changing nature of national wealth, US Net foreign assets Other domestic capital Housing Agricultural land (% national income) 400% 300% 200% 100% 0% National wealth = agricultural land + housing + other domestic capital goods + net foreign assets
38 600% 500% The changing nature of national wealth, US (incl. slaves) Net foreign assets Other domestic capital Housing Slaves Agricultural land (% national income) 400% 300% 200% 100% 0% National wealth = agricultural land + housing + other domestic capital goods + net foreign assets
39
40 Rising β Come With Rising Capital Shares α
41 And Slightly Declining Average Returns to Wealth σ > 1 and Finite
42 End of Lecture 1: what have we learned? A world with low g can naturally leads to the return of high non-human wealth: capital is back because low growth is back A world with g=1-1.5% (=long-run world technological frontier?) is not very different from a world with g=0% (Marx-Ricardo) The rise of human capital is largely an illusion; nonhuman capital share can be larger in the future than what it was in the past; robot economy possible Next question: will the return of wealth take the form of egalitarian lifecycle wealth, or highly concentrated inherited wealth?
43 Wealth, Inequality & Taxation Thomas Piketty Paris School of Economics Berlin FU, June 13 th 2013 Lecture 2: The return of inherited wealth
44 Roadmap (1) The return of wealth (already covered in Lecture 1; I will just start by presenting a few more technical results) (2) The return of inherited wealth (=what we will cover in Lecture 2) (3) The optimal taxation of wealth & inheritance (we will start this part in case we have time; otherwise this will be covered in Lecture 3)
45 1. The Return of Wealth: W & Y Concepts Wealth Private wealth W = assets - liabilities of households Corporations valued at market prices through equities Government wealth W g National wealth W n = W + W g National wealth W n = K (land + housing + other domestic capital) + NFA (net foreign assets) Income Domestic output Y d = F(K,L) (net of depreciation) National income Y = domestic output Y d + r NFA Capital share α = rβ (r = average rate of return) β = W/Y = private wealth-national income ratio β n = W n /Y = national wealth-national income ratio
46 Accounting for Wealth Accumulation: One Good Model In any one-good model: At each date t: W t+1 = W t + s t Y t β t+1 = β t (1+g wst )/(1+g t ) 1+g wst = 1+s t /β t = saving-induced wealth growth rate 1+g t = Y t+1 /Y t = output growth rate (productivity + pop.) In steady state, with fixed saving rate s t =s and growth rate g t =g: β t β= s/g (Harrod-Domar-Solow formula) Example: if s = 10% and g = 2%, then β = 500%
47 Accounting for Wealth Accumulation: Two Goods Model Two goods: one capital good, one consumption good Define 1+q t = real rate of capital gain (or loss) = excess of asset price inflation over consumer price inflation Then β t+1 = β t (1+g wst )(1+q t )/(1+g t ) 1+g wst = 1+s t /β t = saving-induced wealth growth rate 1+q t = capital-gains-induced wealth growth rate
48 Our Empirical Strategy We do not specify where q t come from - maybe stochastic production functions for capital vs. consumption good, with different rates of technical progress We observe β t,, β t+n s t,, s t+n g t,..., g t+n and we decompose the wealth accumulation equation between years t and t + n into: Volume effect (saving) vs. Price effect (capital gain or loss)
49 Data Sources and Method, Official annual balance sheets for top 8 rich countries: Assets (incl. non produced) and liabilities at market value Based on census-like methods: reports from financial institutions, housing surveys, etc. Known issues (e.g., tax havens) but better than PIM Extensive decompositions & sensitivity analysis: Private vs. national wealth Domestic capital vs. foreign wealth Private (personal + corporate) vs. personal saving Multiplicative vs. additive decompositions R&D
50 : A Low Growth and Asset Price Recovery Story Key results of the analysis: Non-zero capital gains Account for significant part of increase But significant increase in β would have still occurred without K gains, just because of s & g The rise in β is more than a bubble
51 What We Are Trying to Understand: The Rise in Private Wealth-National Income Ratios,
52 NB: The Rise Would be Even More Spectacular Should We Divide Wealth by Disposable Income
53 Growth Rates and Private Saving Rates in Rich Countries, Real growth rate of national income Population growth rate Real growth rate of per capita national income Net private saving rate (personal + corporate) (% national income) U.S. 2.8% 1.0% 1.8% 7.7% Japan 2.5% 0.5% 2.0% 14.6% Germany 2.0% 0.2% 1.8% 12.2% France 2.2% 0.5% 1.7% 11.1% U.K. 2.2% 0.3% 1.9% 7.3% Italy 1.9% 0.3% 1.6% 15.0% Canada 2.8% 1.1% 1.7% 12.1% Australia 3.2% 1.4% 1.7% 9.9%
54 A Pattern of Small, Positive Capital Gains on Private Wealth Private wealth-national income ratios β (1970) β (2010) Decomposition of wealth growth rate Real growth rate of private wealth Savingsinduced wealth growth rate Capital-gainsinduced wealth growth rate g w g ws = s/β q U.S. 342% 410% 3.3% 2.9% 0.4% 88% 12% Japan 299% 601% 4.3% 3.4% 0.9% 78% 22% Germany 225% 412% 3.5% 4.3% -0.8% 121% -21% France 310% 575% 3.8% 3.4% 0.4% 90% 10% U.K. 306% 522% 3.6% 1.9% 1.6% 55% 45% Italy 239% 676% 4.6% 4.2% 0.4% 92% 8% Canada 247% 416% 4.2% 4.3% -0.1% 103% -3% Australia 330% 518% 4.4% 3.4% 0.9% 79% 21%
55 But Private Wealth / National Income Ratios Would Have Increased Without K Gains in Low Growth Countries

56 From Private to National Wealth: Small and Declining Government Net Wealth,
57 Decline in Gov Wealth Means National Wealth Has Been Rising a Bit Less than Private Wealth
58 National Saving : Private vs Government Average saving rates (% national income) Net national saving (private + government) incl. private saving incl. government saving U.S. 5.2% 7.7% -2.4% Japan 14.6% 14.6% 0.0% Germany 10.2% 12.2% -2.1% France 9.2% 11.1% -1.9% U.K. 5.3% 7.3% -2.0% Italy 8.5% 15.0% -6.5% Canada 10.1% 12.1% -2.0% Australia 8.9% 9.9% -0.9%
59 Robust Pattern of Positive Capital Gains on National Wealth National wealth-national income ratios Decomposition of wealth growth rate Real growth Savingsinduced wealth induced wealth Capital-gains- rate of national wealth growth rate growth rate β (1970) β (2010) g w g ws = s/β q U.S. 404% 431% 3.0% 2.1% 0.8% 72% 28% Japan 359% 616% 3.9% 3.1% 0.8% 78% 22% Germany 313% 416% 2.7% 3.1% -0.4% 114% -14% France 351% 605% 3.6% 2.7% 0.9% 75% 25% U.K. 346% 523% 3.3% 1.5% 1.8% 45% 55% Italy 259% 609% 4.1% 2.6% 1.5% 63% 37% Canada 284% 412% 3.8% 3.4% 0.4% 89% 11% Australia 391% 584% 4.2% 2.5% 1.6% 61% 39%


60 Pattern of Positive Capital Gains on National Wealth Largely Robust to Inclusion of R&D
61 National vs. Foreign Wealth, (% National Income)
62 The Role of Foreign Wealth Accumulation in Rising β U.S. Japan Germany France U.K. Italy Canada Australia National wealth / national income ratio (1970) incl. Domestic capital incl. Foreign wealth National wealth / national income ratio (2010) incl. Domestic capital incl. Foreign wealth Rise in national wealth / national income ratio ( ) incl. Domestic capital incl. Foreign wealth 404% 431% 27% 399% 4% 456% -25% 57% -30% 359% 616% 256% 356% 3% 548% 67% 192% 64% 313% 416% 102% 305% 8% 377% 39% 71% 31% 351% 605% 254% 340% 11% 618% -13% 278% -24% 365% 527% 163% 359% 6% 548% -20% 189% -26% 259% 609% 350% 247% 12% 640% -31% 392% -42% 284% 412% 128% 325% -41% 422% -10% 97% 31% 391% 584% 194% 410% -20% 655% -70% 244% -50%
63 Housing Has Played an Important Role in Many But Not All Countries U.S. Japan Germany France U.K. Italy Canada Australia Domestic capital / national income ratio (1970) incl. Housing incl. Other domestic capital Domestic capital / national income ratio (2010) incl. Housing incl. Other domestic capital Rise in domestic capital / national income ratio ( ) incl. Housing incl. Other domestic capital 399% 456% 57% 142% 257% 182% 274% 41% 17% 356% 548% 192% 131% 225% 220% 328% 89% 103% 305% 377% 71% 129% 177% 241% 136% 112% -41% 340% 618% 278% 104% 236% 371% 247% 267% 11% 359% 548% 189% 98% 261% 300% 248% 202% -13% 247% 640% 392% 107% 141% 386% 254% 279% 113% 325% 422% 97% 108% 217% 208% 213% 101% -4% 410% 655% 244% 172% 239% 364% 291% 193% 52%
64 2. The return of inherited wealth In principle, one could very well observe a return of wealth without a return of inherited wealth I.e. it could be that the rise of aggregate wealthincome ratio is due mostly to the rise of life-cycle wealth (pension funds) Modigliani life-cycle theory: people save for their old days and die with zero wealth, so that inheritance flows are small
65 However the Modigliani story happens to be partly wrong (except in the 1950s-60s, when there s not much left to inherit ): pension wealth is a limited part of wealth (<5% in France but 20% in the UK) Bequest flow-national income ratio B/Y = µ m W/Y (with m = mortality rate, µ = relative wealth of decedents) (see «On the long run evolution of inheritance..», QJE 11) B/Y has almost returned to 1910 level, both because of W/Y and of µ Dynastic model: µ = (D-A)/H, m=1/(d-a), so that µ m = 1/H and B/Y = β/h (A = adulthood = 20, H = parenthood = 30, D =death = 60-80) General saving model: with g low & r>g, B/Y β/h with β=600% & H=generation length=30 years, then B/Y 20%, i.e. annual inheritance flow 20% national income
66 200% Figure 10: Steady-state cross-sectional age-wealth profile in the dynastic model with demographic noise 180% 160% 140% 120% 100% 80% 60% (average wealth of age group)/(average wealth of adults) 40% 20% 0% A=20 25 H=30 35 I= D=70
67 240% 220% 200% Figure 8: The ratio between average wealth of decedents and average wealth of the living in France excluding inter-vivos gifts including inter-vivos gifts into decedents' wealth 180% 160% 140% 120% 100% 80%
68
69 Figure The inheritance flow in Europe % France 20% 16% United Kingdom (Atkinson) Germany (Schinke) 12% 8% 4% 0%
70 The share of inherited wealth in total wealth Modigliani AER 1986, JEP 1988: inheritance = 20% of total U.S. wealth Kotlikoff-Summers JPE 1981, JEP 1988: inheritance = 80% of total U.S. wealth Three problems with this controversy: - Bad data - We do not live in a stationary world: life-cycle wealth was much more important in the 1950s-1970s than it is today - We do not live in a representative-agent world new definition of inherited share: partially capitalized inheritance (inheritance capitalized in the limit of today s inheritor wealth) our findings show that the share of inherited wealth has changed a lot over time, but that it is generally much closer to Kotlikoff-Summers (80%) than Modigliani (20%)
71 100% 90% 80% Figure S11.3. The share of inherited wealth in aggregate wealth, France ( : g=1,7%, r=3,0%) Partially capitalized inheritance (PPVR definition) Non-capitalized inheritance (Modigliani) 70% 60% 50% 40% 30%
72 260% 240% 220% 200% 180% Figure S11.4. The share of inherited wealth in aggregate wealth, France ( : g=1,7%, r=3,0%) Capitalized inheritance (KS1) (Kotlikoff-Summers, r=3%, 30yrs) Partially capitalized inheritance (PPVR definition) Non-capitalized inheritance (Modgliani) 160% 140% 120% 100% 80% 60% 40% 20%
73 Back to distributional analysis: macro ratios determine who is the dominant social class 19 C : top successors dominate top labor earners rentier society (Balzac, Jane Austen, etc.) For cohorts born in1910s-1950s, inheritance did not matter too much labor-based, meritocratic society But for cohorts born in the 1970s-1980s & after, inheritance matters a lot 21 c class structure will be intermediate between 19 c rentier society than to 20 c meritocratic society and possibly closer to the former (more unequal in some dimens., less in others) The rise of human capital & meritocracy was an illusion.. especially with a labor-based tax system


74
75
76
77 End of Lecture 2: the consequences of r > g r > g implies that wealth coming from the past is capitalized faster than growth return of high inherited wealth r > g also implies higher concentration of wealth: in any dynamic model with stochastic random shocks (taste, productivity, return,.), the steady-state (inverted) Pareto coefficient is an increasing function of r g Intuition: the higher r g, the more strongly wealth shocks get amplified over time if r - g very large in 21c (low growth, high global return to wealth, zero k tax), wealth inequality back to 19c levels? (Forbes billionnaires grow at 7-8%/year: r > g)
78 Figure World rate of return vs growth rate, % 5% 4% 3% Private rate of return to wealth r (aftet tax and capital loss) World output growth rate g 2% 1% 0%
79 100% Figure Wealth inequality in France, % 80% 70% 60% 50% 40% 30% 20% 10% Top 10% share in total wealth Top 1% share in total wealth 0%
80 80% Figure Wealth inequality: Paris vs. France, % 60% 50% 40% 30% Top 1% wealth share (Paris) 20% Top 1% wealth share (France) 10% 0%
81 100% Figure Wealth inequality in the UK, % 80% 70% 60% 50% 40% 30% 20% Top 10% wealth share Top 1% wealth share 10% 0%
82 100% Figure Wealth inequality in Sweden, (Roine-Waldenstrom) 90% 80% 70% 60% 50% 40% 30% 20% Top 10% wealth share Top 1% wealth share 10% 0%
83 100% Figure Wealth inequality in the US, % 80% 70% 60% 50% 40% 30% 20% Top 10% wealth share 10% Top 1% wealth share 0%
84 Wealth, Inequality & Taxation Thomas Piketty Paris School of Economics Berlin FU, June 14 th 2013 Lecture 3: Implications for optimal taxation
85 The optimal taxation of wealth & inheritance Summary of main results from Piketty-Saez, «A Theory of Optimal Inheritance Taxation», Econometrica 2013 Result 1:Optimal Inheritance Tax Formula (macro version, NBER WP 12) Simple formula for optimal bequest tax rate expressed in terms of estimable macro parameters: B 1 1 s b0/b y 1 e B s b0 with: b y = macro bequest flow, e B = elasticity, s b0 =bequest taste τ B increases with b y and decreases with e B and s b0 For realistic parameters: τ B =50-60% (or more..or less...) our theory can account for the variety of observed top bequest tax rates (30%-80%)
86 100% 90% 80% 70% U.S. U.K. France Top Inheritance Tax Rates % 50% Germany 40% 30% 20% 10% 0%
87 Result 2: Optimal Capital Tax Mix (NBER WP 12) K market imperfections (e.g. uninsurable idiosyncratic shocks to rates of return) can justify shifting one-off inheritance taxation toward lifetime capital taxation (property tax, K income tax,..) Intuition: what matters is capitalized bequest, not raw bequest; but at the time of setting the bequest tax rate, there is a lot of uncertainty about what the rate of return is going to be during the next 30 years so it is more efficient to split the tax burden our theory can explain the actual structure & mix of inheritance vs lifetime capital taxation (& why high top inheritance and top capital income tax rates often come together, e.g. US-UK 1930s-1980s)
88 Optimal inheritance tax formulas Agent i in cohort t (1 cohort =1 period =H years, H 30) Receives bequest b ti =z i b t at beginning of period t Works during period t Receives labor income y Lti =θ i y Lt at end of period t Consumes c ti & leaves bequest b t+1i so as to maximize: Max V i (c ti,b t+1i,b t+1i ) s.c. c ti + b t+1i (1-τ B )b ti e rh +(1-τ L )y Lti With: b t+1i = end-of-life wealth (wealth loving) b t+1i =(1-τ B )b t+1i e rh = net-of-tax capitalized bequest left (bequest loving) τ B =bequest tax rate, τ L =labor income tax rate V i () homogeneous of degree one (to allow for growth)
89 Special case: Cobb-Douglas preferences: V i (c ti,b t+1i,b t+1i ) = c 1-s i ti bt+1i s wi b s bi t+1i (with s i = s wi +s bi ) b t+1i = s i [(1- τ B )z i b t e rh + (1-τ L )θ i y Lt ] = s i y ti General preferences: V i () homogenous of degree one: Max V i () FOC V ci = V wi + (1-τ B )e rh V bi All choices are linear in total life-time income y ti b t+1i = s i y ti Define s bi = s i (1-τ B )e rh V bi /V ci Same as Cobb-Douglas but s i and s bi now depend on 1-τ B (income and substitution effects no longer offset each other) We allow for any distribution and any ergodic random process for taste shocks s i and productivity shocks θ i endogenous dynamics of the joint distribution Ψ t (z,θ) of normalized inheritance z and productivity θ
90 Macro side: open economy with exogenous return r, domestic output Y t =K tα L t 1-α, with L t =L 0 e ght and g=exogenous productivity growth rate (inelastic labor supply l ti =1, fixed population size = 1) Period by period government budget constraint: τ L Y Lt + τ B B t e rh = τy t I.e. τ L (1-α) + τ B b yt = τ With τ = exogenous tax revenue requirement (e.g. τ=30%) b yt = e rh B t /Y t = capitalized inheritance-output ratio Government objective: We take τ 0 as given and solve for the optimal tax mix τ L,τ B maximizing steady-state SWF = ω zθ V zθ dψ(z,θ) with Ψ(z,θ) = steady-state distribution of z and θ ω zθ = social welfare weights
91 Equivalence between τ B and τ K In basic model, tax τ B on inheritance is equivalent to tax τ K on annual return r to capital as: b ti = (1- τ B )b ti e rh = b ti e (1-τ K)rH, i.e. τ K = -log(1-τ B )/rh E.g. with r=5% and H=30, τ B =25% τ K =19%, τ B =50% τ K =46%, τ B =75% τ K =92% This equivalence no longer holds with (a) tax enforcement constraints, or (b) life-cycle savings, or (c) uninsurable risk in r=r ti Optimal mix τ B,τ K then becomes an interesting question
92 Special case: taste and productivity shocks s i and θ i are i.e. across and within periods (no memory) s=e(s i θ i,z i ) simple aggregate transition equation: b t+1i = s i [(1- τ B )z i b t e rh + (1-τ L )θ i y Lt ] b t+1 = s [(1- τ B )b t e rh + (1-τ L )y Lt ] Steady-state convergence: b t+1 =b t e gh b yt b y s 1 e r g H 1 se r g H b y increases with r-g (capitalization effect, Piketty QJE 11) If r-g=3%,τ=10%,h=30,α=30%,s=10% b y =20% If r-g=1%,τ=30%,h=30,α=30%,s=10% b y =6%
93 General case: under adequate ergodicity assumptions for random processes s i and θ i : Proposition 1 (unique steady-state): for given τ B,τ L, then as t +, b yt b y and Ψ t (z,θ) Ψ(z,θ) Define: e B db y d 1 B 1 B b y e B = elasticity of steady-state bequest flow with respect to net-of-bequest-tax rate 1-τ B With V i () = Cobb-Douglas and i.i.d. shocks, e B = 0 For general preferences and shocks, e B >0 (or <0) we take e B as a free parameter
94 Meritocratic rawlsian optimum, i.e. social optimum from the viewpoint of zero bequest receivers (z=0): Proposition 2 (zero-receivers tax optimum) B 1 1 s b0/b y 1 e B s b0 with: s b0 = average bequest taste of zero receivers τ B increases with b y and decreases with e B and s b0 If bequest taste s b0 =0, then τ B = 1/(1+e B ) standard revenue-maximizing formula If e B +, then τ B 0 : back to Chamley-Judd If e B =0, then τ B <1 as long as s b0 >0 I.e. zero receivers do not want to tax bequests at 100%, because they themselves want to leave bequests trade-off between taxing rich successors from my cohort vs taxing my own children
95 Example 1: τ=30%, α=30%, s bo =10%, e B =0 If b y =20%, then τ B =73% & τ L =22% If b y =15%, then τ B =67% & τ L =29% If b y =10%, then τ B =55% & τ L =35% If b y =5%, then τ B =18% & τ L =42% with high bequest flow b y, zero receivers want to tax inherited wealth at a higher rate than labor income (73% vs 22%); with low bequest flow they want the oposite (18% vs 42%) Intuition: with low b y (high g), not much to gain from taxing bequests, and this is bad for my own children With high b y (low g), it s the opposite: it s worth taxing bequests, so as to reduce labor taxation and allow zero receivers to leave a bequest
96 Example 2: τ=30%, α=30%, s bo =10%, b y =15% If e B =0, then τ B =67% & τ L =29% If e B =0.2, then τ B =56% & τ L =31% If e B =0.5, then τ B =46% & τ L =33% If e B =1, then τ B =35% & τ L =35% behavioral responses matter but not hugely as long as the elasticity e B is reasonnable Kopczuk-Slemrod 2001: e B =0.2 (US) (French experiments with zero-children savers: e B = )
97 Optimal Inheritance Tax Formula (micro version, EMA 13) The formula can be rewritten so as to be based solely upon estimable distributional parameters and upon r vs g : τ B = (1 Gb*/Ry L *)/(1+e B ) With: b* = average bequest left by zero-bequest receivers as a fraction of average bequest left y L * = average labor income earned by zero-bequest receivers as a fraction of average labor income G = generational growth rate, R = generational rate of return If e B =0 & G=R, then τ B = 1 b*/y L * (pure distribution effect) if b*=0.5 and y L *=1, τ B = 0.5 : if zero receivers have same labor income as rest of the pop and expect to leave 50% of average bequest, then it is optimal from their viewpoint to tax bequests at 50% rate If e B =0 & b*=y L *=1, then τ B = 1 G/R (fiscal Golden rule) if R +, τ B 1: zero receivers want to tax bequest at 100%, even if they plan to leave as much bequest as rest of the pop
98 100% Figure 1: Optimal linear inheritance tax rates, by percentile of bequest received (calibration of optimal tax formulas using 2010 micro data) 90% 80% 70% 60% 50% 40% 30% 20% 10% 0% France U.S. -10% -20% -30% P1 P11 P21 P31 P41 P51 P61 P71 P81 P91 Percentile of the distribution of bequest received (P1 = bottom 1%, P100 = top 1%)
99 100% Figure 2: Optimal top inheritance tax rates, by percentile of bequest received (1m or $+) (calibration using 2010 micro data) 90% 80% 70% 60% 50% 40% 30% 20% 10% 0% France U.S. -10% -20% -30% P1 P11 P21 P31 P41 P51 P61 P71 P81 P91 Percentile of the distribution of bequest received (P1 = bottom 1%, P100 = top 1%)
100 The optimal taxation of top labor incomes World top incomes database: 25 countries, annual series over most of 20 C, largest historical data set Two main findings: - The fall of rentiers: inequality during first half of 20 C = top capital incomes hit by capital shocks; did not fully recover so far (long lasting shock + progressive taxation) without war-induced economic & political shock, there would have been no long run decline of inequality; nothing to do with a Kuznets-type spontaneous process - The rise of working rich: inequality since 1970s; mostly due to top labor incomes, which rose to unprecedented levels; top wealth & capital incomes also recovering, though less fast; top shares 08-09, but 10; Great Recession is unlikely to reverse the long run trend what happened?

101
102 50% 45% 40% 35% 30% 25% Share of total income going to Top 10% FIGURE 1 The Top Decile Income Share in the United States, Source: Piketty and Saez (2003), series updated to Income is defined as market income including realized capital gains (excludes government transfers).
103 Share of total income going to Top 10% 50% 45% 40% 35% 30% 25% Including capital gains Excluding capital gains FIGURE 1 The Top Decile Income Share in the United States, Source: Piketty and Saez (2003), series updated to Income is defined as market income including realized capital gains (excludes government transfers).
104 25% 20% 15% 10% 5% 0% Top 1% (incomes above $352,000 in 2010) Top 5-1% (incomes between $150,000 and $352,000) Top 10-5% (incomes between $108,000 and $150,000) FIGURE 2 Decomposing the Top Decile US Income Share into 3 Groups, Share of total income accruing to each group
105 Top 1% share: English Speaking countries (U-shaped), Top Percentile Share (in percent) United States United Kingdom Canada Australia Ireland New Zealand
106 Top 1% share: Continental Europe and Japan (L-shaped), Top Percentile Share (in percent) France Germany Netherlands Switzerland Japan Sweden
107 How much should we use progressive taxation to reverse the trend? Hard to account for observed cross-country variations with a pure technological, marginal-product story One popular view: US today = working rich get their marginal product (globalization, superstars); Europe today (& US 1970s) = market prices for high skills are distorted downwards (social norms, etc.) very naïve view of the top end labor market & very ideological: we have zero evidence on the marginal product of top executives; it may well be that prices are distorted upwards (more natural for price setters to bias their own price upwards rather than downwards)
108 A more realistic view: grabbing hand model = marginal products are unobservable; top executives have an obvious incentive to convince shareholders & subordinates that they are worth a lot; no market convergence because constantly changing corporate & job structure (& costs of experimentation competition not enough to converge to full information) when pay setters set their own pay, there s no limit to rent extraction... unless confiscatory tax rates at the very top (memo: US top tax rate (1m$+) = 82%) (no more fringe benefits than today) see Piketty-Saez-Stantcheva, «Optimal Taxation of Top Labor Incomes», AEJ-EP 2013 (macro & micro evidence on rising CEO pay for luck)
109 100% Top Income Tax Rates Top marginal income tax rate applying to top income 90% 80% 70% 60% 50% 40% 30% 20% 10% 0% U.S. U.K. Germany France Source: World Top Incomes Database, 2012.
110
111
112 Optimal Taxation of Top Labor Incomes Standard optimal top tax rate formula: τ = 1/(1+ae) With: e = elasticity of labor supply, a = Pareto coefficient τ as elasticity e : don t tax elastic tax base τ as inequality, i.e. as Pareto coefficient a (US: a 3 in 1970s 1.5 in 2010s; b=a/(a-1) 1.5 3) (memo: b = E(y y>y 0 )/y 0 = measures fatness of the top) Augmented formula: τ = (1+tae 2 +ae 3 )/(1+ae) With e = e 1 + e 2 + e 3 = labor supply elasticity + income shifting elasticity + bargaining elasticity (rent extraction) Key point: τ as elasticity e 3
113
114 End of Lecture 3: what have we learned? A world with low g can naturally leads to the return of inherited wealth and can be gloomy for workers with zero initial wealth especially if global tax competition drives capital taxes to 0% especially if top labor incomes take a rising share of aggregate labor income From a r-vs-g viewpoint, 21 c maybe not too different from 19 c but still better than Ancien Regime except that nobody tried to depict AR as meritocratic Better integration between empirical & theoretical research in public economics is badly needed
Capital is Back: Wealth-Income Ratios in Rich Countries Thomas Piketty & Gabriel Zucman Paris School of Economics October 2012
 Capital is Back: Wealth-Income Ratios in Rich Countries 1870-2010 Thomas Piketty & Gabriel Zucman Paris School of Economics October 2012 How do aggregate wealth-income ratios evolve in the long run, and
Reflections on capital taxation
 Reflections on capital taxation Thomas Piketty Paris School of Economics Collège de France June 23rd 2011 Optimal tax theory What have have learned since 1970? We have made some (limited) progress regarding
Wealth, inequality & assets: where is Europe heading?
 Wealth, inequality & assets: where is Europe heading? Thomas Piketty Paris School of Economics DG ECFIN Annual Research Conference Brussels, November 23 rd 2010 Can we study macro issues without looking
Inequality, Capitalism & Crisis in the Long Run. Thomas Piketty Paris School of Economics Paris, AFEP Conference, July 6 th 2012
 Inequality, Capitalism & Crisis in the Long Run Thomas Piketty Paris School of Economics Paris, AFEP Conference, July 6 th 2012 Why inequality keeps rising? Long run distributional trends = key question
Should the Rich Pay for Fiscal Adjustment? Income and Capital Tax Options
 Should the Rich Pay for Fiscal Adjustment? Income and Capital Tax Options Thomas Piketty Paris School of Economics Brussels, ECFIN Workshop, October 18 2012 This talk: two points 1. The rise of European
Wealth, Inequality & Taxation T. Piketty, IMF Supplementary slides
 Wealth, Inequality & Taxation T. Piketty, IMF 27-09-2012 Supplementary slides Decomposition results: 1870-2010 Annual series for US, Germany, France, UK, 1870-2010 Additive vs multiplicative decomposition
Inequality and growth Thomas Piketty Paris School of Economics
 Inequality and growth Thomas Piketty Paris School of Economics Bercy, January 23 2015 This presentation is based upon Capital in the 21 st century (Harvard University Press, March 2014) This book studies
Rethinking Wealth Taxation
 Rethinking Wealth Taxation Thomas Piketty (Paris School of Economics Gabriel Zucman (London School of Economics) November 2014 This talk: two points Wealth is becoming increasingly important relative to
Capital in the 21 st century
 Capital in the 21 st century Thomas Piketty Paris School of Economics Santiago de Chile, January 13 2015 This presentation is based upon Capital in the 21 st century (Harvard University Press, March 2014)
Capital in the 21 st century
 Capital in the 21 st century Thomas Piketty Paris School of Economics Lisbon, April 27 2015 This presentation is based upon Capital in the 21 st century (Harvard University Press, March 2014) This book
Capital in the 21 st century. Thomas Piketty Paris School of Economics Visby, June
 Capital in the 21 st century Thomas Piketty Paris School of Economics Visby, June 30 2014 This presentation is based upon Capital in the 21 st century (Harvard University Press, March 2014) This book studies
Capital in the 21 st century. Thomas Piketty Paris School of Economics Cologne, December 5 th 2013
 Capital in the 21 st century Thomas Piketty Paris School of Economics Cologne, December 5 th 2013 This lecture is based upon Capital in the 21 st century (Harvard Univ. Press, March 2014) This book studies
Econ 230B Graduate Public Economics. Models of the wealth distribution. Gabriel Zucman
 Econ 230B Graduate Public Economics Models of the wealth distribution Gabriel Zucman zucman@berkeley.edu 1 Roadmap 1. The facts to explain 2. Precautionary saving models 3. Dynamic random shock models
About Capital in the 21 st Century
 About Capital in the 21 st Century Thomas Piketty December 31, 2014 Thomas Piketty is Professor of Economics at the Paris School of Economics, Paris, France. His email address is piketty@psemail.eu. In
On the distribution of wealth and the share of inheritance
 On the distribution of wealth and the share of inheritance Facundo Alvaredo Paris School of Economics & INET at Oxford & Conicet Presentation based on two papers by F. Alvaredo, Bertrand Garbinti and Thomas
On the long run evolution of inherited wealth
 On the long run evolution of inherited wealth The United States in historical and comparative perspectives 1880-2010 Facundo Alvaredo Nuffield College-EMod, PSE & Conicet Bertrand Garbinti CREST-INSEE
FIGURE I.1. Income inequality in the United States,
 FIGURE I.1. Income inequality in the United States, 1910 2010 The top decile share in US national income dropped from 45 50 percent in the 1910s 1920s to less than 35 percent in the 1950s (this is the
Lecture 4: From capital/income ratios to capital shares
 Economics of Inequality (Master PPD & APE, Paris School of Economics) Thomas Piketty Academic year 2014-2015 Lecture 4: From capital/income ratios to capital shares (Tuesday October 14 th 2014) (check
Econ 133 Global Inequality and Growth. Inequality between labor and capital. Gabriel Zucman
 Econ 133 Global Inequality and Growth Inequality between labor and capital zucman@berkeley.edu 1 What we ve learned so far: All income derives from labor or capital The share of income that goes to capital
Lecture 6: The structure of inequality: capital ownership
 Economics of Inequality (Master PPD & APE, Paris School of Economics) Thomas Piketty Academic year 2013-2014 Lecture 6: The structure of inequality: capital ownership (Tuesday January 14 th 2014) (check
Taxable Income Elasticities. 131 Undergraduate Public Economics Emmanuel Saez UC Berkeley
 Taxable Income Elasticities 131 Undergraduate Public Economics Emmanuel Saez UC Berkeley 1 TAXABLE INCOME ELASTICITIES Modern public finance literature focuses on taxable income elasticities instead of
The historical evolution of the wealth distribution: A quantitative-theoretic investigation
 The historical evolution of the wealth distribution: A quantitative-theoretic investigation Joachim Hubmer, Per Krusell, and Tony Smith Yale, IIES, and Yale March 2016 Evolution of top wealth inequality
Demographic Trends and the Real Interest Rate
 Demographic Trends and the Real Interest Rate Noëmie Lisack Rana Sajedi Gregory Thwaites Bank of England November 2017 This does not represent the views of the Bank of England 1 / 43 Disclaimer This does
ECON 361: Income Distributions and Problems of Inequality
 ECON 361: Income Distributions and Problems of Inequality David Rosé Queen s University February 9, 2017 1/35 Last class... Top income share in Canada- Veall (2012( Income inequality in the U.S. - Piketty
ECON 361: Income Distributions and Problems of Inequality
 ECON 361: Income Distributions and Problems of Inequality David Rosé Queen s University February 7, 2018 1/1 Last class... Top income share in Canada- Veall (2012) Income inequality in the U.S. - Piketty
Optimal Labor Income Taxation. Thomas Piketty, Paris School of Economics Emmanuel Saez, UC Berkeley PE Handbook Conference, Berkeley December 2011
 Optimal Labor Income Taxation Thomas Piketty, Paris School of Economics Emmanuel Saez, UC Berkeley PE Handbook Conference, Berkeley December 2011 MODERN ECONOMIES DO SIGNIFICANT REDISTRIBUTION 1) Taxes:
Thomas Piketty s Capital in the 21 st Century
 Thomas Piketty s Capital in the 21 st Century Dr. James Gerber Professor of Economics San Diego State University Osher Lifelong Learning Program The plan of this talk A few words on inequality as a subject
On the Long-Run Evolution of Inheritance: France
 On the Long-Run Evolution of Inheritance: France 1820-2050 Thomas Piketty Paris School of Economics * September 2010 ** * Professor of Economics at the Paris School of Economics (PSE) & Directeur d études
Wealth Accumulation in the US: Do Inheritances and Bequests Play a Significant Role
 Wealth Accumulation in the US: Do Inheritances and Bequests Play a Significant Role John Laitner January 26, 2015 The author gratefully acknowledges support from the U.S. Social Security Administration
Graduate Public Finance
 Graduate Public Finance Measuring Income and Wealth Inequality Owen Zidar Princeton Fall 2018 Lecture 12 Thanks to Thomas Piketty, Emmanuel Saez, Gabriel Zucman, and Eric Zwick for sharing notes/slides,
Inequality Dynamics in France, : Evidence from Distributional National Accounts (DINA)
") Inequality Dynamics in France, 1900-2014: Evidence from Distributional National Accounts (DINA) Bertrand Garbinti 1, Jonathan Goupille-Lebret 2 and Thomas Piketty 2 1 Paris School of Economics, Crest,
Inequality Dynamics in France, 1900-2014: Evidence from Distributional National Accounts (DINA) Bertrand Garbinti 1, Jonathan Goupille-Lebret 2 and Thomas Piketty 2 1 Paris School of Economics, Crest,
Aging and Pension Reform in a Two-Region World: The Role of Human Capital
 Aging and Pension Reform in a Two-Region World: The Role of Human Capital University of Mannheim, University of Cologne, Munich Center for the Economics of Aging 13th Annual Joint Conference of the RRC
Income Inequality in France, : Evidence from Distributional National Accounts (DINA)
") Income Inequality in France, 1900-2014: Evidence from Distributional National Accounts (DINA) Bertrand Garbinti 1, Jonathan Goupille-Lebret 2 and Thomas Piketty 2 1 Paris School of Economics, Crest, and
Income Inequality in France, 1900-2014: Evidence from Distributional National Accounts (DINA) Bertrand Garbinti 1, Jonathan Goupille-Lebret 2 and Thomas Piketty 2 1 Paris School of Economics, Crest, and
On the Long-Run Evolution of Inheritance: France
 On the Long-Run Evolution of Inheritance: France 1820-2050 Thomas Piketty Paris School of Economics * First version: November 13 th, 2009 This version: September 3 rd, 2010** Revised & shortened version
Dr Piketty on wealth and capital: Accumulation vs. finance
 Dr Piketty on wealth and capital: Accumulation vs. finance Jo Michell 1 SOAS Money and Development Seminar 10 December 2014 1 jo.michell@uwe.ac.uk, Department of Accounting, Economics and Finance, University
Discussion: Accounting for Wealth Inequality Dynamics: Methods, Estimates and Simulations for France ( )
") Discussion: Accounting for Wealth Inequality Dynamics: Methods, Estimates and Simulations for France (1800-2014) Philip Vermeulen European Central Bank DG-Research Fifth Conference on Household Finance
Discussion: Accounting for Wealth Inequality Dynamics: Methods, Estimates and Simulations for France (1800-2014) Philip Vermeulen European Central Bank DG-Research Fifth Conference on Household Finance
Wealth inequality, family background, and estate taxation
 Wealth inequality, family background, and estate taxation Mariacristina De Nardi 1 Fang Yang 2 1 UCL, Federal Reserve Bank of Chicago, IFS, and NBER 2 Louisiana State University June 8, 2015 De Nardi and
Global economic inequality: New evidence from the World Inequality Report
 WID.WORLD THE SOURCE FOR GLOBAL INEQUALITY DATA Global economic inequality: New evidence from the World Inequality Report Lucas Chancel General coordinator, World Inequality Report Co-director, World Inequality
Inequality and Social Mobility. Econ 101
 Inequality and Social Mobility Econ 101 Much of the following is taken from Capital in the Twenty-First Century by Thomas Piketty Special Thanks Key Concepts Wealth (stock, savings) Inequality The richest
Lecture 6: Taxable Income Elasticities
 1 40 Lecture 6: Taxable Income Elasticities Stefanie Stantcheva Fall 2017 40 TAXABLE INCOME ELASTICITIES Modern public finance literature focuses on taxable income elasticities instead of hours/participation
Keynesian Views On The Fiscal Multiplier
 Faculty of Social Sciences Jeppe Druedahl (Ph.d. Student) Department of Economics 16th of December 2013 Slide 1/29 Outline 1 2 3 4 5 16th of December 2013 Slide 2/29 The For Today 1 Some 2 A Benchmark
Why Are Interest Rates So Low? The Role of Demographic Change
 Why Are Interest Rates So Low? The Role of Demographic Change Noëmie Lisack Rana Sajedi Gregory Thwaites Bank of England April 2017 1 / 31 Disclaimer This does not represent the views of the Bank of England
Atkeson, Chari and Kehoe (1999), Taxing Capital Income: A Bad Idea, QR Fed Mpls
, Taxing Capital Income: A Bad Idea, QR Fed Mpls") Lucas (1990), Supply Side Economics: an Analytical Review, Oxford Economic Papers When I left graduate school, in 1963, I believed that the single most desirable change in the U.S. structure would be the
Lucas (1990), Supply Side Economics: an Analytical Review, Oxford Economic Papers When I left graduate school, in 1963, I believed that the single most desirable change in the U.S. structure would be the
Income Inequality in Korea,
 Income Inequality in Korea, 1958-2013. Minki Hong Korea Labor Institute 1. Introduction This paper studies the top income shares from 1958 to 2013 in Korea using tax return. 2. Data and Methodology In
The Long-Run Determinants of Inequality: What Can We Learn From Top Income Data?
 The Long-Run Determinants of Inequality: What Can We Learn From Top Income Data? Jesper Roine, Jonas Vlachos and Daniel Waldenström (paper at: www.anst.uu.se/danwa175 ) XXIV International Conference of
Econ 551 Government Finance: Revenues Winter 2018
 Econ 551 Government Finance: Revenues Winter 2018 Given by Kevin Milligan Vancouver School of Economics University of British Columbia Lecture 8c: Taxing High Income Workers ECON 551: Lecture 8c 1 of 34
Retirement Financing: An Optimal Reform Approach. QSPS Summer Workshop 2016 May 19-21
 Retirement Financing: An Optimal Reform Approach Roozbeh Hosseini University of Georgia Ali Shourideh Wharton School QSPS Summer Workshop 2016 May 19-21 Roozbeh Hosseini(UGA) 0 of 34 Background and Motivation
Lectures 9 and 10: Optimal Income Taxes and Transfers
 Lectures 9 and 10: Optimal Income Taxes and Transfers Johannes Spinnewijn London School of Economics Lecture Notes for Ec426 1 / 36 Agenda 1 Redistribution vs. Effi ciency 2 The Mirrlees optimal nonlinear
Course Notes on Basic Theoretical Models of Economic Growth, Wealth Accumulation and Concentration
 Introduction to Economic History (Master PPD & APE) (EHESS & Paris School of Economics) Thomas Piketty Academic year 2018-2019 Course Notes on Basic Theoretical Models of Economic Growth, Wealth Accumulation
Welfare Analysis of Progressive Expenditure Taxation in Japan
 Welfare Analysis of Progressive Expenditure Taxation in Japan Akira Okamoto (Okayama University) * Toshihiko Shima (University of Tokyo) Abstract This paper aims to establish guidelines for public pension
Optimal Taxation Under Capital-Skill Complementarity
 Optimal Taxation Under Capital-Skill Complementarity Ctirad Slavík, CERGE-EI, Prague (with Hakki Yazici, Sabanci University and Özlem Kina, EUI) January 4, 2019 ASSA in Atlanta 1 / 31 Motivation Optimal
From Communism to Capitalism: Private vs. Public Property and Rising. Inequality in China and Russia
 From Communism to Capitalism: Private vs. Public Property and Rising Inequality in China and Russia Filip Novokmet (Paris School of Economics) Thomas Piketty (Paris School of Economics) Li Yang (Paris
Wealth Distribution and Taxation. Frank Cowell: MSc Public Economics 2011/2
 Wealth Distribution and Taxation Frank Cowell: MSc Public Economics 2011/2 http://darp.lse.ac.uk/ec426 Overview... Wealth Distribution and Taxation Wealth taxation Why wealth taxation? Types of tax Wealth
TOP INCOME SHARES IN THE LONG RUN: AN OVERVIEW
 TOP INCOME SHARES IN THE LONG RUN: AN OVERVIEW Thomas Piketty ENS-EHESS, Paris-Jourdan Abstract This paper offers an overview of what we have learned from a collective research project on income distribution
Wealth Distribution and Bequests
 Wealth Distribution and Bequests Prof. Lutz Hendricks Econ821 February 9, 2016 1 / 20 Contents Introduction 3 Data on bequests 4 Bequest motives 5 Bequests and wealth inequality 10 De Nardi (2004) 11 Research
On the share of inheritance in aggregate wealth Europe and the United States,
 On the share of inheritance in aggregate wealth Europe and the United States, 1900-2010 Facundo Alvaredo Paris School of Economics, INET at Oxford & CONICET Bertrand Garbinti CREST and Paris School of
On the Share of Inheritance in Aggregate Wealth: Europe and the USA,
 (2017) 84, 239 260 doi:10.1111/ecca.12233 On the Share of Inheritance in Aggregate Wealth: Europe and the USA, 1900 2010 By FACUNDO ALVAREDO,, BERTRAND GARBINTI and THOMAS PIKETTY Paris School of Economics
Taxing Firms Facing Financial Frictions
 Taxing Firms Facing Financial Frictions Daniel Wills 1 Gustavo Camilo 2 1 Universidad de los Andes 2 Cornerstone November 11, 2017 NTA 2017 Conference Corporate income is often taxed at different sources
Measuring Wealth Inequality in Europe: A Quest for the Missing Wealthy
 Measuring Wealth Inequality in Europe: A Quest for the Missing Wealthy 1 partly based on joint work with Robin Chakraborty 2 1 LISER - Luxembourg Institute of Socio-Economic Research 2 Deutsche Bundesbank
Sarah K. Burns James P. Ziliak. November 2013
 Sarah K. Burns James P. Ziliak November 2013 Well known that policymakers face important tradeoffs between equity and efficiency in the design of the tax system The issue we address in this paper informs
The Ramsey Model. Lectures 11 to 14. Topics in Macroeconomics. November 10, 11, 24 & 25, 2008
 The Ramsey Model Lectures 11 to 14 Topics in Macroeconomics November 10, 11, 24 & 25, 2008 Lecture 11, 12, 13 & 14 1/50 Topics in Macroeconomics The Ramsey Model: Introduction 2 Main Ingredients Neoclassical
Financing National Health Insurance and Challenge of Fast Population Aging: The Case of Taiwan
 Financing National Health Insurance and Challenge of Fast Population Aging: The Case of Taiwan Minchung Hsu Pei-Ju Liao GRIPS Academia Sinica October 15, 2010 Abstract This paper aims to discover the impacts
Convergence of Life Expectancy and Living Standards in the World
 Convergence of Life Expectancy and Living Standards in the World Kenichi Ueda* *The University of Tokyo PRI-ADBI Joint Workshop January 13, 2017 The views are those of the author and should not be attributed
Achieving Actuarial Balance in Social Security: Measuring the Welfare Effects on Individuals
 Achieving Actuarial Balance in Social Security: Measuring the Welfare Effects on Individuals Selahattin İmrohoroğlu 1 Shinichi Nishiyama 2 1 University of Southern California (selo@marshall.usc.edu) 2
How fat is the top tail of the wealth distribution?
 How fat is the top tail of the wealth distribution? Philip Vermeulen European Central Bank DG-Research Household wealth data and Public Policy, London 9/March/2015 Philip Vermeulen How fat is the top tail
Hilary Hoynes UC Davis EC230. Taxes and the High Income Population
 Hilary Hoynes UC Davis EC230 Taxes and the High Income Population New Tax Responsiveness Literature Started by Feldstein [JPE The Effect of MTR on Taxable Income: A Panel Study of 1986 TRA ]. Hugely important
UNIVERSITY OF OSLO DEPARTMENT OF ECONOMICS
 UNIVERSITY OF OSLO DEPARTMENT OF ECONOMICS Postponed exam: ECON4310 Macroeconomic Theory Date of exam: Monday, December 14, 2015 Time for exam: 09:00 a.m. 12:00 noon The problem set covers 13 pages (incl.
131: Public Economics Taxes on Capital and Savings
 131: Public Economics Taxes on Capital and Savings Emmanuel Saez Berkeley 1 MOTIVATION 1) Capital income is about 25% of national income (labor income is 75%) but distribution of capital income is much
Intergenerational transfers, tax policies and public debt
 Intergenerational transfers, tax policies and public debt Erwan MOUSSAULT February 13, 2017 Abstract This paper studies the impact of the tax system on intergenerational family transfers in an overlapping
Savings, Investment and the Real Interest Rate in an Endogenous Growth Model
 Savings, Investment and the Real Interest Rate in an Endogenous Growth Model George Alogoskoufis* Athens University of Economics and Business October 2012 Abstract This paper compares the predictions of
Debt Constraints and the Labor Wedge
 Debt Constraints and the Labor Wedge By Patrick Kehoe, Virgiliu Midrigan, and Elena Pastorino This paper is motivated by the strong correlation between changes in household debt and employment across regions
Economics 230a, Fall 2015 Lecture Note 11: Capital Gains and Estate Taxation
 Economics 230a, Fall 2015 Lecture Note 11: Capital Gains and Estate Taxation Capital Gains Taxation Capital gains taxes are of particular interest for a number of reasons, even though they do not account
Final Exam Solutions
 14.06 Macroeconomics Spring 2003 Final Exam Solutions Part A (True, false or uncertain) 1. Because more capital allows more output to be produced, it is always better for a country to have more capital
Chapter 5 Fiscal Policy and Economic Growth
 George Alogoskoufis, Dynamic Macroeconomic Theory, 2015 Chapter 5 Fiscal Policy and Economic Growth In this chapter we introduce the government into the exogenous growth models we have analyzed so far.
UNIVERSITY OF OSLO DEPARTMENT OF ECONOMICS
 UNIVERSITY OF OSLO DEPARTMENT OF ECONOMICS Postponed exam: ECON4310 Macroeconomic Theory Date of exam: Wednesday, January 11, 2017 Time for exam: 09:00 a.m. 12:00 noon The problem set covers 13 pages (incl.
Testing the predictions of the Solow model:
 Testing the predictions of the Solow model: 1. Convergence predictions: state that countries farther away from their steady state grow faster. Convergence regressions are designed to test this prediction.
Topic 4. Introducing investment (and saving) decisions
 decisions") 14.452. Topic 4. Introducing investment (and saving) decisions Olivier Blanchard April 27 Nr. 1 1. Motivation In the benchmark model (and the RBC extension), there was a clear consump tion/saving decision.
14.452. Topic 4. Introducing investment (and saving) decisions Olivier Blanchard April 27 Nr. 1 1. Motivation In the benchmark model (and the RBC extension), there was a clear consump tion/saving decision.
The Distribution of US Wealth, Capital Income and Returns since Emmanuel Saez (UC Berkeley) Gabriel Zucman (LSE and UC Berkeley)
 Gabriel Zucman (LSE and UC Berkeley)") The Distribution of US Wealth, Capital Income and Returns since 1913 Emmanuel Saez (UC Berkeley) Gabriel Zucman (LSE and UC Berkeley) March 2014 Is rising inequality purely a labor income phenomenon? Income
The Distribution of US Wealth, Capital Income and Returns since 1913 Emmanuel Saez (UC Berkeley) Gabriel Zucman (LSE and UC Berkeley) March 2014 Is rising inequality purely a labor income phenomenon? Income
Economics 230a, Fall 2014 Lecture Note 11: Capital Gains and Estate Taxation
 Economics 230a, Fall 2014 Lecture Note 11: Capital Gains and Estate Taxation Two taxes that deserve special attention are those imposed on capital gains and estates. Capital Gains Taxation Capital gains
Sang-Wook (Stanley) Cho
 Cho") Beggar-thy-parents? A Lifecycle Model of Intergenerational Altruism Sang-Wook (Stanley) Cho University of New South Wales, Sydney July 2009, CEF Conference Motivation & Question Since Becker (1974), several
Beggar-thy-parents? A Lifecycle Model of Intergenerational Altruism Sang-Wook (Stanley) Cho University of New South Wales, Sydney July 2009, CEF Conference Motivation & Question Since Becker (1974), several
NBER WORKING PAPER SERIES GLOBAL INEQUALITY DYNAMICS: NEW FINDINGS FROM WID.WORLD
 NBER WORKING PAPER SERIES GLOBAL INEQUALITY DYNAMICS: NEW FINDINGS FROM WID.WORLD Facundo Alvaredo Lucas Chancel Thomas Piketty Emmanuel Saez Gabriel Zucman Working Paper 23119 http://www.nber.org/papers/w23119
1. Cash-in-Advance models a. Basic model under certainty b. Extended model in stochastic case. recommended)
") Monetary Economics: Macro Aspects, 26/2 2013 Henrik Jensen Department of Economics University of Copenhagen 1. Cash-in-Advance models a. Basic model under certainty b. Extended model in stochastic case
Monetary Economics: Macro Aspects, 26/2 2013 Henrik Jensen Department of Economics University of Copenhagen 1. Cash-in-Advance models a. Basic model under certainty b. Extended model in stochastic case
Zipf s Law, Pareto s Law, and the Evolution of Top Incomes in the U.S.
 Zipf s Law, Pareto s Law, and the Evolution of Top Incomes in the U.S. Shuhei Aoki Makoto Nirei 15th Macroeconomics Conference at University of Tokyo 2013/12/15 1 / 27 We are the 99% 2 / 27 Top 1% share
Is the Maastricht debt limit safe enough for Slovakia?
 Is the Maastricht debt limit safe enough for Slovakia? Fiscal Limits and Default Risk Premia for Slovakia Moderné nástroje pre finančnú analýzu a modelovanie Zuzana Múčka June 15, 2015 Introduction Aims
SDP Macroeconomics Final exam, 2014 Professor Ricardo Reis
 SDP Macroeconomics Final exam, 2014 Professor Ricardo Reis Answer each question in three or four sentences and perhaps one equation or graph. Remember that the explanation determines the grade. 1. Question
Why are real interest rates so low? Secular stagnation and the relative price of capital goods
 The facts Why are real interest rates so low? Secular stagnation and the relative price of capital goods Bank of England and LSE June 2015 The facts This does not reflect the views of the Bank of England
Public Pension Reform in Japan
 ECONOMIC ANALYSIS & POLICY, VOL. 40 NO. 2, SEPTEMBER 2010 Public Pension Reform in Japan Akira Okamoto Professor, Faculty of Economics, Okayama University, Tsushima, Okayama, 700-8530, Japan. (Email: okamoto@e.okayama-u.ac.jp)
Applying Generalized Pareto Curves to Inequality Analysis
 Applying Generalized Pareto Curves to Inequality Analysis By THOMAS BLANCHET, BERTRAND GARBINTI, JONATHAN GOUPILLE-LEBRET AND CLARA MARTÍNEZ- TOLEDANO* *Blanchet: Paris School of Economics, 48 boulevard
Sang-Wook (Stanley) Cho
 Cho") Beggar-thy-parents? A Lifecycle Model of Intergenerational Altruism Sang-Wook (Stanley) Cho University of New South Wales March 2009 Motivation & Question Since Becker (1974), several studies analyzing
Beggar-thy-parents? A Lifecycle Model of Intergenerational Altruism Sang-Wook (Stanley) Cho University of New South Wales March 2009 Motivation & Question Since Becker (1974), several studies analyzing
Does the Social Safety Net Improve Welfare? A Dynamic General Equilibrium Analysis
 Does the Social Safety Net Improve Welfare? A Dynamic General Equilibrium Analysis University of Western Ontario February 2013 Question Main Question: what is the welfare cost/gain of US social safety
Steinar Holden, August 2005
 Edward C. Prescott: Why Do Americans Work so Much More Than Europeans? Federal Reserve Bank of Minneapolis Quarterly Review Vol. 28, No.1, July 2004, pp. 2-13 Steinar Holden, August 2005 1 Output, Labor
Heterogeneous Firm, Financial Market Integration and International Risk Sharing
 Heterogeneous Firm, Financial Market Integration and International Risk Sharing Ming-Jen Chang, Shikuan Chen and Yen-Chen Wu National DongHwa University Thursday 22 nd November 2018 Department of Economics,
Characterization of the Optimum
 ECO 317 Economics of Uncertainty Fall Term 2009 Notes for lectures 5. Portfolio Allocation with One Riskless, One Risky Asset Characterization of the Optimum Consider a risk-averse, expected-utility-maximizing
Fiscal Multipliers in Recessions. M. Canzoneri, F. Collard, H. Dellas and B. Diba
 1 / 52 Fiscal Multipliers in Recessions M. Canzoneri, F. Collard, H. Dellas and B. Diba 2 / 52 Policy Practice Motivation Standard policy practice: Fiscal expansions during recessions as a means of stimulating
1 The Solow Growth Model
 1 The Solow Growth Model The Solow growth model is constructed around 3 building blocks: 1. The aggregate production function: = ( ()) which it is assumed to satisfy a series of technical conditions: (a)
From Communism to Capitalism: Private Versus Public Property and Inequality in China and Russia
 WID.world WORKING PAPERS SERIES N 2018/2 From Communism to Capitalism: Private Versus Public Property and Inequality in China and Russia Filip Novokmet Thomas Piketty Li Yang Gabriel Zucman January 2018
Income and Wealth Concentration in Switzerland over the 20 th Century
 September 2003 Income and Wealth Concentration in Switzerland over the 20 th Century Fabien Dell, INSEE Thomas Piketty, EHESS Emmanuel Saez, UC Berkeley and NBER Abstract: This paper presents homogeneous
ECO 4933 Topics in Theory
 ECO 4933 Topics in Theory Introduction to Economic Growth Fall 2015 Chapter 2 1 Chapter 2 The Solow Growth Model Chapter 2 2 Assumptions: 1. The world consists of countries that produce and consume only
LECTURE 14: THE INEQUALITY OF CAPITAL OWNERSHIP IN EUROPE AND THE USA
 LECTURE 14: THE INEQUALITY OF CAPITAL OWNERSHIP IN EUROPE AND THE USA Dr. Aidan Regan Email: aidan.regan@ucd.ie Website: www.aidanregan.com Teaching blog: www.capitalistdemocracy.wordpress.com Twitter:
Macroeconomic Models of Economic Growth
 Macroeconomic Models of Economic Growth J.R. Walker U.W. Madison Econ448: Human Resources and Economic Growth Course Roadmap: Seemingly Random Topics First midterm a week from today. What have we covered