2012 Canazei Winter Workshop on Inequality
|
|
|
- Marjory Little
- 5 years ago
- Views:
Transcription
1 2012 Canazei Winter Workshop on Inequality Measuring the Global Distribution of Wealth Jim Davies 11 January 2012
2 Collaborators Susanna Sandström, Tony Shorrocks, Ed Wolff The world distribution of household wealth in J.B. Davies (ed.) Personal Wealth from a Global Perspective (OUP, 2008) The level and distribution of global household wealth, Economic Journal, March 2011 Tony Shorrocks, Rodrigo Lluberas, Michael O Sullivan, Giles Keating Credit Suisse Global Wealth Report 2010, 2011 Credit Suisse Global Wealth Databook 2010, 2011
3
4 Objective To measure the world distribution of household wealth across individuals, countries and regions wealth = real assets + financial assets debts wealth level results for years global distribution pattern for 2000, 2010 and 2011 compared across countries using official exchange rates comparisons for adult population
5 Household Wealth - Coverage Asset coverage follows UN system of national accounts; residence basis Some assets that are included: Equity of personal sector in insurance and pension funds; trust funds Some wealth not included: Social security wealth Net worth of government, corporations, ROW
6 Some Related Literature Goldsmith, Raymond W. (1985): Comparative National Balance Sheets, A Study of Twenty Countries, , University of Chicago Press. Milanovic, Branko (2005): Worlds Apart: Measuring International and Global Inequality, Princeton University Press. World Bank (2011): The Changing Wealth of Nations.
7 Structure of talk Evidence on wealth levels and composition Estimating levels for countries without direct data Evidence on wealth distribution Estimating distributions for countries without wealth distribution data Adjusting top tail to match information in rich lists World distribution of wealth Long-term trends in wealth-holding
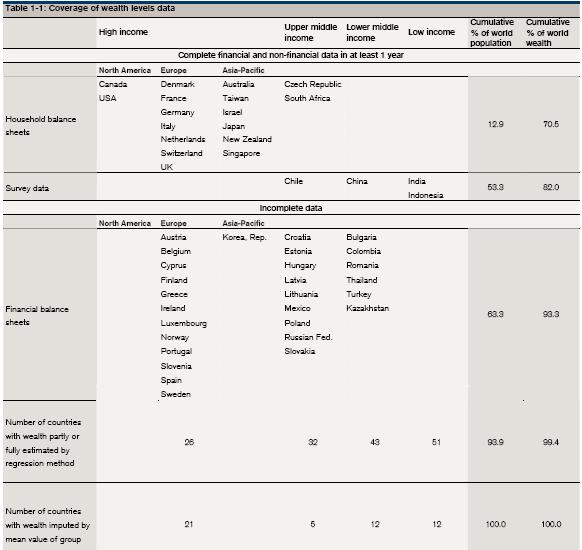
8 Some details regarding methods (1) adult population (2) average wealth level: based on household balance sheets and wealth survey data (covering 49 countries, 63% of world population, 93% of world wealth) extended by regression methods to most other countries region-income class averages imputed to remaining countries (3) distribution of wealth: based on distribution data for 22 countries wealth dist estimated from income distribution for most other countries region-income class averages imputed to remaining countries
9 Estimating Wealth Levels Household Balance Sheet Data countries Our preferred source Est d by national statistical organizations, central banks, ministries of finance, using multiple sources Counterparty data for most financial assets Surveys, perpetual inventories for non-financial Part of UN system of national accounts Financial assets collated by OECD, Eurostat Non-financial assets: obtain directly from official country sources
10 Estimating wealth levels (cont d.) Household Survey Data countries Financial assets under-estimated Value of housing relatively accurate Liabilities somewhat under-estimated Used here when HBS data unavailable - correction to Financial Assets based on regression results
11
12 Wealth dominated by Real Assets in low income countries Financial Assets more important in high income countries Financial Interrelations Ratio rises with development (Goldsmith, 1985). Ratio = Financial Assets/Non-Financial Assets Averages about 0.5 in LDCs Approx 1.0 in Developed Countries Large differences in wealth composition for countries at similar income
13 Asset composition, 2011 South Africa United States Japan Switzerland Denmark Singapore China Czech Republic France Indonesia India Non-financial assets Financial assets Debts
14 Composition of financial assets, 2011 Colombia Japan United Kingdom Singapore Germany France Italy Canada Sweden United States Currency and deposits Equities Other financial assets
15 Switzerland Australia Singapore France Italy United Canada Kingdom Japan United States of America Denmark New Zealand Netherlands China, Taiwan Israel Czech Republic GDP per capita
16 Log Financial Assets Per Capita regression (SUR) with year and region dummies, Variable Coefficient Standard Error Log Consumption per capita GDP per capita growth rate Log Market Capitalization Rate % Urban Population Survey Dummy R2 = Observations
17 Log Liabilities Per Capita regression (SUR) with year and region dummies, Variable Coefficient Standard Error Log Consumption per capita Log Domestic Credit per capita % Urban Population R2 = Observations
18 Log Non-Financial Assets Per Capita regression with year and region dummies, Variable Coefficient Standard Error Log Consumption per capita Life Expectancy Log Population Density % Urban Population R2 = Observations
19 Estimating & imputing wealth levels for all countries Complete HBS data: 17 countries Financial HBS Data: 28 countries Non-financial assets imputed from regression Survey Data: 4 (includes China & India) Financial assets corrected using survey dummy Entirely imputed from regressions: 152 Mean of region/income group: 50
20 Estimating wealth levels for interrupted HBS & Survey series Complete annual data (2 nd Q) rare... US and a few other countries Regression-based estimates for missing years : imputations based on separate regressions done on key variables
21 Aggregate Global Wealth, trillion USD Africa India Latin America China Asia-Pacific Europe North America
22 Sources of changes in wealth levels real growth and private saving asset price changes (e.g. shares, housing) exchange rate movements (especially $ - euro) population shifts and ageing
23 Wealth shares by region 2011 (%) Latin America 4 China 9 India 2 Africa 1 Europe 34 Asia-Pacific 22 North America 28
24 Geographical spread of wealth wealth is heavily concentrated in North America, Europe, and high income Asia-Pacific countries - collectively have 80% of world wealth North America has 6% of the world adult population, 28% of household wealth Europe and high income Asia-Pacific countries also have disproportionate amounts of wealth For Africa, China, India, and lower income Asian countries, share of wealth is considerably less than population share, sometimes by a factor of more than 10
25 Global trends in wealth per adult, USD per adult net worth financial wealth debt net worth at constant exchange rates non-financial wealth

26 World Wealth Levels, 2011
27 Wealth levels across Countries Global household wealth using official exchange rates 2000 $ 30, $ 47, $ 51,078 Average wealth per adult end 2010 mid 2011 Switzerland $ 420,000 $ 540,000 USA $ 247,000 $ 248,000 Japan $ 215,000 $ 249,000 China $ 18,000 $ 21,000 Indonesia $ 11,000 $12,000 India $ 5,100 $ 5,500
28 GDP per cap upper lim $) Example countries Wealth/GDP Financial/Non- Financial Assets 593 Congo, Afghanistan ,031 Bangladesh, Zimbabwe ,824 India, Ghana ,391 Philipines, Bolivia ,245 China, Ecuador ,914 S. Africa, Jamaica ,423 Brazil, Mexico, Turkey ,353 Chile, Poland, Portugal ,970 France, Germany, Italy ,060 Luxbg, Sweden, U.S
29 Differences in wealth and financial development Bottom 80% of countries by GDP: Wealth/GDP: 1.95 Financial/Non-Financial Assets: 0.67 Emerging market countries generally still have relatively low financial interrelations ratio Top 20% of countries: Wealth/GDP: 4.04 Financial/Non-Financial Assets: 1.27
30 Wealth distribution data Share of top Country Year Unit 25% 20% 10% 5% 2% 1% 0.50% 0.10% Australia 2006 household 61.2 Canada 2005 family Chile 2007 household China 2002 person Denmark 1996 family France 2010 adult Germany 2003 household India household Indonesia 1997 household Italy 2008 household Japan 1999 household Korea, 1988 household Netherlands 2008 household New Zealand 2001 tax unit Norway 2004 household Spain 2005 household Sweden 2007 adult Switzerland 1997 family Thailand 2006 household 69.5 UK 2005 household USA 2007 family
31 Strategy for global wealth distribution published wealth (and income) dist data for 22 countries impute missing quantile shares using ungrouping program compare wealth to income shares estimate wealth dist from income dist data for 141 countries generate synthetic wealth samples for each country 1 observation per 10,000 adults bottom 90% 1 observation per 1,000 adults top 10% 1 observation per 100 adults top 1% scale up wealth values to match average wealth adjust top tail to match number of billionaires by country in Forbes list, rescale to match average wealth, repeat process until convergence process world wealth sample 1.27 million weighted observations
32 Pareto Top Tail Thousands of adults above wealth level (logarithmic scale) E+09 Weallth level (USD, Logarithmic scale) Unadjusted wealth estimates Fitted Pareto
33 Unadjusted and adjusted wealth values for China Number of adults above wealth level Weallth level (USD, Logarithmic scale) unadjusted data adjusted data
34 Wealth inequality is very high share of the top 10% around 60% in China, 71% in US, higher in some other countries even higher for world as a whole richest 2% of adults own more than half global wealth global wealth Gini for adults is most global inequality is between country inequality wealth more unequally distributed than income across countries high income countries have bigger share of wealth than GDP reverse is true of middle- and low-income nations some exceptions in Nordic and Eastern Europe transition countries
35 Global wealth distribution, adults Decile Share (%) Decile Share (%) Top 5% Top 1% Gini Mean $51,078

36 The global wealth pyramid
37 The global rich 2011 (official exchange rates) $ 4,200 per adult to be in top half of world wealth ranking $ 82,000 to be in richest 10% of adults $ 712,000 to be in richest 1% of adults (group with 45 million members worldwide) richest 1% of adults owned 44% of global assets richest 5% owned 72% richest 10% owned 84% bottom half owned under 2%

38 Regional Composition of Global Wealth Distribution, 2000
39 Regional Composition of Global Wealth Distribution, % 90% North America Latin America 80% 70% 60% 50% 40% Africa India China Europe 30% 20% 10% Asia-Pacific 0% Decile

40 Owners of wealth above USD 100,000 by country

41 Dollar millionaires by country of residence
42 Where do the richest 1% live? Richest 1% more concentrated geographically than top decile US even more dominant (but share has been falling) 28% reside in the US, 12% in Japan China and India membership was almost insignificant in year 2000, now China accounts for 3.5%


43 Apex of the Pyramid > USD 100 million 29,000 USD 10 to 100 million USD 5 to 10 million 987,300 1,959,600 USD 1 to 5 million 26,724,200 wealth range number of adults

44 Rich and Super Rich Individuals by Region
45 Super Rich ( > $50m) 2011: selected countries United States of America China Switzerland Germany Japan France United Kingdom Canada Italy Australia India Russia Brazil Taiwan Sweden Spain Turkey Hong Kong Korea Netherlands Israel Mexico Indonesia Singapore Malaysia Saudi Arabia Egypt USD 50m - 100m USD 100m - 500m USD 500m - 1bn > USD 1bn
46 Long-term trends in wealth-holding Wealth-disposable income ratios for France, UK, US since early 1900s OECD wealth-disposable income ratios for G7 countries since 1960 Major wealth components for G7 countries since 1960
47 Wealth-income ratios for France, UK and USA since France UK USA
48 Household wealth-income ratio in G7 countries Japan UK USA Italy France Canada Germany Canada France Germany Italy Japan UK USA
49 Gross financial assets - income ratio 6,0 5,5 5,0 4,5 4,0 Japan UK 3,5 3,0 USA Italy Canada 2,5 2,0 1,5 1,0 0,5 France Germany 0, Canada France Germany Italy Japan UK USA
50 Household debt-income ratio in G7 countries 2,0 UK 1,5 Japan Germany 1,0 Canada USA France Italy 0,5 0, Canada France Germany Italy Japan UK USA
51 Household net financial wealth - income ratio 4,5 4,0 Japan 3,5 3,0 2,5 2,0 1,5 USA France Italy Canada UK Germany 1,0 0,5 0, Canada France Germany Italy Japan UK USA
52 Real assets-income ratio in G7 countries 7,0 6,5 6,0 Japan France 5,5 5,0 4,5 4,0 UK Italy Germany 3,5 3,0 Canada 2,5 USA 2,0 1,5 1,0 0,5 0, Canada France Germany Italy Japan UK USA
53 Wealth per adult USA USD USD USD USD USD USD USD
54 Wealth per adult Japan USD USD USD USD USD USD USD Wealth per adult Wealth per adult at constant exchange rate
55 Wealth per adult China USD USD USD USD USD USD Wealth per adult Wealth per adult at constant exchange rate
56 Wealth per adult Switzerland USD USD USD USD USD USD USD Wealth per adult Wealth per adult at constant exchange rate
57 Wealth per adult Australia USD USD USD USD USD USD USD USD USD USD Wealth per adult Wealth per adult at constant exchange rate
58 Wealth per adult Indonesia USD USD USD USD USD USD USD USD Wealth per adult Wealth per adult at constant exchange rate
59 Conclusions: Regions Wealth geographically concentrated North America, Europe, Rich Asia-Pacific China: wealth rising rapidly, population moving into higher global deciles India: wealth rising but highly polarized, move into higher global deciles weaker than China s Latin America: microcosm of world as a whole? Africa: low wealth/income in many countries
60 Conclusions: wealth structure and inequality Financial/Non-Financial Assets Ratio 0.67 for bottom 80% of countries 1.27 for top 20% Still relatively low in emerging market countries World wealth highly unequal Shares of top 1, 5, 10%: , 84.3% Gini coefficient = 0.893
61 Conclusions: Long-run trends Wealth/disposable income ratio: US: in range (4,5) for most of last 100 years, brief departures France, UK: now 8, up from 3 in 1950 (FR), 4 in 1980 (UK) Upward trend across G7 since 1985, large fluctuations except in Canada, Germany Financial Assets/Income: , little trend since 2000 Debt/Income: , except since 2000 in Japan Germany
THE GLOBAL PATTERN OF HOUSEHOLD WEALTH
 Journal of International Development J. Int. Dev. 21, 1111 1124 (2009) Published online in Wiley InterScience (www.interscience.wiley.com).1648 THE GLOBAL PATTERN OF HOUSEHOLD WEALTH JAMES B. DAVIES 1,
Financial wealth of private households worldwide
 Economic Research Financial wealth of private households worldwide Munich, October 217 Recovery in turbulent times Assets and liabilities of private households worldwide in EUR trillion and annualrate
Quarterly Investment Update First Quarter 2017
 Quarterly Investment Update First Quarter 2017 Market Update: A Quarter in Review March 31, 2017 CANADIAN STOCKS INTERNATIONAL STOCKS Large Cap Small Cap Growth Value Large Cap Small Cap Growth Value Emerging
Quarterly Investment Update First Quarter 2018
 Quarterly Investment Update First Quarter 2018 Dimensional Fund Advisors Canada ULC ( DFA Canada ) is not affiliated with [insert name of Advisor]. DFA Canada is a separate and distinct company. Market
San Francisco Retiree Health Care Trust Fund Education Materials on Public Equity
 M E K E T A I N V E S T M E N T G R O U P 5796 ARMADA DRIVE SUITE 110 CARLSBAD CA 92008 760 795 3450 fax 760 795 3445 www.meketagroup.com The Global Equity Opportunity Set MSCI All Country World 1 Index
Global Business Barometer April 2008
 Global Business Barometer April 2008 The Global Business Barometer is a quarterly business-confidence index, conducted for The Economist by the Economist Intelligence Unit What are your expectations of
World Consumer Income and Expenditure Patterns
 World Consumer Income and Expenditure Patterns 2011 www.euromonitor.com iii Summary of Contents Contents Summary of Contents Section 1 Introduction 1 Section 2 Socio-economic parameters 21 Section 3 Annual
Actuarial Supply & Demand. By i.e. muhanna. i.e. muhanna Page 1 of
 By i.e. muhanna i.e. muhanna Page 1 of 8 040506 Additional Perspectives Measuring actuarial supply and demand in terms of GDP is indeed a valid basis for setting the actuarial density of a country and
DFA Global Equity Portfolio (Class F) Quarterly Performance Report Q2 2014
 Quarterly Performance Report Q2 2014") DFA Global Equity Portfolio (Class F) Quarterly Performance Report Q2 2014 This presentation has been prepared by Dimensional Fund Advisors Canada ULC ( DFA Canada ), manager of the Dimensional Funds.
DFA Global Equity Portfolio (Class F) Quarterly Performance Report Q2 2014 This presentation has been prepared by Dimensional Fund Advisors Canada ULC ( DFA Canada ), manager of the Dimensional Funds.
Global Construction 2030 Expo EDIFICA 2017 Santiago Chile. 4-6 October 2017
 Global Construction 2030 Expo EDIFICA 2017 Santiago Chile 4-6 October 2017 Graham Robinson Global Construction Perspectives Global Construction 2030 is the fourth in a series of global studies of the construction
DFA Global Equity Portfolio (Class F) Performance Report Q2 2017
 Performance Report Q2 2017") DFA Global Equity Portfolio (Class F) Performance Report Q2 2017 This presentation has been prepared by Dimensional Fund Advisors Canada ULC ( DFA Canada ), manager of the Dimensional Funds. This presentation
DFA Global Equity Portfolio (Class F) Performance Report Q2 2017 This presentation has been prepared by Dimensional Fund Advisors Canada ULC ( DFA Canada ), manager of the Dimensional Funds. This presentation
DFA Global Equity Portfolio (Class F) Performance Report Q3 2018
 Performance Report Q3 2018") DFA Global Equity Portfolio (Class F) Performance Report Q3 2018 This presentation has been prepared by Dimensional Fund Advisors Canada ULC ( DFA Canada ), manager of the Dimensional Funds. This presentation
DFA Global Equity Portfolio (Class F) Performance Report Q3 2018 This presentation has been prepared by Dimensional Fund Advisors Canada ULC ( DFA Canada ), manager of the Dimensional Funds. This presentation
DFA Global Equity Portfolio (Class F) Performance Report Q4 2017
 Performance Report Q4 2017") DFA Global Equity Portfolio (Class F) Performance Report Q4 2017 This presentation has been prepared by Dimensional Fund Advisors Canada ULC ( DFA Canada ), manager of the Dimensional Funds. This presentation
DFA Global Equity Portfolio (Class F) Performance Report Q4 2017 This presentation has been prepared by Dimensional Fund Advisors Canada ULC ( DFA Canada ), manager of the Dimensional Funds. This presentation
DFA Global Equity Portfolio (Class F) Performance Report Q3 2015
 Performance Report Q3 2015") DFA Global Equity Portfolio (Class F) Performance Report Q3 2015 This presentation has been prepared by Dimensional Fund Advisors Canada ULC ( DFA Canada ), manager of the Dimensional Funds. This presentation
DFA Global Equity Portfolio (Class F) Performance Report Q3 2015 This presentation has been prepared by Dimensional Fund Advisors Canada ULC ( DFA Canada ), manager of the Dimensional Funds. This presentation
DIVERSIFICATION. Diversification
 Diversification Helps you capture what global markets offer Reduces risks that have no expected return May prevent you from missing opportunity Smooths out some of the bumps Helps take the guesswork out
The World Distribution of Household Wealth
 The World Distribution of Household Wealth James B. Davies*, Susanna Sandstrom, Anthony Shorrocks, and Edward N. Wolff 5 December 2006 * Department of Economics University of Western Ontario London, Canada
EQUITY REPORTING & WITHHOLDING. Updated May 2016
 EQUITY REPORTING & WITHHOLDING Updated May 2016 When you exercise stock options or have RSUs lapse, there may be tax implications in any country in which you worked for P&G during the period from the
Corrigendum. OECD Pensions Outlook 2012 DOI: ISBN (print) ISBN (PDF) OECD 2012
 ISBN (PDF) OECD 2012") OECD Pensions Outlook 2012 DOI: http://dx.doi.org/9789264169401-en ISBN 978-92-64-16939-5 (print) ISBN 978-92-64-16940-1 (PDF) OECD 2012 Corrigendum Page 21: Figure 1.1. Average annual real net investment
OECD Pensions Outlook 2012 DOI: http://dx.doi.org/9789264169401-en ISBN 978-92-64-16939-5 (print) ISBN 978-92-64-16940-1 (PDF) OECD 2012 Corrigendum Page 21: Figure 1.1. Average annual real net investment
Reporting practices for domestic and total debt securities
 Last updated: 27 November 2017 Reporting practices for domestic and total debt securities While the BIS debt securities statistics are in principle harmonised with the recommendations in the Handbook on
Fiscal Policy and Income Inequality
 Fiscal Policy and Income Inequality Francesca Bastagli Overseas Development Institute Taxation & Developing Countries (a PEAKS training course) 16 September 2013 Overview Trends in income inequality The
PREDICTING VEHICLE SALES FROM GDP
 UMTRI--6 FEBRUARY PREDICTING VEHICLE SALES FROM GDP IN 8 COUNTRIES: - MICHAEL SIVAK PREDICTING VEHICLE SALES FROM GDP IN 8 COUNTRIES: - Michael Sivak The University of Michigan Transportation Research
Guide to Treatment of Withholding Tax Rates. January 2018
 Guide to Treatment of Withholding Tax Rates Contents 1. Introduction 1 1.1. Aims of the Guide 1 1.2. Withholding Tax Definition 1 1.3. Double Taxation Treaties 1 1.4. Information Sources 1 1.5. Guide Upkeep
GLOBAL INEQUALITY AND AUSTRALIA S ROLE
 GLOBAL INEQUALITY AND AUSTRALIA S ROLE PRESENTATION TO A RECEPTION HOSTED BY OXFAM AUSTRALIA GOVERNMENT HOUSE, HOBART, TASMANIA 29 TH MAY 217 The good news: global poverty has fallen by almost 6% over
A short history of debt
 A short history of debt In the words of the late Charles Kindleberger, debt/financial crises are a hardy perennial we have been here many times before. Over the past decade and a half the ratio of global
COUNTRY COST INDEX JUNE 2013
 COUNTRY COST INDEX JUNE 2013 June 2013 Kissell Research Group, LLC 1010 Northern Blvd., Suite 208 Great Neck, NY 11021 www.kissellresearch.com Kissell Research Group Country Cost Index - June 2013 2 Executive
Estimating the Level and Distribution of Global Household Wealth
 Western University Scholarship@Western Economic Policy Research Institute. EPRI Working Papers Economics Working Papers Archive 2007 2007-5 Estimating the Level and Distribution of Global Household Wealth
Does One Law Fit All? Cross-Country Evidence on Okun s Law
 Does One Law Fit All? Cross-Country Evidence on Okun s Law Laurence Ball Johns Hopkins University Global Labor Markets Workshop Paris, September 1-2, 2016 1 What the paper does and why Provides estimates
New in 2013: Greater emphasis on capital flows Refinements to EBA methodology Individual country assessments
 As in 212: Stock-take: multilaterally consistent assessment of external sector policies of the largest economies Feeds into Article IVs Draws on External Balance Assessment (EBA) methodology/other Identifies
Methodology Calculating the insurance gap
 Methodology Calculating the insurance gap Insurance penetration Methodology 3 Insurance Insurance Penetration Rank Rank Rank penetration penetration difference 2018 2012 change 2018 report 2012 report
The Capital Requirements (Country-by-Country Reporting) Regulations December 2017
 Regulations December 2017") HSBC Holdings plc The Capital Requirements (Country-by-Country Reporting) Regulations 2013 31 December 2017 This report has been prepared for HSBC Holdings plc and its subsidiaries (the HSBC Group ) to
HSBC Holdings plc The Capital Requirements (Country-by-Country Reporting) Regulations 2013 31 December 2017 This report has been prepared for HSBC Holdings plc and its subsidiaries (the HSBC Group ) to
The Johns Hopkins Center for Civil Society Studies UN NONPROFIT HANDBOOK PROJECT. Lester M. Salamon
 UN NONPROFIT HANDBOOK PROJECT Lester M. Salamon The Johns Hopkins Comparative Nonprofit Sector Project THE GLOBAL ASSOCIATIONAL REVOLUTION Forprofit Sector Civil Society Sector Government Sector TREATMENT
Global Select International Select International Select Hedged Emerging Market Select
 International Exchange Traded Fund (ETF) Managed Strategies ETFs provide investors a liquid, transparent, and low-cost avenue to equities around the world. Our research has shown that individual country
FOREIGN ACTIVITY REPORT
 FOREIGN ACTIVITY REPORT SECOND QUARTER 2012 TABLE OF CONTENTS Table of Contents... i All Securities Transactions... 2 Highlights... 2 U.S. Transactions in Foreign Securities... 2 Foreign Transactions in
International Statistical Release
 International Statistical Release This release and additional tables of international statistics are available on efama s website (www.efama.org). Worldwide Investment Fund Assets and Flows Trends in the
2017 Fourth Quarter Data Book
 2017 Fourth Quarter Data Book TABLE OF CONTENTS PAGE STOCK AND EQUITY RELATED INFORMATION --------------------------------------------------- 3 SUMMARY OF SALES AND INCOME-----------------------------------------------------------------
International Statistical Release
 International Statistical Release This release and additional tables of international statistics are available on efama s website (www.efama.org) Worldwide Investment Fund Assets and Flows Trends in the
2017 Fourth Quarter Data Book
 2017 Fourth Quarter Data Book 14 February 3M 2018. All Rights Reserved. 1 TABLE OF CONTENTS PAGE STOCK AND EQUITY RELATED INFORMATION ------------------------------------------------------- 3 SUMMARY OF
International Statistical Release
 International Statistical Release This release and additional tables of international statistics are available on efama s website (www.efama.org). Worldwide Regulated Open-ended Fund Assets and Flows Trends
Global Consumer Confidence
 Global Consumer Confidence The Conference Board Global Consumer Confidence Survey is conducted in collaboration with Nielsen 4TH QUARTER 2017 RESULTS CONTENTS Global Highlights Asia-Pacific Africa and
Summary of key findings
 1 VAT/GST treatment of cross-border services: 2017 survey Supplies of e-services to consumers (B2C) (see footnote 1) Supplies of e-services to businesses (B2B) 1(a). Is a non-resident 1(b). If there is
Appendix. Table S1: Construct Validity Tests for StateHist
 Appendix Table S1: Construct Validity Tests for StateHist (5) (6) Roads Water Hospitals Doctors Mort5 LifeExp GDP/cap 60 4.24 6.72** 0.53* 0.67** 24.37** 6.97** (2.73) (1.59) (0.22) (0.09) (4.72) (0.85)
10 GREAT MYTHS OF GLOBAL CIVIL SOCIETY
 10 GREAT MYTHS OF GLOBAL CIVIL SOCIETY Lester M. Salamon Johns Hopkins University Japan Commerce Association of Washington October 21, 2013 THE GLOBAL ASSOCIATIONAL REVOLUTION FOR-PROFIT SECTOR CIVIL SOCIETY
World s Best Investment Bank Awards 2018
 Global Finance will publish its selections for the 19th Annual World s Best Investment Banks in the April 2018 issue. Winners will be honored at an awards ceremony in New York City in March, and all award
Developing Housing Finance Systems
 Developing Housing Finance Systems Veronica Cacdac Warnock IIMB-IMF Conference on Housing Markets, Financial Stability and Growth December 11, 2014 Based on Warnock V and Warnock F (2012). Developing Housing
STOXX EMERGING MARKETS INDICES. UNDERSTANDA RULES-BA EMERGING MARK TRANSPARENT SIMPLE
 STOXX Limited STOXX EMERGING MARKETS INDICES. EMERGING MARK RULES-BA TRANSPARENT UNDERSTANDA SIMPLE MARKET CLASSIF INTRODUCTION. Many investors are seeking to embrace emerging market investments, because
IOOF. International Equities Portfolio NZD. Quarterly update
 IOOF NZD Quarterly update For the period ended 30 September 2018 Contents Overview 2 Portfolio at glance 3 Performance 4 Asset allocation 6 Overview At IOOF, we have been helping Australians secure their
H S B C H O L D I N G S P L C HSBC HOLDINGS PLC THE CAPITAL REQUIREMENTS. (Country-by-Country Reporting) REGULATION 2013
 REGULATION 2013") HSBC HOLDINGS PLC THE CAPITAL REQUIREMENTS (Country-by-Country Reporting) REGULATION 2013 31 December 2015 This report has been prepared for HSBC Holdings plc and its subsidiaries (the HSBC Group ) to
HSBC HOLDINGS PLC THE CAPITAL REQUIREMENTS (Country-by-Country Reporting) REGULATION 2013 31 December 2015 This report has been prepared for HSBC Holdings plc and its subsidiaries (the HSBC Group ) to
October Research Institute. Thought leadership from Credit Suisse Research and the world s foremost experts
 October 2015 Research Institute Thought leadership from Credit Suisse Research and the world s foremost experts Global Wealth Report 2015 Introduction Now in its sixth edition, the Credit Suisse Global
Global Economic Indictors: CRB Raw Industrials & Global Economy
 Global Economic Indictors: & Global Economy December 14, 2017 Dr. Edward Yardeni 516-972-7683 eyardeni@ Mali Quintana 480-664-1333 aquintana@ Please visit our sites at www. blog. thinking outside the box
The Bank of America Merrill Lynch Global Bond Index Rules. PIMCO Global Advantage Government Bond Index Fine Specifications
 PIMCO Global Advantage Government Bond Index Fine Specifications July 2017 1 Index Overview The PIMCO Global Advantage Government Bond Index history starts on December 31, 2003. The index has a level of
October Research Institute. Thought leadership from Credit Suisse Research and the world s foremost experts. Global Wealth Databook
 Research Institute Thought leadership from Credit Suisse Research and the world s foremost experts Global Wealth Databook Preface Credit Suisse Research Institute is proud to launch the Credit Suisse Global
KPMG s Individual Income Tax and Social Security Rate Survey 2009 TAX
 KPMG s Individual Income Tax and Social Security Rate Survey 2009 TAX B KPMG s Individual Income Tax and Social Security Rate Survey 2009 KPMG s Individual Income Tax and Social Security Rate Survey 2009
WISDOMTREE RULES-BASED METHODOLOGY
 WISDOMTREE RULES-BASED METHODOLOGY WISDOMTREE GLOBAL DIVIDEND INDEXES Last Updated March 2018 Page 1 of 12 WISDOMTREE RULES-BASED METHODOLOGY 1. Overview and Description of Methodology Guide for Global
Key Issues in the Design of Capital Gains Tax Regimes: Taxing Non- Residents. 18 July 2014
 Key Issues in the Design of Capital Gains Tax Regimes: Taxing Non- Residents 18 July 2014 How do we tax non-residents on capital income? Domestic design issues Tax treaty issues Interrelationship between
Economic Stimulus Packages and Steel: A Summary
 Economic Stimulus Packages and Steel: A Summary Steel Committee Meeting 8-9 June 2009 Sources of information on stimulus packages Questionnaire to Steel Committee members, full participants and observers
Emerging market equities
 November 22, 2010 Emerging market equities Jean-Pierre Talon, FSA, FICA Introduction Focus of this presentation is to set out the rationale for a strategic bias toward emerging market equities Consider
Argentina Bahamas Barbados Bermuda Bolivia Brazil British Virgin Islands Canada Cayman Islands Chile
 Americas Argentina (Banking and finance; Capital markets: Debt; Capital markets: Equity; M&A; Project Bahamas (Financial and corporate) Barbados (Financial and corporate) Bermuda (Financial and corporate)
Best Treasury & Cash Management Providers 2017
 Page 1 of 5 In March 2017, Global Finance will publish its selections for the Seventeenth Annual World s Best Treasury & Cash Management Providers. Global Finance will select the best overall global cash
Travel Insurance and Assistance in the Asia-Pacific Region
 Travel Insurance and Assistance in the Asia-Pacific Region Report Prospectus October 2013 Web: www.finaccord.com. E-mail: info@finaccord.com 1 Prospectus contents Page What is the research? What methodology
Fiscal Policy and the Global Crisis
 Fiscal Policy and the Global Crisis Presentation at Koҫ University, Istanbul Carlo Cottarelli Director IMF Fiscal Affairs Department June 9, 2009 1 Two fiscal questions What is the appropriate fiscal policy
Public Pension Spending Trends and Outlook in Emerging Europe. Benedict Clements Fiscal Affairs Department International Monetary Fund March 2013
 Public Pension Spending Trends and Outlook in Emerging Europe Benedict Clements Fiscal Affairs Department International Monetary Fund March 13 Plan of Presentation I. Trends and drivers of public pension
Chart Collection for Morning Briefing
 Chart Collection for Morning Briefing February 12, 219 Dr. Edward Yardeni 516-972-7683 eyardeni@ Mali Quintana 48-664-1333 aquintana@ Please visit our sites at blog. thinking outside the box 25 Figure
Summit Strategies Group
 As of December 3, 203 US Equity: All Cap Russell 3000 Index 2.64 0.0 33.55 33.55 6.24 8.7 6.50 7.88 7.09 Dow Jones US Total Stock Market Index 2.63 0. 33.47 33.47 6.23 8.86 6.68 8.0 6.90 US Equity: Large
NORTH AMERICAN UPDATE
 NORTH AMERICAN UPDATE December 6 th, 2018 INNOVATION INSIGHT GROWTH SINCE 1968 TOUGH YEAR FOR RETURNS AROUND THE WORLD Index Year-to-date Performance MSCI World -1.2% MSCI USA 3.9% MSCI Canada -3.9% MSCI
Invesco Indexing Investable Universe Methodology October 2017
 Invesco Indexing Investable Universe Methodology October 2017 1 Invesco Indexing Investable Universe Methodology Table of Contents Introduction 3 General Approach 3 Country Selection 4 Region Classification
All-Country Equity Allocator July 2018
 Leila Heckman, Ph.D. lheckman@dcmadvisors.com 917-386-6261 John Mullin, Ph.D. jmullin@dcmadvisors.com 917-386-6262 Allison Hay ahay@dcmadvisors.com 917-386-6264 All-Country Equity Allocator July 2018 A
DOMESTIC CUSTODY & TRADING SERVICES
 Pricing Structure DOMESTIC CUSTODY & TRADING SERVICES A flat custody fee of 20bps per account type per year is applicable to all holdings and cash, the custody fee is collected each month but will be capped
October Research Institute. Thought leadership from Credit Suisse Research and the world s foremost experts
 October 2012 Research Institute Thought leadership from Credit Suisse Research and the world s foremost experts Global Wealth Report 2012 GLOBAL WEALTH REPORT 2012_2 Contents 03 Introduction 04 Global
Total Imports by Volume (Gallons per Country)
") 5/4/2016 Imports by Volume (Gallons per Country) YTD YTD Country 03/2015 03/2016 % Change 2015 2016 % Change MEXICO 53,821,885 60,813,992 13.0 % 143,313,133 167,568,280 16.9 % NETHERLANDS 11,031,990 12,362,256
5/4/2016 Imports by Volume (Gallons per Country) YTD YTD Country 03/2015 03/2016 % Change 2015 2016 % Change MEXICO 53,821,885 60,813,992 13.0 % 143,313,133 167,568,280 16.9 % NETHERLANDS 11,031,990 12,362,256
Current Issues in International Tax Policy
 Current Issues in International Tax Policy Shigeto HIKI Director, International Tax Policy Division, Tax Bureau, Ministry of Finance, Japan The Fourth IMF-Japan High-Level Tax Conference For Asian Countries
!!!1!!!!!!!!!!!!!!!!!!!!!!!!!!!!! The Association of Real Estate Funds & Property Funds Research
 1 The Association of Real Estate Funds & Property Funds Research Global Real Estate Funds Review H1 216 Contents CONTENTS 2 EXECUTIVE SUMMARY 3 UNLISTED FUND UNIVERSE: OVERVIEW (EX FOF) 6 UNLISTED FUNDS
Total Imports by Volume (Gallons per Country)
") 3/7/2018 Imports by Volume (Gallons per Country) YTD YTD Country 01/2017 01/2018 % Change 2017 2018 % Change MEXICO 54,235,419 58,937,856 8.7 % 54,235,419 58,937,856 8.7 % NETHERLANDS 12,265,935 10,356,183
3/7/2018 Imports by Volume (Gallons per Country) YTD YTD Country 01/2017 01/2018 % Change 2017 2018 % Change MEXICO 54,235,419 58,937,856 8.7 % 54,235,419 58,937,856 8.7 % NETHERLANDS 12,265,935 10,356,183
Summit Strategies Group
 April 0, 205 US Equity: All Cap Russell 000 Index 0.45 5.9 2.26 2.74 6.86 4. 8.68 8.66 Dow Jones US Total Stock Market Index 0.46 5.9 2.27 2.67 6.78 4.7 8.78 8.8 US Equity: Large Cap Russell 000 Index
IT ONLY TAKES ONE INDEX TO CAPTURE THE WORLD THE MODERN INDEX STRATEGY. msci.com
 IT ONLY TAKES ONE INDEX TO CAPTURE THE WORLD THE MODERN INDEX STRATEGY msci.com MSCI DELIVERS THE MODERN INDEX STRATEGY The MSCI ACWI Index, MSCI s flagship global equity benchmark, is designed to represent
Linking Education for Eurostat- OECD Countries to Other ICP Regions
 International Comparison Program [05.01] Linking Education for Eurostat- OECD Countries to Other ICP Regions Francette Koechlin and Paulus Konijn 8 th Technical Advisory Group Meeting May 20-21, 2013 Washington
All-Country Equity Allocator February 2018
 Leila Heckman, Ph.D. lheckman@dcmadvisors.com 917-386-6261 John Mullin, Ph.D. jmullin@dcmadvisors.com 917-386-6262 Charles Waters cwaters@dcmadvisors.com 917-386-6264 All-Country Equity Allocator February
Globalization, Inequality, and Tax Justice
 Globalization, Inequality, and Tax Justice Gabriel Zucman (UC Berkeley) November 2017 How can we make globalization and tax justice compatible? One of the most pressing policy questions of our time: Globalization
Social Security Benefits Around the World,
 Social Security Benefits Around the World, 197-2 Prepared by The Population Reference Bureau for the NIA P-3 Coordinating Center at the Michigan Center on the Demography of Aging, University of Michigan
October Research Institute. Global Wealth Report Thought leadership from Credit Suisse Research and the world s foremost experts
 October 218 Research Institute Global Wealth Report 218 Thought leadership from Credit Suisse Research and the world s foremost experts Introduction The Credit Suisse Global Wealth Report is the most extensive
Summit Strategies Group
 May, 208 US Equity: All Cap Russell 000 Index 2.82.4 2.55 5.06 0.72 2.85 2.6 9.2 Dow Jones US Total Stock Market Index 2.8.5 2.57 5.09 0.68 2.78 2.58 9.27 US Equity: Large Cap Russell 000 Index 2.55 0.57
Summit Strategies Group
 June 0, 208 US Equity: All Cap Russell 000 Index 0.65.89.22 4.78.58.29.0 0.2 Dow Jones US Total Stock Market Index 0.66.87.25 4.79.56.22 2.98 0.28 US Equity: Large Cap Russell 000 Index 0.65.57 2.85 4.54.64.7.2
Summit Strategies Group
 August, 208 US Equity: All Cap Russell 000 Index.5 7.65 0.9 20.25 5.86 4.25 5.50 0.89 Dow Jones US Total Stock Market Index.48 7.64 0.4 20.26 5.82 4.2 5.45 0.94 US Equity: Large Cap Russell 000 Index.45
Summit Strategies Group
 October, 208 US Equity: All Cap Russell 000 Index -7.6 -.95 2.4 6.60.27 0.8.8.5 Dow Jones US Total Stock Market Index -7.4-4.04 2.9 6.56.24 0.76.75.6 US Equity: Large Cap Russell 000 Index -7.08 -.5 2.67
Corporate Governance and Investment Performance: An International Comparison. B. Burçin Yurtoglu University of Vienna Department of Economics
 Corporate Governance and Investment Performance: An International Comparison B. Burçin Yurtoglu University of Vienna Department of Economics 1 Joint Research with Klaus Gugler and Dennis Mueller http://homepage.univie.ac.at/besim.yurtoglu/unece/unece.htm
1.1. STOXX TOTAL MARKET INDICES
 STOXX INDEX LIST A-Z 1. TOTAL MARKET INDICES 1/14 1.1. STOXX TOTAL MARKET INDICES Regional indices STOXX BRIC TMI STOXX Developed and Emerging Markets TMI STOXX Developed Markets TMI STOXX Emerging Markets
PIMCO Global Advantage Government Bond Index. Index Specification
 PIMCO Global Advantage Government Bond Index January 2011 Contents 1 Index Overview... 3 2 Country Classification and Eligibility Rules... 5 2.1 Regional Classification... 5 2.2 Instrument Categories...
Double Tax Treaties. Necessity of Declaration on Tax Beneficial Ownership In case of capital gains tax. DTA Country Withholding Tax Rates (%)
") Double Tax Treaties DTA Country Withholding Tax Rates (%) Albania 0 0 5/10 1 No No No Armenia 5/10 9 0 5/10 1 Yes 2 No Yes Australia 10 0 15 No No No Austria 0 0 10 No No No Azerbaijan 8 0 8 Yes No Yes
Double Tax Treaties DTA Country Withholding Tax Rates (%) Albania 0 0 5/10 1 No No No Armenia 5/10 9 0 5/10 1 Yes 2 No Yes Australia 10 0 15 No No No Austria 0 0 10 No No No Azerbaijan 8 0 8 Yes No Yes
Performance Derby: MSCI Regions & Countries STRG, STEG, & LTEG
 Performance Derby: MSCI Regions & Countries STRG, STEG, & LTEG February 7, 2018 Dr. Ed Yardeni 516-972-7683 eyardeni@yardeni.com Joe Abbott 732-497-5306 jabbott@yardeni.com Please visit our sites at blog.yardeni.com
Market Briefing: Global Markets
 Market Briefing: Global Markets July 6, 218 Dr. Edward Yardeni 516-972-7683 eyardeni@ Mali Quintana 48-664-1333 aquintana@ Please visit our sites at blog. thinking outside the box Table Of Contents Table
Quarterly Investment Update
 Quarterly Investment Update Second Quarter 2017 Dimensional Fund Advisors Canada ULC ( DFA Canada ) is not affiliated with The CM Group DFA Canada is a separate and distinct company Market Update: A Quarter
2018 Global Survey of Accounting Assumptions. for Defined Benefit Plans. Executive summary
 2018 Global Survey of Accounting Assumptions for Defined Benefit Plans Executive summary Executive summary In broad terms, accounting standards aim to enable employers to approximate the cost of an employee
2018 CAPITAL GAINS DISTRIBUTION ESTIMATES
 2018 CAPITAL GAINS DISTRIBUTION ESTIMATES Estimated amounts of upcoming capital gain distributions are shown below. Estimated distributions can change prior to the record date depending on current market
IMPORTANT TAX INFORMATION
 00126803 IMPORTANT TAX INFORMATION Dear Hartford Funds Shareholder: The following information about your enclosed 1099-DIV from Hartford Funds should be used when preparing your 2014 tax return. The information
Travel Insurance and Assistance
 Travel Insurance and Assistance Worldwide research covering over 40 countries Series Prospectus Finaccord Web: www.finaccord.com. E-mail: info@finaccord.com 1 Prospectus contents Page What is the research?
US Economic Indicators: Import Prices, PPI, & CPI
 US Economic Indicators: Import Prices, PPI, & CPI December 1, 17 Dr. Edward Yardeni 51-97-73 eyardeni@ Debbie Johnson --1333 djohnson@ Please visit our sites at blog. thinking outside the box Table Of
International Travel & Tourism Study (Published March 2005)
") International Travel & Tourism Study (Published March 2005) Roy Morgan International conducts surveys in the US,, Australia, New Zealand and Indonesia on a continuous basis. Respondents are asked about
International Travel & Tourism Study (Published March 2005) Roy Morgan International conducts surveys in the US,, Australia, New Zealand and Indonesia on a continuous basis. Respondents are asked about
Economics Program Working Paper Series
 Economics Program Working Paper Series Projecting Economic Growth with Growth Accounting Techniques: The Conference Board Global Economic Outlook 2012 Sources and Methods Vivian Chen Ben Cheng Gad Levanon
1.1. STOXX TOTAL MARKET INDICES
 1. BROAD TOTAL MARKET INDICES/BENCHMARK INDICES, EQUAL WEIGHT INDICES 1/15 1.1. STOXX TOTAL MARKET INDICES Regional indices STOXX BRIC TMI STOXX Developed and Emerging Markets TMI STOXX Developed Markets
Summit Strategies Group
 US Equity: All Cap Russell 000 Index -.69 2.40.9 6.22 0.59 4.7 2.79 9.78 Dow Jones US Total Stock Market Index -.70 2.4.4 6.2 0.55 4.2 2.76 9.8 US Equity: Large Cap Russell 000 Index -.67 2.75.62 6.70
Summit Strategies Group
 US Equity: All Cap Russell 000 Index.72 7.7 5.67 26.29 9.92.85.87 7.64 Dow Jones US Total Stock Market Index - - - - - - - - US Equity: Large Cap Russell 000 Index.87 7.95 5.96 25.5 0.9.94.9 7.69 Russell