An Intelligent Consumer s Guide to Poverty Measurement
|
|
|
- Gregory Page
- 5 years ago
- Views:
Transcription


1 IRP Webinar: An Intelligent Consumer s Guide to Poverty Measurement Timothy Smeeding University of Wisconsin Madison Kathleen Short U.S. Census Bureau May 14, 2014 Research Training Policy Practice

2 Disclaimers The opinions and research expressed in this presentation are solely the responsibility of the presenters and not necessarily those of the Institute for Research on Poverty, its funders, or of the University of Wisconsin. Additionally, the views expressed in this research, including those related to statistical, methodological, technical, or operational issues, are solely those of the authors and do not necessarily reflect the official positions or policies of the Census Bureau, or the views of other staff members. The author accepts responsibility for all errors. This presentation is released to inform interested parties of ongoing research and to encourage discussion of work in progress. The presentation reports the results of research and analysis undertaken by Census Bureau staff. It has undergone more limited review than official publications. 2
3 Objectives of the Webinar Introduction to the issues involved in poverty measurement (Tim Smeeding) The measures used by the federal government, officially, and for research (Kathleen Short) A state and a policy perspective, via the Wisconsin Poverty Report (Tim Smeeding) Question and Answer 3
4 To Begin... Poverty is a social indicator, a status at a point in time, where we define who is poor? Why people are poor is more difficult and challenging, as are the mechanisms that cause poverty Poverty measurement is an inexact science but it always involves comparison of economic needs to resources A few concepts of poverty measurement provide a good overview 4

5 Some Poverty Measure Concepts In this webinar we will focus on the shaded boxes. 5

6 The Poverty Measures We Present Here Quantitative Income-based measures of resources Relative, absolute, and anchored measures of need, each appropriate to the income resource definition Measures rely primarily on two national datasets: the CPS and ACS International comparisons are not included 6

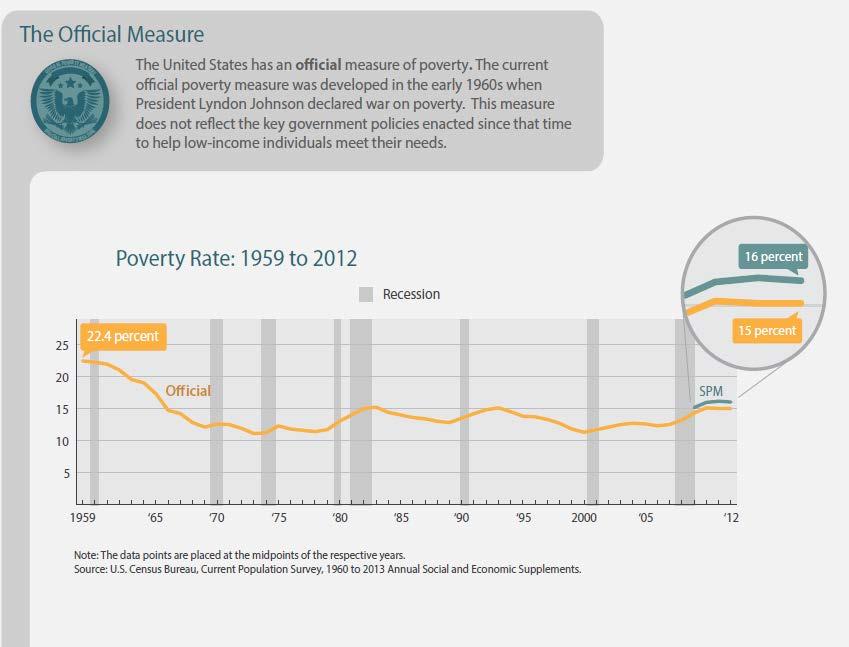
7 Official Poverty Statistics Current Population Survey CPS ASEC The 2012 official poverty rate for the nation was 15.0 percent There were 46.5 million people in poverty. 7
8 8
9 Supplemental Poverty Measure (SPM) Observations from the Interagency Technical Working Group (ITWG) - March 2, 2010 Will not replace the official poverty measure Will not be used for resource allocation or program eligibility Census Bureau and BLS responsible for improving and updating the measure Continued research and improvement Based on National Academy of Sciences expert panel recommendations in Measuring Poverty: A New Approach (Citro and Michael,1995) 9
 Changes in family or household structure Higher standards and levels of living since 1965 Geographic price differences among regions Recommended Changes")
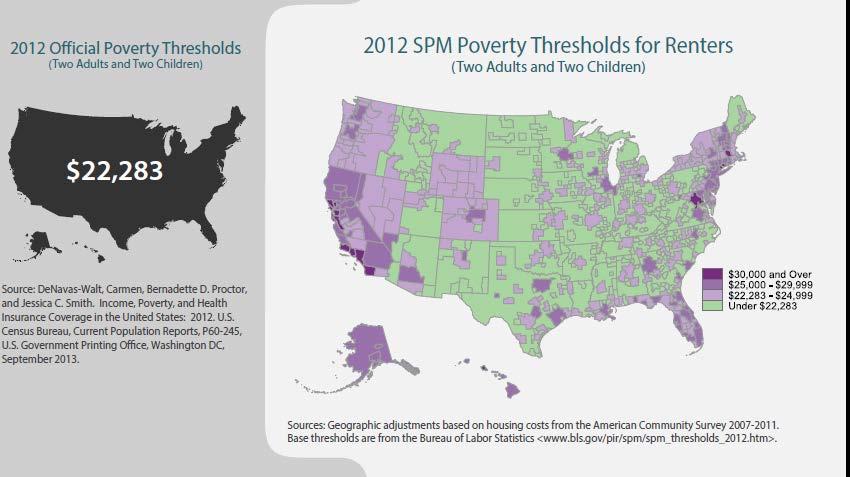
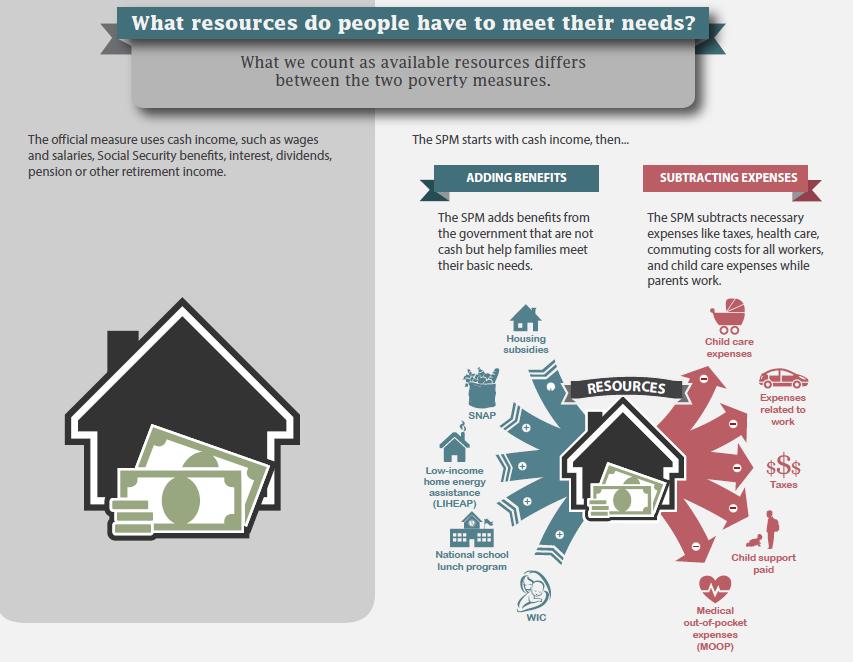
10 National Academy of Sciences Panel on Poverty and Family Assistance May 1995 report, Measuring Poverty: A New Approach The official measure does not account for Provision of in-kind benefits Necessary expenses (taxes, health care, work) Changes in family or household structure Higher standards and levels of living since 1965 Geographic price differences among regions Recommended Changes to Improve the Measure of Poverty in the U.S. 10
11 11
12 12

13 13
14 14
15 Official and SPM Thresholds: 2011 and 2012 $30,000 $25,000 Official SPM Axis Title $20,000 $15,000 $10,000 $5,000 $- Official Owners with a Mortgage Owners without a mortgage Renters 2011 $22,811 $25,703 $21,175 $25, $23,283 $25,784 $21,400 $25,
16 16
17 200.0 Adding Up All Additions and Subtractions Not Included in the Official Measure Across All SPM Family Groups: Billion $ ,000.0 SNAP School lunch WIC Housing subsidy/cap LIHEAP Ref. tax credits +/- Taxes before credits FICA Work expenses Childcare MOOP B$ Child support paid 17
18 40.0 Adding up All Additions and Subtractions Not Included in the Official Measure Across SPM Units Classified as Official Poor: Billion $ SNAP School lunch WIC Housing subsidy/cap LIHEAP Ref. tax credits +/- Taxes before credits FICA Work expenses Childcare MOOP B$ Child support paid 18
19 25 Official vs. SPM Poverty Rates: Official** SPM 5 0 Total Population Children Nonelderly Adults
20 20
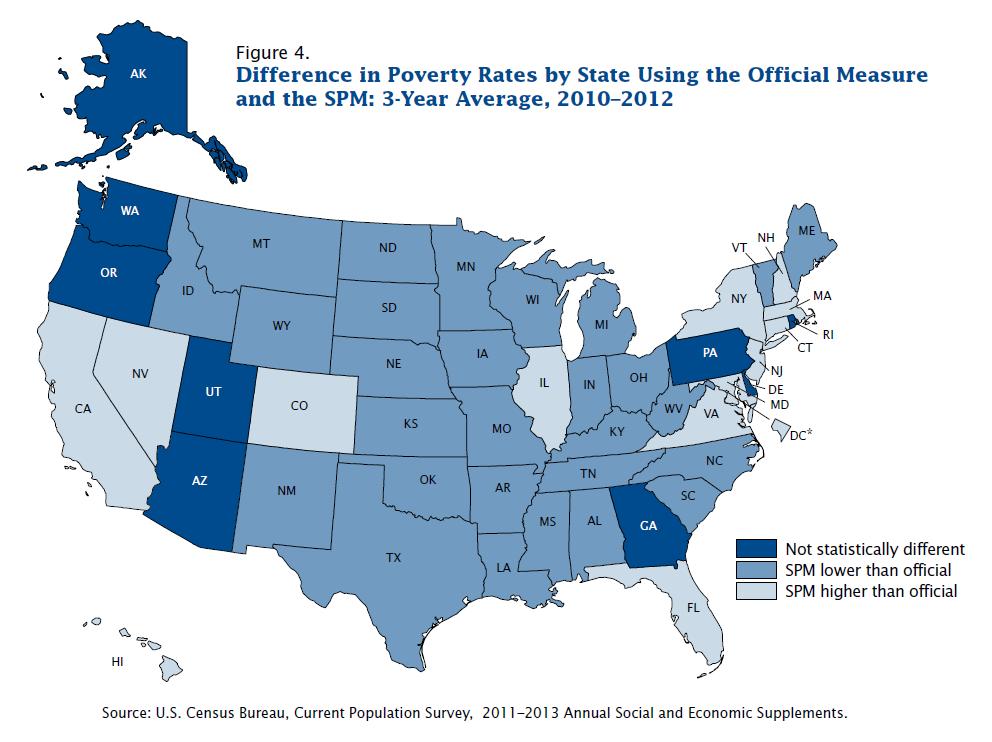
21 Poverty Rates For most groups, SPM rates are higher than official poverty rates. The SPM shows lower poverty rates for Children Individuals included in new SPM resource units Blacks Individuals living outside metropolitan areas Individuals living in the Midwest Individuals covered by only public health insurance Individuals with a disability Official and SPM poverty rates for people in female householder units, native born citizens, renters, and residents of the South were not statistically different 21
22 Effect of Including Individual Elements on Number of SPM Poor:
23 Third poverty measure Relative income poverty measure OECD Unit of analysis = household Equivalence scale = square root of household size Disposable income = Y t Threshold = 50% of median household disposable income o $31,060 for

24 Absolute Poverty vs. Income Growth 24
25 25.0 Poverty rates: OECD Social Indicators
26 25.0 Poverty rates using three measures: Total and by age group: Percent Poor Official* Research SPM Relative Poverty All People Under 18 years 18 to 64 years 65 years and older 26
27 Distribution of people by Resources to Poverty Thresholds Ratio % 90% % % 60% or more 2.0 to to % to to % less than % 20% % % Official* SPM Relative 27
28 Distribution of Children by Resources to Poverty Thresholds Ratio % 90% 80% % or more 60% to to % 40% to to 0.99 less than % % 10% 0% Official* SPM Relative 28
29 Poverty Rates using the Official Measure, the SPM and Relative Income Measure: 2009 to Official SPM Relative Source: Current Population Survey, 2010 to 2013 Annual Social and Economic Supplements. 29
30 30
31 How Programs to Help Poor in the U.S. (and Wisconsin) Have Changed Annual Expenditures, Means-Tested Programs (Billions of 2010 Dollars) 31
32 Continued Research on SPM The Interagency Technical Working Group laid out a research agenda for many of the elements of this new measure. As with any statistic regularly published by a Federal statistical agency, the Working Group expects that changes in this measure over time will be decided upon in a process led by research methodologists and statisticians within the Census Bureau in consultation with BLS and with other appropriate data agencies and outside experts, and will be based on solid analytical evidence. 32
33 SPM research Improving data collection that include better measures of retirement income in CPS ASEC Working papers on geographic adjustments, work expenses, MOOP Continue looking at other surveys SIPP - SPM and retirement income, wealth, and material hardship American Community Survey SPM for smaller geographic areas e.g. Wisconsin 33
34 34

35 35


36 Wisconsin Poverty Report Timothy M. Smeeding Julia B. Isaacs Katherine A. Thornton May 7, WISCAP
37 Three sets of poverty rates to assess tax and transfer policy impacts Market Income (MI) based poverty rates including only own earnings and private investment and retirement incomes The Official Measure (OM) poverty rates based only on cash income only The Wisconsin Poverty Measure (WPM) includes the effects of housing costs, child care costs, medical costs as well as taxes, refundable tax credits, and noncash benefits like SNAP and public housing 37

38 Wisconsin Poverty Rates under three measures,
39 What drove poverty rates down in WI? After earnings increases were recorded, four major policy levers affected WI poverty: 1. Refundable tax credits like the EITC (federal and state) and child tax credits 2. Noncash benefits like SNAP, public housing, LIHEAP 3. Work related expenses like child care, affected by CARES, and commuting costs 4. Out of pocket health care costs, affected by BadgerCare 39
40 Effects of Taxes, Public Benefits, and Expenses on Overall Poverty in Wisconsin,

41 A Consumer s Guide...to learn more 41
42 IRP Resources for Questions on Poverty Measurement IRP FF 14 a consumer s guide: /FF pdf IRP Poverty Measurement home page: The 2014 Wisconsin Poverty Report: pdfs/wi-povertyreport2014.pdf 42

43 Thanks and Q &A Please submit questions using the callout icon at the bottom of your screens. 43
The Council of State Governments
 The Council of State Governments Capitol Ideas Webinar Series: Alternative Poverty Measures www.csg.org CSG Webinar: Alternative Poverty Measures Presenters Elise Gould Economic Policy Institute Timothy
Using the American Community Survey (ACS) to Implement a Supplemental Poverty Measure (SPM) 1
 to Implement a Supplemental Poverty Measure (SPM) 1") Using the American Community Survey (ACS) to Implement a Supplemental Poverty Measure (SPM) 1 Trudi Renwick, Kathleen Short, Ale Bishaw and Charles Hokayem Social, Economic and Housing Statistics Division
Using the American Community Survey (ACS) to Implement a Supplemental Poverty Measure (SPM) 1 Trudi Renwick, Kathleen Short, Ale Bishaw and Charles Hokayem Social, Economic and Housing Statistics Division
Estimating the Supplemental Poverty Measure from the 2014 Panel of the Survey of Income and Program Participation
 Estimating the Supplemental Poverty Measure from the 2014 Panel of the Survey of Income and Program Participation FCSM March 7, 2018 Lewis Warren Liana Fox Ashley Edwards U.S. Census Bureau U.S. Census
The Supplemental Poverty Measure: 2013
 The Supplemental Poverty Measure: 2013 Current Population Reports By Kathleen Short Issued October 2014 P60-251 INTRODUCTION This is the fourth report describing the Supplemental Poverty Measure (SPM)
Measuring Suburban Poverty: Concepts and Data Sources Hofstra University September 26, 2013
 Measuring Suburban Poverty: Concepts and Data Sources Hofstra University September 26, 2013 Trudi Renwick Poverty Statistics Branch Social, Economic and Housing Statistics Division U.S. Bureau of the Census
Observations from the Interagency Technical Working Group on Developing a Supplemental Poverty Measure
 March 2010 Observations from the Interagency Technical Working Group on Developing a Supplemental Poverty Measure I. Developing a Supplemental Poverty Measure Since the official U.S. poverty measure was
Conceptualizing and Measuring Poverty. Julia B. Isaacs Urban Institute Senior Fellow and IRP Research Affiliate June 12, 2018
 Conceptualizing and Measuring Poverty Julia B. Isaacs Urban Institute Senior Fellow and IRP Research Affiliate June 12, 2018 What is poverty? How do we measure it? Three general approaches Absolute Relative
How the Census Bureau Measures Poverty With Selected Sources of Poverty Data
 How the Census Bureau Measures Poverty With Selected Sources of Poverty Data Alemayehu Bishaw Poverty Statistics Branch Social, Economic and Housing Statistics Division U. S. Census Bureau November 15-16,
Poverty and Labor Force Statistics in the United States
 Poverty and Labor Force Statistics in the United States Marcella S. Jones-Puthoff Statistician, Age and Special Populations Branch Population Division U. S. Census Bureau Presentation for the Global Forum
Wisconsin Poverty Report: Methodology and Results for 2009
 Wisconsin Poverty Report: Methodology and Results for 2009 Julia B. Isaacs, Joanna Y. Marks, Timothy M. Smeeding, and Katherine A. Thornton Institute for Research on Poverty University of Wisconsin Madison
An Overview of the New Supplemental Poverty Measure
 An Overview of the New Supplemental Poverty Measure David Johnson U.S. Census Bureau Brookings Institution May 6, 2010 The Patronus and Poverty Measurement 2 What is Poverty? Adam Smith and Poverty The
Wisconsin Poverty Report: New Measure, Broader View
 Wisconsin Poverty Report: New Measure, Broader View Joanna Marks, Julia Isaacs, and Timothy Smeeding Institute for Research on Poverty University of Wisconsin Madison September 2010 ACKNOWLEDGMENTS The
Program on Retirement Policy Number 1, February 2011
 URBAN INSTITUTE Retirement Security Data Brief Program on Retirement Policy Number 1, February 2011 Poverty among Older Americans, 2009 Philip Issa and Sheila R. Zedlewski About one in three Americans
Poverty in the United States in 2014: In Brief
 Joseph Dalaker Analyst in Social Policy September 30, 2015 Congressional Research Service 7-5700 www.crs.gov R44211 Contents Introduction... 1 How the Official Poverty Measure is Computed... 1 Historical
STATE OF NEW JERSEY. SENATE RESOLUTION No th LEGISLATURE. Sponsored by: Senator SHIRLEY K. TURNER District 15 (Hunterdon and Mercer)
") SENATE RESOLUTION No. STATE OF NEW JERSEY th LEGISLATURE INTRODUCED FEBRUARY, 0 Sponsored by: Senator SHIRLEY K. TURNER District (Hunterdon and Mercer) SYNOPSIS Urges federal government to revise official
SENATE RESOLUTION No. STATE OF NEW JERSEY th LEGISLATURE INTRODUCED FEBRUARY, 0 Sponsored by: Senator SHIRLEY K. TURNER District (Hunterdon and Mercer) SYNOPSIS Urges federal government to revise official
Understanding Poverty Measures Used to Assess Economic Well-Being in California
 calbudgetcenter.org Understanding Poverty Measures Used to Assess Economic Well-Being in California @alissa_brie @skimberca @CalBudgetCenter ALISSA ANDERSON, SENIOR POLICY ANALYST SARA KIMBERLIN, SENIOR
Wisconsin Poverty Report: Methodology and Results for 2008
 Wisconsin Poverty Report: Methodology and Results for 2008 Julia Isaacs, Joanna Marks, Timothy Smeeding, and Katherine Thornton Institute for Research on Poverty University of Wisconsin Madison September
The Supplemental Poverty Measure: Its Core Concepts, Development, and Use
 The Supplemental Poverty Measure: Its Core Concepts, Development, and Use Joseph Dalaker Analyst in Social Policy November 28, 2017 Congressional Research Service 7-5700 www.crs.gov R45031 Summary The
Reducing Poverty in Wisconsin
 Reducing Poverty in Wisconsin David Riemer, Senior Fellow Conor Williams, Economic Policy Analyst Michael Bare, Research and Program Coordinator Community Advocates Public Policy Institute Poverty reduction
Child poverty in rural America
 IRP focus December 2018 Vol. 34, No. 3 Child poverty in rural America David W. Rothwell and Brian C. Thiede David W. Rothwell is Assistant Professor of Public Health at Oregon State University. Brian C.
Measuring the Cost of Employment: Work-Related Expenses in the Supplemental Poverty Measure. No. 279 SEHSD No
 THE SURVEY OF INCOME AND PROGRAM PARTICIPATION Measuring the Cost of Employment: Work-Related in the Supplemental Poverty Measure Revised November 13, 2017 No. 279 SEHSD No. 2017-43 Abinash Mohanty Ashley
[Chancellor] You re listening to a podcast from the Institute for Research on Poverty at the University of Wisconsin-Madison.
![[Chancellor] You re listening to a podcast from the Institute for Research on Poverty at the University of Wisconsin-Madison.](/thumbs/93/112065686.jpg "[Chancellor] You re listening to a podcast from the Institute for Research on Poverty at the University of Wisconsin-Madison.") Transcript for July 2013 podcast The Wisconsin Poverty Report and How We Think about Measuring Poverty Featuring Timothy Smeeding, director of the Institute for Research on Poverty. Hosted by David Chancellor.
Transcript for July 2013 podcast The Wisconsin Poverty Report and How We Think about Measuring Poverty Featuring Timothy Smeeding, director of the Institute for Research on Poverty. Hosted by David Chancellor.
Poverty and the Safety Net After the Great Recession
 Poverty and the Safety Net After the Great Recession Deep Issues of the 2012 Elections: Equality, Liberty and Democracy, Cornell University Hilary Hoynes University of California, Davis November 2012 In
Perspectives on Measuring Poverty in the US
 Perspectives on Measuring Poverty in the US Bob Haveman Teaching Poverty 101 May, 2015 Research Training Policy Practice What is Poverty? Defined: a state of economic or material hardship Poverty status
Impressionistic Realism: The Europeans Focus the U.S. on Measurement David S. Johnson10
 Impressionistic Realism: The Europeans Focus the U.S. on Measurement David S. Johnson10 In the art of communicating impressions lies the power of generalizing without losing that logical connection of
Rural Poverty Transitions: A New Look at Movements in and out of Poverty
 Rural Poverty Transitions: A New Look at Movements in and out of Poverty José D. Pacas Research Scientist, Minnesota Population Center, University of Minnesota Elizabeth E. Davis Professor, Department
The Supplemental Poverty Measure and MOOP
 The Supplemental Poverty Measure and MOOP Kathleen S. Short U.S. Census Bureau CNSTAT Panel: Measuring Medical Care Risk in Conjunction with the New Supplemental Income Poverty Measure September 8, 2011
Pathways Fall The Supplemental. Poverty. Measure. A New Tool for Understanding U.S. Poverty. By Rebecca M. Blank
 10 Pathways Fall 2011 The Supplemental Poverty Measure A New Tool for Understanding U.S. Poverty By Rebecca M. Blank 11 How many Americans are unable to meet their basic needs? How is that number changing
IRLE. Child Poverty, the Great Recession, and the Social Safety Net in the United States. IRLE WORKING PAPER # September 2016
 IRLE IRLE WORKING PAPER #116-16 September 2016 Child Poverty, the Great Recession, and the Social Safety Net in the United States Marianne Bitler, Hilary Hoynes, and Elira Kuka Cite as: Marianne Bitler,
Appendix G Defining Low-Income Populations
 Appendix G Defining Low-Income Populations 1.0 Introduction Executive Order 12898, Federal Actions to Address Environmental Justice in Minority Populations and Low-Income Populations, requires federal
Poverty and Income in 2008: A Look at the New Census Data and What the Numbers Mean. Brookings Workshop. David Johnson September 10, 2009
 Poverty and Income in 2008: A Look at the New Census Data and What the Numbers Mean Brookings Workshop David Johnson September 10, 2009 Ron and Belle, thanks for inviting me. I think Ron invited me this
Need-Tested Benefits: Estimated Eligibility and Benefit Receipt by Families and Individuals
 Need-Tested Benefits: Estimated Eligibility and Benefit Receipt by Families and Individuals Gene Falk Specialist in Social Policy Alison Mitchell Analyst in Health Care Financing Karen E. Lynch Specialist
ISSUE BRIEF. poverty threshold ($18,769) and deep poverty if their income falls below 50 percent of the poverty threshold ($9,385).
 and deep poverty if their income falls below 50 percent of the poverty threshold ($9,385).") ASPE ISSUE BRIEF FINANCIAL CONDITION AND HEALTH CARE BURDENS OF PEOPLE IN DEEP POVERTY 1 (July 16, 2015) Americans living at the bottom of the income distribution often struggle to meet their basic needs
ASPE ISSUE BRIEF FINANCIAL CONDITION AND HEALTH CARE BURDENS OF PEOPLE IN DEEP POVERTY 1 (July 16, 2015) Americans living at the bottom of the income distribution often struggle to meet their basic needs
Poverty Facts, million people or 12.6 percent of the U.S. population had family incomes below the federal poverty threshold in 2004.
 Poverty Facts, 2004 How Many People Are Poor? 36.6 million people or 12.6 percent of the U.S. population had family incomes below the federal poverty threshold in 2004. 1 How Much Money Do Families Need
Table 1 Annual Median Income of Households by Age, Selected Years 1995 to Median Income in 2008 Dollars 1
 Fact Sheet Income, Poverty, and Health Insurance Coverage of Older Americans, 2008 AARP Public Policy Institute Median household income and median family income in the United States declined significantly
IDENTIFYING THE POOR: POVERTY MEASUREMENT FOR THE U.S. FROM 1996 TO by Thesia I. Garner* and. Kathleen S. Short
 roiw_374 237..258 Review of Income and Wealth Series 56, Number 2, June 2010 IDENTIFYING THE POOR: POVERTY MEASUREMENT FOR THE U.S. FROM 1996 TO 2005 by Thesia I. Garner* Bureau of Labor Statistics and
In Baltimore City today, 20% of households live in poverty, but more than half of the
 Building Economic Opportunity in Baltimore: A Data Profile Baltimore Highlights In Baltimore City today, 20% of households live in poverty, but more than half of the city s population 55% is financially
POVERTY IN THE 50 STATES:
 POVERTY IN THE STATES: LONG-TERM TRENDS AND THE ROLE OF SOCIAL POLICIES AUTHORED BY: CENTER ON POVERTY & SOCIAL POLICY at Columbia University POVERTY IN THE STATES: LONG-TERM TRENDS AND THE ROLE OF SOCIAL
Health Status, Health Insurance, and Health Services Utilization: 2001
 Health Status, Health Insurance, and Health Services Utilization: 2001 Household Economic Studies Issued February 2006 P70-106 This report presents health service utilization rates by economic and demographic
Waging War on Poverty: Historical Trends in Poverty Using the Supplemental Poverty Measure
 Waging War on Poverty: Historical Trends in Poverty Using the Supplemental Poverty Measure Liana Fox Irv Garfinkel Neeraj Kaushal Jane Waldfogel Christopher Wimer October 18, 2013 Paper to be presented
Poverty in the United States in 2016: In Brief
 Joseph Dalaker Analyst in Social Policy October 25, 2017 Congressional Research Service 7-5700 www.crs.gov R44991 Contents Introduction... 1 How the Official Poverty Measure Is Computed... 2 Historical
Effective Anti-poverty Programs in the U.S
 Effective Anti-poverty Programs in the U.S Hilary Hoynes, University of California, Davis SIEPR Policy Forum on Reducing Global Poverty May 2008 1 Roadmap of talk Poverty: Definitions Poverty: Facts Government
PUBLIC BENEFITS: EASING POVERTY AND ENSURING MEDICAL COVERAGE By Arloc Sherman
 820 First Street NE, Suite 510 Washington, DC 20002 Tel: 202-408-1080 Fax: 202-408-1056 center@cbpp.org www.cbpp.org Revised August 17, 2005 PUBLIC BENEFITS: EASING POVERTY AND ENSURING MEDICAL COVERAGE
F R O M S A F E T Y N E T T O S O L I D G R O U N D RE S E ARCH RE P O R T. The Antipoverty Effects of the Supplemental Nutrition Assistance Program
 F R O M S A F E T Y N E T T O S O L I D G R O U N D RE S E ARCH RE P O R T The Antipoverty Effects of the Supplemental Nutrition Assistance Program Laura Wheaton February 2018 Victoria Tran AB O U T T
Multi-Dimensional Poverty in America: U.S. in Global Context
 Multi-Dimensional Poverty in America: U.S. in Global Context Anupama Jacob, PhD, SSRC Emerging Scholar Luke Shaefer, PhD, Discussant Kristin Anderson Moore, PhD, Moderator Emerging Scholars Webinar #16
The More Things Change, the More They Stay the Same: The Safety Net, Living Arrangements, and Poverty in the Great Recession
 PRELIMINARY AND INCOMPLETE The More Things Change, the More They Stay the Same: The Safety Net, Living Arrangements, and Poverty in the Great Recession Marianne Bitler Department of Economics, UC Irvine
Making Ends Meet: The Cost to Support a Family in California
 Making Ends Meet: The Cost to Support a Family in California SARA KIMBERLIN, SENIOR POLICY ANALYST POLICY INSIGHTS 2018 SACRAMENTO, MARCH 22, 2018 calbudgetcenter.org What Are Families Basic Expenses?
NBER WORKING PAPER SERIES THE MORE THINGS CHANGE, THE MORE THEY STAY THE SAME: THE SAFETY NET, LIVING ARRANGEMENTS, AND POVERTY IN THE GREAT RECESSION
 NBER WORKING PAPER SERIES THE MORE THINGS CHANGE, THE MORE THEY STAY THE SAME: THE SAFETY NET, LIVING ARRANGEMENTS, AND POVERTY IN THE GREAT RECESSION Marianne Bitler Hilary Hoynes Working Paper 19449
Child Poverty and the Great Recession. Marianne Bitler Department of Economics, UC Irvine and NBER
 Child Poverty and the Great Recession Marianne Bitler Department of Economics, UC Irvine and NBER mbitler@uci.edu Hilary Hoynes Department of Economics and Public Policy, UC Berkeley and NBER hoynes@berkeley.edu
Expanding the CalEITC: A Smart Investment to Broaden Economic Security in California
 calbudgetcenter.org Expanding the CalEITC: A Smart Investment to Broaden Economic Security in California @alissa_brie @skimberca @CalBudgetCenter ALISSA ANDERSON, SENIOR POLICY ANALYST SARA KIMBERLIN,
Heterogeneity in the Impact of Economic Cycles and the Great Recession: Effects Within and Across the Income Distribution
 Heterogeneity in the Impact of Economic Cycles and the Great Recession: Effects Within and Across the Income Distribution Marianne Bitler Department of Economics, UC Irvine and NBER mbitler@uci.edu Hilary
Making Ends Meet: The Cost to Support a Family in California
 Making Ends Meet: The Cost to Support a Family in California SARA KIMBERLIN, SENIOR POLICY ANALYST SILICON VALLEY CHILDREN S ADVOCACY NETWORK MOUNTAIN VIEW, JANUARY 18, 2018 calbudgetcenter.org What Are
Session 2: Poverty, Income Inequality and the Family Poverty 101 June 12, 2018
 Session 2: Poverty, Income Inequality and the Family Poverty 101 June 12, 2018 Tim Smeeding Professor of Public Affairs and Economics Research Training Policy Practice Poverty, Income Inequality Tim and
Social Security Income Measurement in Two Surveys
 Social Security Income Measurement in Two Surveys Howard Iams and Patrick Purcell Office of Research, Evaluation, and Statistics Social Security Administration Abstract Social Security is a major source
Do Older Americans Have More Income Than We Think?
 Do Older Americans Have More Income Than We Think? Adam Bee and Josh Mitchell U.S. Census Bureau Presented at National Tax Association Meetings Philadelphia November 9, 2017 The views expressed in this
HOW THE WAGE GAP HURTS WOMEN AND FAMILIES FACT SHEET FACT SHEET. How the Wage Gap Hurts Women and Families. April 2013
 EMPLOYMENT FACT SHEET How the Wage Gap Hurts Women and Families April 2013 American women who work full time, year round are paid only 77 cents for every dollar paid to their male counterparts. 2 This
Consumption and Income Poverty for Those 65 and Over
 Consumption and Income Poverty for Those 65 and Over Bruce D. Meyer University of Chicago and NBER and James X. Sullivan University of Notre Dame Prepared for the 9th Annual Joint Conference of the Retirement
Poverty in the United States: 2012
 Cornell University ILR School DigitalCommons@ILR Federal Publications Key Workplace Documents 11-13-2013 Poverty in the United States: 2012 Thomas Gabe Congressional Research Service Follow this and additional
Gallatin County. Montana Poverty Report Card
 1 County Poverty Report Card June 216 Summary The poverty rate for County increased from 13.% in 21 to 14.% in 213. For the month of December in 211 and 214, the county s unemployment rate decreased from
Missoula County. Montana Poverty Report Card
 1 County Poverty Report Card June 216 Summary The poverty rate for County decreased from 17.3% in 21 to 16.% in 213. For the month of December in 211 and 214, the county s unemployment rate decreased from
Small Area Health Insurance Estimates from the Census Bureau: 2008 and 2009
 October 2011 Small Area Health Insurance Estimates from the Census Bureau: 2008 and 2009 Introduction The U.S. Census Bureau s Small Area Health Insurance Estimates (SAHIE) program produces model based
Medical Spending, Health Insurance, and Measurement of American Poverty. Gary Burtless The Brookings Institution
 Institute for Research on Poverty Discussion Paper no. 1238-01 Medical Spending, Health Insurance, and Measurement of American Poverty Gary Burtless The Brookings Institution E-mail: gburtless@brook.edu
Small Area Estimates Produced by the U.S. Federal Government: Methods and Issues
 Small Area Estimates Produced by the U.S. Federal Government: Methods and Issues Small Area Estimation Conference Maastricht, The Netherlands August 17-19, 2016 John L. Czajka Mathematica Policy Research
Ravalli County. Montana Poverty Report Card
 1 County Poverty Report Card June 216 Summary The poverty rate for County increased from 15.% in 21 to 16.8% in 213. For the month of December in 211 and 214, the county s unemployment rate decreased from
UMD/AEI Poverty Tabulator User s Guide
 (DRAFT Not for Citation or Distribution) UMD/AEI Poverty Tabulator User s Guide Douglas J. Besharov John Coder Gordon Green November 2007 Welfare Reform Academy University of Maryland American Enterprise
Granite County. Montana Poverty Report Card
 1 County Poverty Report Card June 216 Summary The poverty rate for County increased from 12.1% in 21 to 15.1% in 213. For the month of December in 211 and 214, the county s unemployment rate decreased
Estimating the Potential Impacts of the Administration s Fiscal Year 2018 Budget Proposal on Safety Net Programs Using Microsimulation
 P O V E R T Y, V U L N E R A B I L I T Y, A N D T H E S A F E T Y N E T T E C H N ICAL R E PO R T Estimating the Potential Impacts of the Administration s Fiscal Year 2018 Budget Proposal on Safety Net
In 2012, according to the U.S. Census Bureau, about. A Profile of the Working Poor, Highlights CONTENTS U.S. BUREAU OF LABOR STATISTICS
 U.S. BUREAU OF LABOR STATISTICS M A R C H 2 0 1 4 R E P O R T 1 0 4 7 A Profile of the Working Poor, 2012 Highlights Following are additional highlights from the 2012 data: Full-time workers were considerably
Dawson County. Montana Poverty Report Card
 1 County Poverty Report Card June 216 Summary The poverty rate for County increased from 9.3% in 21 to 16.% in 213. For the month of December in 211 and 214, the county s unemployment rate decreased from
Medical Out-of-Pocket Spending Among the Uninsured: Differential Spending & the Supplemental Poverty Measure
 Medical Out-of-Pocket Spending Among the Uninsured: Differential Spending & the Supplemental Poverty Measure Kyle J. Caswell and Kathleen S. Short SEHSD Working Paper 2011-24 U.S. Census Bureau Social,
Trends in Supplemental Nutrition Assistance Program Participation Rates: Fiscal Year 2010 to Fiscal Year 2013
 United States Department of Agriculture Current Perspectives on SNAP Participation Trends in Supplemental Nutrition Assistance Program Participation Rates: Fiscal Year 2010 to Fiscal Year 2013 Supplemental
Poverty rates by state, 1979 and 1985: University of Wisconsin-Madison Institute for Research on Poverty. Volume 10. Number 3.
 University of Wisconsin-Madison Institute for Research on Poverty Volume 10 Number 3 Fall 1987 Poverty rates by state, 1979 and 1985: A research note Small Grants: New competition Financial aid for college
Silver Bow County. Montana Poverty Report Card
 1 County Poverty Report Card June 16 Summary The poverty rate for County increased from 17.8% in to 19.1% in 13. For the month of December in 11 and 14, the county s unemployment rate decreased from 6.6%
Flathead County. Montana Poverty Report Card
 1 County Poverty Report Card June 216 Summary The poverty rate for County increased from 11.7% in 21 to 14.2% in 213. For the month of December in 211 and 214, the county s unemployment rate decreased
Income, Poverty, and Health Insurance Coverage in the United States: 2010
 Income, Poverty, and Health Insurance Coverage in the United States: 200 Issued September 20 P60-239 6.4.6 0.6 Current Population Reports 7. 2.6Co0n0.7sumer Income 9.2.2 0 7.5..0 7.6.3 *. 6.7.9 *.5 9 0.9
How the Census Bureau Measures Poverty
 How the Census Bureau Measures Poverty Following the Office of Management and Budget's (OMB) Statistical Policy Directive 14, the Census Bureau uses a set of money income thresholds that vary by family
Chapter 7. Government Subsidies and Income Support for the Poor
 Chapter 7 Government Subsidies and Income Support for the Poor Copyright 2002 Thomson Learning, Inc. Thomson Learning is a trademark used herein under license. ALL RIGHTS RESERVED. Instructors of classes
Lewis and Clark. Montana Poverty Report Card
 1 County Poverty Report Card June 216 Summary he poverty rate for County increased from 9.7% in 21 to 1.4% in 213. For the month of December in 211 and 214, the county s unemployment rate decreased from.3%
Tyler Area Economic Overview
 Tyler Area Economic Overview Demographic Profile. 2 Unemployment Rate. 4 Wage Trends. 4 Cost of Living Index...... 5 Industry Clusters. 5 Occupation Snapshot. 6 Education Levels 7 Gross Domestic Product
The State of the Safety Net in the Post- Welfare Reform Era
 The State of the Safety Net in the Post- Welfare Reform Era Marianne Bitler (UC Irvine) Hilary W. Hoynes (UC Davis) Paper prepared for Brookings Papers on Economic Activity, Sept 21 Motivation and Overview
Basic Family Budgets Economic Policy Institute
 Basic Family Budgets Economic Policy Institute Prepared by Gerry Bradley Research Director New Mexico Voices for Children State Data User s Conference Nov. 5-6, 2008 Definition of a Family Family budgets
Economic Security Programs Cut Poverty Nearly in Half Over Last 50 Years, New Data Show
 820 First Street NE, Suite 510 Washington, DC 20002 Tel: 202-408-1080 Fax: 202-408-1056 center@cbpp.org www.cbpp.org September 14, 2018 Economic Security Programs Cut Poverty Nearly in Half Over Last 50
Poverty Levels and Trends in Comparative Perspective
 Institute for Research on Poverty Discussion Paper no. 1344-08 Poverty Levels and Trends in Comparative Perspective Daniel R. Meyer University of Wisconsin Madison School of Social Work Institute for Research
35% 26% 57% 51% PROFILE. CIty of durham: Assets & opportunity ProfILe. key highlights. ABoUt the ProfILe ASSETS & OPPORTUNITY
 CIty of durham: Assets & opportunity ProfILe ASSETS & OPPORTUNITY PROFILE key highlights 35% of Durham County households live in asset poverty Cities have long been thought of as places of opportunity
The Demography of Inequality from 1985 to 2010: Income and Consumption
 The Demography of Inequality from 1985 to 2010: Income and Consumption Jonathan Fisher and David S. Johnson (U.S. Census Bureau) and Timothy M. Smeeding (University of Wisconsin) 1 The year 2011 will be
Katahdin Region Socioeconomic Indicators Katahdin Region
 Katahdin Region Socioeconomic Indicators Town of Medway Katahdin Region Socioeconomic Indicators Katahdin Region Report by Senator George J. Mitchell Center for Sustainability Solutions University of Maine
Appendix A: Supplementary Poverty Measure Christopher Lum & See Tow Zi Hsien
 Appendix A: Supplementary Poverty Measure 2015 Christopher Lum & See Tow Zi Hsien SPM is a more complex statistic incorporating additional items such as tax payments and work expenses in its family resource
A Profile of the Working Poor, 2011
 Cornell University ILR School DigitalCommons@ILR Federal Publications Key Workplace Documents 4-2013 A Profile of the Working Poor, 2011 Bureau of Labor Statistics Follow this and additional works at:
Economic Overview City of Tyler, TX. January 8, 2018
 Economic Overview City of Tyler, TX January 8, 2018 DEMOGRAPHIC PROFILE...3 EMPLOYMENT TRENDS...5 WAGE TRENDS...5 COST OF LIVING INDEX...6 INDUSTRY SNAPSHOT...7 OCCUPATION SNAPSHOT...9 INDUSTRY CLUSTERS...
Changing Poverty, Changing Policies
 Cancian, Maria, Danziger, Sheldon Published by Russell Sage Foundation Cancian, Maria. and Danziger, Sheldon. Changing Poverty, Changing Policies. New York: Russell Sage Foundation, 2009. Project MUSE.
This report examines whether some
 state of states Safety Net The Stanford Center on Poverty and Inequality By Karen Long Jusko Key findings In non-recessionary periods, the safety net provides about 38 percent of the income support needed
2016 Status Report: WOMEN, WORK AND WAGES IN VERMONT
 2016 Status Report: WOMEN, WORK AND WAGES IN VERMONT This brief is published by Change The Story VT (CTS), a multi-year strategy to align philanthropy, policy, and program to significantly improve women
NBER WORKING PAPER SERIES THE MORE THINGS CHANGE, THE MORE THEY STAY THE SAME? THE SAFETY NET AND POVERTY IN THE GREAT RECESSION
 NBER WORKING PAPER SERIES THE MORE THINGS CHANGE, THE MORE THEY STAY THE SAME? THE SAFETY NET AND POVERTY IN THE GREAT RECESSION Marianne Bitler Hilary Hoynes Working Paper 19449 http://www.nber.org/papers/w19449
2018 Economic Indicators Report
 2018 Economic Indicators Report Economic, Social, and Educational changes in our region affecting Greater Dubuque 2022 Goals of Job Creation, Median Household Income, Population, and Construction Investment.
Economic Overview York County, South Carolina. February 14, 2018
 Economic Overview York County, February 14, 2018 DEMOGRAPHIC PROFILE... 3 EMPLOYMENT TRENDS... 5 UNEMPLOYMENT RATE... 5 WAGE TRENDS... 6 COST OF LIVING INDEX... 6 INDUSTRY SNAPSHOT... 7 OCCUPATION SNAPSHOT...
Aging Seminar Series:
 Aging Seminar Series: Income and Wealth of Older Americans Domestic Social Policy Division Congressional Research Service November 19, 2008 Introduction Aging Seminar Series Focus on important issues regarding
Deteriorating Health Insurance Coverage from 2000 to 2010: Coverage Takes the Biggest Hit in the South and Midwest
 ACA Implementation Monitoring and Tracking Deteriorating Health Insurance Coverage from 2000 to 2010: Coverage Takes the Biggest Hit in the South and Midwest August 2012 Fredric Blavin, John Holahan, Genevieve
Options for Setting and Updating a Reference. Family Threshold for a Revised Poverty Measure
 Options for Setting and Updating a Reference Family Threshold for a Revised Poverty Measure Constance F. Citro, Director Committee on National Statistics, The National Academies DRAFT, June 6, 2004 Paper
Waging War on Poverty: Historical Trends in Poverty Using the Supplemental Poverty Measure
 Waging War on Poverty: Historical Trends in Poverty Using the Supplemental Poverty Measure Liana Fox Irv Garfinkel Neeraj Kaushal Jane Waldfogel Christopher Wimer Paper presented at the Association for
What does your Community look like and how is it changing?
 What does your Community look like and how is it changing? Trends in the State population related to health and health determinants and where you can find this data to support your local work Who is Likely