Measuring Suburban Poverty: Concepts and Data Sources Hofstra University September 26, 2013
|
|
|
- Lee Adams
- 5 years ago
- Views:
Transcription
1 Measuring Suburban Poverty: Concepts and Data Sources Hofstra University September 26, 2013 Trudi Renwick Poverty Statistics Branch Social, Economic and Housing Statistics Division U.S. Bureau of the Census
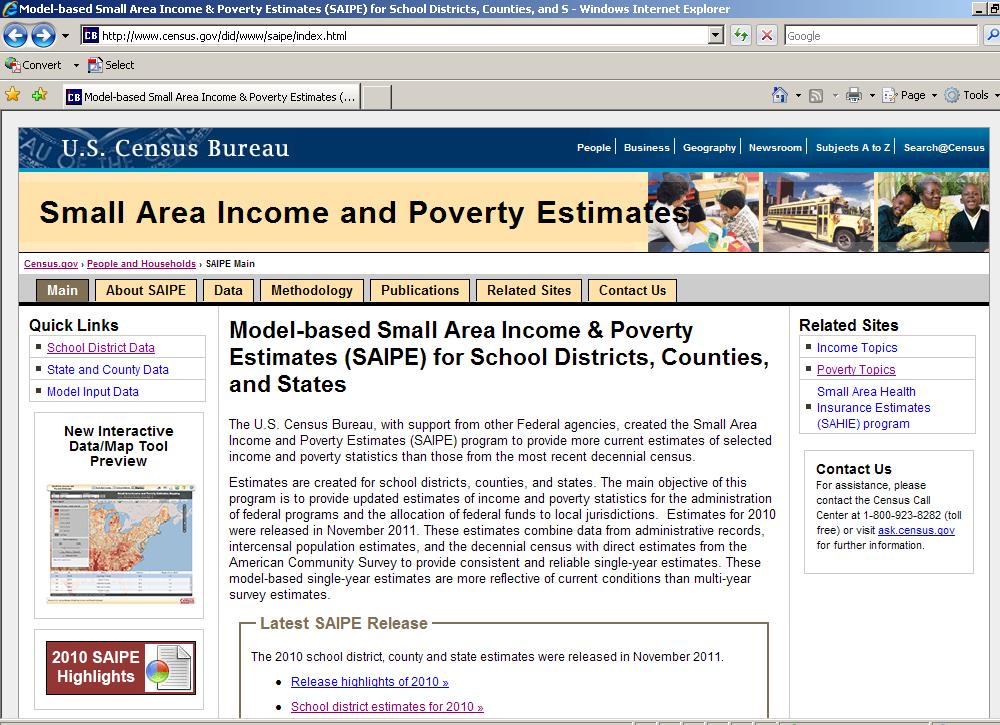
2 Sources of Poverty Data Current Population Survey - national Decennial Census - historical American Community Survey Single year - geographies 65,000+ Multi-year - smaller areas Small Area Income and Poverty Estimates School district estimates 2

3 Official Poverty Measure The 2012 official poverty rate for the nation was 15.0 percent No change from last year 46.5 million people in poverty An increase of 2.7 percentage points since 2007 Official poverty threshold for a family with two adults, two children in 2012 was $23,283 Current Population Survey Annual Social and Economic Supplement Detailed tables, historical tables, customized tables using Table Creator 3
4 Real Median Household Income and Poverty Rate: 1967 to Income in thousands (2012 dollars) Real median household income Recession $51, $42, % Percent 15% 15.0% 10% 5% 14.2% Poverty rate 0% Note: Income rounded to nearest $100. Source: U.S. Census Bureau, Current Population Survey, 1968 to 2013 Annual Social and Economic Supplements. 5
5 The Current Population Survey enables researchers to look at poverty over long time periods for larger geographic entities. Nationally, we can see a trend toward a larger share of the poor living in suburbs. 100% Share of the Poor living in Suburbs: % 80% Axis Title 70% 60% 50% 40% 30% Outside metropolitan statistical areas Outside principal cities Inside principal cities 20% 10% 0% Source: Current Population Survey Annual Social and Economic Supplement 5
6 Poverty rates in suburban areas continue to be lower than inside principal cities or outside metropolitan areas. Poverty Rates Inside principal cities Outside principal cities Outside metropolitan statistical areas Source: Current Population Survey Annual Social and Economic Supplement 6
7 Nationally over the past twelve years, poverty rates and the number of poor people have grown fastest in the suburbs. 70.0% 70.0% 60.0% 59.5% 60.0% 50.0% 40.0% 30.0% 20.0% 50.4% 21.3% Inside Principal Cities Outside Principal Cities Nonmetro 50.0% 40.0% 30.0% 20.0% 20.9% 43.6% 32.1% 10.0% 10.0% 0.0% Percent Increase in Number of Poor: % Percent Increase in Poverty Rate Source: Current Population Survey Annual Social and Economic Supplement 7
8 ACS Data on Suburbs: Percent Change in Poverty Rates % 0.0% 5.0% 10.0% 15.0% 20.0% 25.0% 30.0% 35.0% 40.0% 45.0% All families With related children under 18 years Married couple families With related children under 18 years Families with female householder, no husband present With related children under 18 years All people Under 18 years 18 to 64 years 65 years and over Source: American Community Survey
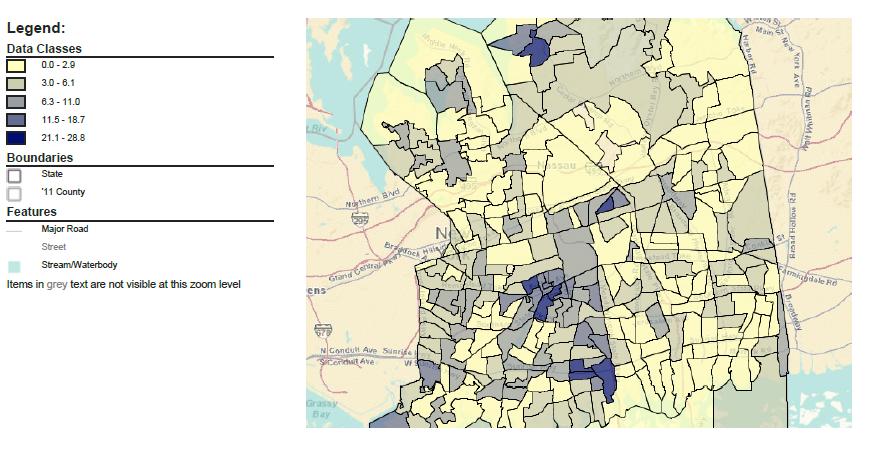
9 ACS data on Nassau/Suffolk Counties 2007 to 2012 American Community Survey Poverty rates have increased in both counties but poverty rates are fairly low Nassau County up from 4.4 percent in 2007 to 6.6 percent in 2012 Change between 2011 and 2012 not statistically significant Suffolk County up from 5.0 percent in 2007 to 6.9 percent in in 2012 Change between 2011 and 2012 not statistically significant While the populations of the two counties have grown about 3 percent since 2007, the number of people in poverty has grown much faster The number of people in poverty grew by almost 50 percent, from 128,000 to 190,000 (56 percent in Nassau, 43 percent in Suffolk) The number of people between 100 percent and 200 percent of the poverty level grew by 35 percent from 234,000 to 316,000 (19 percent in Nassau, 50 percent in Suffolk) Number of people below 50 percent of poverty grew by 50 percent from 56,000 to 83,000 (65% in Nassau, 40% in Suffolk) 9
10
11 11
12 New poor? Difficult to answer most surveys are snapshots Only Survey of Income and Program Participation looks at poverty status over time. Most poverty spells are short Some poverty is chronic or persistent Sample not large enough to look at Suffolk County. 12


13 How does the Census Bureau measure poverty?


14 Poverty Threshold and Resources 14
15 Official Poverty Measure Thresholds Cost of a minimum food basket times three Multiplier based on 1955 consumption survey Updated each year with the CPI Same for all areas in the US Resources Gross (before-tax) cash income from all sources Unit of analysis is the family (those related by birth, marriage or adoption) and unrelated individuals 15

16 16
17 Criticisms of Official Poverty Measure Does not distinguish between needs of workers and nonworkers Child care Other work expenses Does not reflect government policy initiatives In-kind benefits SNAP/WIC/LIHEAP Tax credits Tax policy Irregular family size adjustments Does not reflect increases in standard of living since 1955 Does not reflect new family structures: resources of unmarried partners Does not recognize variations in medical care costs and housing costs Does not reflect geographic price variations 17


18 Supplemental Poverty Measure (SPM) Observations from the Interagency Technical Working Group - March 2, 2010 Will not replace the official poverty measure Will not be used for resource allocation or program eligibility Census Bureau and BLS responsible for improving and updating the measure Continued research and improvement Based on NAS panel 1995 recommendations Source: U.S. Census Bureau, Current Population Survey, 2012 Annual Social and Economic Supplement. research/ Short_ResearchSPM2011.pdf 20
19 Comparison of SPM and Official Poverty Estimates: % Percent 22.3% Official* SPM 20% 15% 16.1% 15.1% 18.1% 13.7% 15.5% 15.1% 10% 8.7% 5% 0% All People Under 18 years 18 to 64 years 65 years and older *Includes unrelated individuals under age 15. Source: U.S. Census Bureau, Current Population Survey, 2012 Annual Social and Economic Supplement. 21
20 Comparison of SPM and Official Poverty Estimates: % Percent Official* SPM 20% 20.1% 21.7% 15% 15.1% 16.1% 17.1% 13.4% 13.5% 11.4% 10% 5% 0% All People Inside principal city Outside principal city Outside MSA *Includes unrelated individuals under age 15. Source: U.S. Census Bureau, Current Population Survey, 2012 Annual Social and Economic Supplement. 21
21 Comparison the Distribution of People: Total Population, SPM and Official Poverty Populations: 2011 Total Population t 32.5% 52.2% 15.3% SPM 43.8% 43.4% 12.8% Official* 43.2% 39.4% 17.4% 0% 20% 40% 60% 80% 100% Inside principal city Outside principal city Outside MSA *Includes unrelated individuals under age 15. Source: U.S. Census Bureau, Current Population Survey, 2012 Annual Social and Economic Supplement. 21
22 Comparing the Official and SPM Thresholds and Units Official Measure Cost of a minimum food basket times three Updated each year with the CPI Same for all areas in the US Supplemental Measure 33 rd percentile of sum of expenditures for food, clothing, and shelter, and utilities (FCSU) plus a little bit more Updated each year with most recent 5 years of data Adjusted for differences in home ownership status and geography Unit of analysis is the family (those related by birth, marriage or adoption) and unrelated individuals Unit of analysis expanded to include cohabiting partners and their relatives, unrelated children under 15, foster children under
23 Income/Resource Definition Official Gross (before-tax) cash income from all sources Supplemental Gross money income PLUS value of near-money federal in-kind benefits for FCSU SNAP, school lunch, WIC Housing subsidies LIHEAP Tax credits (EITC) MINUS federal and state income and payroll taxes and other nondiscretionary expenses Child care and other work expenses Medical out of pocket expenses Child support paid 23 23
24 Difference in SPM Rate After Including Each Element: 2011 Percentage point change in SPM rate after including each element SNAP SSI TANF -0.1 WIC -0.1 LIHEAP Child support paid 0.1 Federal income tax 0.5 FICA Work expense Medical Out of Pocket Social Security Refundable tax credits Unemployment Insurance Housing subsidies Child support received School lunch Source: U.S. Census Bureau, Current Population Survey, 2012 Annual Social and Economic Supplement. mental/research/ Short_ResearchSPM2011.pdf 22
25 Difference in SPM Rate After Including Each Element: 2011 Percentage point change in SPM rate after including each element SNAP SSI TANF -0.1 WIC -0.1 LIHEAP Child support paid 0.1 Federal income tax 0.5 FICA Work expense Medical Out of Pocket Social Security Refundable tax credits Unemployment Insurance Housing subsidies Child support received School lunch Source: U.S. Census Bureau, Current Population Survey, 2012 Annual Social and Economic Supplement. mental/research/ Short_ResearchSPM2011.pdf 22
26 Difference in SPM Rate After Including Each Element: 2011 Percentage point change in SPM rate after including each element SNAP SSI TANF -0.1 WIC -0.1 LIHEAP Child support paid 0.1 Federal income tax 0.5 FICA Work expense Medical Out of Pocket Social Security Refundable tax credits Unemployment Insurance Housing subsidies Child support received School lunch Source: U.S. Census Bureau, Current Population Survey, 2012 Annual Social and Economic Supplement. mental/research/ Short_ResearchSPM2011.pdf 22
27 Difference in SPM Rate After Including Each Element: 2011 Percentage point change in SPM rate after including each element SNAP SSI TANF -0.1 WIC -0.1 LIHEAP Child support paid 0.1 Federal income tax 0.5 FICA Work expense Medical Out of Pocket Social Security Refundable tax credits Unemployment Insurance Housing subsidies Child support received School lunch Source: U.S. Census Bureau, Current Population Survey, 2012 Annual Social and Economic Supplement. mental/research/ Short_ResearchSPM2011.pdf 22
28 Difference in SPM Rate After Including Each Element: 2011 Percentage point change in SPM rate after including each element SNAP SSI TANF -0.1 WIC -0.1 LIHEAP Child support paid 0.1 Federal income tax 0.5 FICA Work expense Medical Out of Pocket Social Security Refundable tax credits Unemployment Insurance Housing subsidies Child support received School lunch Source: U.S. Census Bureau, Current Population Survey, 2012 Annual Social and Economic Supplement. mental/research/ Short_ResearchSPM2011.pdf 22

29 29

30 30
31 31

32 32
33 33
34 34

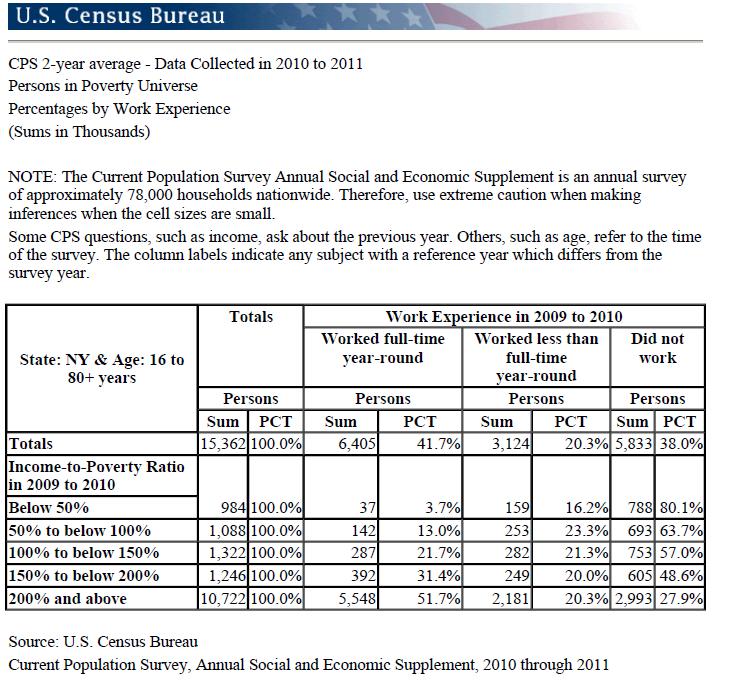
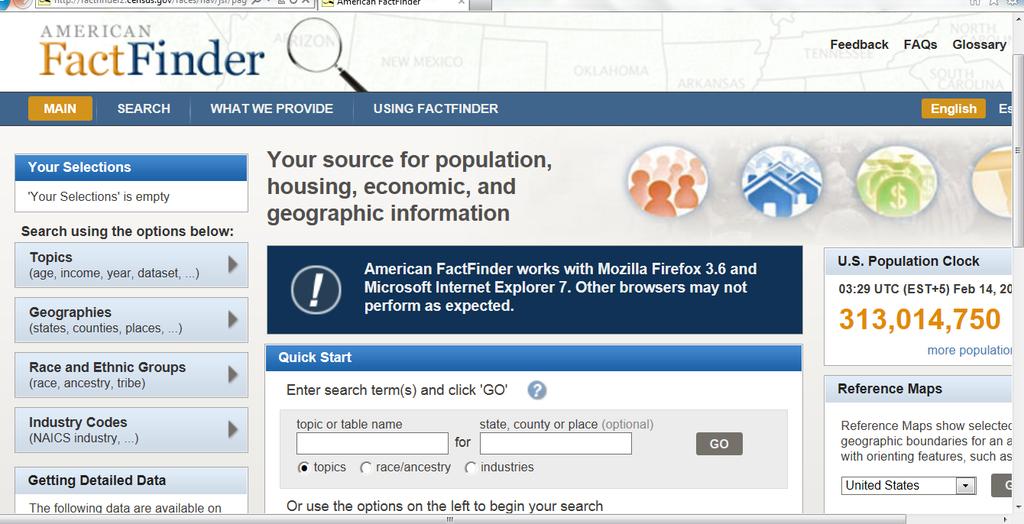
35 How to get data on suburbs from AFF?

36 37
37 38
38 Contact Information Trudi Renwick
Estimating the Supplemental Poverty Measure from the 2014 Panel of the Survey of Income and Program Participation
 Estimating the Supplemental Poverty Measure from the 2014 Panel of the Survey of Income and Program Participation FCSM March 7, 2018 Lewis Warren Liana Fox Ashley Edwards U.S. Census Bureau U.S. Census
An Overview of the New Supplemental Poverty Measure
 An Overview of the New Supplemental Poverty Measure David Johnson U.S. Census Bureau Brookings Institution May 6, 2010 The Patronus and Poverty Measurement 2 What is Poverty? Adam Smith and Poverty The
The Council of State Governments
 The Council of State Governments Capitol Ideas Webinar Series: Alternative Poverty Measures www.csg.org CSG Webinar: Alternative Poverty Measures Presenters Elise Gould Economic Policy Institute Timothy
How the Census Bureau Measures Poverty With Selected Sources of Poverty Data
 How the Census Bureau Measures Poverty With Selected Sources of Poverty Data Alemayehu Bishaw Poverty Statistics Branch Social, Economic and Housing Statistics Division U. S. Census Bureau November 15-16,
The Supplemental Poverty Measure: 2013
 The Supplemental Poverty Measure: 2013 Current Population Reports By Kathleen Short Issued October 2014 P60-251 INTRODUCTION This is the fourth report describing the Supplemental Poverty Measure (SPM)
An Intelligent Consumer s Guide to Poverty Measurement
 IRP Webinar: An Intelligent Consumer s Guide to Poverty Measurement Timothy Smeeding University of Wisconsin Madison Kathleen Short U.S. Census Bureau May 14, 2014 Research Training Policy Practice Disclaimers
Conceptualizing and Measuring Poverty. Julia B. Isaacs Urban Institute Senior Fellow and IRP Research Affiliate June 12, 2018
 Conceptualizing and Measuring Poverty Julia B. Isaacs Urban Institute Senior Fellow and IRP Research Affiliate June 12, 2018 What is poverty? How do we measure it? Three general approaches Absolute Relative
Observations from the Interagency Technical Working Group on Developing a Supplemental Poverty Measure
 March 2010 Observations from the Interagency Technical Working Group on Developing a Supplemental Poverty Measure I. Developing a Supplemental Poverty Measure Since the official U.S. poverty measure was
Poverty in the United States in 2014: In Brief
 Joseph Dalaker Analyst in Social Policy September 30, 2015 Congressional Research Service 7-5700 www.crs.gov R44211 Contents Introduction... 1 How the Official Poverty Measure is Computed... 1 Historical
Child poverty in rural America
 IRP focus December 2018 Vol. 34, No. 3 Child poverty in rural America David W. Rothwell and Brian C. Thiede David W. Rothwell is Assistant Professor of Public Health at Oregon State University. Brian C.
Poverty and the Safety Net After the Great Recession
 Poverty and the Safety Net After the Great Recession Deep Issues of the 2012 Elections: Equality, Liberty and Democracy, Cornell University Hilary Hoynes University of California, Davis November 2012 In
Using the American Community Survey (ACS) to Implement a Supplemental Poverty Measure (SPM) 1
 to Implement a Supplemental Poverty Measure (SPM) 1") Using the American Community Survey (ACS) to Implement a Supplemental Poverty Measure (SPM) 1 Trudi Renwick, Kathleen Short, Ale Bishaw and Charles Hokayem Social, Economic and Housing Statistics Division
Using the American Community Survey (ACS) to Implement a Supplemental Poverty Measure (SPM) 1 Trudi Renwick, Kathleen Short, Ale Bishaw and Charles Hokayem Social, Economic and Housing Statistics Division
The Supplemental Poverty Measure: Its Core Concepts, Development, and Use
 The Supplemental Poverty Measure: Its Core Concepts, Development, and Use Joseph Dalaker Analyst in Social Policy November 28, 2017 Congressional Research Service 7-5700 www.crs.gov R45031 Summary The
Wisconsin Poverty Report: Methodology and Results for 2009
 Wisconsin Poverty Report: Methodology and Results for 2009 Julia B. Isaacs, Joanna Y. Marks, Timothy M. Smeeding, and Katherine A. Thornton Institute for Research on Poverty University of Wisconsin Madison
Understanding Poverty Measures Used to Assess Economic Well-Being in California
 calbudgetcenter.org Understanding Poverty Measures Used to Assess Economic Well-Being in California @alissa_brie @skimberca @CalBudgetCenter ALISSA ANDERSON, SENIOR POLICY ANALYST SARA KIMBERLIN, SENIOR
Measuring the Cost of Employment: Work-Related Expenses in the Supplemental Poverty Measure. No. 279 SEHSD No
 THE SURVEY OF INCOME AND PROGRAM PARTICIPATION Measuring the Cost of Employment: Work-Related in the Supplemental Poverty Measure Revised November 13, 2017 No. 279 SEHSD No. 2017-43 Abinash Mohanty Ashley
Pathways Fall The Supplemental. Poverty. Measure. A New Tool for Understanding U.S. Poverty. By Rebecca M. Blank
 10 Pathways Fall 2011 The Supplemental Poverty Measure A New Tool for Understanding U.S. Poverty By Rebecca M. Blank 11 How many Americans are unable to meet their basic needs? How is that number changing
Making Ends Meet: The Cost to Support a Family in California
 Making Ends Meet: The Cost to Support a Family in California SARA KIMBERLIN, SENIOR POLICY ANALYST POLICY INSIGHTS 2018 SACRAMENTO, MARCH 22, 2018 calbudgetcenter.org What Are Families Basic Expenses?
Table 1 Annual Median Income of Households by Age, Selected Years 1995 to Median Income in 2008 Dollars 1
 Fact Sheet Income, Poverty, and Health Insurance Coverage of Older Americans, 2008 AARP Public Policy Institute Median household income and median family income in the United States declined significantly
Rural Poverty Transitions: A New Look at Movements in and out of Poverty
 Rural Poverty Transitions: A New Look at Movements in and out of Poverty José D. Pacas Research Scientist, Minnesota Population Center, University of Minnesota Elizabeth E. Davis Professor, Department
Poverty and Income in 2008: A Look at the New Census Data and What the Numbers Mean. Brookings Workshop. David Johnson September 10, 2009
 Poverty and Income in 2008: A Look at the New Census Data and What the Numbers Mean Brookings Workshop David Johnson September 10, 2009 Ron and Belle, thanks for inviting me. I think Ron invited me this
Wisconsin Poverty Report: Methodology and Results for 2008
 Wisconsin Poverty Report: Methodology and Results for 2008 Julia Isaacs, Joanna Marks, Timothy Smeeding, and Katherine Thornton Institute for Research on Poverty University of Wisconsin Madison September
Wisconsin Poverty Report: New Measure, Broader View
 Wisconsin Poverty Report: New Measure, Broader View Joanna Marks, Julia Isaacs, and Timothy Smeeding Institute for Research on Poverty University of Wisconsin Madison September 2010 ACKNOWLEDGMENTS The
Everything You Always Wanted to Know about Poverty in Maine (but may not have thought to ask)
") Everything You Always Wanted to Know about Poverty in Maine (but may not have thought to ask) Teaching and Working in a Diverse World: The Impact of Poverty October 22nd, 2009 University of Maine, Farmington
Everything You Always Wanted to Know about Poverty in Maine (but may not have thought to ask) Teaching and Working in a Diverse World: The Impact of Poverty October 22nd, 2009 University of Maine, Farmington
Reducing Poverty in Wisconsin
 Reducing Poverty in Wisconsin David Riemer, Senior Fellow Conor Williams, Economic Policy Analyst Michael Bare, Research and Program Coordinator Community Advocates Public Policy Institute Poverty reduction
What is Poverty? lack of or scarcity of a certain amount of material possessions or money
 Poverty What is Poverty? lack of or scarcity of a certain amount of material possessions or money commonly includes access to: food, water, sanitation, clothing, shelter, health care, education other dimensions:
Dawson County. Montana Poverty Report Card
 1 County Poverty Report Card June 216 Summary The poverty rate for County increased from 9.3% in 21 to 16.% in 213. For the month of December in 211 and 214, the county s unemployment rate decreased from
STATE OF NEW JERSEY. SENATE RESOLUTION No th LEGISLATURE. Sponsored by: Senator SHIRLEY K. TURNER District 15 (Hunterdon and Mercer)
") SENATE RESOLUTION No. STATE OF NEW JERSEY th LEGISLATURE INTRODUCED FEBRUARY, 0 Sponsored by: Senator SHIRLEY K. TURNER District (Hunterdon and Mercer) SYNOPSIS Urges federal government to revise official
SENATE RESOLUTION No. STATE OF NEW JERSEY th LEGISLATURE INTRODUCED FEBRUARY, 0 Sponsored by: Senator SHIRLEY K. TURNER District (Hunterdon and Mercer) SYNOPSIS Urges federal government to revise official
How the Census Bureau Measures Poverty
 How the Census Bureau Measures Poverty Following the Office of Management and Budget's (OMB) Statistical Policy Directive 14, the Census Bureau uses a set of money income thresholds that vary by family
Poverty in the United States in 2016: In Brief
 Joseph Dalaker Analyst in Social Policy October 25, 2017 Congressional Research Service 7-5700 www.crs.gov R44991 Contents Introduction... 1 How the Official Poverty Measure Is Computed... 2 Historical
Program on Retirement Policy Number 1, February 2011
 URBAN INSTITUTE Retirement Security Data Brief Program on Retirement Policy Number 1, February 2011 Poverty among Older Americans, 2009 Philip Issa and Sheila R. Zedlewski About one in three Americans
Gallatin County. Montana Poverty Report Card
 1 County Poverty Report Card June 216 Summary The poverty rate for County increased from 13.% in 21 to 14.% in 213. For the month of December in 211 and 214, the county s unemployment rate decreased from
Missoula County. Montana Poverty Report Card
 1 County Poverty Report Card June 216 Summary The poverty rate for County decreased from 17.3% in 21 to 16.% in 213. For the month of December in 211 and 214, the county s unemployment rate decreased from
Measuring Poverty in California. Sarah Bohn May 16, 2014
 Measuring Poverty in California Sarah Bohn May 16, 2014 Measuring poverty is typically a two-step process Family Resources Threshold of needs to maintain a given level of well-being 2 We need realistic
In 2012, according to the U.S. Census Bureau, about. A Profile of the Working Poor, Highlights CONTENTS U.S. BUREAU OF LABOR STATISTICS
 U.S. BUREAU OF LABOR STATISTICS M A R C H 2 0 1 4 R E P O R T 1 0 4 7 A Profile of the Working Poor, 2012 Highlights Following are additional highlights from the 2012 data: Full-time workers were considerably
IRLE. Child Poverty, the Great Recession, and the Social Safety Net in the United States. IRLE WORKING PAPER # September 2016
 IRLE IRLE WORKING PAPER #116-16 September 2016 Child Poverty, the Great Recession, and the Social Safety Net in the United States Marianne Bitler, Hilary Hoynes, and Elira Kuka Cite as: Marianne Bitler,
Ravalli County. Montana Poverty Report Card
 1 County Poverty Report Card June 216 Summary The poverty rate for County increased from 15.% in 21 to 16.8% in 213. For the month of December in 211 and 214, the county s unemployment rate decreased from
Granite County. Montana Poverty Report Card
 1 County Poverty Report Card June 216 Summary The poverty rate for County increased from 12.1% in 21 to 15.1% in 213. For the month of December in 211 and 214, the county s unemployment rate decreased
THE UNITED STATES 2007
 THE UNITED STATES 2007 1. Overview of the system Generally, unemployed persons can receive unemployment compensation for a maximum of 26 weeks. There are a number of provisions for low income families.
POVERTY IN THE 50 STATES:
 POVERTY IN THE STATES: LONG-TERM TRENDS AND THE ROLE OF SOCIAL POLICIES AUTHORED BY: CENTER ON POVERTY & SOCIAL POLICY at Columbia University POVERTY IN THE STATES: LONG-TERM TRENDS AND THE ROLE OF SOCIAL
Silver Bow County. Montana Poverty Report Card
 1 County Poverty Report Card June 16 Summary The poverty rate for County increased from 17.8% in to 19.1% in 13. For the month of December in 11 and 14, the county s unemployment rate decreased from 6.6%
Flathead County. Montana Poverty Report Card
 1 County Poverty Report Card June 216 Summary The poverty rate for County increased from 11.7% in 21 to 14.2% in 213. For the month of December in 211 and 214, the county s unemployment rate decreased
Labor-Force Participation Rate for Men and Women, Age 25 to 54, and Mothers, 1948 to 2005
 FIGURE 1.1 Labor-Force Participation Rate for Men and Women, Age 25 to 54, and Mothers, 1948 to 25 Percentage 1 9 8 7 6 5 4 3 2 1 1948 1955 1965 1975 Year 1985 1995 25 Men 25 to 54 Women 25 to 54 Women
Making Ends Meet: The Cost to Support a Family in California
 Making Ends Meet: The Cost to Support a Family in California SARA KIMBERLIN, SENIOR POLICY ANALYST SILICON VALLEY CHILDREN S ADVOCACY NETWORK MOUNTAIN VIEW, JANUARY 18, 2018 calbudgetcenter.org What Are
American Community Survey 5-Year Estimates
 DP03 SELECTED ECONOMIC CHARACTERISTICS 2013-2017 American Community Survey 5-Year Estimates Supporting documentation on code lists, subject definitions, data accuracy, and statistical testing can be found
Using Refundable Tax Credits to Help Lowincome
 Using Refundable Tax Credits to Help Lowincome Taxpayers by Jon Forman Alfred P. Murrah Professor of Law University of Oklahoma Norman, Oklahoma & ATAX Fellow, UNSW University of Melbourne Melbourne, Australia
Lewis and Clark. Montana Poverty Report Card
 1 County Poverty Report Card June 216 Summary he poverty rate for County increased from 9.7% in 21 to 1.4% in 213. For the month of December in 211 and 214, the county s unemployment rate decreased from.3%
Tell us what you think. Provide feedback to help make American Community Survey data more useful for you.
 DP03 SELECTED ECONOMIC CHARACTERISTICS 2016 American Community Survey 1-Year Estimates Supporting documentation on code lists, subject definitions, data accuracy, and statistical testing can be found on
Developing Poverty Thresholds Using Expenditure Data
 Developing Poverty Thresholds Using Expenditure Data David Johnson, Stephanie Shipp, and Thesia Garner * Bureau of Labor Statistics 2 Massachusetts Avenue, NE Washington DC 20212 Prepared for the Joint
SELECTED ECONOMIC CHARACTERISTICS American Community Survey 5-Year Estimates
 DP03 SELECTED ECONOMIC CHARACTERISTICS 2008-2012 American Community Survey 5-Year Estimates Supporting documentation on code lists, subject definitions, data accuracy, and statistical testing can be found
American Community Survey 5-Year Estimates
 DP03 SELECTED ECONOMIC CHARACTERISTICS 2012-2016 American Community Survey 5-Year Estimates Supporting documentation on code lists, subject definitions, data accuracy, and statistical testing can be found
American Community Survey 5-Year Estimates
 DP03 SELECTED ECONOMIC CHARACTERISTICS 2012-2016 American Community Survey 5-Year Estimates Supporting documentation on code lists, subject definitions, data accuracy, and statistical testing can be found
American Community Survey 5-Year Estimates
 DP03 SELECTED ECONOMIC CHARACTERISTICS 2012-2016 American Community Survey 5-Year Estimates Supporting documentation on code lists, subject definitions, data accuracy, and statistical testing can be found
American Community Survey 5-Year Estimates
 DP03 SELECTED ECONOMIC CHARACTERISTICS 2012-2016 American Community Survey 5-Year Estimates Supporting documentation on code lists, subject definitions, data accuracy, and statistical testing can be found
American Community Survey 5-Year Estimates
 DP03 SELECTED ECONOMIC CHARACTERISTICS 2012-2016 American Community Survey 5-Year Estimates Supporting documentation on code lists, subject definitions, data accuracy, and statistical testing can be found
American Community Survey 5-Year Estimates
 DP03 SELECTED ECONOMIC CHARACTERISTICS 2012-2016 American Community Survey 5-Year Estimates Supporting documentation on code lists, subject definitions, data accuracy, and statistical testing can be found
American Community Survey 5-Year Estimates
 DP03 SELECTED ECONOMIC CHARACTERISTICS 2012-2016 American Community Survey 5-Year Estimates Supporting documentation on code lists, subject definitions, data accuracy, and statistical testing can be found
American Community Survey 5-Year Estimates
 DP03 SELECTED ECONOMIC CHARACTERISTICS 2012-2016 American Community Survey 5-Year Estimates Supporting documentation on code lists, subject definitions, data accuracy, and statistical testing can be found
American Community Survey 5-Year Estimates
 DP03 SELECTED ECONOMIC CHARACTERISTICS 2012-2016 American Community Survey 5-Year Estimates Supporting documentation on code lists, subject definitions, data accuracy, and statistical testing can be found
American Community Survey 5-Year Estimates
 DP03 SELECTED ECONOMIC CHARACTERISTICS 2012-2016 American Community Survey 5-Year Estimates Supporting documentation on code lists, subject definitions, data accuracy, and statistical testing can be found
American Community Survey 5-Year Estimates
 DP03 SELECTED ECONOMIC CHARACTERISTICS 2012-2016 American Community Survey 5-Year Estimates Supporting documentation on code lists, subject definitions, data accuracy, and statistical testing can be found
American Community Survey 5-Year Estimates
 DP03 SELECTED ECONOMIC CHARACTERISTICS 2012-2016 American Community Survey 5-Year Estimates Supporting documentation on code lists, subject definitions, data accuracy, and statistical testing can be found
American Community Survey 5-Year Estimates
 DP03 SELECTED ECONOMIC CHARACTERISTICS 2012-2016 American Community Survey 5-Year Estimates Supporting documentation on code lists, subject definitions, data accuracy, and statistical testing can be found
American Community Survey 5-Year Estimates
 DP03 SELECTED ECONOMIC CHARACTERISTICS 2012-2016 American Community Survey 5-Year Estimates Supporting documentation on code lists, subject definitions, data accuracy, and statistical testing can be found
American Community Survey 5-Year Estimates
 DP03 SELECTED ECONOMIC CHARACTERISTICS 2012-2016 American Community Survey 5-Year Estimates Supporting documentation on code lists, subject definitions, data accuracy, and statistical testing can be found
American Community Survey 5-Year Estimates
 DP03 SELECTED ECONOMIC CHARACTERISTICS 2012-2016 American Community Survey 5-Year Estimates Supporting documentation on code lists, subject definitions, data accuracy, and statistical testing can be found
American Community Survey 5-Year Estimates
 DP03 SELECTED ECONOMIC CHARACTERISTICS 2012-2016 American Community Survey 5-Year Estimates Supporting documentation on code lists, subject definitions, data accuracy, and statistical testing can be found
American Community Survey 5-Year Estimates
 DP03 SELECTED ECONOMIC CHARACTERISTICS 2012-2016 American Community Survey 5-Year Estimates Supporting documentation on code lists, subject definitions, data accuracy, and statistical testing can be found
American Community Survey 5-Year Estimates
 DP03 SELECTED ECONOMIC CHARACTERISTICS 2012-2016 American Community Survey 5-Year Estimates Supporting documentation on code lists, subject definitions, data accuracy, and statistical testing can be found
American Community Survey 5-Year Estimates
 DP03 SELECTED ECONOMIC CHARACTERISTICS 2012-2016 American Community Survey 5-Year Estimates Supporting documentation on code lists, subject definitions, data accuracy, and statistical testing can be found
American Community Survey 5-Year Estimates
 DP03 SELECTED ECONOMIC CHARACTERISTICS 2012-2016 American Community Survey 5-Year Estimates Supporting documentation on code lists, subject definitions, data accuracy, and statistical testing can be found
American Community Survey 5-Year Estimates
 DP03 SELECTED ECONOMIC CHARACTERISTICS 2012-2016 American Community Survey 5-Year Estimates Supporting documentation on code lists, subject definitions, data accuracy, and statistical testing can be found
American Community Survey 5-Year Estimates
 DP03 SELECTED ECONOMIC CHARACTERISTICS 2012-2016 American Community Survey 5-Year Estimates Supporting documentation on code lists, subject definitions, data accuracy, and statistical testing can be found
American Community Survey 5-Year Estimates
 DP03 SELECTED ECONOMIC CHARACTERISTICS 2012-2016 American Community Survey 5-Year Estimates Supporting documentation on code lists, subject definitions, data accuracy, and statistical testing can be found
American Community Survey 5-Year Estimates
 DP03 SELECTED ECONOMIC CHARACTERISTICS 2012-2016 American Community Survey 5-Year Estimates Supporting documentation on code lists, subject definitions, data accuracy, and statistical testing can be found
American Community Survey 5-Year Estimates
 DP03 SELECTED ECONOMIC CHARACTERISTICS 2012-2016 American Community Survey 5-Year Estimates Supporting documentation on code lists, subject definitions, data accuracy, and statistical testing can be found
Kansas standard of need and self-sufficiency study, 1999: final report
 This is the author s unpublished manuscript. Kansas standard of need and self-sufficiency study, 1999: final report Jacque E. Gibbons, Bernt Bratsberg, Leonard E. Bloomquist How to cite this manuscript
Need-Tested Benefits: Estimated Eligibility and Benefit Receipt by Families and Individuals
 Need-Tested Benefits: Estimated Eligibility and Benefit Receipt by Families and Individuals Gene Falk Specialist in Social Policy Alison Mitchell Analyst in Health Care Financing Karen E. Lynch Specialist
Poverty in the United States: 2012
 Cornell University ILR School DigitalCommons@ILR Federal Publications Key Workplace Documents 11-13-2013 Poverty in the United States: 2012 Thomas Gabe Congressional Research Service Follow this and additional
K-1 APPENDIX K. SPENDING FOR INCOME-TESTED BENEFITS, FISCAL YEARS
 K-1 APPENDIX K. SPENDING FOR INCOME-TESTED BENEFITS, FISCAL YEARS 1968-2000 CONTENTS Overview Participation in Income-Tested Programs Trends in Spending Spending Trends by Level of Government Federal Government
Economic Security Programs Cut Poverty Nearly in Half Over Last 50 Years, New Data Show
 820 First Street NE, Suite 510 Washington, DC 20002 Tel: 202-408-1080 Fax: 202-408-1056 center@cbpp.org www.cbpp.org September 14, 2018 Economic Security Programs Cut Poverty Nearly in Half Over Last 50
Opportunity, Responsibility and Security: Reducing Poverty and Increasing Economic Mobility
 Opportunity, Responsibility and Security: Reducing Poverty and Increasing Economic Mobility Ron Haskins Cabot Family Chair Brookings Institution A Presentation at Economic Opportunities for Families: A
Chapter 7. Government Subsidies and Income Support for the Poor
 Chapter 7 Government Subsidies and Income Support for the Poor Copyright 2002 Thomson Learning, Inc. Thomson Learning is a trademark used herein under license. ALL RIGHTS RESERVED. Instructors of classes
SOUTH DAKOTA KIDS COUNT BEACOM SCHOOL OF BUSINESS UNIVERSITY OF SOUTH DAKOTA 414 E. CLARK STREET VERMILLION, SD
 Brookings County Compared to o SDSD Undergrad Enrollment approximately 11,225 o USD Undergrad Enrollment approximately 7,600 o Brookings County 1 year population estimate for 2013 is 32,968 o 1 year population
Aging Seminar Series:
 Aging Seminar Series: Income and Wealth of Older Americans Domestic Social Policy Division Congressional Research Service November 19, 2008 Introduction Aging Seminar Series Focus on important issues regarding
Appendix A: Supplementary Poverty Measure Christopher Lum & See Tow Zi Hsien
 Appendix A: Supplementary Poverty Measure 2015 Christopher Lum & See Tow Zi Hsien SPM is a more complex statistic incorporating additional items such as tax payments and work expenses in its family resource
A Profile of the Working Poor, 2011
 Cornell University ILR School DigitalCommons@ILR Federal Publications Key Workplace Documents 4-2013 A Profile of the Working Poor, 2011 Bureau of Labor Statistics Follow this and additional works at:
Demographic and Economic Trends in Rural America
 Demographic and Economic Trends in Rural America John Cromartie Geographer, ERS-USDA Tom Hertz Economist, ERS-USDA Lorin Kusmin Economist, ERS-USDA Presentation for HUD Rural Gateway Peer-to-Peer Call
Application for Services
 Application for Services Please take a few minutes to complete this application package. Information provided must encompass all household members and their information must be presented at time of application.
+ Is welfare reformed yet?
 + Is welfare reformed yet? A retrospective on welfare, tax-credits and parental work policy Sophie Moullin Child and Family Policy Seminar, Columbia University & Teacher s College October 16 th, 2012 +
PUBLIC DISCLOSURE COMMUNITY REINVESTMENT ACT PERFORMANCE EVALUATION
 CapitalMark Bank & Trust CRA PUBLIC EVALUATION PUBLIC DISCLOSURE May 7, 2012 COMMUNITY REINVESTMENT ACT PERFORMANCE EVALUATION CapitalMark Bank &Trust 801 Broad Street Chattanooga, Tennessee 37402 RSSD
The State of the Safety Net in the Post- Welfare Reform Era
 The State of the Safety Net in the Post- Welfare Reform Era Marianne Bitler (UC Irvine) Hilary W. Hoynes (UC Davis) Paper prepared for Brookings Papers on Economic Activity, Sept 21 Motivation and Overview
GERMANTOWN-PARISTOWN NEIGHBORHOOD PROFILE
 GERMANTOWN-PARISTOWN NEIGHBORHOOD PROFILE July 2017 Prepared in Partnership Between the Kentucky State Data Center at the University of Louisville and Metro United Way Louisville s traditional urban neighborhoods
SOUTH LOUISVILLE NEIGHBORHOOD PROFILE
 SOUTH LOUISVILLE NEIGHBORHOOD PROFILE July 2017 Prepared in Partnership Between the Kentucky State Data Center at the University of Louisville and Metro United Way Louisville s traditional urban neighborhoods
The 2014 Rhode Island Standard of Need What it costs to live in Rhode Island and how work supports help families meet basic needs
 The 2014 Rhode Island Standard of Need What it costs to live in Rhode Island and how work supports help families meet basic needs www.economicprogressri.org www.economicprogressri.org 600 Mt. Pleasant
PUBLIC DISCLOSURE. June 4, 2012 COMMUNITY REINVESTMENT ACT PERFORMANCE EVALUATION. Utah Independent Bank RSSD #
 PUBLIC DISCLOSURE June 4, 2012 COMMUNITY REINVESTMENT ACT PERFORMANCE EVALUATION Utah Independent RSSD # 256179 55 South State Street Salina, Utah 84654 Federal Reserve of San Francisco 101 Market Street
SHELBY PARK NEIGHBORHOOD PROFILE
 SHELBY PARK NEIGHBORHOOD PROFILE July 2017 Prepared in Partnership Between the Kentucky State Data Center at the University of Louisville and Metro United Way Louisville s traditional urban neighborhoods
Working Our Way Out of Poverty
 Working Our Way Out of Poverty David Riemer Senior Fellow Community Advocates Public Policy Institute Milwaukee, WI NCSL Annual Conference Seattle, Washington August 3, 2015 d Working Our Way Out of Poverty
Workforce Innovation and Opportunity Act Eligibility
 Workforce Innovation and Opportunity Act Eligibility WIOA Low Income Eligibility WIOA Title 1 Authorization Federal: Workforce Investment Opportunity Act of 2014 State of Illinois: Department of Commerce
CHEROKEE-SENECA NEIGHBORHOOD PROFILE
 CHEROKEE-SENECA NEIGHBORHOOD PROFILE July 2017 Prepared in Partnership Between the Kentucky State Data Center at the University of Louisville and Metro United Way Louisville s traditional urban neighborhoods