Using Refundable Tax Credits to Help Lowincome
|
|
|
- Lynne Hampton
- 6 years ago
- Views:
Transcription


1 Using Refundable Tax Credits to Help Lowincome Taxpayers by Jon Forman Alfred P. Murrah Professor of Law University of Oklahoma Norman, Oklahoma & ATAX Fellow, UNSW University of Melbourne Melbourne, Australia August 16, 2011
2 Figure 1. Share of Household Income Percent Poorest 20% Middle 20% Richest 20% Free market After taxes & transfers 2
3 U.S.: Share of Household Income & Gini Index, 2005 Market income Disposable income Quintiles Lowest Second Middle Fourth Highest Gini Index
4 Rising Inequality 30 Figure 3. Ratio of Average Household Income of the Top 5 and 20 Percent of Households to the Average Household Income of the Bottom 20 Percent of Households, Top 20%/bottom 20% Top 5%/bottom 20% Ratio Year Source: U.S. Census Bureau, table IE-3, 4
5 Inequality and Redistribution Country Gini Before Gini After Poverty Before (50% of median income) Poverty After (50% of median income) Tax % GDP Social Spending %GDP Australia Canada Mexico n/a Sweden United Kingdom United States OECD
6 U.S. Average Annual Earnings of Full-time Workers, 2008 Doctors (Family & GP) $161,490 Lawyers 124,750 Economists 90,830 Nurses (RN) 65,130 Police 52,810 Auto mechanics 38,967 Secretaries 29,990 Garbage collectors 37,540 Orderlies 24,620 Waiters and waitresses 19,580 6
7 Distribution of Earnings, 2004 $400,000 $300,000 Earnings $200,000 $100,000 $15,600 $26,000 $36,000 $50,000 $84,000 $ Percentile 7
8 8
9 Figure 8. The Size Distribution of Wealth, 2004: Percentage Share of Wealth Held by Percent Top 1% Next 4% Next 5% Next 10% Top 20% nd 20% rd 20% Bottom 40% 9
10 60 Figure 10. Share of Household Income Percent Poorest 20% Middle 20% Richest 20% Egalitarian Free market After taxes & transfers Just? 10
11 Redistribution through Cash Transfers & Taxes Transfers to lowest quintile Taxes from lowest quintile Net transfers to lowest quintile Australia Canada Korea Sweden United Kingdom United States OECD
12 U.S. Standard Deductions, Personal Exemptions, and Simple Income Tax Thresholds, 2011 Married Unmarried individuals Heads of household with one child couples filing joint returns with two children Standard deduction $5,800 $ 8,500 $11,600 Personal exemptions $3,700 $ 7,400 $14,800 Simple income tax threshold $9,500 $15,900 $26,400 Rev. Proc , IRB 297, 12
13 Tax Rate Schedules for Various Taxpayers, 2011 Tax rate Rate bracket Unmarried individuals Heads of household with one child Married couples filing joint returns with two children 10 $0 to $8,500 $0 to $12,150 $0 to $17, $8,500 to $34,500 $12,150 to $46,250 $17,000 to $69, $34,500 to $83,600 $46,250 to $119,400 $69,000 to $139, $83,600 to $174,400 $119,400 to $193,350 $139,350 to $212, $174,400 to $379,150 $193,350 to $379,150 $212,300 to $379, Over $379,150 Over $379,150 Over $379,150 Rev. Proc , IRB 297, 13
14 Congressional Budget Office, Trends in Federal Tax Revenues and Rates (December 2, 2010), at 10, 14
, http://www.offthechartsblog.org /top-ten-tax-charts/.")
15 Center on Budget and Policy Priorities, Top Ten Tax Charts (April 14, 2011), /top-ten-tax-charts/. 15
16 Productivity and Real Income 20 Facts About U.S. Inequality that Everyone Should Know, 16
17 Rising Poverty U.S. Census Bureau, Income, Poverty, and Health Insurance Coverage in the United States: 2009, (Current Population Report No. P60-238, September 2010), 17
18 Earned Income Tax Credit (EITC) Increase Relatively new credit percentage for 3 or more qualifying children I.R.C. 32 Temporary increase , extended % of earnings (up from 40%) Maximum credit increased to $5,751 in 2011 Maximum AGI increased to $49,078 in 2011 Rev. Proc , IRB 297, 18
19 Child Tax Credit $1,000 per qualifying child I.R.C. 24 Temporary expansion of eligibility for refundable credit (15% earned income minus $3,000 threshold) More lower income families qualify: 2008 threshold amount was = $8, threshold amount = $3,000 19
20 Poverty Levels & Net Federal Tax Thresholds, 2010 Unmarried individual Single parent w/ 1 child Married couple w/ 2 children Married couple w/ 3 children 1. Poverty levels $10,830 $14,570 $22,050 $25, Simple income tax $9,350 $15,700 $26,000 $29,650 threshold (before credits) 3. Income tax $13,395 $32,380 $50,250 $60,567 threshold after credits 4. Employee payroll $0 $0 $0 $0 tax threshold 5. Combined income & payroll tax threshold $9,348 $25,717 $38,635 $43,788 20
21 Taxes at Poverty Level, 2010 Unmarried individual Single parent w/ 1 child Married couple w/ 2 children Married couple w/ 3 children 1. Poverty levels $10,830 $14,570 $22,050 $25, Income tax at -$453 -$4,450 -$7,712 -$8,554 poverty level (after credits) 3. Employee Social $829 $1,115 $1,687 $1,973 Security & Medicare tax at poverty level 4. Combined income & $376 -$3,335 -$6,025 -$6,581 payroll tax at poverty level 5. Combined tax as a % of income at poverty level 3.5% -22.9% -27.3% -25.5% 21
22 $15,000 Net Federal Tax Liabilities for Selected Households, 2010 Unmarried Individual $10,000 Head of Household, 1 Child Tax Liability $5,000 $0 Married Couple, 2 Children Married Couple, 3 Children -$5,000 -$10,000 Income 22
23 Figure 14. Income Tax Rates, Single Parent with Two Children and Earned Income Only, % 50% 40% Tax rate 30% 20% 10% 0% $0 $50,000 $100,000 $150,000 $200,000 Earned income 23
24 Figure 15. Social Security Tax Rates on Earned Income, % 50% 40% Tax rate 30% 20% 10% 0% $0 $50,000 $100,000 $150,000 $200,000 Earned income 24
25 60% Figure 17. Actual Tax Rate on Single Parents with Earned Income Only, % Effective tax rate 20% 0% -20% $0 $50,000 $100,000 $150,000 $200,000 Earned income -40% Effective tax rate Linear trend line 25
26 Outlays for the Principal Federal Benefit Programs in the United States (billions of dollars) 2009 actual 2015 estimate Social Security $678 $893 Medicare Medicaid Unemployment compensation Supplemental Security Income Earned income tax credit Child tax credit Making work pay tax credit <1 n/a Food assistance Family support Housing assistance 10 5 General retirement and disability 8 10 Federal employee retirement and disability Veterans benefits and services
27 Average Cumulative Tax Rates Confronting Low-to- Moderate-Income Families ($10k - $40k) Percent 100% 80% 60% 40% 20% 0% 35.9% Tax 58.8% Plus Food Stamps & Health 88.6% Plus TANF, Housing, Child Care Source: Adam Carasso & C. Eugene Steuerle, The True Tax Rates Confronting Families with Children, Tax Notes 253 (October 10, 2005). 27
28 Canada 2010 Canada Child Tax Benefit (CCTB) C$ for each child under age 18 National Child Benefit Supp. (NCBS) Up to C$ per month Child Disability Benefit (CDB) Up to C$ per month Universal Child Care Benefit (UCCB) C$1,200 per year for children under 6 28
29 Canada, cont. Working Income Tax Benefit (WITB) refundable tax credit of 25% of earned income in excess of C$3,000 maximum of C$925 for individuals (C$1,680 for single parents and couples) Refundable Goods and Services Tax Credit C$250 for taxpayer, spouse or partner C$131 for each child 29
30 United Kingdom 2010 Child Benefit 20.30/week oldest child; others Child Tax Credit 545 per year/family+ 2,300/child Working Tax Credit 1,920 per year per worker + 80% child care, up to 140/week for 1 child; 240/week for 2+ children 30
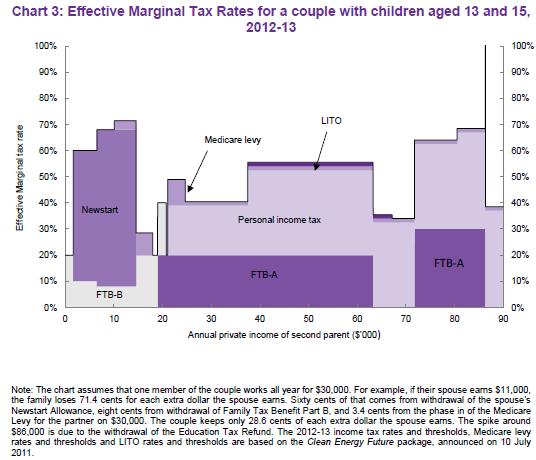
31 Australia 2010 Family Tax Benefit Part A: up to A$4, child under 13; A$6, child 13-15; etc. Part B: extra help for low-income single parents & families with one main income Baby Bonus $5,294, paid in 13 fortnightly installments Child Care Tax Rebate 50 percent of out-of-pocket child care 31
32 Australia 2011: Add a Carbon Tax, but: Triple the tax-free threshold to $18,200 Which will replace all but $445 of the low-income tax offset (LITO) Improve work low incomes Remove one million taxpayers Increase Government payments Pensions, allowances and Family Tax Benefit 32
33 Securing a Clean Energy Future 33
34 alia_ pdf 34
35 35
36 36
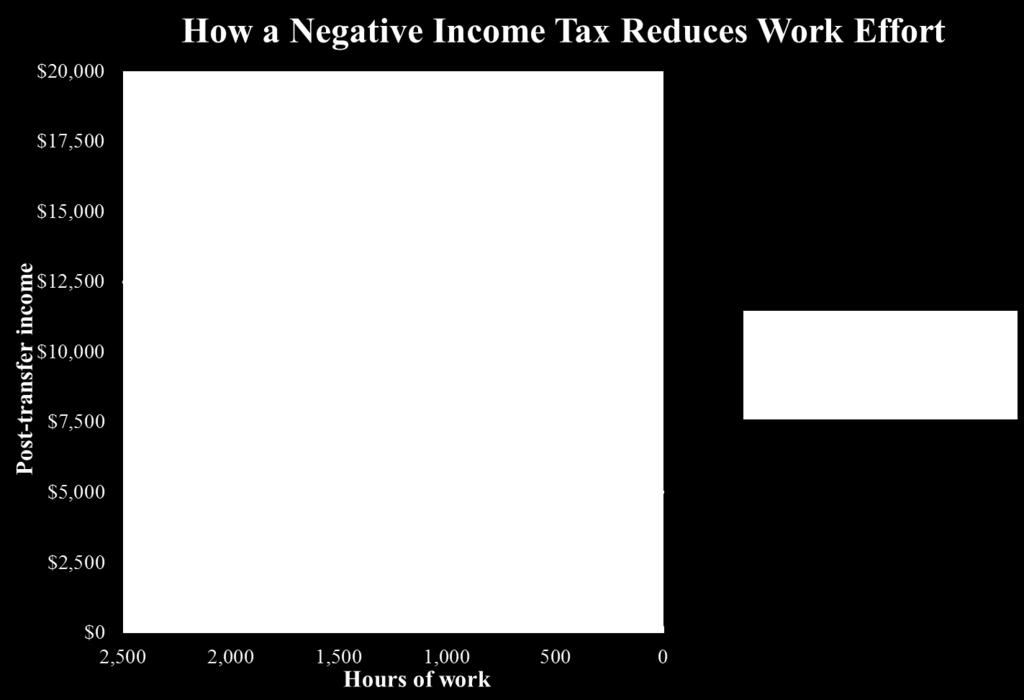
37 $25,000 Figure 12. How a 30 Percent Payroll Tax Can Reduce Work Effort Before: 2,000 hours, $20,000/year $20,000 After: 1,750 hours, $12,500/year Income after tax $15,000 $10,000 Income $10/hour Income after tax Utility curve 1 $5,000 Utility curve 2 $0 2,500 2,000 1,500 1, Hours of work 37
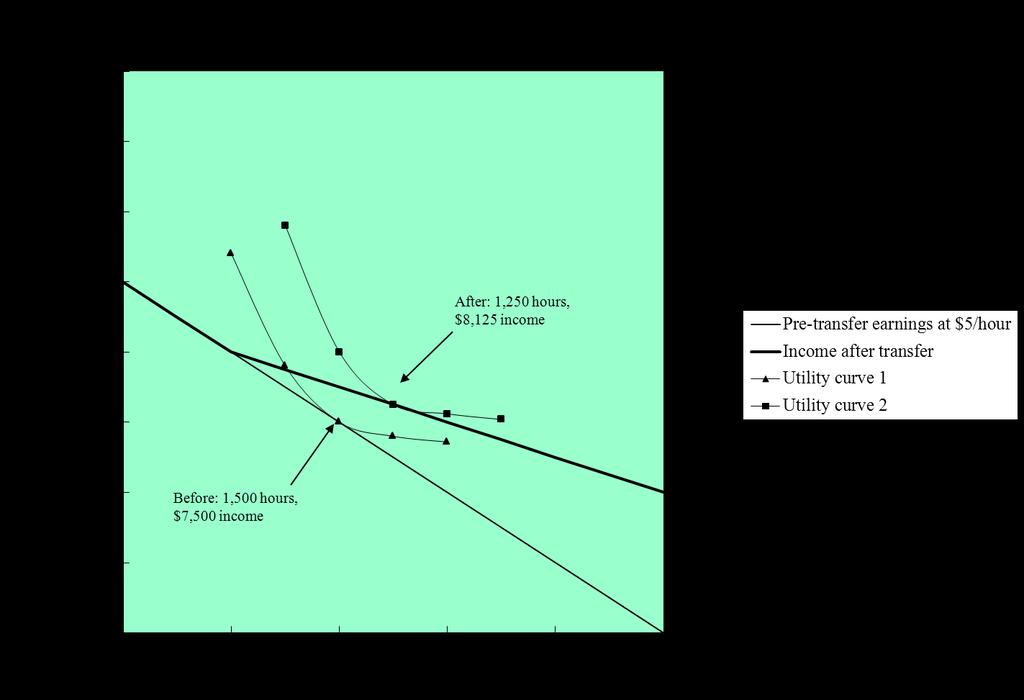
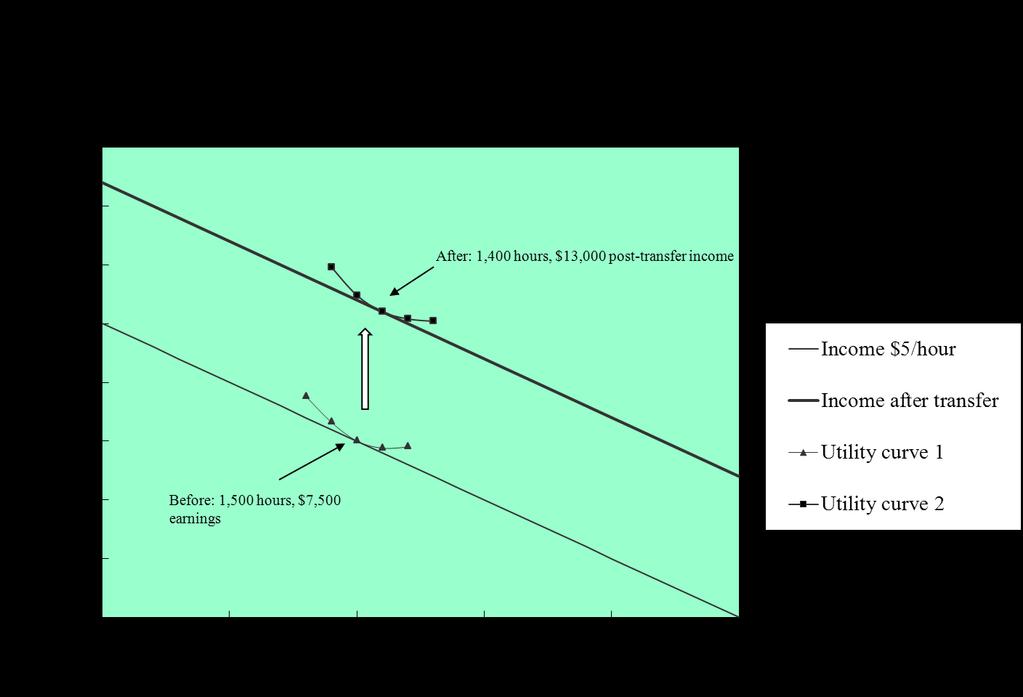
38 $20,000 Figure 21. How a Simple 50 Percent Earnings Subsidy Can Increase Work Effort $17,500 After: 1,750 hours, $13,125/year $15,000 Post-transfer Income $12,500 $10,000 $7,500 $5,000 Before: 1,500 hours, $7,500/year Income $5/hour Income after transfer Utility curve 1 Utility curve 2 $2,500 $0 2,500 2,000 1,500 1, Hours of work 38
39 39
40 How an Integrated Tax & Transfer System Would Affect a Single Parent with 2 Children ($2,000 Personal Tax Credits, $2,000 per Worker Credits, and 20 & 35% Tax Rates) Pre-transfer earnings Plus personal tax credits Plus worker credit Less tax imposed After-tax income 0 $6, $6,000 $10,000 $6,000 $2,000 $2,000 $16,000 $20,000 $6,000 $2,000 $4,000 $24,000 $50,000 $6,000 $2,000 $10,000 $48,000 $100,000 $6,000 $2,000 $27,500 $80,500 $200,000 $6,000 $2,000 $62,500 $145,500 40
41 $100,000 How an Integrated Tax and Transfer System Would Affect a Single Parent with Two Children ($2,000 Universal Grants, $2,000 per Worker Credits, and 20 and 35 Percent Tax Rates) Post-tax, post-transfer income $75,000 $50,000 $25,000 $0 $0 $25,000 $50,000 $75,000 $100,000 Pre-transfer earnings Pre-transfer earnings Post-tax, post transfer income 41


42 About the Author Jonathan Barry Forman ( Jon ) is the Alfred P. Murrah Professor of Law at the University of Oklahoma College of Law and the author of Making America Work (Washington, DC: Urban Institute Press, 2006). Jon was the Professor in Residence at the Internal Revenue Service Office of Chief Counsel, Washington, DC, for the academic year. Jon can be reached at jforman@ou.edu, , 42
Law and Economic Justice
 University of Oklahoma College of Law From the SelectedWorks of Jonathan B. Forman April 29, 2011 Law and Economic Justice JONATHAN B FORMAN, University of Oklahoma Available at: https://works.bepress.com/jonathan_forman/170/
New Tax Legislation for Low Income Taxpayers
 New Tax Legislation for Low Income Taxpayers ABA Tax Section May Meeting Committee on Low Income Taxpayers May 9, 2009 by Jon Forman Alfred P. Murrah Professor of Law University of Oklahoma jforman@ou.edu
Wealth Inequality in the United States (panelist)
") University of Oklahoma College of Law From the SelectedWorks of Jonathan B. Forman January 3, 2007 Wealth Inequality in the United States (panelist) JONATHAN B FORMAN, University of Oklahoma Available
University of Oklahoma College of Law From the SelectedWorks of Jonathan B. Forman January 3, 2007 Wealth Inequality in the United States (panelist) JONATHAN B FORMAN, University of Oklahoma Available
Should We Replace the Current Pension System with a Universal Pension System
 University of Oklahoma College of Law From the SelectedWorks of Jonathan B. Forman April 27, 2010 Should We Replace the Current Pension System with a Universal Pension System JONATHAN B FORMAN, University
Deficit Day to Bankruptcy Day
 Deficit Day to Bankruptcy Day April 2014 copies of this presentation can be found at Jan 1 Dec 31 Deficit Day! How much government spending do people fund with their tax dollars? Top 1% 56 days 2% to 5%
The Distribution of Federal Taxes, Jeffrey Rohaly
 www.taxpolicycenter.org The Distribution of Federal Taxes, 2008 11 Jeffrey Rohaly Overall, the federal tax system is highly progressive. On average, households with higher incomes pay taxes that are a
CHARTS MAY 10, 2018 WASHINGTON, D.C.
 CHARTS MAY 10, 2018 WASHINGTON, D.C. Peterson Foundation charts are available online and are free to use without modification for educational and editorial use, with credit to the Peter G. Peterson Foundation
Economics 001 Principles of Microeconomics
 Economics 001 Principles of Microeconomics Professor Arik Levinson Lecture 23 poverty and inequality redistribution Lorenz curves leaky buckets Poverty Lyndon Johnson's "War on Poverty" Thrifty food plan
CHARTS MAY 23, 2017 WASHINGTON, D.C.
 CHARTS MAY 23, 2017 WASHINGTON, D.C. Peterson Foundation charts are available online and are free to use without modification for educational and editorial use, with credit to the Peter G. Peterson Foundation
Chapter 3: American Free Enterprise Section 4
 Chapter 3: American Free Enterprise Section 4 Objectives 1. Explain the U.S. political debate on ways to fight poverty. 2. Identify the main programs through which the government redistributes income.
Copyright 2011 Pearson Education, Inc. Publishing as Longman
 Chapter 18: Social Welfare Policymaking Types of Social Welfare Policies Income, Poverty, and Public Policy Helping the Poor? Social Policy and the Needy Social Security: Living on Borrowed Time Social
Poverty, Inequality, and Discrimination. Wen-Jui Han New York University
 Poverty, Inequality, and Discrimination Wen-Jui Han New York University Share of poor population below 50% of the poverty line 50.0% 45.0% 40.0% 35.0% 30.0% 25.0% 1975 1976 1977 1978 1979 1980 1981
Tax Reform and Deficit Reduction
 Tax Reform and Deficit Reduction Professor Jon Forman University of Oklahoma Slides for a panel of the Comm. on Tax Policy and Simplification ABA Section of Taxation Washington, DC May 6, 2011 Overview
PUBLIC BENEFITS: EASING POVERTY AND ENSURING MEDICAL COVERAGE By Arloc Sherman
 820 First Street NE, Suite 510 Washington, DC 20002 Tel: 202-408-1080 Fax: 202-408-1056 center@cbpp.org www.cbpp.org Revised August 17, 2005 PUBLIC BENEFITS: EASING POVERTY AND ENSURING MEDICAL COVERAGE
A Comparison of the Tax Burden on Labor in the OECD, 2017
 FISCAL FACT No. 557 Aug. 2017 A Comparison of the Tax Burden on Labor in the OECD, 2017 Jose Trejos Research Assistant Kyle Pomerleau Economist, Director of Federal Projects Key Findings: Average wage
Making Universal Health Care Work
 University of Oklahoma College of Law From the SelectedWorks of Jonathan B. Forman April 28, 2006 Making Universal Health Care Work JONATHAN B FORMAN, University of Oklahoma Available at: https://works.bepress.com/jonathan_forman/200/
Income Inequality and Poverty
 20 Income Inequality and Poverty PowerPoint Slides prepared by: Andreea CHIRITESCU Eastern Illinois University 1 The Measurement of Inequality Questions of measurement: How much inequality is there in
MORE THAN HALF OF BLACK AND HISPANIC FAMILIES WOULD NOT BENEFIT FROM BUSH TAX PLAN. by Isaac Shapiro, Allen Dupree and James Sly
 820 First Street, NE, Suite 510, Washington, DC 20002 Tel: 202-408-1080 Fax: 202-408-1056 center@cbpp.org http://www.cbpp.org February 15, 2001 MORE THAN HALF OF BLACK AND HISPANIC FAMILIES WOULD NOT BENEFIT
Labor-Force Participation Rate for Men and Women, Age 25 to 54, and Mothers, 1948 to 2005
 FIGURE 1.1 Labor-Force Participation Rate for Men and Women, Age 25 to 54, and Mothers, 1948 to 25 Percentage 1 9 8 7 6 5 4 3 2 1 1948 1955 1965 1975 Year 1985 1995 25 Men 25 to 54 Women 25 to 54 Women
Income Taxes and Tax Rates for Sample Families, 2006 Greg Leiserson. December 2006
 Income Taxes and Tax Rates for Sample Families, 2006 Greg Leiserson December 2006 This article examines how much income tax families pay in different situations, as well as the effective marginal tax rates
PRELIMINARY ANALYSIS OF THE FAMILY FAIRNESS AND OPPORTUNITY TAX REFORM ACT
 PRELIMINARY ANALYSIS OF THE FAMILY FAIRNESS AND OPPORTUNITY TAX REFORM ACT Len Burman, Elaine Maag, Georgia Ivsin, and Jeff Rohaly 1 Urban-Brookings Tax Policy Center March 4, 2014 On October 30, 2013,
POLICY BRIEF. Tax legislation enacted in 2001 increased the value of the Child Tax
 The Brookings Institution POLICY BRIEF July 2003 Welfare Reform & Beyond #26 Related Brookings Resources One Percent for the Kids Isabel V. Sawhill, ed. Brookings Institution Press (2003) Welfare Reform
Energy Refund Program through State Human Service Agencies
 820 First Street NE, Suite 510 Washington, DC 20002 Tel: 202-408-1080 Fax: 202-408-1056 center@cbpp.org www.cbpp.org Updated October 7, 2009 HOW LOW-INCOME CONSUMERS FARE IN THE HOUSE CLIMATE BILL By Dorothy
Measuring Suburban Poverty: Concepts and Data Sources Hofstra University September 26, 2013
 Measuring Suburban Poverty: Concepts and Data Sources Hofstra University September 26, 2013 Trudi Renwick Poverty Statistics Branch Social, Economic and Housing Statistics Division U.S. Bureau of the Census
Everything You Always Wanted to Know about Poverty in Maine (but may not have thought to ask)
") Everything You Always Wanted to Know about Poverty in Maine (but may not have thought to ask) Teaching and Working in a Diverse World: The Impact of Poverty October 22nd, 2009 University of Maine, Farmington
Everything You Always Wanted to Know about Poverty in Maine (but may not have thought to ask) Teaching and Working in a Diverse World: The Impact of Poverty October 22nd, 2009 University of Maine, Farmington
Removing the Legal Impediments to Offering Lifetime Annuities in Pension Plans
 Removing the Legal Impediments to Offering Lifetime Annuities in Pension Plans Professor Jon Forman University of Oklahoma College of Law for Achieving Better Retirement Outcomes: Solutions for a Modern
New Analysis Finds GOP Tax Plan would Give Richest One Percent of CT Residents $125,380 More Per Year on Average than Obama s Approach
 NEWS RELEASE FOR IMMEDIATE RELEASE Wednesday, June 20, 2012 33 Whitney Avenue New Haven, CT 06510 Voice: 203-498-4240 Fax: 203-498-4242 www.ctvoices.org Contact: Wade Gibson, Senior Policy Fellow, CT Voices
Effective Anti-poverty Programs in the U.S
 Effective Anti-poverty Programs in the U.S Hilary Hoynes, University of California, Davis SIEPR Policy Forum on Reducing Global Poverty May 2008 1 Roadmap of talk Poverty: Definitions Poverty: Facts Government
The Child and Dependent Care Credit: Impact of Selected Policy Options
 The Child and Dependent Care Credit: Impact of Selected Policy Options Margot L. Crandall-Hollick Specialist in Public Finance Gene Falk Specialist in Social Policy December 5, 2017 Congressional Research
Income and Poverty Among Older Americans in 2008
 Income and Poverty Among Older Americans in 2008 Patrick Purcell Specialist in Income Security October 2, 2009 Congressional Research Service CRS Report for Congress Prepared for Members and Committees
Poverty, Inequality and the Welfare State
 Poverty, Inequality and the Welfare State Lectures 3 and 4 Le Grand, Propper and Smith (2008): Chp 9 Stiglitz (2000): Chp 14 Connolly and Munro (1999): Chp 14, 15, 16, 17 Outline Income and wealth defined
Updated Tables for Using a VAT to Reform the Income Tax
 Updated Tables for Using a VAT to Reform the Income Tax Eric Toder, Jim Nunns, and Joseph Rosenberg Urban-Brookings Tax Policy Center November 20, 2013 In 100 Million Unnecessary Returns, Michael Graetz,
Senator Kerry s Tax Proposals. Leonard E. Burman and Jeffrey Rohaly 1 Revised July 23, 2004
 Senator Kerry s Tax Proposals Leonard E. Burman and Jeffrey Rohaly 1 Revised July 23, 2004 This note provides a very preliminary summary and distributional analysis of Senator Kerry s tax proposals. Some
Entitlement Reform and the Future of Pensions
 Entitlement Reform and the Future of Pensions Conference on Reimagining Pensions: The Next 40 Years The Wharton School May 1, 2014 C. Eugene Steuerle Benjamin H. Harris Pamela J. Perun Basic Theme Reform
Aging Seminar Series:
 Aging Seminar Series: Income and Wealth of Older Americans Domestic Social Policy Division Congressional Research Service November 19, 2008 Introduction Aging Seminar Series Focus on important issues regarding
Selected Charts on the Long-Term Fiscal Challenges of the United States
 Selected Charts on the Long-Term Fiscal Challenges of the United States December 213 Debt Held by the Public U.S. debt is on an unsustainable path under many scenarios 2 175 15 Percentage of GDP Actual
AN OPTION TO REFORM THE INCOME TAX TREATMENT OF FAMILIES AND WORK
 AN OPTION TO REFORM THE INCOME TAX TREATMENT OF FAMILIES AND WORK Jim Nunns, Elaine Maag, and Hang Nguyen December 5, 2016 ABSTRACT The income tax provisions related to families and work filing status,
How the Census Bureau Measures Poverty
 How the Census Bureau Measures Poverty Following the Office of Management and Budget's (OMB) Statistical Policy Directive 14, the Census Bureau uses a set of money income thresholds that vary by family
Understanding Income Distribution and Poverty
 Understanding Distribution and Poverty : Understanding the Lingo market income: quantifies total before-tax income paid to factor markets from the market (i.e. wages, interest, rent, and profit) total
Individual Income Tax Planning
 18401 Murdock Circle Suite B Port Charlotte, FL 33948 941-627-4774 linda.cross@raymondjames.com www.raymondjames.com/sommervillegroup 2012 Key Numbers June 2012 Individual Income Tax Planning Adoption
e4 Brokerage, LLC th St. South Suite C Fargo, ND
 e4 Brokerage, LLC 2280 45th St. South Suite C Fargo, ND 58104 701-356-1270 866-356-3203 sbergee@e4brokerage.com www.e4brokerage.com 2017 Tax Facts Guide 1/01/2017 Page 1 of 28, see disclaimer on final
I S S U E B R I E F PUBLIC POLICY INSTITUTE PPI PRESIDENT BUSH S TAX PLAN: IMPACTS ON AGE AND INCOME GROUPS
 PPI PUBLIC POLICY INSTITUTE PRESIDENT BUSH S TAX PLAN: IMPACTS ON AGE AND INCOME GROUPS I S S U E B R I E F Introduction President George W. Bush fulfilled a 2000 campaign promise by signing the $1.35
How Socio Economic Policies Affect Children
 How Socio Economic Policies Affect Children (What child advocates need to know about state fiscal policy and taxes) Kay Monaco, J.D. Poor children have: Greater risk for serious and chronic health problems
The Knowledge Problem
 The Knowledge Problem March 28, 2014 copies of this presentation can be found at www.antonydavies.org www.antonydavies.org 1 The Players and the Goals In this experiment, each of you is a member of a community.
Durability and fiscal sustainability: Federation, health and reform of the tax system
 Durability and fiscal sustainability: Federation, health and reform of the tax system AHHA Think Tank, 16 March 2015 Miranda Stewart Professor and Director Tax and Transfer Policy Institute Tax and Transfer
Test Yourself: Income, Transfers and Taxes
 Test Yourself: Income, Transfers and Taxes I wish it need not have happened in my time," said Frodo. "So do I," said Gandalf, "and so do all who live to see such times. But that is not for them to decide.
Rural America Benefits From Expanded Use of the Federal Tax Code for Income Support
 Rural America Benefits From Expanded Use of the Federal Tax Code for Income Support Tracey Farrigan, tfarrigan@ers.usda.gov Ron Durst, rdurst@ers.usda.gov 38 Over the past two decades, the Federal tax
14 Poverty and Economic Inequality
 CHAPTER 14 POVERTY AND ECONOMIC INEQUALITY 281 14 Poverty and Economic Inequality Figure 14.1 Occupying Wall Street On September 17, 2011, Occupy Wall Street began in New York City s Wall Street financial
QUESTIONS AND ANSWERS ABOUT THE EARNED INCOME TAX CREDIT TAX YEAR 2010
 QUESTIONS AND ANSWERS ABOUT THE EARNED INCOME TAX CREDIT TAX YEAR 2010 The federal Earned Income Tax Credit is designed to boost the wages of working families. The following questions and answers will
CRS Report for Congress Received through the CRS Web
 Order Code RL33387 CRS Report for Congress Received through the CRS Web Topics in Aging: Income of Americans Age 65 and Older, 1969 to 2004 April 21, 2006 Patrick Purcell Specialist in Social Legislation
CBO MEMORANDUM ESTIMATES OF FEDERAL TAX LIABILITIES FOR INDIVIDUALS AND FAMILIES BY INCOME CATEGORY AND FAMILY TYPE FOR 1995 AND 1999.
 CBO MEMORANDUM ESTIMATES OF FEDERAL TAX LIABILITIES FOR INDIVIDUALS AND FAMILIES BY INCOME CATEGORY AND FAMILY TYPE FOR 1995 AND 1999 May 1998 PESTHBÖTIÖK 8TATCMEMT A Appfoyadl far prabkei r.tea» K> CONGRESSIONAL
U.S. Income Inequality: It s Not So Bad
 Volume 14 Issue 1 Spring 2010 A n E c o n o m i c E d u c at i o n N e w s l e t t e r f r o m t h e F e d e r a l R e s e r v e B a n k S t. L o u i s 2005 istockphoto; Eliza Snow U.S. Income Inequality:
The Redistributive State: The Allocation of Government Benefits, Services, and Taxes in the United States
 September 15, 2015 The Redistributive State: The Allocation of Government Benefits, Services, and Taxes in the United States Robert Rector Introduction Each year, families and individuals pay taxes to
ISSUE. Evaluate several options for expanding membership eligibility for North Carolina s
 To: Professor Gene Nichol From: Jared Elosta Re: Options for Expanding EITC Eligibility in North Carolina Date: June 11, 2010 ISSUE Evaluate several options for expanding membership eligibility for North
Figure 1.1 Inequality, Economic Growth, Employment Growth, and Real Income Growth in Sweden, Germany, and the United States, 1980s and 1990s
 Figure 1.1 Inequality, Economic Growth, Employment Growth, and Real Income Growth in Sweden, Germany, and the United States, 198s and 199s Posttax-Posttransfer Individual Earnings Inequality Household
Income inequality an insufficient consumption in China. Li Gan Southwestern University of Finance and Economics Texas A&M University
 Income inequality an insufficient consumption in China Li Gan Southwestern University of Finance and Economics Texas A&M University 目 1 An Introduction of CHFS Contents 2 3 Inequality and Consumption A
Income inequality and mobility in Australia over the last decade
 Income inequality and mobility in Australia over the last decade Roger Wilkins Meeting of National Economic Research Organisations, OECD Headquarters, 18 June 2012 1993-94 1994-95 1995-96 1996-97 1997-98
Income and Wealth Inequality A Lack of Equity
 Income and Wealth Inequality A Lack of Equity Increasing inequality in the distribution of income and wealth is an example of market failure. Resources are not distributed equitably. Income Income is a
Topic 11: Measuring Inequality and Poverty
 Topic 11: Measuring Inequality and Poverty Economic well-being (utility) is distributed unequally across the population because income and wealth are distributed unequally. Inequality is measured by the
The Effects of the Candidates Tax Plans on Households at Different Income Levels: Examples
 CTJ October 29, 2008 Citizens for Tax Justice Contact: Bob McIntyre (202) 299-1066 x22 The Effects of the Candidates Tax Plans on Households at Different Income Levels: Examples Presidential candidates
SK Wealth Management, LLC November 18, 2014
 SK Wealth Management, LLC Jason Archambault, CFP, CPA/PFS Managing Member 55 Dorrance Street Providence, RI 02903 401-331-1575 jarchambault@skwealth.com http://skwealth.com 2015 Key Numbers SKWealth clients
The Role of Annuities in Retirement Plans
 The Role of Annuities in Retirement Plans Professor Jon Forman University of Oklahoma College of Law for the National Association of Insurance Commissioners (NAIC) Center for Insurance Policy and Research
Tax Policy for Low-Income Families: The Earned Income Tax Credit
 Tax Policy for Low-Income Families: The Earned Income Tax Credit Hilary Hoynes, University of California, Davis Tax Policy in the Obama Era January 30, 2009 1 Overview and Issues In the last 15 years,
Notes and Definitions Numbers in the text, tables, and figures may not add up to totals because of rounding. Dollar amounts are generally rounded to t
 CONGRESS OF THE UNITED STATES CONGRESSIONAL BUDGET OFFICE The Distribution of Household Income and Federal Taxes, 2013 Percent 70 60 50 Shares of Before-Tax Income and Federal Taxes, by Before-Tax Income
THE UNITED STATES 2007
 THE UNITED STATES 2007 1. Overview of the system Generally, unemployed persons can receive unemployment compensation for a maximum of 26 weeks. There are a number of provisions for low income families.
Federal Minimum Wage, Tax-Transfer Earnings Supplements, and Poverty
 Federal Minimum Wage, Tax-Transfer Earnings Supplements, and Poverty -name redacted- Specialist in Social Policy -name redacted- Specialist in Social Policy -name redacted- Specialist in Labor Economics
HOW DO PHASEOUTS WORK?
 How do phaseouts of tax provisions affect taxpayers? Many preferences in the tax code phase out for high-income taxpayers their value falls as income rises. Phaseouts narrow the focus of tax benefits to
Chapter 7. Government Subsidies and Income Support for the Poor
 Chapter 7 Government Subsidies and Income Support for the Poor Copyright 2002 Thomson Learning, Inc. Thomson Learning is a trademark used herein under license. ALL RIGHTS RESERVED. Instructors of classes
Topics in Aging: Income and Poverty Among Older Americans in 2004
 Cornell University ILR School DigitalCommons@ILR Congressional Research Service (CRS) Reports and Issue Briefs Federal Publications 11-1-2005 Topics in Aging: Income and Poverty Among Older Americans in
Intermediate Macroeconomic Theory. Costas Azariadis. Costas Azariadis. Lecture 3: Productivity and Labor
 Lecture 3: Productivity and Labor 1. THE ISSUES a)productivity most important determinant of living standards in the long run 2008 U.S. GDP per worker employed (current $) $100,000 per worker per year
Introduction to Taxes and Transfers: Income Distribution, Poverty, Taxes and Transfers. 131 Undergraduate Public Economics Emmanuel Saez UC Berkeley
 Introduction to Taxes and Transfers: Income Distribution, Poverty, Taxes and Transfers 131 Undergraduate Public Economics Emmanuel Saez UC Berkeley 1 REMINDER: Two General Rules for Government Intervention
THIRD EDITION. ECONOMICS and. MICROECONOMICS Paul Krugman Robin Wells. Chapter 18. The Economics of the Welfare State
 THIRD EDITION ECONOMICS and MICROECONOMICS Paul Krugman Robin Wells Chapter 18 The Economics of the Welfare State WHAT YOU WILL LEARN IN THIS CHAPTER What the welfare state is and the rationale for it
Key Facts: Premium Tax Credit
 Updated September 13, 2018 Key Facts: Premium Tax Credit As a result of the Affordable Care Act (ACA), millions of Americans are eligible for a premium tax credit that helps them pay for health coverage.
Redistribution under OASDI: How Much and to Whom?
 9 Redistribution under OASDI: How Much and to Whom? Lee Cohen, Eugene Steuerle, and Adam Carasso T his chapter presents the results from a study of redistribution in the Social Security program under current
2019 Tax Brackets. FISCAL FACT No. 624 Nov Amir El-Sibaie
 FISCAL FACT No. 624 Nov. 2018 2019 Tax Brackets Amir El-Sibaie Economist On a yearly basis the IRS adjusts more than 40 tax provisions for inflation. This is done to prevent what is called bracket creep,
How Do Lifetime Social Security Benefits and Taxes Differ by Earnings?
 P R O G R A M O N R E T I R E M E N T P O L I C Y How Do Lifetime Social Security Benefits and Taxes Differ by Earnings? Projections from Urban Institute s DYNASIM Model C. Eugene Steuerle, Damir Cosic,
BTC Reports. Executive Summary. NC Justice Center. North Carolina Budget & Tax Center. P.O. Box Raleigh, NC
 NC Justice Center Opportunity and Prosperity for All BTC Reports Vol 16 No 8 August 2010 THE NEWSLETTER OF THE N C B U D G E T & T A X C E N T E R North Carolina Budget & Tax Center P.O. Box 28068 Raleigh,
Chapter 9 p.557 Deductions & Credits
 Chapter 9 p.557 Deductions & Credits Taxation of business enterprises is on the basis of the net accrual to wealth. This necessitates enabling deductions for the cost/expenses of producing the income derived
Portland Harbor Group of Raymond James January 08, 2018
 Portland Harbor Group of Raymond James Claire Cooney, CFP Financial Planning Associate Two Portland Square Suite 701 Portland, ME 04101 207-771-1815 claire.cooney@raymondjames.com www.portlandharborgroup.com
Income and Poverty Among Older Americans in 2006
 Cornell University ILR School DigitalCommons@ILR Federal Publications Key Workplace Documents September 2007 Income and Poverty Among Older Americans in 2006 Patrick Purcell Congressional Research Service,
The Personal Income Tax : e Tax Rate Structure
 The Personal Income Tax : e Tax Rate Structure The federal personal income tax from 1987 to 2001, had three tax brackets officially. For example, for 2000, income up to $30,004 was taxed at 17 percent,
Make Tax Time Pay! New Developments 2009
 Make Tax Time Pay! New Developments 2009 Presentation by: John Wancheck Organization: Center on Budget and Policy Priorities Website: www.cbpp.org/eic2008 Phone: (202) 408-1080 Email: wancheck@cbpp.org
TOOLS AND TECHNIQUES OF INCOME TAX PLANNING 3 RD EDITION
 TOOLS AND TECHNIQUES OF INCOME TAX PLANNING 3 RD EDITION 2012 Supplement Chapter 2 p. 11 In 2012 the income threshold for married person filing jointly is $19,500 (if one spouse is blind or elderly 20,650;
Modelling of the Federal Budget Personal Income Tax Measures
 Modelling of the 2018-19 Federal Budget Personal Income Tax Measures Associate Professor Ben Phillips, Richard Webster, Professor Matthew Gray ANU Centre for Social Research and Methods 10 May 2018 CSRM
Income Distribution and Poverty
 C H A P T E R 15 Income Distribution and Poverty Prepared by: Fernando Quijano and Yvonn Quijano Income Distribution and Poverty This chapter focuses on distribution. Why do some people get more than others?
OVERALL FEDERAL TAX BURDEN ON MOST FAMILIES AT LOWEST LEVELS SINCE AT LEAST Income Taxes for Median Family of Four at Lowest Level Since 1957
 820 First Street, NE, Suite 510, Washington, DC 20002 Tel: 202-408-1080 Fax: 202-408-1056 center@cbpp.org http://www.cbpp.org Revised April 10, 200 OVERALL FEDERAL TAX BURDEN ON MOST FAMILIES AT LOWEST
Our Tax System Revealed. Lee R. Nackman, Ph.D. October 24, 2018
 Our Tax System Revealed Lee R. Nackman, Ph.D. October 24, 2018!1 Topics Tax System Desiderata Follow the Money! Social Security Payroll Taxes Sales Taxes Federal Individual Income Taxes The Big Picture:
Notes and Definitions Numbers in the text, tables, and figures may not add up to totals because of rounding. Dollar amounts are generally rounded to t
 CONGRESS OF THE UNITED STATES CONGRESSIONAL BUDGET OFFICE The Distribution of Household Income and Federal Taxes, 2011 Percent 70 60 Shares of Before-Tax Income and Federal Taxes, by Before-Tax Income
Dual-eligible beneficiaries S E C T I O N
 Dual-eligible beneficiaries S E C T I O N Chart 4-1. Dual-eligible beneficiaries account for a disproportionate share of Medicare spending, 2010 Percent of FFS beneficiaries Dual eligible 19% Percent
ACTION ALERT. DATE: December 18, 2012 TO: Concerned Parties FROM: Hilary O. Shelton, Director, NAACP Washington Bureau
 WASHINGTON BUREAU NATIONAL ASSOCIATION FOR THE ADVANCEMENT OF COLORED PEOPLE 1156 15 TH STREET, NW SUITE 915 WASHINGTON, DC 20005 P (202) 463-2940 F (202) 463-2953 E-MAIL: WASHINGTONBUREAU@NAACPNET.ORG
The Tax Relief, Unemployment Insurance Reauthorization, and Job Creation Act of 2010: A Win for Our Economy, Jobs, and Working Families
 The Tax Relief, Unemployment Insurance Reauthorization, and Job Creation Act of 2010: A Win for Our Economy, Jobs, and Working Families Framework on Tax Cuts, Unemployment Insurance and Jobs The Tax Relief,
Inequality: Why should we care?
 Inequality: Why should we care? Byron Gangnes Professor of Economics Senior Research Fellow, UHERO University of Hawaii at Manoa VLI February 2019 Hawaii Island Economic inequality Inequality a central
Tax Policy Issues and Options
 Tax Policy Issues and Options THE URBAN INSTITUTE No. 1, June 2001 Designing Tax Cuts to Benefit Low- Families Frank J. Sammartino The most important feature of tax relief, if it is to benefit lowincome
Tax Incidence Analysis First & Second Omnibus Tax Bills
 Tax Incidence Analysis Prepared by the Tax Research Division, Minnesota Department of Revenue June 18, 2014 2014 First & Second Omnibus Tax Bills Chapter 150 (H.F. 1777 as enacted on March 21, 2014) and
THE TAX POLICY. BRIEFING BOOK A Citizens' Guide for the 2008 Election and Beyond
 BACKGROUND: THE NUMBERS I-1-1 THE TAX POLICY BRIEFING BOOK A Citizens' Guide for the 2008 Election and Beyond THE NUMBERS What are the federal government s sources of revenue?... I-1-1 How does the federal
Comparison of the Coalition Federal Budget Income Tax Measures and the Labor Proposal
 Comparison of the Coalition 2018-19 Federal Budget Income Tax Measures and the Labor Proposal Associate Professor Ben Phillips, Richard Webster, Professor Matthew Gray ANU Centre for Social Research and
Topics in Aging: Income and Poverty Among Older Americans in 2005
 Cornell University ILR School DigitalCommons@ILR Congressional Research Service (CRS) Reports and Issue Briefs Federal Publications September 2006 Topics in Aging: Income and Poverty Among Older Americans
A Consistent Data Series to Evaluate Growth and Inequality in the National Accounts
 A Consistent Data Series to Evaluate Growth and Inequality in the National Accounts David Johnson with D. Fixler, A. Craig, K. Furlong, Bureau of Economic Analysis Frontiers of Measuring Household Economic
Unemployment. What are the different types of unemployment? How are unemployment rates determined? What is full employment?
 Unemployment What are the different types of unemployment? How are unemployment rates determined? What is full employment? Types of Unemployment Frictional Unemployment Occurs when people change jobs,
UNEMPLOYMENT RATES IMPROVING IN THE DISTRICT By Caitlin Biegler
 An Affiliate of the Center on Budget and Policy Priorities 820 First Street NE, Suite 460 Washington, DC 20002 (202) 408-1080 Fax (202) 408-8173 www.dcfpi.org UNEMPLOYMENT RATES IMPROVING IN THE DISTRICT