The Knowledge Problem
|
|
|
- Bertram James Mills
- 5 years ago
- Views:
Transcription
1 The Knowledge Problem March 28, 2014 copies of this presentation can be found at 1
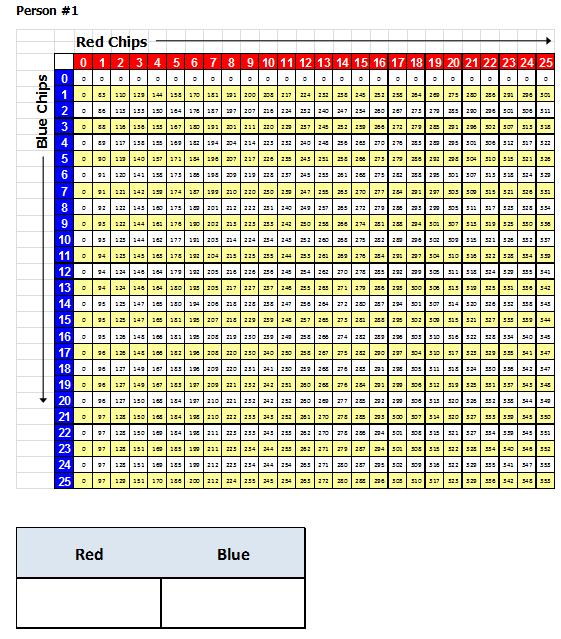
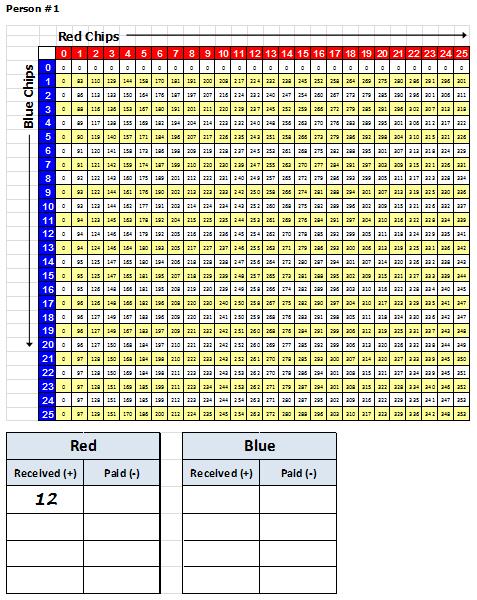
2 The Players and the Goals In this experiment, each of you is a member of a community. You have skills with which your produce either 12 units of Red or 12 units of Blue stuff. 2
3 The Players and the Goals You eat both Red and Blue stuff to gain happiness. The more you eat, the happier you are. 3
4 Blue Chips The Players and the Goals Suppose you have 5 Red chips and 4 Blue chips. Your happiness is 123. Red Chips
5 Controlled Economy A benevolent dictator will take the stuff that the people produce and distribute it among the people. The dictator s goal is to maximize the sum of the people s happinesses. 5
6 6
7 Chaos Chaos Free to act Free market Free to act provided you don t harm others All of the stuff you produced is at the front of the room. Come and take what you want. 7
8 Free Market Free to act but you may not violate others property rights. Each person starts with either 12 Blue stuff or 12 Red stuff. You may trade with other people in an attempt to maximize your happiness. 8
9 9
10 Results 10
11 Total Happiness (by economic system) Command Economy Chaos Free Economy 11
12 Total Happiness (by economic system) Command Economy Chaos Free Economy Ideal 12
13 Gini Inequality Index Ukraine Mexico U.S Haiti
14 Command Economy Gini Inequality Index: People Arranged in Order of Happiness (Command Economy) 14
15 Chaos Gini Inequality Index: People Arranged in Order of Happiness (Chaos) 15
16 Free Economy Gini Inequality Index: People Arranged in Order of Happiness (Free Economy) 16
17 Conclusion The knowledge problem prevents the benevolent dictator from achieving the best outcome. 17
18 Conclusion The knowledge problem prevents the benevolent dictator from achieving the best outcome. Corollary Government does have a role to play in protecting property rights. 18
19 Is the experiment a fair representation of the real world? 19
20 Experiment versus Real World Information Experiment: The dictator didn t know what made people happy. Real World: The dictator won t know what makes people happy. Changing Information Experiment: People s preferences were constant. Real World: People s preferences are constantly changing. 20
21 Experiment versus Real World Decisions Experiment: The dictator had to make under 60 decisions in ten minutes 6 per minute. Real World: A dictator would have to make 300 m. x (maybe ten?) = 3 billion decisions daily 2 million per minute. Quantifiability Experiment: The preference data was quantifiable. Real World: Most preferences aren t easily quantifiable. 21
22 Experiment versus Real World Motivation Experiment: The dictator was altruistic. Real World: Good luck with that. Conclusion It should be easier for the dictator to satisfy people s wants in the experiment than in the real world. 22
23 Assumptions About Economic Freedom Command Market Assumptions: Left to themselves, people will consolidate power, stifle competition, exploit each other, and confiscate wealth. Free Market Assumptions: Left to themselves, people will disseminate power, promote competition, cooperate with each other, and create wealth. 23
24 More badness If the command market assumptions were correct, then we would expect to see patterns in the data like this More freedom Freedom 24
25 Less goodness and this. More freedom Freedom 25

26 Economic Freedom of North America Economic Freedom of the World Size of government Government consumption Transfers and subsidies Social Security payments Takings and discriminatory taxes Tax revenue Top marginal income tax rate and threshold Other tax revenues Labor market freedom Minimum wage Public sector employment Union density 26

27 For each year, divide the states into two groups 25 least free 25 most free 27

28 Economic Freedom of North America States Always Among the 25 Least Free States:
29 Economic Freedom of North America States Always Among the 25 Most Free States:

30 Economic Freedom of North America States That Switched Groups At Least Once: Average state switched groups 3 times. 30

31 Employment 31
32 Economic Freedom of North America (all levels of government) Data Source: Census Bureau, Statistical Abstract of the United States; Ashby, Bueno, and McMahon, Economic Freedom of North America 2011, Fraser Institute 32
33 Economic Freedom of North America (all levels of government) Data Source: Census Bureau, Statistical Abstract of the United States; Ashby, Bueno, and McMahon, Economic Freedom of North America 2011, Fraser Institute 33
34 Economic Freedom of North America (all levels of government) Data Source: Census Bureau, Statistical Abstract of the United States; Ashby, Bueno, and McMahon, Economic Freedom of North America 2011, Fraser Institute 34

35 Economic Freedom of North America (all levels of government) Less free: 5.8% More free: 5.2% The difference in unemployment rates = 1 million jobs. Data Source: Census Bureau, Statistical Abstract of the United States; Ashby, Bueno, and McMahon, Economic Freedom of North America 2011, Fraser Institute 35

36 Income and Growth 36
37 Economic Freedom of North America (all levels of government) Data source: U.S. Census Bureau, Historical Income Tables: Households, Table H-8; Ashby, Bueno, and McMahon, Economic Freedom of North America 2011, Fraser Institute 37
38 Economic Freedom of North America (all levels of government) Data source: U.S. Census Bureau, Historical Income Tables: Households, Table H-8; Ashby, Bueno, and McMahon, Economic Freedom of North America 2011, Fraser Institute 38
39 Economic Freedom of North America (all levels of government) Data source: U.S. Census Bureau, Historical Income Tables: Households, Table H-8; Ashby, Bueno, and McMahon, Economic Freedom of North America 2011, Fraser Institute 39

40 Economic Freedom of North America (all levels of government) Less free: $35,300 More free: $38,000 Median household income averaged $4,000 more in the most free states. Data source: U.S. Census Bureau, Historical Income Tables: Households, Table H-8; Ashby, Bueno, and McMahon, Economic Freedom of North America 2011, Fraser Institute 40
41 Poverty 41

42 Economic Freedom of North America (all levels of government) Less free: 13.6% More free: 11.9% The difference in poverty rates = 5 million people living in poverty. Data source: Bureau of Economic Analysis, GDP and Personal Income Regional Data; Ashby, Bueno, and McMahon, Economic Freedom of North America 2011, Fraser Institute 42


43 Do these results hold across countries?? 43

44 Child Labor 44
45 Economic Freedom of the World (75 reporting countries, ) Less free: 28% More free: 13% Data source: Childinfo.org, Economic Freedom of the World, Fraser Institute 45

46 Economic Freedom of the World (75 reporting countries, ) Less free: 28% More free: 13% Data source: Childinfo.org, Economic Freedom of the World, Fraser Institute 46
47 Economic Freedom of the World Big country effect? 47
48 Economic Freedom of the World (45 below median income countries, ) Less free: 36% More free: 17% Data source: Childinfo.org, Economic Freedom of the World, Fraser Institute 48

49 Economic Freedom of the World (26 poorest quartile countries, ) Less free: 41% More free: 27% Data source: Childinfo.org, Economic Freedom of the World, Fraser Institute 49

50 Environment 50

51 Economic Freedom of the World (85 countries, 2007) Less free: 85 More free: 30 Data source: World Health Organization, Economic Freedom of the World, Fraser Institute 51
52 CO 2 Metric Tons per $1000 GDP Economic Freedom of the World (118 countries, 2000) Less free: 2.5 More free: 0.5 Data source: World Resource Institute (World Bank), Economic Freedom of the World, Fraser Institute 52
53 Economic Freedom of the World (136 countries, ) Less free: 7% More free: +7% Data source: Mongabay.com, Economic Freedom of the World, Fraser Institute 53
54 Economic Freedom of the World Big country effect? 54

55 Economic Freedom of the World (29 poorest quartile countries, ) Less free: 13% More free: 7% Data source: Mongabay.com, Economic Freedom of the World, Fraser Institute 55

56 Peace 56
57 Global Peace Index (inverse scale) Economic Freedom of the World (133 countries, 2009) Data source: Institute for Economics and Peace, Economic Freedom of the World, Fraser Institute 57
58 Global Peace Index (inverse scale) Economic Freedom of the World (133 countries, 2009) Countries that are more free are also more peaceful. Data source: Institute for Economics and Peace, Economic Freedom of the World, Fraser Institute 58

59 Poverty, and Inequality 59

60 Economic Freedom of the World (79 countries, ) Less free: 59% More free: 17% Data source: World Bank, Economic Freedom of the World, Fraser Institute 60
61 Economic Freedom of the World Big country effect? 61

62 Economic Freedom of the World (25 poorest quartile countries, ) Less free: 81% More free: 64% Data source: World Bank, Economic Freedom of the World, Fraser Institute 62
63 Poverty figures only measure the lower extreme. What about income inequality? 63
64 Per-Capita Income Can Hide Inequality Average = $40,000 Average = $40,

65 No one ever died from income inequality. 65
66 Economic Freedom of the World (123 countries, ) 66
67 Economic Freedom of the World (123 countries, ) Less free: 43 More free: 35 Data source: CIA World Factbook, Economic Freedom of the World, Fraser Institute 67
68 Economic Freedom of North America That inequality thing happens in the U.S. also! 68

69 Economic Freedom of North America (all levels of government) Data source: Census Bureau, American Community Survey, B19083; Ashby, Bueno, and McMahon, Economic Freedom of North America 2011, Fraser Institute 69
70 Correlation Causation Data don t show that economic freedom causes goodness. 70

71 No Correlation No Causation Data do show that economic freedom doesn t cause badness. 71
72 Conclusions Across states, across countries, and across time, societies with more economic freedom have Less unemployment More income Less poverty Less income inequality Better environmental outcomes 72
73 The Knowledge Problem March 28, 2014 copies of this presentation can be found at
74 But Free people will act selfishly! 74
75 More freedom greater ability to act selfishly, greater ability to harm each other, greater ability to harm the environment. More freedom greater ability to act altruistically, greater ability to help each other, greater ability to protect the environment. 75
76 Appropriate role for government is in preventing people from harming each other. More freedom greater ability to act selfishly, greater ability to harm each other, greater ability to harm the environment. More freedom greater ability to act altruistically, greater ability to help each other, greater ability to protect the environment. 76
77 We have to do something! The rich are getting richer while the poor get poorer! 77
78 U.S. Households According to Income 30% 25% 20% 15% 10% 5% 0% Under $15,000 $15,000 - $25,000 $25,000 - $35,000 $35,000 - $50,000 $50,000 - $75,000 $75,000 - $100,000 Over $100,000 Incomes are in 2009 dollars Data source: Statistical Abstract of the United States, U.S. Bureau of the Census,
79 U.S. Households According to Income 30% 25% 20% 15% 10% 5% 0% Under $15,000 $15,000 - $25,000 $25,000 - $35,000 $35,000 - $50,000 $50,000 - $75,000 $75,000 - $100,000 Over $100,000 Incomes are in 2009 dollars Data source: Statistical Abstract of the United States, U.S. Bureau of the Census,
80 U.S. Households According to Income 30% 25% 20% 15% 10% 5% 0% Under $15,000 $15,000 - $25,000 $25,000 - $35,000 $35,000 - $50,000 $50,000 - $75,000 $75,000 - $100,000 Over $100,000 Incomes are in 2009 dollars Data source: Statistical Abstract of the United States, U.S. Bureau of the Census,
81 U.S. Households According to Income 30% 25% 20% 15% 10% 5% 0% Under $15,000 $15,000 - $25,000 $25,000 - $35,000 $35,000 - $50,000 $50,000 - $75,000 $75,000 - $100,000 Over $100,000 Incomes are in 2009 dollars Data source: Statistical Abstract of the United States, U.S. Bureau of the Census,
82 U.S. Households According to Income 30% 25% 20% 15% 10% 5% 0% Under $15,000 $15,000 - $25,000 $25,000 - $35,000 $35,000 - $50,000 $50,000 - $75,000 $75,000 - $100,000 Over $100,000 Incomes are in 2009 dollars Data source: Statistical Abstract of the United States, U.S. Bureau of the Census,
83 Problems with Inequality Measures Assumes that the pie is fixed. Assumes that the population is stagnant. 83
84 Fraction of Total Income Received by Each Fifth 50% 45% 40% 46.6% 49.7% 35% 30% 25% 20% 15% 10% 5% In 2000, the poorest Americans earned 3.8% of all income. 3.8% In 2007, the poorest Americans earned 3.4% of all income. 3.4% 0% Poorest Lowest Quintile Highest Richest Quintile Data source: Statistical Abstract of the United States, U.S. Bureau of the Census, 2010, Table
85 Fraction of Total Income Received by Each Fifth 50% 45% 40% 46.6% 49.7% 35% 30% 25% 20% 15% The Pie Isn t Fixed 2000 RGDP = $11,216 b. x 3.8% = $425 b RGDP = $13,206 b. x 3.4% = $450 b. 10% 5% 3.8% 3.4% 0% Poorest Lowest Quintile Highest Richest Quintile Data source: Statistical Abstract of the United States, U.S. Bureau of the Census, 2010, Table
86 Average Age In 2000, the youngest Americans were 7.1 years old. In 2010, the youngest Americans were 6.9 years old Youngest Lowest Quintile Highest Oldest Quintile Data source: Statistical Abstract of the United States, U.S. Bureau of the Census, 2010, Tables 8,
87 Average Age The Population Isn t Stagnant The young grew up and were replaced Youngest Lowest Quintile Highest Oldest Quintile Data source: Statistical Abstract of the United States, U.S. Bureau of the Census, 2010, Tables 8,
88 Inequality and the Gini-Coefficient Line up people from poorest to richest. Total income = $1 million These people earn a total of $200,000 These people earn a total of $400,000 These people earn a total of $300,000 These people earn a total of $100,
89 Inequality and the Gini-Coefficient Line up people from poorest to richest. Total income = $1 million These people earn 20% of all income. These people earn 40% of all income. These people earn 30% of all income. These people earn 10% of all income. 89
90 Inequality and the Gini-Coefficient Line up people from poorest to richest. Total income = $1 million These people earn 20% of all income. These people earn 40% of all income. These people earn 30% of all income. These people earn 10% of all income. 90
91 Median Income Within Each Quintile (2006$) $120,000 $100,000 25% 0% $80,000 $60,000 $40, % 52% 27% $20,000 $0 Bottom Quintile Second Quintile Middle Quintile Fourth Quintile Top Quintile Parents Children Source: Pew Economic Mobility Project 91
92 Median Income Within Each Quintile (2006$) $120,000 $100,000 25% 0% $80,000 $60,000 $40, % 52% 27% $20,000 $0 Bottom Quintile Second Quintile Middle Quintile Fourth Quintile Top Quintile Parents Children Source: Pew Economic Mobility Project 92
93 Median Income Within Each Quintile (2006$) $120,000 $100,000 25% 0% $80,000 $60,000 $40, % + 52% 27% $20,000 $0 Bottom Quintile Second Quintile Middle Quintile Fourth Quintile Top Quintile Parents Children Source: Pew Economic Mobility Project 93
94 Median Income Within Each Quintile (2006$) $120,000 $100,000 25% 0% $80,000 $60,000 $40, % + 52% + 27% $20,000 $0 Bottom Quintile Second Quintile Middle Quintile Fourth Quintile Top Quintile Parents Children Source: Pew Economic Mobility Project 94
95 Median Income Within Each Quintile (2006$) $120,000 $100, % + 0% $80,000 $60,000 $40, % + 52% + 27% $20,000 $0 Bottom Quintile Second Quintile Middle Quintile Fourth Quintile Top Quintile Parents Children Source: Pew Economic Mobility Project 95
96 Employment Measures Population Non-working age population Working age population Institutionalized Non-institutionalized Non-employed Labor Force Unemployed Employed Unemployment Rate = Unemployed / Labor Force 96
97 Employment Measures Population Non-working age population Working age population Institutionalized Non-employed Non-institutionalized Labor Force Unemployment Rate = 10 / 100 = 10% 90 people employed Unemployed Employed Suppose 2 unemployed people become discouraged. 97
98 Employment Measures Population Non-working age population Working age population Institutionalized Non-employed Non-institutionalized Labor Force = = 98 Unemployed Employed Unemployment Rate = 8 / 98 = 8.2% 10 2 = 8 90 Unemployment rate drops from 10% to 8.2%, yet the same 90 people are working. 98
99 Employment Measures Reported unemployment rate Data Source: freelunch.com 99
100 Employment Measures Unemployment rate after adding back discouraged workers The Year of Weirdness Reported unemployment rate Data Source: freelunch.com 100
Politics and Economics: The Struggle of Reason with Emotion
 Politics and Economics: The Struggle of Reason with Emotion February 13, 2012 copies of this presentation can be found at www.antonydavies.org 1 Much valuable discussion fails to occur because of pride
Deficit Day to Bankruptcy Day
 Deficit Day to Bankruptcy Day April 2014 copies of this presentation can be found at Jan 1 Dec 31 Deficit Day! How much government spending do people fund with their tax dollars? Top 1% 56 days 2% to 5%
ECON 256: Poverty, Growth & Inequality. Jack Rossbach
 ECON 256: Poverty, Growth & Inequality Jack Rossbach Plan for Semester: Two parts (split around spring break) Part I: Measurement and background Links between Poverty, Growth & Inequality Measurement:
Taxes and Gimmicks. Antony Davies Duquesne University.
 Taxes and Gimmicks Antony Davies Duquesne University www.antonydavies.org Tax Gimmicks: How government hides what it does Gimmick #1: Withheld Taxes Gimmick #1: Withheld Taxes Endowment effect: People
Law and Economic Justice
 University of Oklahoma College of Law From the SelectedWorks of Jonathan B. Forman April 29, 2011 Law and Economic Justice JONATHAN B FORMAN, University of Oklahoma Available at: https://works.bepress.com/jonathan_forman/170/
ECON 256: Poverty, Growth & Inequality. Jack Rossbach
 ECON 256: Poverty, Growth & Inequality Jack Rossbach Measuring Poverty Many different definitions for Poverty Cannot afford 2,000 calories per day Do not have basic needs met: clean water, health care,
Economics 448: Lecture 14 Measures of Inequality
 Economics 448: Measures of Inequality 6 March 2014 1 2 The context Economic inequality: Preliminary observations 3 Inequality Economic growth affects the level of income, wealth, well being. Also want
ECON 1100 Global Economics (Fall 2013) The Distribution Function of Government portions for Exam 3
 The Distribution Function of Government portions for Exam 3") ECON Global Economics (Fall 23) The Distribution Function of Government portions for Exam 3 Relevant Readings from the Required Textbooks: Economics Chapter 2, Income Distribution and Poverty Problems
ECON Global Economics (Fall 23) The Distribution Function of Government portions for Exam 3 Relevant Readings from the Required Textbooks: Economics Chapter 2, Income Distribution and Poverty Problems
THIRD EDITION. ECONOMICS and. MICROECONOMICS Paul Krugman Robin Wells. Chapter 18. The Economics of the Welfare State
 THIRD EDITION ECONOMICS and MICROECONOMICS Paul Krugman Robin Wells Chapter 18 The Economics of the Welfare State WHAT YOU WILL LEARN IN THIS CHAPTER What the welfare state is and the rationale for it
Poverty and Inequality in the Countries of the Commonwealth of Independent States
 22 June 2016 UNITED NATIONS ECONOMIC COMMISSION FOR EUROPE CONFERENCE OF EUROPEAN STATISTICIANS Seminar on poverty measurement 12-13 July 2016, Geneva, Switzerland Item 6: Linkages between poverty, inequality
Income inequality an insufficient consumption in China. Li Gan Southwestern University of Finance and Economics Texas A&M University
 Income inequality an insufficient consumption in China Li Gan Southwestern University of Finance and Economics Texas A&M University 目 1 An Introduction of CHFS Contents 2 3 Inequality and Consumption A
The US Economy: A Global View Part II. So the American economy needs the world, and the world needs the American economy.
 The US Economy: A Global View Part II So the American economy needs the world, and the world needs the American economy. Rodrigo Rato Comparative Advantage International trade allows countries to produce
The Moldovan experience in the measurement of inequalities
 The Moldovan experience in the measurement of inequalities Veronica Nica National Bureau of Statistics of Moldova Quick facts about Moldova Population (01.01.2015) 3 555 159 Urban 42.4% Rural 57.6% Employment
Topic 11: Measuring Inequality and Poverty
 Topic 11: Measuring Inequality and Poverty Economic well-being (utility) is distributed unequally across the population because income and wealth are distributed unequally. Inequality is measured by the
Poverty, Inequality, and Discrimination. Wen-Jui Han New York University
 Poverty, Inequality, and Discrimination Wen-Jui Han New York University Share of poor population below 50% of the poverty line 50.0% 45.0% 40.0% 35.0% 30.0% 25.0% 1975 1976 1977 1978 1979 1980 1981
Income Inequality and Poverty
 20 Income Inequality and Poverty PowerPoint Slides prepared by: Andreea CHIRITESCU Eastern Illinois University 1 The Measurement of Inequality Questions of measurement: How much inequality is there in
Poverty, Inequity and Inequality in New Zealand
 Poverty, Inequity and Inequality in New Zealand Inequality and Inequity Equity is fairness or justice with individual circumstances taken into account. It is also a matter of opinion what is equitable
Using Refundable Tax Credits to Help Lowincome
 Using Refundable Tax Credits to Help Lowincome Taxpayers by Jon Forman Alfred P. Murrah Professor of Law University of Oklahoma Norman, Oklahoma & ATAX Fellow, UNSW University of Melbourne Melbourne, Australia
SKEMA BUSINESS SCHOOL Global risk and the mounting wealth gap Michel Henry Bouchet
 SKEMA BUSINESS SCHOOL Global risk and the mounting wealth gap Michel Henry Bouchet MYTH = GLOBALIZATION GENERATES GROWING ECONOMIC WEALTH AND WELL-BEING FOR ALL Fact: Economic growth boils down to rising
Income Inequality and Poverty (Chapter 20 in Mankiw & Taylor; reading Chapter 19 will also help)
") Income Inequality and Poverty (Chapter 20 in Mankiw & Taylor; reading Chapter 19 will also help) Before turning to money and inflation, we backtrack - at least in terms of the textbook - to consider income
Income Inequality and Poverty (Chapter 20 in Mankiw & Taylor; reading Chapter 19 will also help) Before turning to money and inflation, we backtrack - at least in terms of the textbook - to consider income
Income Distribution and Poverty
 C H A P T E R 15 Income Distribution and Poverty Prepared by: Fernando Quijano and Yvonn Quijano Income Distribution and Poverty This chapter focuses on distribution. Why do some people get more than others?
Income and Wealth Inequality A Lack of Equity
 Income and Wealth Inequality A Lack of Equity Increasing inequality in the distribution of income and wealth is an example of market failure. Resources are not distributed equitably. Income Income is a
Source: Oxfam Issue Briefing, Having It All and Wanting More, January 2015
 Societal Trends As we have pointed out in previous newsletters, economic growth is not shared equally across our society, with the wealthiest among us benefitting excessively. This is a particularly critical
Inequality: Why should we care?
 Inequality: Why should we care? Byron Gangnes Professor of Economics Senior Research Fellow, UHERO University of Hawaii at Manoa VLI February 2019 Hawaii Island Economic inequality Inequality a central
Poverty and Social Transfers in Hungary
 THE WORLD BANK Revised March 20, 1997 Poverty and Social Transfers in Hungary Christiaan Grootaert SUMMARY The objective of this study is to answer the question how the system of cash social transfers
Central Administration for Statistics and World Bank
 Public Disclosure Authorized Central Administration for Statistics and World Bank Snapshot of Poverty and Labor Market Outcomes in Lebanon based on Household Budget Survey 211/212 1 May 25, 216 Version
The Impact of Taxation and Public Expenditure on Income Distribution in Indonesia
 The Impact of Taxation and Public Expenditure on Distribution in Indonesia Kunta Nugraha PhD Student Faculty of Business, Government and Law University of Canberra NATSEM Workshop for HDR Students Canberra,
1 Income Inequality in the US
 1 Income Inequality in the US We started this course with a study of growth; Y = AK N 1 more of A; K; and N give more Y: But who gets the increased Y? Main question: if the size of the national cake Y
Medicaid Insurance and Redistribution in Old Age
 Medicaid Insurance and Redistribution in Old Age Mariacristina De Nardi Federal Reserve Bank of Chicago and NBER, Eric French Federal Reserve Bank of Chicago and John Bailey Jones University at Albany,
Understanding Income Distribution and Poverty
 Understanding Distribution and Poverty : Understanding the Lingo market income: quantifies total before-tax income paid to factor markets from the market (i.e. wages, interest, rent, and profit) total
Resolved: Student loans should be limited to those students and amounts that are highly likely to be repaid in full.
 The Final Round 1 Everett Rutan ejrutan3@ctdebate.org Connecticut Debate Association Darien High School March 4, 2017 Resolved: Student loans should be limited to those students and amounts that are highly
2.6 Wealth Inequality in America Focus Question
 Ms. Rebecca and Ms. A Economic Justice, Fall 2017 2.6 Wealth Inequality in America Name: Section: EJ#: Focus Question Do Now 1. Analyze the following chart, then complete the questions below. I see I think
METHODOLOGICAL ISSUES IN POVERTY RESEARCH
 METHODOLOGICAL ISSUES IN POVERTY RESEARCH IMPACT OF CHOICE OF EQUIVALENCE SCALE ON INCOME INEQUALITY AND ON POVERTY MEASURES* Ödön ÉLTETÕ Éva HAVASI Review of Sociology Vol. 8 (2002) 2, 137 148 Central
Capitalism, Inequality & Globalization. Public University of Navarre Pamplona, Spain May 21 st 2018 J. E. Stiglitz
 Capitalism, Inequality & Globalization Public University of Navarre Pamplona, Spain May 21 st 2018 J. E. Stiglitz In many ways, most advanced economies not been performing well US worst example, most European
Inequality in China: Recent Trends. Terry Sicular (University of Western Ontario)
") Inequality in China: Recent Trends Terry Sicular (University of Western Ontario) In the past decade Policy goal: harmonious, sustainable development, with benefits of growth shared widely Reflected in
Inequality in China: Recent Trends Terry Sicular (University of Western Ontario) In the past decade Policy goal: harmonious, sustainable development, with benefits of growth shared widely Reflected in
Economic Growth, Inequality and Poverty: Concepts and Measurement
 Economic Growth, Inequality and Poverty: Concepts and Measurement Terry McKinley Director, International Poverty Centre, Brasilia Workshop on Macroeconomics and the MDGs, Lusaka, Zambia, 29 October 2 November
Recall the idea of diminishing marginal utility of income. Recall the discussion that utility functions are ordinal rather than cardinal.
 Lecture 11 Chapter 7 in Weimer and Vining Distributional and other goals. Return to the Pareto efficiency idea that is one standard. If a market leads us to a distribution that is not Pareto efficient,
CHAPTER 9 DISTRIBUTION: EXCHANGE AND TRANSFER Microeconomics in Context (Goodwin, et al.), 2 nd Edition
, 2 nd Edition") CHAPTER 9 DISTRIBUTION: EXCHANGE AND TRANSFER Microeconomics in Context (Goodwin, et al.), 2 nd Edition Chapter Summary This chapter looks at the two ways in which resources are distributed in an economy:
CHAPTER 9 DISTRIBUTION: EXCHANGE AND TRANSFER Microeconomics in Context (Goodwin, et al.), 2 nd Edition Chapter Summary This chapter looks at the two ways in which resources are distributed in an economy:
Where Does the Money Go?
 Where Does the Money Go? FEDERAL SPENDING ON YOUNG AMERICAN CHILDREN By: Elizabeth Ananat, PhD., Anna Gassman-Pines, PhD. Hayley Barton, Katie Becker, Tamara Frances, Rob Rappleye, Tim Rickert, Maria Suhail
Econ 102: Lecture Notes #7. Human Capital. John Knowles University of Pennsylvania. October 6th, 2004
 Econ 102: Lecture Notes #7 Human Capital John Knowles University of Pennsylvania October 6th, 2004 1 Why Doesn t Capital Flow from Rich Countries to Poor? Title from an article by Nobel-prize winner Robert
Maurizio Franzini and Mario Planta
 Maurizio Franzini and Mario Planta 2 premises: 1. Inequality is a burning issue for economic, ethical and political reasons (Sen, Stiglitz, Piketty and many others ) 2. Inequality is today a more complex
Second Hour Exam Public Finance Fall, Answers
 Second Hour Exam Public Finance - 180.365 Fall, 2004 Answers 365HourExam2-2004.tex 1 Multiple Choice (3 pt each) Correct answer indicated by 1. When the average buyer of an insurance policy is likely to
9) According to research, which of the following countries is the strongest supporter of free markets? A) China B) India C) France D) Ukraine
 According to research, which of the following countries is the strongest supporter of free markets? A) China B) India C) France D) Ukraine") 1 FOR STUDENT S PERSONAL USE ONLY, DO NOT COPY OR REDISTRIBUTE. International Business: Environments and Operations, 15e, Global Edition (Daniels et al.) Some content 2015 Pearson Education Ltd. Chapter
1 FOR STUDENT S PERSONAL USE ONLY, DO NOT COPY OR REDISTRIBUTE. International Business: Environments and Operations, 15e, Global Edition (Daniels et al.) Some content 2015 Pearson Education Ltd. Chapter
Inequality and Social Mobility. Econ 101
 Inequality and Social Mobility Econ 101 Much of the following is taken from Capital in the Twenty-First Century by Thomas Piketty Special Thanks Key Concepts Wealth (stock, savings) Inequality The richest
Why the Next US Recession Could Be Worse Than the Last
 Why the Next US Recession Could Be Worse Than the Last Nov. 27, 2017 Inequality is reaching new heights. Originally produced on Nov. 20, 2017 for Mauldin Economics, LLC Jacob L. Shapiro Before we begin,
ECONOMIC COMMENTARY. Income Inequality Matters, but Mobility Is Just as Important. Daniel R. Carroll and Anne Chen
 ECONOMIC COMMENTARY Number 2016-06 June 20, 2016 Income Inequality Matters, but Mobility Is Just as Important Daniel R. Carroll and Anne Chen Concerns about rising income inequality are based on comparing
Economic Standard of Living
 DESIRED OUTCOMES New Zealand is a prosperous society, reflecting the value of both paid and unpaid work. Everybody has access to an adequate income and decent, affordable housing that meets their needs.
Poverty, Inequality and the Welfare State
 Poverty, Inequality and the Welfare State Lectures 3 and 4 Le Grand, Propper and Smith (2008): Chp 9 Stiglitz (2000): Chp 14 Connolly and Munro (1999): Chp 14, 15, 16, 17 Outline Income and wealth defined
The Economy Today 14th Edition SOLUTIONS MANUAL Schiller Gebhardt
 The Economy Today 14th Edition SOLUTIONS MANUAL Schiller Gebhardt The Economy Today 14th Edition TEST BANK Schiller Gebhardt Full download at: Full download at: https://testbankreal.com/download/economy-today-14th-edition-solutionsmanual-schiller-gebhardt/
Intergenerational Transfers and Old-Age Security in Korea
 2013 Workshop of Center for Intergenerational Studies Intergenerational Transfers and Old-Age Security in Korea Hisam Kim Fellow & Adjunct Professor @ Korea Development Institute (KDI) Visiting Scholar
Intermediate Macroeconomic Theory. Costas Azariadis. Costas Azariadis. Lecture 3: Productivity and Labor
 Lecture 3: Productivity and Labor 1. THE ISSUES a)productivity most important determinant of living standards in the long run 2008 U.S. GDP per worker employed (current $) $100,000 per worker per year
Harnessing Demographic Dividend: The Future We Want
 Harnessing Demographic Dividend: The Future We Want Presented at 5th Commission on Population and Development April 5th, 217 Republik Indonesia Ministry of National Development Planning/ Bappenas National
Optimal Taxation : (c) Optimal Income Taxation
 Optimal Income Taxation") Optimal Taxation : (c) Optimal Income Taxation Optimal income taxation is quite a different problem than optimal commodity taxation. In optimal commodity taxation the issue was which commodities to tax,
Optimal Taxation : (c) Optimal Income Taxation Optimal income taxation is quite a different problem than optimal commodity taxation. In optimal commodity taxation the issue was which commodities to tax,
Distributive Impact of Low-Income Support Measures in Japan
 Open Journal of Social Sciences, 2016, 4, 13-26 http://www.scirp.org/journal/jss ISSN Online: 2327-5960 ISSN Print: 2327-5952 Distributive Impact of Low-Income Support Measures in Japan Tetsuo Fukawa 1,2,3
Income Changes in Metro Atlanta: Meandering Through The Research
 Income Changes in Metro Atlanta: Meandering Through The Research Atlanta Regional Commission For more information, contact: mcarnathan@atlantaregional.com The Highlights Per Capita Income in metro Atlanta
U.S. Income Inequality: It s Not So Bad
 Volume 14 Issue 1 Spring 2010 A n E c o n o m i c E d u c at i o n N e w s l e t t e r f r o m t h e F e d e r a l R e s e r v e B a n k S t. L o u i s 2005 istockphoto; Eliza Snow U.S. Income Inequality:
INCOME DISTRIBUTION AND POVERTY IN THE OECD AREA: TRENDS AND DRIVING FORCES
 OECD Economic Studies No. 34, 22/I INCOME DISTRIBUTION AND POVERTY IN THE OECD AREA: TRENDS AND DRIVING FORCES Michael Förster and Mark Pearson TABLE OF CONTENTS Introduction... 8 Main trends in the distribution
Economic Standard of Living
 DESIRED OUTCOMES New Zealand is a prosperous society, reflecting the value of both paid and unpaid work. All people have access to adequate incomes and decent, affordable housing that meets their needs.
THE IMPACT OF SOCIAL TRANSFERS ON POVERTY IN ARMENIA. Abstract
 THE IMPACT OF SOCIAL TRANSFERS ON POVERTY IN ARMENIA Hovhannes Harutyunyan 1 Tereza Khechoyan 2 Abstract The paper examines the impact of social transfers on poverty in Armenia. We used data from the reports
GDP can be measured in mainly two ways. 1. Income Approach. 2. Expenditure Approach. Expenditure Approach:
 Gross Domestic Product is the total market value of all goods and services produced in the country in a particular year. It is equal to total consumer, investment and government spending, plus the value
Basic Macroeconomics Relationships. Business, Computers, & Information Technology
 Basic Macroeconomics Relationships Business, Computers, & Information Technology Unit 3 Chapter 27 1 Remember Growth, Business Cycle, Recession, and Inflation? Macroeconomic Relationships help us explain
Poverty and social inclusion indicators
 Poverty and social inclusion indicators The poverty and social inclusion indicators are part of the common indicators of the European Union used to monitor countries progress in combating poverty and social
Exploring Lognormal Income Distributions 11 Oct, 2014
 Exploring Lognormal Income Distributions 11 Oct, 2014 1 Exploring Lognormal Incomes Milo Schield Augsburg College Editor: www.statlit.org US Rep: International Statistical Literacy Project 11 October 2014
Economic Impacts of Basic Income in Korea --Multiplier and Redistribution effect
 Economic Impacts of Basic Income in Korea --Multiplier and Redistribution effect Nam Hoon Kang(Hanshin University) 1. Introduction It is well known that the Korean economy has successfully developed from
Brazil. Poverty profile. Country profile. Country profile. November
 Brazil Country profile Country profile 16 November www.devinit.org/pi This country profile is produced by Development Initiatives to support the National Dialogue on the 3 Agenda for Sustainable Development.
Lecture 13: Efficiency vs. Equity & International Trade
 Lecture 13: Efficiency vs. Equity & International Trade Equity & International Trade p 1 Taxes on a good normally reduce surplus p 2 Efficiency and Equity Efficiency describes how much value an economy
Inequality and Poverty in Japan. Toshiaki TACHIBANAKI Japanese Economic Review 57(1), March 2006
, March 2006") Inequality and Poverty in Japan Toshiaki TACHIBANAKI Japanese Economic Review 57(1), March 2006 1 Issues There is an argument that equity should be sacrificed in order to promote efficiency. Parents levels
Inequality and Poverty in Japan Toshiaki TACHIBANAKI Japanese Economic Review 57(1), March 2006 1 Issues There is an argument that equity should be sacrificed in order to promote efficiency. Parents levels
Table 1. Job growth in Ames, Des Moines, and Iowa, June 2010 June 2016 since 2015 since 2014 since Des Moines Iowa Ames. Des Moines Iowa Ames
 Ames Economic Outlook, Second Quarter 2016 Peter F. Orazem Iowa State University I. The Ames Labor Market The Ames Labor market continued its 6-year expansion through the first half of 2016. The gain has
Introduction to International Economics Update to Chapter 20 Growth
 Introduction to International Economics Update to Chapter 20 Growth Table 20.1 gives information on GDP per capita for twelve countries of the world for the year 2010. As we can see in Table 20.1, the
Labor Markets, Poverty, and Income Distribution. Chapter 12. McGraw-Hill/Irwin. Copyright 2013 by The McGraw-Hill Companies, Inc. All rights reserved.
 Labor Markets, Poverty, and Income Distribution Chapter 12 McGraw-Hill/Irwin Copyright 2013 by The McGraw-Hill Companies, Inc. All rights reserved. Learning Objectives 1. Understand the relationship between
Labor Markets, Poverty, and Income Distribution. Chapter 12. Learning Objectives
 Labor Markets, Poverty, and Income Distribution Chapter 12 McGraw-Hill/Irwin Copyright 2013 by The McGraw-Hill Companies, Inc. All rights reserved. Learning Objectives 1. Understand the relationship between
Chapter Outline. Chapter 6 Every Macroeconomic Word You Have Ever Heard: Gross Domestic Product, Inflation, Unemployment, Recession and Depression
 Chapter 6 Every Macroeconomic Word You Have Ever Heard: Gross Domestic Product, Inflation, Unemployment, Recession and Depression Chapter Outline Measuring the Economy Real Gross Domestic Product and Why
arxiv: v2 [q-fin.ec] 1 Sep 2014
![arxiv: v2 [q-fin.ec] 1 Sep 2014](/thumbs/83/88785863.jpg "arxiv: v2 [q-fin.ec] 1 Sep 2014") arxiv:406.75v2 [q-fin.ec] Sep 204 Income Inequality in the 2st Century A biased summary of Piketty s Capital in the Twenty-First Century Dietrich Stauffer Institute for Theoretical Physics, Cologne University,
arxiv:406.75v2 [q-fin.ec] Sep 204 Income Inequality in the 2st Century A biased summary of Piketty s Capital in the Twenty-First Century Dietrich Stauffer Institute for Theoretical Physics, Cologne University,
Wealth inequality and accumulation. John Hills, Centre for Analysis of Social Exclusion, London School of Economics
 Wealth inequality and accumulation John Hills, Centre for Analysis of Social Exclusion, London School of Economics Conference on Economic and Social inequalities: Causes, implications and Some paradoxes
The Impact of Social Security Reform on Low-Income Workers
 December 6, 2001 SSP No. 23 The Impact of Social Security Reform on Low-Income Workers by Jagadeesh Gokhale Executive Summary Because the poor are disproportionately dependent on Social Security for their
Brian Nolan University of Oxford APPAM-UNED Conference Segovia September 2014
 The Middle Class: Who are they, where did they go, and why does it matter? Brian Nolan University of Oxford APPAM-UNED Conference Segovia September 2014 Key Conceptual Issues Who do we mean by the middle?
Measuring Unemployment Economic Growth and Productivity. unemployed. News
 Economic Growth and Productivity News Unemployment Redux Nations Have Experienced a Substantial Rise in Living Standards Over the Last 150 Years. Labor Productivity Accounts for a Great Deal of the Observed
CHAPTER I INTRODUCTION. having a higher poverty rate at the same time. The World Bank reported that some
 CHAPTER I INTRODUCTION 1.1 Background of Study Indonesia is a developing country having a good rate of economic growth, but having a higher poverty rate at the same time. The World Bank reported that some
Unemployment. What are the different types of unemployment? How are unemployment rates determined? What is full employment?
 Unemployment What are the different types of unemployment? How are unemployment rates determined? What is full employment? Types of Unemployment Frictional Unemployment Occurs when people change jobs,
Poverty and income inequality
 Poverty and income inequality Jonathan Cribb Public Economics Lectures, Institute for Fiscal Studies 17 th December 2012 Overview The standard of living in the UK Income Inequality The UK income distribution
How does social mobility in the United States compare to that in Britain? Why do you think this is so? References. Multiple Choice
 1. Award: 10.00 points How does social mobility in the United States compare to that in Britain? Why do you think this is so? There is less social mobility in the United States than in Great Britain. This
CIE Economics A-level
 CIE Economics A-level Topic 3: Government Microeconomic Intervention b) Equity and policies towards income and wealth redistribution Notes In the absence of government intervention, the market mechanism
Redistribution via VAT and cash transfers: an assessment in four low and middle income countries
 Redistribution via VAT and cash transfers: an assessment in four low and middle income countries IFS Briefing note BN230 David Phillips Ross Warwick Funded by In partnership with Redistribution via VAT
Minimum Wage as a Poverty Reducing Measure
 Illinois State University ISU ReD: Research and edata Master's Theses - Economics Economics 5-2007 Minimum Wage as a Poverty Reducing Measure Kevin Souza Illinois State University Follow this and additional
Table 13.1 shows the top 10 wealthiest people in the United States in 2006 and These names come from lists
 CHAPTER 13 Superstars RICH AND RICHER Table 13.1 shows the top 10 wealthiest people in the United States in 2006 and 2010. These names come from lists compiled each year by Forbes magazine of the 400 wealthiest
THE IMPACT OF CASH AND BENEFITS IN-KIND ON INCOME DISTRIBUTION IN INDONESIA
 THE IMPACT OF CASH AND BENEFITS IN-KIND ON INCOME DISTRIBUTION IN INDONESIA Phil Lewis Centre for Labor Market Research University of Canberra Australia Phil.Lewis@canberra.edu.au Kunta Nugraha Centre
Poverty, Inequality, and Development
 Poverty, Inequality, and Development Outline: Poverty, Inequality, and Development Measurement of Poverty and Inequality Economic characteristics of poverty groups Why is inequality a problem? Relationship
Economic Standard of Living
 DESIRED OUTCOMES New Zealand is a prosperous society, reflecting the value of both paid and unpaid work. All people have access to adequate incomes and decent, affordable housing that meets their needs.
Social Situation Monitor - Glossary
 Social Situation Monitor - Glossary Active labour market policies Measures aimed at improving recipients prospects of finding gainful employment or increasing their earnings capacity or, in the case of
Real Median Family Income is Falling. Family incomes have stagnated since the mid-1980s. Income in 2012 ($51,017) is lower than in 1989 ($51,681).
 is lower than in 1989 ($51,681).") U.S. Income 1 Real Median Family Income is Falling Family incomes have stagnated since the mid-1980s. Income in 2012 ($51,017) is lower than in 1989 ($51,681). 2 Labor Income Share Falls As Profits Rise
U.S. Income 1 Real Median Family Income is Falling Family incomes have stagnated since the mid-1980s. Income in 2012 ($51,017) is lower than in 1989 ($51,681). 2 Labor Income Share Falls As Profits Rise
The 2008 Statistics on Income, Poverty, and Health Insurance Coverage by Gary Burtless THE BROOKINGS INSTITUTION
 The 2008 Statistics on Income, Poverty, and Health Insurance Coverage by Gary Burtless THE BROOKINGS INSTITUTION September 10, 2009 Last year was the first year but it will not be the worst year of a recession.
QUESTIONNAIRE A I. MULTIPLE CHOICE QUESTIONS (4 points each)
") ECO2143 Macroeconomic Theory II First mid-term examination: January 28 2013 University of Ottawa Professor: Louis Hotte Time allotted: 1h 20min Attention: Not all questionnaires are the same. This is questionnaire
ECO2143 Macroeconomic Theory II First mid-term examination: January 28 2013 University of Ottawa Professor: Louis Hotte Time allotted: 1h 20min Attention: Not all questionnaires are the same. This is questionnaire
Income and Wealth Inequality in OECD Countries
 DOI: 1.17/s1273-16-1946-8 Verteilung -Vergleich Horacio Levy and Inequality in Countries The has longstanding experience in research on income inequality, with studies dating back to the 197s. Since 8
Economic Standard of Living
 DESIRED OUTCOMES New Zealand is a prosperous society where all people have access to adequate incomes and enjoy standards of living that mean they can fully participate in society and have choice about
Inequality and Redistribution
 Inequality and Redistribution Chapter 19 CHAPTER IN PERSPECTIVE In chapter 19 we conclude our study of income determination by looking at the extent and sources of economic inequality and examining how
For release at 2:00 p.m., EDT, September 26, 2018
 Economic projections of Federal Reserve Board members and Federal Reserve Bank presidents under their individual assessments of projected appropriate monetary policy, September 2018 Advance release of
1. Poverty and social inclusion indicators
 POVERTY AND SOCIAL INCLUSION INDICATORS BASED ON THE EUROPEAN SURVEY ON INCOME AND LIVING CONDITIONS (EU-SILC) IN THE CONTEXT OF THE OPEN METHOD FOR COORDINATION The open method of coordination is an instrument
DECEMBER State of Working Vermont
 DECEMBER 2016 State of Working Vermont 2016 Contents 1. More rich, more poor, and fewer in the middle 4 2. The essentials are eating up paychecks 9 3. Opportunity has stalled for many Vermonters 14 4.
turn the Fear of Losing Money
 turn the Fear of Losing Money into a Winning Mindset The cave you fear to enter holds the treasure you seek. JOSEPH CAMPBELL In the case of the trader, money should be just a means of keeping score. It
Entitlement Reform and the Future of Pensions
 Entitlement Reform and the Future of Pensions Conference on Reimagining Pensions: The Next 40 Years The Wharton School May 1, 2014 C. Eugene Steuerle Benjamin H. Harris Pamela J. Perun Basic Theme Reform