2016 Adequacy. Bureau of Legislative Research Policy Analysis & Research Section
|
|
|
- Brooke Marjorie Waters
- 5 years ago
- Views:
Transcription


1 2016 Adequacy Bureau of Legislative Research Policy Analysis & Research Section

2 Equity is a key component of achieving and maintaining a constitutionally sound system of funding education in Arkansas, and has been since the 1983 case Dupree v. Alma Sch. Dist. No. 30. The Lake View cases reaffirmed this principle. The Adequacy Study statute, Ark. Code Ann , requires the Education Committees to "review and continue to evaluate the method of providing equality of educational opportunity of the State of Arkansas and recommend any necessary changes. This report provides information on the state s educational equity, using standard statistical measures accepted by the Court. Three approaches have been established to measure equity: 1) Horizontal equity analyses examine the degree to which districts receive equal funding, 2) fiscal neutrality examines the relationship between property wealth and funding, and 3) vertical equity measures equity of spending according to district characteristics. 2
3 I will discuss these 3 approaches and the respective acceptability standards and findings in the BLR Adequacy Study for There are 6 statistics commonly used to measure horizontal equity. The statistics that examine extremities (or lowest and highest dollar amounts) of the distribution of revenues across the state is the restricted range and federal range ratio. The restricted range is simply the difference between per pupil revenue at the 5 th and the 95 th percentiles. This restriction eliminates outliers, or the few extremes that are not representative of the other districts. It is a limited measure because it only considers the difference between two values (5 th and 95 th %iles), and it is influenced by extraneous factors such the economy and state characteristics. Because the restricted range is heavily influenced by extraneous factors, acceptability of ranges is determined by professional judgment of decision-makers. Restricted range for 2015 shown on next slide. 3

4 $ $ $ 4

 of squared differences between districts")
5 The federal range ratio divides the restricted range by the value at the 5 th percentile. This eliminates problems with extraneous factors, but still leaves the limitation of examining only the two extreme revenue values. In 2015, the ratios are 0.28 for foundation + taxes, and 0.33 for foundation + other adequacy funding in the BLR study. Acceptability standards range from 0.25 to 0.40 in literature. A very common statistic that examines the differences in revenue among all districts is the standard deviation, which is the square root of the sum (S) of squared differences between districts revenues and the mean (m) divided by the number (N) of districts. SD = S ( x - m) 2 / N When you divide the standard deviation by the mean, you have the coefficient of variation, which can be expressed as a decimal or %. It is the percentage of variation on both sides of the mean (or average). The 0.17 and 0.16 are in the acceptable ranges noted. 5
6 6

7 The Gini coefficient (GC) also examines differences in revenue between all districts, and it, too, is unaffected by extraneous factors. It is one of the most powerful equity measures, but also the most complicated. To determine the GC, a graph is created by plotting the cumulative percentages of the total revenue for districts on the vertical axis and the cumulative percentages of the number of districts on the horizontal axis. The resulting graph indicates the degree to which revenue is distributed equally to districts at various percentiles. If the revenue distribution is perfectly equitable, the graph would be a straight 45 degree line. With perfect equity, 20% of the districts would receive 20% of the funding, 40% would receive 40%, and so on. If the distribution is less than perfect, the graph will be a concave Lorenz (or Gini) curve (seen on the next slide). 7

8 Cumulative % of Revenue Gini = A A + B Cumulative % of Number of Districts 8
9 Cumulative % Foundation Funds & Property Taxes Per-Pupil 1.00 Equity (Lorenz) Curve 1.00, , , , , 0.18 G = Cumulative % of Districts State Funding Perfect Equity 9
 to")

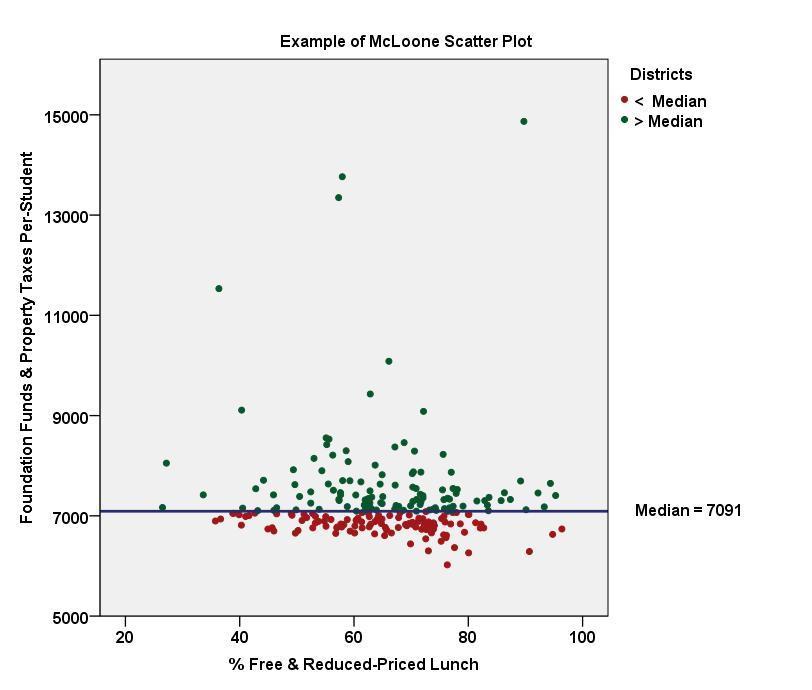
10 A Gini Coefficient of 0.10 or smaller is considered desirable. Both funding variables in the BLR study are Another popular equity measure, the McLoone Index, is the ratio of the sum of per-pupil revenues for all districts below the 50th percentile (or median revenue) to the sum of the same districts if their revenue equaled the median. The McLoone Index also is unaffected by the economy and state characteristics, but it only addresses the districts that fall below the median revenue. A McLoone Index of 0.95 or larger is desirable. In the BLR study, the indexes are 0.96 for foundation + taxes and 0.95 for foundation + other adequacy funding. 10
11 McLoone = S Revenues of Districts < Median # of Districts < Median(X) Median 11
12 12
13 13
14 14
15 Fiscal neutrality statistics are used to examine the relationship between property wealth and district revenue per pupil. An equitable distribution of revenue to school districts would indicate a limited if any relationship between property wealth and revenue. The wealth neutrality correlation is the relationship between property wealth and district per-pupil revenues. Correlations vary between 0 and +1, with lower correlations indicating less of a relationship. The wealth elasticity statistic is a more precise measure than the correlation because it indicates the exact increase in district revenue associated with a dollar increase in property wealth. Ordinary least squares regression is used to examine the amount of change in revenue with each dollar increase in property wealth. Tables 5 & 6 show results excluding 8 districts in which the uniform rate of tax (URT) generates more than the foundation funding rate of $6,
16 Fiscal Neutrality Wealth Neutrality Correlation Wealth Elasticity 0.000* Fiscal Neutrality Wealth Neutrality Correlation Wealth Elasticity 0.000* Note: *0.000 = in Tables 3 and 4 16
17 Districts Excluded 8 High Uniform Rate of Tax (URT) Fiscal Neutrality Wealth Neutrality Correlation Wealth Elasticity High URT Districts Excluded Fiscal Neutrality Wealth Neutrality Correlation Wealth Elasticity
, percent non-white, percent free and reduced-price lunch, and per-student property wealth.")

18 Vertical equity statistics are typically conducted on expenditures to assess the equity in spending according to key district characteristics. The district characteristics addressed in this study are average daily membership (ADM), percent non-white, percent free and reduced-price lunch, and per-student property wealth. The first vertical equity analysis (Chart 4) examines the relationship between expenditures from select state-funding and ADM. The two most prominent observations are the similarity in levels of expenditures across the 3 years shown, and the slightly higher per student expenses in the lower two ADM deciles. These findings indicate that there is virtually no relationship (or inequity) between school size (or ADM) and per-student spending, with the exception of observable higher expenditures in smaller districts, which is to be expected because of the well-established economies of scale issues. 18
19 Note; ADM deciles shown from Lowest (D1) to Highest (D10). 19
20 Chart 5 indicates that there is a perceptible increase in per-student expenditures in Decile10, or school districts with higher concentrations of non-white students. Otherwise, the spending patterns are commensurate across deciles and years. The somewhat similar pattern of results in Chart 6, with free & reducedpriced lunch percentages, suggest that Charts 5 and 6 likely represent varied (or derivative) measures of high concentrations of poverty, which require additional expenditures for supplemental programs. Chart 7 indicates a consistent pattern of per-pupil expenditures across deciles for all three years until decile10, which represents the highest property wealth per student. Decile10 is heavily influenced by 8 districts in which the uniform rate of tax (URT) generates more than the foundation funding rate of $6,521. In effect, this means that these 8 districts have more revenue than the foundation rate set by the General Assembly. 20
21 Note: % Non-White deciles shown from Lowest (D1) to Highest (D10). 21
22 Note: % Free & reduced-price lunch deciles shown from Lowest (D1) to Highest (D10). 22
 to Highest (D10).")
23 Note: Per-student property wealth deciles shown from Lowest (D1) to Highest (D10). 23
24 The pattern of relationships between expenditures from select state funds per student for each district demographic shown in Charts 4-7 are nearly identical to the patterns observed between the same demographics and total expenditures per student. For the sake of brevity, the vertical equity results for total expenditures per student are not presented in this power point presentation. However, these results are presented and discussed in the printed report. Taken together, the horizontal equity analyses offer convincing evidence that Arkansas has maintained an equitable distribution of funding over the past three years. The measures that are not influenced by the economy and state characteristics provide findings within the commonly accepted standards of equity. 24
. The Gini coefficient indicates that the funding distribution in Arkansas is just 5% from perfect equity.")
25 The McLoone Index showed that districts in the bottom half of the funding distribution (on both variables) are funded at 95% of the funding that they would receive if they were funded the amount at the median (or 50% percentile). The Gini coefficient indicates that the funding distribution in Arkansas is just 5% from perfect equity. An examination of wealth elasticity shows that each dollar increase in per-student property wealth is associated with an increase of about 11 cents in both funding variables studied. When district characteristics were divided into deciles, the vertical equity analyses revealed limited and relatively insignificant differences, with the exception of more spending in districts with higher concentrations of poverty and lower ADM. These latter finding are well-established results in the school finance literature. 25


26 Brent Benda Bureau of Legislative Research
20 Years of School Funding Post-DeRolph Ohio Education Policy Institute August 2018
 20 Years of School Funding Post-DeRolph Ohio Education Policy Institute August 2018 The 15 charts that accompany this summary provide an overview of how state and local funding has changed in 20 years
ASSESSING THE EQUITY OF KENTUCKY S SEEK FORMULA: A TEN-YEAR ANALYSIS
 ASSESSING THE EQUITY OF KENTUCKY S SEEK FORMULA: A TEN-YEAR ANALYSIS Prepared for The Kentucky Department of Education by Lawrence O. Picus Allan Odden Mark Fermanich September 2001 ASSESSING THE EQUITY
Criteria for Judging the Impact of Decreasing School Property Taxes
 Criteria for Judging the Impact of Decreasing School Property Taxes Policy Research Report School of Education Smith Center for Research 2805 E. 10th Street Bloomington, IN 47408-2698 Phone: (812) 855-1240
ECON 256: Poverty, Growth & Inequality. Jack Rossbach
 ECON 256: Poverty, Growth & Inequality Jack Rossbach Measuring Poverty Many different definitions for Poverty Cannot afford 2,000 calories per day Do not have basic needs met: clean water, health care,
An Analysis of Public and Private Sector Earnings in Ireland
 An Analysis of Public and Private Sector Earnings in Ireland 2008-2013 Prepared in collaboration with publicpolicy.ie by: Justin Doran, Nóirín McCarthy, Marie O Connor; School of Economics, University
Dot Plot: A graph for displaying a set of data. Each numerical value is represented by a dot placed above a horizontal number line.
 Introduction We continue our study of descriptive statistics with measures of dispersion, such as dot plots, stem and leaf displays, quartiles, percentiles, and box plots. Dot plots, a stem-and-leaf display,
INCOME INEQUALITY AND OTHER FORMS OF INEQUALITY. Sandip Sarkar & Balwant Singh Mehta. Institute for Human Development New Delhi
 INCOME INEQUALITY AND OTHER FORMS OF INEQUALITY Sandip Sarkar & Balwant Singh Mehta Institute for Human Development New Delhi 1 WHAT IS INEQUALITY Inequality is multidimensional, if expressed between individuals,
TRENDS IN INCOME DISTRIBUTION
 TRENDS IN INCOME DISTRIBUTION Authors * : Abstract: In modern society the income distribution is one of the major problems. Usually, it is considered that a severe polarisation in matter of income per
Chapter 3. Numerical Descriptive Measures. Copyright 2016 Pearson Education, Ltd. Chapter 3, Slide 1
 Chapter 3 Numerical Descriptive Measures Copyright 2016 Pearson Education, Ltd. Chapter 3, Slide 1 Objectives In this chapter, you learn to: Describe the properties of central tendency, variation, and
Common Compensation Terms & Formulas
 Common Compensation Terms & Formulas Common Compensation Terms & Formulas ERI Economic Research Institute is pleased to provide the following commonly used compensation terms and formulas for your ongoing
Topic 11: Measuring Inequality and Poverty
 Topic 11: Measuring Inequality and Poverty Economic well-being (utility) is distributed unequally across the population because income and wealth are distributed unequally. Inequality is measured by the
Online Appendix of. This appendix complements the evidence shown in the text. 1. Simulations
 Online Appendix of Heterogeneity in Returns to Wealth and the Measurement of Wealth Inequality By ANDREAS FAGERENG, LUIGI GUISO, DAVIDE MALACRINO AND LUIGI PISTAFERRI This appendix complements the evidence
Income Distribution and Poverty
 C H A P T E R 15 Income Distribution and Poverty Prepared by: Fernando Quijano and Yvonn Quijano Income Distribution and Poverty This chapter focuses on distribution. Why do some people get more than others?
GOVERNMENT POLICIES AND POPULARITY: HONG KONG CASH HANDOUT
 EMPIRICAL PROJECT 12 GOVERNMENT POLICIES AND POPULARITY: HONG KONG CASH HANDOUT LEARNING OBJECTIVES In this project you will: draw Lorenz curves assess the effect of a policy on income inequality convert
Math 2311 Bekki George Office Hours: MW 11am to 12:45pm in 639 PGH Online Thursdays 4-5:30pm And by appointment
 Math 2311 Bekki George bekki@math.uh.edu Office Hours: MW 11am to 12:45pm in 639 PGH Online Thursdays 4-5:30pm And by appointment Class webpage: http://www.math.uh.edu/~bekki/math2311.html Math 2311 Class
INEQUALITY UNDER THE LABOUR GOVERNMENT
 INEQUALITY UNDER THE LABOUR GOVERNMENT Andrew Shephard THE INSTITUTE FOR FISCAL STUDIES Briefing Note No. 33 Income Inequality under the Labour Government Andrew Shephard a.shephard@ifs.org.uk Institute
Data screening, transformations: MRC05
 Dale Berger Data screening, transformations: MRC05 This is a demonstration of data screening and transformations for a regression analysis. Our interest is in predicting current salary from education level
Math2UU3*TEST4. Duration of Test: 60 minutes McMaster University, 27 November Last name (PLEASE PRINT): First name (PLEASE PRINT): Student No.
: First name (PLEASE PRINT): Student No.") Math2UU3*TEST4 Day Class Duration of Test: 60 minutes McMaster University, 27 November 208 Dr M. Lovrić Last name (PLEASE PRINT): First name (PLEASE PRINT): This test has 8 pages. Calculators allowed:
Math2UU3*TEST4 Day Class Duration of Test: 60 minutes McMaster University, 27 November 208 Dr M. Lovrić Last name (PLEASE PRINT): First name (PLEASE PRINT): This test has 8 pages. Calculators allowed:
Test Yourself: Income, Transfers and Taxes
 Test Yourself: Income, Transfers and Taxes I wish it need not have happened in my time," said Frodo. "So do I," said Gandalf, "and so do all who live to see such times. But that is not for them to decide.
ECON 450 Development Economics
 and Poverty ECON 450 Development Economics Measuring Poverty and Inequality University of Illinois at Urbana-Champaign Summer 2017 and Poverty Introduction In this lecture we ll introduce appropriate measures
1 Income Inequality in the US
 1 Income Inequality in the US We started this course with a study of growth; Y = AK N 1 more of A; K; and N give more Y: But who gets the increased Y? Main question: if the size of the national cake Y
WEEK 7 INCOME DISTRIBUTION & QUALITY OF LIFE
 WEEK 7 INCOME DISTRIBUTION & QUALITY OF LIFE Di akhir topik ini, pelajar akan dapat menjelaskan Agihan pendapatan Konsep and pengukuran kemiskinan Insiden kemiskinan dalam dan luar negara Why is income
The Differential Impact of the TACIR and CBER Equalization Formulas on Tennessee s K-12 Public Education Finance System
 MANAGEMENT ANALYSIS & PLANNING, INC. The Differential Impact of the TACIR and CBER Equalization Formulas on Tennessee s K-12 Public Education Finance System A Report Commissioned by Tennessee School Systems
Effects of Hold Harmless Provisions on School Funding Formulas
 Effects of Hold Harmless Provisions on School Funding Formulas March 24, 2006 Robert K. Toutkoushian Associate Professor Educational Leadership & Policy Studies Education 4220 Indiana University rtoutkou@indiana.edu
Sierra Environmental Studies Foundation
 TN0903-1: Gini Index Made Simple George Rebane, Ph.D. SESF, Director of Research 22 March 2009 1 Overview The distribution of wealth or income over a population is of great interest to economists, sociologists,
Economics 448: Lecture 14 Measures of Inequality
 Economics 448: Measures of Inequality 6 March 2014 1 2 The context Economic inequality: Preliminary observations 3 Inequality Economic growth affects the level of income, wealth, well being. Also want
MLC at Boise State Logarithms Activity 6 Week #8
 Logarithms Activity 6 Week #8 In this week s activity, you will continue to look at the relationship between logarithmic functions, exponential functions and rates of return. Today you will use investing
Household Income and Asset Distribution in Korea
 Household Income and Asset Distribution in Korea Sang-ho Nam Research Fellow, KIHASA Introduction This study bases its analysis of household and asset distribution on the Household Finances and Welfare
METHODOLOGICAL ISSUES IN POVERTY RESEARCH
 METHODOLOGICAL ISSUES IN POVERTY RESEARCH IMPACT OF CHOICE OF EQUIVALENCE SCALE ON INCOME INEQUALITY AND ON POVERTY MEASURES* Ödön ÉLTETÕ Éva HAVASI Review of Sociology Vol. 8 (2002) 2, 137 148 Central
Chapter 14. Descriptive Methods in Regression and Correlation. Copyright 2016, 2012, 2008 Pearson Education, Inc. Chapter 14, Slide 1
 Chapter 14 Descriptive Methods in Regression and Correlation Copyright 2016, 2012, 2008 Pearson Education, Inc. Chapter 14, Slide 1 Section 14.1 Linear Equations with One Independent Variable Copyright
Redistribution of Income (in Great Britain/explained by Lorenz Curves)
") Redistribution of Income (in Great Britain/explained by Lorenz Curves) The Government can redistribute from the rich to the poor by progressive taxes or by regressive benefits. Taxes are progressive if
Redistribution of Income (in Great Britain/explained by Lorenz Curves) The Government can redistribute from the rich to the poor by progressive taxes or by regressive benefits. Taxes are progressive if
Lecture Slides. Elementary Statistics Tenth Edition. by Mario F. Triola. and the Triola Statistics Series. Slide 1
 Lecture Slides Elementary Statistics Tenth Edition and the Triola Statistics Series by Mario F. Triola Slide 1 Chapter 6 Normal Probability Distributions 6-1 Overview 6-2 The Standard Normal Distribution
Big Bad Banks? The Winners and Losers from Bank Deregulation in the United States
 Online Internet Appendix Big Bad Banks? The Winners and Losers from Bank Deregulation in the United States THORSTEN BECK, ROSS LEVINE, AND ALEXEY LEVKOV January 2010 In this appendix, we provide additional
Copies can be obtained from the:
 Published by the Stationery Office, Dublin, Ireland. Copies can be obtained from the: Central Statistics Office, Information Section, Skehard Road, Cork, Government Publications Sales Office, Sun Alliance
Categorical. A general name for non-numerical data; the data is separated into categories of some kind.
 Chapter 5 Categorical A general name for non-numerical data; the data is separated into categories of some kind. Nominal data Categorical data with no implied order. Eg. Eye colours, favourite TV show,
The Normal Distribution
 Stat 6 Introduction to Business Statistics I Spring 009 Professor: Dr. Petrutza Caragea Section A Tuesdays and Thursdays 9:300:50 a.m. Chapter, Section.3 The Normal Distribution Density Curves So far we
Poverty and Income Distribution
 Poverty and Income Distribution SECOND EDITION EDWARD N. WOLFF WILEY-BLACKWELL A John Wiley & Sons, Ltd., Publication Contents Preface * xiv Chapter 1 Introduction: Issues and Scope of Book l 1.1 Recent
DATA HANDLING Five-Number Summary
 DATA HANDLING Five-Number Summary The five-number summary consists of the minimum and maximum values, the median, and the upper and lower quartiles. The minimum and the maximum are the smallest and greatest
BANKWEST CURTIN ECONOMICS CENTRE INEQUALITY IN LATER LIFE. The superannuation effect. Helen Hodgson, Alan Tapper and Ha Nguyen
 BANKWEST CURTIN ECONOMICS CENTRE INEQUALITY IN LATER LIFE The superannuation effect Helen Hodgson, Alan Tapper and Ha Nguyen BCEC Research Report No. 11/18 March 2018 About the Centre The Bankwest Curtin
Redistributive Effects of Pension Reform in China
 COMPONENT ONE Redistributive Effects of Pension Reform in China Li Shi and Zhu Mengbing China Institute for Income Distribution Beijing Normal University NOVEMBER 2017 CONTENTS 1. Introduction 4 2. The
VARIABILITY: Range Variance Standard Deviation
 VARIABILITY: Range Variance Standard Deviation Measures of Variability Describe the extent to which scores in a distribution differ from each other. Distance Between the Locations of Scores in Three Distributions
the regional distribution of income
 the regional distribution of income The Distribution Of Household Income In Hampton Roads F. Scott Fitzgerald: The very rich are different from you and me. Ernest Hemingway: Yes, they have more money.
Assessing the distribution of impacts in global benefit-cost analysis
 Assessing the distribution of impacts in global benefit-cost analysis Lisa A. Robinson & James K. Hammitt with supplement by Matthew D. Adler Harvard Center for Risk Analysis Outline BCA Separates analysis
The Brattle Group 1 st Floor 198 High Holborn London WC1V 7BD
 UPDATED ESTIMATE OF BT S EQUITY BETA NOVEMBER 4TH 2008 The Brattle Group 1 st Floor 198 High Holborn London WC1V 7BD office@brattle.co.uk Contents 1 Introduction and Summary of Findings... 3 2 Statistical
The Gender Earnings Gap: Evidence from the UK
 Fiscal Studies (1996) vol. 17, no. 2, pp. 1-36 The Gender Earnings Gap: Evidence from the UK SUSAN HARKNESS 1 I. INTRODUCTION Rising female labour-force participation has been one of the most striking
MA131 Lecture 8.2. The normal distribution curve can be considered as a probability distribution curve for normally distributed variables.
 Normal distribution curve as probability distribution curve The normal distribution curve can be considered as a probability distribution curve for normally distributed variables. The area under the normal
IOP 201-Q (Industrial Psychological Research) Tutorial 5
 Tutorial 5") IOP 201-Q (Industrial Psychological Research) Tutorial 5 TRUE/FALSE [1 point each] Indicate whether the sentence or statement is true or false. 1. To establish a cause-and-effect relation between two variables,
IOP 201-Q (Industrial Psychological Research) Tutorial 5 TRUE/FALSE [1 point each] Indicate whether the sentence or statement is true or false. 1. To establish a cause-and-effect relation between two variables,
Social experiment. If you have P500 pesos in your wallet, what would you do with it?
 Social experiment If you have P500 pesos in your wallet, what would you do with it? xxxxxxx xxxxxxx Anna from Infanta, Quezon, 10 years old and is the 3 rd among children of 7 Dropped out of school at
WEALTH INEQUALITY AND HOUSEHOLD STRUCTURE: US VS. SPAIN. Olympia Bover
 WEALTH INEQUALITY AND HOUSEHOLD STRUCTURE: US VS. SPAIN Olympia Bover 1 Introduction and summary Dierences in wealth distribution across developed countries are large (eg share held by top 1%: 15 to 35%)
Table 1 sets out national accounts information from 1994 to 2001 and includes the consumer price index and the population for these years.
 WHAT HAPPENED TO THE DISTRIBUTION OF INCOME IN SOUTH AFRICA BETWEEN 1995 AND 2001? Charles Simkins University of the Witwatersrand 22 November 2004 He read each wound, each weakness clear; And struck his
Example: Histogram for US household incomes from 2015 Table:
 1 Example: Histogram for US household incomes from 2015 Table: Income level Relative frequency $0 - $14,999 11.6% $15,000 - $24,999 10.5% $25,000 - $34,999 10% $35,000 - $49,999 12.7% $50,000 - $74,999
Welfare Analysis of the Chinese Grain Policy Reforms
 Katchova and Randall, International Journal of Applied Economics, 2(1), March 2005, 25-36 25 Welfare Analysis of the Chinese Grain Policy Reforms Ani L. Katchova and Alan Randall University of Illinois
CHAPTER \11 SUMMARY OF FINDINGS, CONCLUSION AND SUGGESTION. decades. Income distribution, as reflected in the distribution of household
 CHAPTER \11 SUMMARY OF FINDINGS, CONCLUSION AND SUGGESTION Income distribution in India shows remarkable stability over four and a half decades. Income distribution, as reflected in the distribution of
Development. AEB 4906 Development Economics
 Poverty, Inequality, and Development AEB 4906 Development Economics http://danielsolis.webs.com/aeb4906.htm Poverty, Inequality, and Development Outline: Measurement of Poverty and Inequality Economic
1 The Gini coefficient was developed by Corrado Gini, Variabilità. TAX NOTES, September 5,
 Taxes, Transfers, Progressivity, And Redistribution: Part 1 by Sita N. Slavov and Alan D. Viard Sita N. Slavov Sita N. Slavov is a professor of public policy at the Schar School of Policy and Government
Summarising Data. Summarising Data. Examples of Types of Data. Types of Data
 Summarising Data Summarising Data Mark Lunt Arthritis Research UK Epidemiology Unit University of Manchester Today we will consider Different types of data Appropriate ways to summarise these data 17/10/2017
DEPARTMENT OF ECONOMICS THE UNIVERSITY OF NEW BRUNSWICK FREDERICTON, CANADA
 FEDERAL INCOME TAX CUTS AND REGIONAL DISPARITIES by Maxime Fougere & G.C. Ruggeri Working Paper Series 2001-06 DEPARTMENT OF ECONOMICS THE UNIVERSITY OF NEW BRUNSWICK FREDERICTON, CANADA FEDERAL INCOME
between Income and Life Expectancy
 National Insurance Institute of Israel The Association between Income and Life Expectancy The Israeli Case Abstract Team leaders Prof. Eytan Sheshinski Prof. Daniel Gottlieb Senior Fellow, Israel Democracy
Poverty, Inequality, and Development
 Poverty, Inequality, and Development Outline: Poverty, Inequality, and Development Measurement of Poverty and Inequality Economic characteristics of poverty groups Why is inequality a problem? Relationship
COMMENTARY NUMBER Household Income, August Housing Starts September 18, 2013
 COMMENTARY NUMBER 558 2012 Household Income, August Housing Starts September 18, 2013 At An 18-Year Low, 2012 Real Median Household Income Was Below Levels Seen in 1968 through 1974 2012 Income Variance
NBER WORKING PAPER SERIES CHANGING PROGRESSIVITY AS A MEANS OF RISK PROTECTION IN INVESTMENT-BASED SOCIAL SECURITY. Andrew A.
 NBER WORKING PAPER SERIES CHANGING PROGRESSIVITY AS A MEANS OF RISK PROTECTION IN INVESTMENT-BASED SOCIAL SECURITY Andrew A. Samwick Working Paper 13059 http://www.nber.org/papers/w13059 NATIONAL BUREAU
Chapter 6. y y. Standardizing with z-scores. Standardizing with z-scores (cont.)
") Starter Ch. 6: A z-score Analysis Starter Ch. 6 Your Statistics teacher has announced that the lower of your two tests will be dropped. You got a 90 on test 1 and an 85 on test 2. You re all set to drop
Starter Ch. 6: A z-score Analysis Starter Ch. 6 Your Statistics teacher has announced that the lower of your two tests will be dropped. You got a 90 on test 1 and an 85 on test 2. You re all set to drop
CASE FAIR OSTER PRINCIPLES OF MICROECONOMICS E L E V E N T H E D I T I O N. PEARSON 2012 Pearson Education, Inc. Publishing as Prentice Hall
 PART III Market Imperfections and the Role of Government PRINCIPLES OF MICROECONOMICS E L E V E N T H E D I T I O N CASE FAIR OSTER PEARSON 2012 Pearson Education, Inc. Publishing as Prentice Hall Prepared
THE DISAGGREGATION OF THE GIN1 COEFFICIENT BY FACTOR COMPONENTS AND ITS APPLICATIONS TO AUSTRALIA
 Review of Income and Wealth Series 39, Number 1, March 1993 THE DISAGGREGATION OF THE GIN1 COEFFICIENT BY FACTOR COMPONENTS AND ITS APPLICATIONS TO AUSTRALIA The University of New South Wales This paper
E-322 Muhammad Rahman CHAPTER-3
 CHAPTER-3 A. OBJECTIVE In this chapter, we will learn the following: 1. We will introduce some new set of macroeconomic definitions which will help us to develop our macroeconomic language 2. We will develop
Income and Non-Income Inequality in Post- Apartheid South Africa: What are the Drivers and Possible Policy Interventions?
 Income and Non-Income Inequality in Post- Apartheid South Africa: What are the Drivers and Possible Policy Interventions? Haroon Bhorat Carlene van der Westhuizen Toughedah Jacobs Haroon.Bhorat@uct.ac.za
Week 1 Variables: Exploration, Familiarisation and Description. Descriptive Statistics.
 Week 1 Variables: Exploration, Familiarisation and Description. Descriptive Statistics. Convergent validity: the degree to which results/evidence from different tests/sources, converge on the same conclusion.
Long Description. Figure 15-1: Contract Status. Page 1 of 7
 Page 1 of 7 Figure 15-1: Contract Status A single performance report provides the status of the Program at a point in time. When combined with previous reports, a much more revealing picture of the Program
1. Average Value of a Continuous Function. MATH 1003 Calculus and Linear Algebra (Lecture 30) Average Value of a Continuous Function
 Average Value of a Continuous Function") 1. Average Value of a Continuous Function MATH 1 Calculus and Linear Algebra (Lecture ) Maosheng Xiong Department of Mathematics, HKUST Definition Let f (x) be a continuous function on [a, b]. The average
1. Average Value of a Continuous Function MATH 1 Calculus and Linear Algebra (Lecture ) Maosheng Xiong Department of Mathematics, HKUST Definition Let f (x) be a continuous function on [a, b]. The average
Income Inequality and Poverty (Chapter 20 in Mankiw & Taylor; reading Chapter 19 will also help)
") Income Inequality and Poverty (Chapter 20 in Mankiw & Taylor; reading Chapter 19 will also help) Before turning to money and inflation, we backtrack - at least in terms of the textbook - to consider income
Income Inequality and Poverty (Chapter 20 in Mankiw & Taylor; reading Chapter 19 will also help) Before turning to money and inflation, we backtrack - at least in terms of the textbook - to consider income
Tax and fairness. Background Paper for Session 2 of the Tax Working Group
 Tax and fairness Background Paper for Session 2 of the Tax Working Group This paper contains advice that has been prepared by the Tax Working Group Secretariat for consideration by the Tax Working Group.
Social Studies 201 January 28, 2005 Measures of Variation Overview
 1 Social Studies 201 January 28, 2005 Measures of Variation Overview Measures of variation (range, interquartile range, standard deviation, variance, and coefficient of relative variation) are presented
International Journal of Innovative Research in Management Studies (IJIRMS) ISSN (Online): Volume 1 Issue 4 May 2016
 ISSN (Online): Volume 1 Issue 4 May 2016") A STUDY ON STOCK SELECTION WITH SPECIAL REFERENCE TO BOOK VALUE, EARNING PER SHARE AND MARKET PRICE S.Mahalakshmi* *II Year MBA Student, School of Management, SASTRA University, Thanjavur, South India
A STUDY ON STOCK SELECTION WITH SPECIAL REFERENCE TO BOOK VALUE, EARNING PER SHARE AND MARKET PRICE S.Mahalakshmi* *II Year MBA Student, School of Management, SASTRA University, Thanjavur, South India
Volume 29, Issue 3. A new look at the trickle-down effect in the united states economy
 Volume 9, Issue 3 A new look at the trickle-down effect in the united states economy Yuexing Lan Auburn University Montgomery Charles Hegji Auburn University Montgomery Abstract This paper is a further
Taxes: Equity vs. Efficiency Part I The only difference between death and taxes is that death doesn't get worse every time Congress meets.
 Taxes: Equity vs. Efficiency Part I The only difference between death and taxes is that death doesn't get worse every time Congress meets. Will Rogers What Is Income? There are several ways to measure
Shifts in Non-Income Welfare in South Africa
 Shifts in Non-Income Welfare in South Africa 1993-2004 DPRU Policy Brief Series Development Policy Research unit School of Economics University of Cape Town Upper Campus June 2006 ISBN: 1-920055-30-4 Copyright
Impact of Unemployment and GDP on Inflation: Imperial study of Pakistan s Economy
 International Journal of Current Research in Multidisciplinary (IJCRM) ISSN: 2456-0979 Vol. 2, No. 6, (July 17), pp. 01-10 Impact of Unemployment and GDP on Inflation: Imperial study of Pakistan s Economy
Understanding Income Distribution and Poverty
 Understanding Distribution and Poverty : Understanding the Lingo market income: quantifies total before-tax income paid to factor markets from the market (i.e. wages, interest, rent, and profit) total
TRENDS IN LONG-RUN VERSUS CROSS-SECTION EARNINGS INEQUALITY IN THE 1970s AND 1980s
 Review of Income and Wealth Series 44, Number 2, June 1998 TRENDS IN LONG-RUN VERSUS CROSS-SECTION EARNINGS INEQUALITY IN THE 1970s AND 1980s The Center for Naval Analyses, Alexandria, VA This paper uses
THE SENSITIVITY OF INCOME INEQUALITY TO CHOICE OF EQUIVALENCE SCALES
 Review of Income and Wealth Series 44, Number 4, December 1998 THE SENSITIVITY OF INCOME INEQUALITY TO CHOICE OF EQUIVALENCE SCALES Statistics Norway, To account for the fact that a household's needs depend
Over the five year period spanning 2007 and
 Poverty, Shared Prosperity and Subjective Well-Being in Iraq 2 Over the five year period spanning 27 and 212, Iraq s GDP grew at a cumulative rate of over 4 percent, averaging 7 percent per year between
appstats5.notebook September 07, 2016 Chapter 5
 Chapter 5 Describing Distributions Numerically Chapter 5 Objective: Students will be able to use statistics appropriate to the shape of the data distribution to compare of two or more different data sets.
Contents Part I Descriptive Statistics 1 Introduction and Framework Population, Sample, and Observations Variables Quali
 Part I Descriptive Statistics 1 Introduction and Framework... 3 1.1 Population, Sample, and Observations... 3 1.2 Variables.... 4 1.2.1 Qualitative and Quantitative Variables.... 5 1.2.2 Discrete and Continuous
Historical Trends in the Degree of Federal Income Tax Progressivity in the United States
 Kennesaw State University DigitalCommons@Kennesaw State University Faculty Publications 5-14-2012 Historical Trends in the Degree of Federal Income Tax Progressivity in the United States Timothy Mathews
Putting Things Together Part 2
 Frequency Putting Things Together Part These exercise blend ideas from various graphs (histograms and boxplots), differing shapes of distributions, and values summarizing the data. Data for, and are in
8. From FRED, search for Canada unemployment and download the unemployment rate for all persons 15 and over, monthly,
 Economics 250 Introductory Statistics Exercise 1 Due Tuesday 29 January 2019 in class and on paper Instructions: There is no drop box and this exercise can be submitted only in class. No late submissions
Real Estate Ownership by Non-Real Estate Firms: The Impact on Firm Returns
 Real Estate Ownership by Non-Real Estate Firms: The Impact on Firm Returns Yongheng Deng and Joseph Gyourko 1 Zell/Lurie Real Estate Center at Wharton University of Pennsylvania Prepared for the Corporate
Chapter URL:
 This PDF is a selection from an out-of-print volume from the National Bureau of Economic Research Volume Title: The Behavior of Prices Volume Author/Editor: Frederick C. Mills Volume Publisher: NBER Volume
Social Situation Monitor - Glossary
 Social Situation Monitor - Glossary Active labour market policies Measures aimed at improving recipients prospects of finding gainful employment or increasing their earnings capacity or, in the case of
CIE Economics A-level
 CIE Economics A-level Topic 3: Government Microeconomic Intervention b) Equity and policies towards income and wealth redistribution Notes In the absence of government intervention, the market mechanism
Poverty and Income Distribution
 MPU 3212- Malaysian Economy Week # 9 Poverty and Income Distribution Professor Dr. Ahmad Bin Othman School of Business and Management University College of Technology Sarawak Sibu, Sarawak, MALAYSIA ahmadbo@ucts.edu.my
Empirical public economics, part II. Thor O. Thoresen, room 1125, Friday 10-11
 1 Empirical public economics, part II Thor O. Thoresen, room 1125, Friday 10-11 1 Reading Thoresen, T.O., E.E. Bø, E. Fjærli and E. Halvorsen (2012): A Suggestion for Evaluating the Redistributional Effects
STAB22 section 1.3 and Chapter 1 exercises
 STAB22 section 1.3 and Chapter 1 exercises 1.101 Go up and down two times the standard deviation from the mean. So 95% of scores will be between 572 (2)(51) = 470 and 572 + (2)(51) = 674. 1.102 Same idea
Stat 101 Exam 1 - Embers Important Formulas and Concepts 1
 1 Chapter 1 1.1 Definitions Stat 101 Exam 1 - Embers Important Formulas and Concepts 1 1. Data Any collection of numbers, characters, images, or other items that provide information about something. 2.
LINES AND SLOPES. Required concepts for the courses : Micro economic analysis, Managerial economy.
 LINES AND SLOPES Summary 1. Elements of a line equation... 1 2. How to obtain a straight line equation... 2 3. Microeconomic applications... 3 3.1. Demand curve... 3 3.2. Elasticity problems... 7 4. Exercises...
Influence of Personal Factors on Health Insurance Purchase Decision
 Influence of Personal Factors on Health Insurance Purchase Decision INFLUENCE OF PERSONAL FACTORS ON HEALTH INSURANCE PURCHASE DECISION The decision in health insurance purchase include decisions about
Michigan Consumer Sentiment: August Preliminary Slips
 Michigan Consumer Sentiment: August Preliminary Slips August 17, 2018 by Jill Mislinski of Advisor Perspectives The University of Michigan Preliminary Consumer Sentiment for August came in at 95.3, down
Presented at the 2003 SCEA-ISPA Joint Annual Conference and Training Workshop -
 Predicting Final CPI Estimating the EAC based on current performance has traditionally been a point estimate or, at best, a range based on different EAC calculations (CPI, SPI, CPI*SPI, etc.). NAVAIR is
Basic Procedure for Histograms
 Basic Procedure for Histograms 1. Compute the range of observations (min. & max. value) 2. Choose an initial # of classes (most likely based on the range of values, try and find a number of classes that
BUDGET Québec and the Fight Against Poverty. Social Solidarity
 BUDGET 2012-2013 Québec and the Fight Against Poverty Social Solidarity Paper inside pages 100% This document is printed on completely recycled paper, made in Québec, contaning 100% post-consumer fibre