|
|
|
- Regina May
- 5 years ago
- Views:
Transcription


1


2 North Carolina Competitiveness NC
3 200, , , , , ,000 80,000 60,000 40,000 20,000 0 The Punch Job Change 1990 to ,905 30,685 The loss of about 80% of our traditional manufacturing jobs 16,530 6,119 92,531 8,338 86,962 Textiles Tobacco App/Cut Sew Furniture 30, Source: NCESC.com
4
5 NC Employment Changes By Sector % 40% 30% 20% 10% 0% -10% -20% -30% -40% -50% 1% Total -9% Agriculture -30% Mining -14% Utilities -26% Construction -42% Manufacturing 3% Wholesale 0% Retail -13% -18% Trans/Ware Info 18% Finance/Ins 1% Real Estate 35% 27% 40% Prof/Tech Education Health 28% 28% Art/Enter Accom/Food Employees on nonfarm payrolls by state and selected industry sector, seasonally adjusted Source: QCEW County Sector Data
6 60% 40% NC and Prosperity Zone 8 Employment Changes By Sector 55% % 34% 30% 18% 28% 20% 0% -20% -40% 6% -23% -21% -25% -2% 5% -12% -3% -2% 1% -60% Accom/Food Art/Enter Health Education Prof/Tech Real Estate Finance/Ins Info Trans/Ware Retail Wholesale Manufacturing Construction Utilities Agriculture Total Employees on nonfarm payrolls by state and selected industry sector, seasonally adjusted Source: QCEW County Sector Data
7 15% 10% 5% Prosperity Zone Comparisons Total Job Growth % 5.4% 6.4% 0% -5% -1.8% -2.6% -0.9% -10% -15% -20% -25% -21.4% -9.9% Zone 1 Zone 2 Zone 3 Zone 4 Zone 5 Zone 6 Zone 7 Zone 8 Source: QCEW County Sector Data
8 Prosperity Zone Comparisons Total Manufacturing Growth % -10% -20% -30% -25.4% -40% -33.8% -36.4% -50% -46.7% -41.4% -46.1% -42.6% -60% -53.1% Zone 1 Zone 2 Zone 3 Zone 4 Zone 5 Zone 6 Zone 7 Zone 8 Source: QCEW County Sector Data

 Middle Third (4) Bottom Third (14) Source:")
9 2013 Economic Strength Ranking for NC Metropolitan and Micropolitan Statistical Areas Of 366 Metropolitan Areas Top Third (7) Middle Third (3) Bottom Third (4) Of 576 Micropolitan Areas Top Third (8) Middle Third (4) Bottom Third (14) Source: Policom.com, 2013
10 NC Employment Growth 4,500,000 4,000,000 3,500,000 3,000,000 2,500,000 2,000,000 1,500,000 1,000, , Jan Annual Employment Source:NCESC.com
11 3.0% Southern States 1-Year Employment Changes July 2012 to July % 2.7% 2.5% 2.0% 1.5% 1.0% 0.5% 0.9% 1.2% 1.9% 2.2% 2.0% 1.8% 1.7% 1.5% 1.2% 1.2% 1.0% 0.6% 1.4% 0.8% 0.0% AL AR FL GA KY LA MD MO MS NC OK SC TN TX VA WV Source: U.S. BLS, Dec, Measured July July 2013
12 300, , ,000 Southern States 1-Year Employment Changes 293, , ,000 50, ,800 13, , ,100 39,000 46,800 24,200 18,900 23,400 69,200 9,700 36,800 32,300 51,600 6,400 AL AR FL GA KY LA MD MO MS NC OK SC TN TX VA WV Source: U.S. BLS, Dec, Measured May 2012 to May 2013

13 NC Real GDP By Industry % 20% 18% 22% 20% 15% 10% 5% 0% 1% 5% 4% 3% 13% 11% 11% 3% 5% 4% 4% 11% 10% 1% 1% 7% 7% 15% 3% 3% 2% 2% 14% NC South Source: Georgetown Public Policy Institute, Carnevale and Smith, July 2012
14 Southern States Per Capita Income (% Different from Nation Change) 50% 40% 30% 20% 10% 0% 7.5% 20.5% 7.5% 39.2% 8.5% 1.5% U.S. Change 120.6% Inflation 73% 31.5% 22.0% 6.7% 19.7% 11.2% 18.2% -10% -20% -5.1% -4.3% -13.0% -10.7% AL AR FL GA KY LA MD MO MS NC OK SC TN TX VA WV Source: bber, University of New Mexico
15 NC Per Capita Income Compared to $45,000 $40,000 $35,000 $30,000 $25,000 $20,000 $15,000 $10,000 $5,000 $0 U.S United States NC Source: bber, University of New Mexico
16 5.0% 4.5% 4.0% 3.5% 3.0% 2.5% 2.0% 1.5% 1.0% 0.5% 0.0% 1.6% Southern States Real Personal Income Change 2011 U.S. Change 2.7% 2.6% 2.2% 3.0% 2.6% 2.5% 2.7% 2.1% 1.7% 1.3% 4.1% 1.9% 2.1% 4.3% 2.9% 2.2% AL AR FL GA KY LA MD MO MS NC OK SC TN TX VA WV Source: BLS, June 2013
17 25.0% Southern States Percentage of People Living Below the Poverty Rate 22.6% 20.0% 15.0% 15.9% 19.0% 19.5% 17.0% 20.4% 19.1% 19.1% 15.8% 18.3% 18.9% 17.9% 17.2% 18.5% 18.6% 10.0% 10.1% 11.5% 5.0% 0.0% USA AL AR FL GA KY LA MD MO MS NC OK SC TN TX VA WV PERCENT OF PEOPLE BELOW POVERTY LEVEL IN THE PAST 12 MONTHS (FOR WHOM POVERTY STATUS IS DETERMINED Source: US Census, American Fact Finder, July 2013
18 GDP/Capita Changes in the NC $50, $45,000 $40,000 $35,000 $30, NC USA Source: BEA, Oct 2012


19 Major Global Trends Impacting Competitiveness


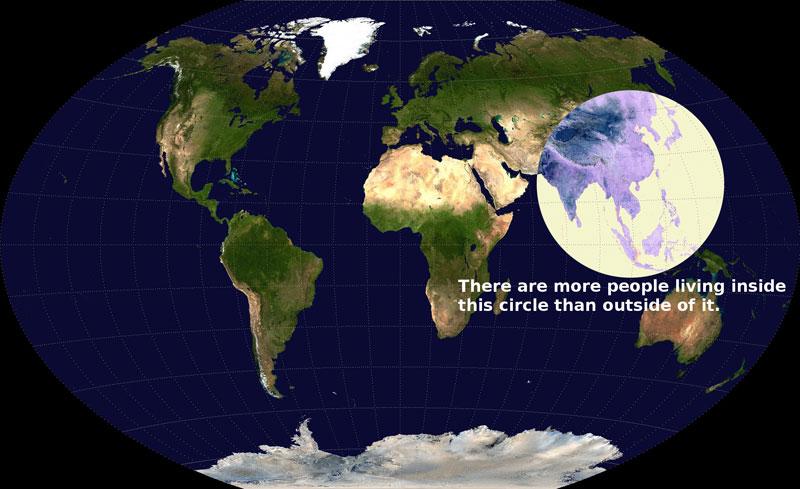
20 Urbanization We Are Becoming A World Where People Live in Urban Regions
21 100% 90% 80% 70% 60% 50% 40% 30% 20% 10% 0% U.S. Population Concentration Metro-Non-Metro Almost 60% of US population lives in Cities of 1 million or more In 2012 over 90% of GDP and 86% of all jobs are in metropolitan areas 80% Metro Non-Metro Source: Census
22 Southern States % of Population Rural % 50% 40% 30% 41% 44% 25% 42% 27% 30% 51% 34% 34% 34% 34% 25% 51% 20% 10% 9% 13% 15% 0% AL AR FL GA KY LA MD MO MS NC OK SC TN TX VA WV Source: U.S. Census 2010

23 NC Gross State Product 2011 Other Metros 6% Non-Metro 19% Charlotte 25% Fayetteville 4% Asheville 3% Hickory 3% Wilmington 3% Piedmont Triad 14% Research Triangle 23% Source: IHS Global Insight, 2013

24 The Talent Bar
25 US Adults Years School Completed 80% 70% 60% 50% 76% In 1980, 32% had some college & 17% BA In 2010, 56% some college & 30% BA % 30% 20% 10% 31% 14% 13% 37% 31% 26% 15% 5% 5% 17% 30% % Less than HS HS Grad Some College BA plus

26 Degree attainment Rate By Southern 45% 40% 35% 30% 25% 20% 15% 10% 5% 0% 32% 28% 37% 36% State % 28% 45% 36% 38% 35% 34% 32% 30% 32% 44% AL AR FL GA KY LA MD MO MS NC OK SC TN TX VA WV 26% Source: Lumina Foundation, March 2012


27 Technology


28 Energy McKinsey & Company Disruptive Technologies: May 2013 Mobile Internet Advanced Materials Next Generation Genomics Robotics, Cloud, Digital-intelligence, 3D Printing

29 Global Interdependence
30
 demands/expectations changed")
31 Today s Persistent New Reality The economy changed The competition changed Locational factors changed The U.S. workforce has changed The talent demands changed Life cycles have changed Tools have changed Customer (talent & companies) demands/expectations changed The pace of change and everything else changed


32 A society grows great when old men plant trees whose shade they know they will never sit in. Greek Proverb
33 Listening Tour Recap
34 Listening Tour Recap By the numbers: 8 events 11 weeks 150+ social media mentions 1,000+ assessment surveys 1,000+ participants 1,920 miles traveled
35 Survey Recap Top 3 What are you hearing about quality of workforce? 1. Employers have trouble finding the right technical skills 2. Employers have trouble finding people with soft skills 3. Employees have good skills but need retraining for specific job requirements
36 Survey Recap Top 3 What is reason for skills gap between workers and available jobs? 1. Mismatch between what is being taught in K-12 and skills that employers say are necessary 2. Mismatch between what is being taught in higher ed and skills that employers say are necessary 3. Demographics aging population with lack of new skills
37 Survey Recap Top 5 What can the state do to help businesses in your region? 1. Invest more in local infrastructure 2. Invest more in education 3. Invest more in job training 4. Reduce government regulations 5. Provide more access to capital
38 Survey Recap Top 5 What is most important role of state govt. to grow economy and create jobs? 1. Train and retrain workers 2. Provide incentives to attract companies 3. Aggressive marketing and branding 4. Provide technical assistance to help existing businesses grow 5. Provide capital to small businesses to help them grow
39 JOBS NORTH CAROLINA North Carolina Economic Development Board Recommended Strategies for Economic Growth Identify key growth industries & develop a brand strategy to maximize statewide growth for high quality, sustainable jobs. Create a competitive business climate that drives job growth, retention & attraction in every sector of the economy statewide. Promote innovation, attract early-stage investment and support entrepreneurs. Attract the creative class and retiree population to North Carolina.
40 JOBS NORTH CAROLINA North Carolina Economic Development Board Recommended Strategies for Economic Growth Develop and retain a globally competitive workforce with the knowledge and skills for high quality, sustainable North Carolina jobs. Spread prosperity, jobs and investment to the rural areas of the state. Develop programs that provide local communities with the opportunity to thrive. Streamline economic, workforce and community development functions and measure the effectiveness of state development activities.

41
42 Leadership and learning are indispensable to each other. John F. Kennedy
I Have Nothing Profound the Say. except, many of the things we used to know we all knew, have changed 7/23/2014. Ted Abernathy
 Ted Abernathy ted@econleadership.com Everybody farmed and all 4 worked in textile mills of NC (First generation workers) Everybody lived in towns of less than 3,000 (sort of) The highest grade of school
Missouri employment grew a total of 2.5% between 2004 and 2014, the 42 nd slowest rate among the 50 states.
 Did you know? Missouri employment grew a total of 2.5% between 2004 and 2014, the 42 nd slowest rate among the 50 states. Source: The Bureau of Labor Statistics Did you know? Missouri s real GDP per capita
Zions Bank Economic Overview
 Zions Bank Economic Overview Utah League of Cities and Towns June 18, 2018 Utah Economic Conditions CA 0.6% OR 1.4% WA 1.7% NV 2.0% Utah Population 3 rd Fastest Growing in U.S. ID 2.2% UT 1.9% AZ 1.6%
Texas Mid-Year Economic Outlook: Strong Growth Continues
 Texas Mid-Year Economic Outlook: Strong Growth Continues Keith Phillips Assistant Vice President and Senior Economist 9/27/18 The views expressed in this presentation are strictly those of the presenter
IMPROVING COLLEGE ACCESS
 IMPROVING COLLEGE ACCESS Grants and Resources for Education Leaders West Virginia Leaders of Education Conference December 3, 2018 THE EDUCATION ALLIANCE Statewide non-profit organization W E brings B
Comparative Revenues and Revenue Forecasts Prepared By: Bureau of Legislative Research Fiscal Services Division State of Arkansas
 Comparative Revenues and Revenue Forecasts 2010-2014 Prepared By: Bureau of Legislative Research Fiscal Services Division State of Arkansas Comparative Revenues and Revenue Forecasts This data shows tax
Slow and Low: The Economic and Financial Outlook
 Southern Legislative Conference 7th Annual Meeting Slow and Low: The Economic and Financial Outlook July, William R. Emmons Federal Reserve Bank of St. Louis William.R.Emmons@stls.frb.org These comments
The Arkansas Economic Outlook Focus on Hot Springs
 The Arkansas Economic Outlook Focus on Hot Springs Dr. Michael Pakko Chief Economist and State Economic Forecaster Institute for Economic Advancement, UALR Regional Economic Forecast Hot Springs December
Texas Economic Outlook: Strong Growth Continues
 Texas Economic Outlook: Strong Growth Continues Keith Phillips Assistant Vice President and Senior Economist 1/23/18 The views expressed in this presentation are strictly those of the presenter and do
Plunging Crude Prices: Impact on U.S. and State Economies
 Plunging Crude Prices: Impact on U.S. and State Economies Mine Yücel Senior Vice President and Director of Research August 7, 215 Oil and gas prices plunge Nominal price, $, weekly 16 14 12 Oil Price 1
Zions Bank Economic Overview
 Zions Bank Economic Overview Utah Institute of Real Estate Management Economic Summit September 12, 2017 National Economic Conditions August Job Indicators Indicator Expectation Actual Total Nonfarm Payrolls
Zions Bank Economic Overview
 Zions Bank Economic Overview Jackson Hole Mountain Resort March 20, 2018 National Economic Conditions When Good News is Bad News Is Good News?? Dow Tops 26,000 Up 44% Since 2016 Election Source: Wall Street
Analyzing State-Level Construction Fatality Rates,
 Analyzing State-Level Construction Fatality Rates, 1992-2016 John Mendeloff Professor of Public Affairs University of Pittsburgh jmen@pitt.edu Wayne B. Gray Professor of Economics Clark University wgray@clarku.edu
THE NORTH CAROLINA ECONOMIC OUTLOOK, 1 st QUARTER 2018
 THE NORTH CAROLINA ECONOMIC OUTLOOK, st QUARTER 8 Prepared by Dr. Michael L. Walden, William Neal Reynolds Distinguished Professor, Department of Agricultural and Resource Economics, North Carolina State
Cost and Coverage Implications of the ACA Medicaid Expansion: National and State by State Analysis
 Cost and Coverage Implications of the ACA Medicaid Expansion: National and State by State Analysis Report Authors: John Holahan, Matthew Buettgens, Caitlin Carroll, and Stan Dorn Urban Institute November
Findings Brief. NC Rural Health Research Program
 BACKGROUND Findings Brief NC Rural Health Research Program How Does Medicaid Expansion Affect Insurance Coverage of Rural Populations? Kristie Thompson, MA; Brystana Kaufman; Mark Holmes, PhD July 2014
ECONOMY AT A GLANCE. month was 2.1 percent higher compared to one year ago. Figure 1. Leading indices
 S E P TE M BE R 2018 V O LU ME 76, N U MB E R 9 ECONOMY AT A GLANCE T Inside this issue: Mississippi Leading Index, July 2018 2 Mississippi Coincident Index, July 2018 4 National Trends 5 Mississippi Employment
Texas Economic Outlook: Cruising in Third Gear
 Texas Economic Outlook: Cruising in Third Gear Keith Phillips Assistant Vice President and Senior Economist 1/19/17 The views expressed in this presentation are strictly those of the presenter and do not
Understanding the New Trump Economy Economic Overview. November 15, 2016
 Understanding the New Trump Economy Economic Overview November 15, 2016 Uncertainty at the Na@onal and Interna@onal Level Source: Bureau of Labor Statistics The Trump Bump Why? National Job Growth 500
Alaska Transportation Finance Study Alaska Municipal League
 Alaska Transportation Finance Study Alaska Municipal League presented to Alaska House Transportation Committee presented by Christopher Wornum Cambridge Systematics, Inc. February 12, 2009 Transportation
Regional Economic Update
 Regional Economic Update Roberto Coronado Assistant Vice President in Charge and Sr. Economist July 23, 2015 The views expressed in this presentation are strictly those of the authors and do not necessarily
Oregon: Where Taxes Are Low, Fees Are High and Revenue Is Slightly Below Average
 Issue Brief March 6, 2012 Oregon: Where Taxes Are Low, Fees Are High and Revenue Is Slightly Below Average The money we pay in fees and taxes helps create jobs, build a strong economy, and preserve Oregon
Zions Bank Economic Overview Alta High School. March 24, 2017
 Zions Bank Economic Overview Alta High School March 24, 2017 Economic Fundamentals Scarcity Based on limited resources Scarce resources must be allocated using a method of distribution Example: Food Clean
Uinta Basin Energy Summit Economic Overview September 10, 2015
 Uinta Basin Energy Summit Economic Overview September 10, 2015 Overview National Economic Conditions Utah Economic Conditions Utah is One of the Fastest Growing CA States in the Country Percent Change
Paying Out-of-Pocket
 September 2017 Paying Out-of-Pocket The Healthcare Spending of 2 Million US Families Healthcare costs are rising for families. In 2015 the US spent 18 percent of Gross Domestic Product (GDP) on healthcare,
Center for Business and Economic Research Dixon Hughes Goodman Triad Business (October 2014)
") Center for Business and Economic Research Dixon Hughes Goodman Triad Business (October 2014) The is developed and maintained by: Dr. G. Donald Jud, Center for Bus. & Eco. Res., Bryan School of Bus. & Eco.,
Center for Business and Economic Research Dixon Hughes Goodman Triad Business (October 2014) The is developed and maintained by: Dr. G. Donald Jud, Center for Bus. & Eco. Res., Bryan School of Bus. & Eco.,
What do we know FOR SURE?
 What do we know FOR SURE? It s a whole new world. Not just a cycle. We must go forward, we can t go back. The combination of factors creates a whole new economy, requiring new analysis What s Next? Real
Information provided by. Jacksonville State University Center for Economic Development and Business Research School of Business & Industry
 Information provided by Jacksonville State University Center for Economic Development and Business Research School of Business & Industry Connecting Our Greater Communities: Overview CEAZ Update (#2-#75)
NEAZ Members: Cherokee County
 1 NEAZ Members: Cherokee County 2 NEAZ Members: DeKalb County 3 NEAZ Members: Etowah County 4 NEAZ Members: Marshall County 5 NEAZ Members: Cherokee County April 27, 2011 6 NEAZ Members: DeKalb County
Metro D.C. Monitor. The 20 strongest-performing metro areas
 Metro D.C. Monitor Tracking Economic Recession and Recovery in the Greater Washington Region December 2009 Most economists report that the recession is technically over. Gross domestic product returned
An Overview of New Hampshire s Tax System
 An Overview of New Hampshire s Tax System Presentation to the House Ways & Means Committee January 9, 2013 Jeff McLynch Executive Director New Hampshire Fiscal Policy Institute 603.856.8337 jmclynch@nhfpi.org
Utah Association of Special Districts Economic Overview November 5, 2015
 Utah Association of Special Districts Economic Overview November 5, 2015 Utah is One of the Fastest Growing CA 0.9% States in the Country Percent Change in Population for States: 2012 to 2013 WA 1.1% OR
Texas Economic Outlook: Tapping on the Brakes
 National Economy Picking Up After Q1 Pause Texas Economic Outlook: Tapping on the Brakes Keith Phillips Assistant Vice President and Senior Economist Consumer spending picked up in 1 as housing prices
Demographic and Economic Profile. North Dakota. Updated June 2006
 Demographic and Economic Profile North Dakota Updated June 2006 Metro and Nonmetro Counties in North Dakota Based on the most recent listing of core based statistical areas by the Office of Management
The Acquisition of Regions Insurance Group. April 6, 2018
 The Acquisition of Regions Insurance Group April 6, 2018 Forward-Looking Statements This presentation contains "forward-looking statements" within the meaning of the Private Securities Litigation Reform
A Briefing on Georgia s Budget: The Big Picture
 Nov. 12, 2015 Dr. A Briefing on Georgia s Budget: The Big Picture Overview Georgia s Revenues Economic drivers of current revenue situation Loss of efficiency in tax system Georgia s Expenditures Overview
Older consumers and student loan debt by state
 August 2017 Older consumers and student loan debt by state New data on the burden of student loan debt on older consumers In January, the Bureau published a snapshot of older consumers and student loan
Demographic and Economic Profile. New Mexico. Updated June 2006
 Demographic and Economic Profile New Mexico Updated June 2006 Metro and Nonmetro Counties in New Mexico Based on the most recent listing of core based statistical areas by the Office of Management and
Innovative Strategies: State Efforts to Stem the Tide of Red Ink
 Innovative Strategies: State Efforts to Stem the Tide of Red Ink Sujit M. CanagaRetna The Council of State Governments Southern Legislative Conference (SLC) Presentation Before the Governor of Alabama
PRODUCER ANNUITY SUITABILITY TRAINING REQUIREMENTS BY STATE As of September 11, 2017
 PRODUCER ANNUITY SUITABILITY TRAINING REQUIREMENTS BY STATE As of September 11, 2017 This document provides a summary of the annuity training requirements that agents are required to complete for each
A Perspective from the Federal Reserve Institute of Internal Auditors San Antonio Chapter August 19, 2015 Blake Hastings Senior Vice President
 A Perspective from the Federal Reserve Institute of Internal Auditors San Antonio Chapter August 19, 215 Blake Hastings Senior Vice President The views expressed in this presentation are strictly those
Plunging Oil Prices: Impact on the U.S. and State Economies
 Plunging Oil Prices: Impact on the U.S. and State Economies Mine Yücel Senior Vice President and Director of Research November 17, 216 Nominal price, weekly 16 14 Oil and gas prices volatile 12 1 Oil price
National and Virginia Economic Outlook
 National and Virginia Economic Outlook Association of Electric Cooperatives September 29, 215 Sonya Ravindranath Waddell Regional Economist Research Department The views and opinions expressed herein are
STATE MOTOR FUEL TAX INCREASES:
 STATE MOTOR FUEL TAX INCREASES: 2013-2018 Since 2013, 27 states have increased or adjusted taxes on motor fuel to support needed transportation investments. Twenty-four of those states increased their
A Briefing on Georgia s Budget FY14-FY15. Dr. Carolyn Bourdeaux Andrew Young School of Policy Studies at Georgia State University
 A Briefing on Georgia s Budget FY14-FY15 Dr. Carolyn Bourdeaux Andrew Young School of Policy Studies at Georgia State University 20,000 18,000 Georgia's State Tax Revenues 1984-2014 In FY14, Georgia is
Zions Bank Salt Lake Northeast Region Officers Mee8ng Economic Overview. July 28, 2016
 Zions Bank Salt Lake Northeast Region Officers Mee8ng Economic Overview July 28, 2016 National Economic Conditions Readings on the U.S. economy since the turn of the year have been somewhat mixed. - Janet
Texas Mid-Year Economic Outlook: The Skies are Beginning to Clear Keith Phillips Assistant Vice President and Senior Economist
 Texas Mid-Year Economic Outlook: The Skies are Beginning to Clear Keith Phillips Assistant Vice President and Senior Economist The views expressed in this presentation are strictly those of the presenter
medicaid a n d t h e How will the Medicaid Expansion for Adults Impact Eligibility and Coverage? Key Findings in Brief
 on medicaid a n d t h e uninsured July 2012 How will the Medicaid Expansion for Adults Impact Eligibility and Coverage? Key Findings in Brief Effective January 2014, the ACA establishes a new minimum Medicaid
NC-20 Economy 2015 North Carolina Coastal Conference
 -20 Economy 2015 North Carolina Coastal Conference April 14, 2015 William W. (Woody) Hall, Jr. Professor of Economics and Senior Economist H. David and Diane Swain Center for Business and Economic Services
Zions Bank Economic Summit Economic Overview. November 3, 2016
 Zions Bank Economic Summit Economic Overview November 3, 2016 Uncertainty at the Na@onal and Interna@onal Level Readings on the U.S. economy since the turn of the year have been somewhat mixed. - Janet
Rate Adjustments American Retirement Life Insurance Company
 Cigna Medicare Supplement Insurance Rate Adjustments American Retirement Life Insurance Company Due to changes in Medicare and claim costs, American Retirement Life Insurance Company will be implementing
Forecast for Muskegon County was a great year!
 2014 2015 Forecast for Muskegon County 2013 was a great year! George A. Erickcek Brian Pittelko W.E. Upjohn Institute for Employment Research January 31, 2014 A special thanks to: 1 Outline Most think
Projected Job Growth
 1 Projected Job Growth Baton Rouge is projected to increase employment by 1.1% in 2018, which translates into approximately 4,500 new jobs Percentage change in nonfarm jobs* Actual Growth YTD Actual Growth
NEVADA TAX REVENUE COMPARED TO THE UNITED STATES
 Page 1 EXECUTIVE SUMMARY Applied Analysis was retained by the Las Vegas Convention and Visitors Authority (the LVCVA ) to review and analyze the economic impacts associated with its various operations
Construction & Materials Outlook. February 17, 2010 Ken Simonson, Chief Economist AGC of America
 Construction & Materials Outlook February 17, 2010 Ken Simonson, Chief Economist AGC of America simonsonk@agc.org 2 Current economic influences GDP, personal income improving; not jobs Rising vacancies
2016 Texas Economic Outlook: Riding the Energy Roller Coaster Keith Phillips Assistant Vice President and Senior Economist
 216 Texas Economic Outlook: Riding the Energy Roller Coaster Keith Phillips Assistant Vice President and Senior Economist The views expressed in this presentation are strictly those of the presenter and
Black Knight Mortgage Monitor
 Black Knight Mortgage Monitor Mortgage Market Performance Observations Data as of April, 2014 Month-end Black Knight First Look April 2014 2 Focus Points Prepayment activity and originations ARM loans
Recap of 2017: The Best Year in a Decade
 NOVEMBER 217 Recap of 217: The Best Year in a Decade Macroeconomic conditions remained favorable for housing and mortgage markets in 217. Despite challenges, the housing markets remain on track for their
Property Tax Relief in New England
 Property Tax Relief in New England January 23, 2015 Adam H. Langley Senior Research Analyst Lincoln Institute of Land Policy www.lincolninst.edu Property Tax as a % of Personal Income OK AL IN UT SD MS
ECONOMY AT A GLANCE. Figure 1. Leading indices. 10/1711/1712/17 1/18 2/18 3/18 4/18 5/18 6/18 7/18 8/18 9/18 10/18 Mississippi
 DECEMBER 2018 V OLUME 76, NUMBER 12 Inside this issue: Mississippi Leading Index, October 2018 Mississippi Coincident Index, October 2018 National Trends 5 Mississippi Employment Trends Changes in County
Stand-Alone Prescription Drug Plans Dominated the Rural Market in 2011
 Stand-Alone Prescription Drug Plans Dominated the Rural Market in 2011 Growth Driven by Medicare Advantage Prescription Drug Plan Enrollment Leah Kemper, MPH Abigail Barker, PhD Fred Ullrich, BA Lisa Pollack,
STATE MOTOR FUEL TAX INCREASES:
 Since 2013, 26 states have increased or adjusted taxes on motor fuel to support needed transportation investments. Twenty-three of those states increased their state gas tax, while three states Kentucky,
Percent of Employees Waiving Coverage 27.0% 30.6% 29.1% 23.4% 24.9%
 Number of Health Plans Reported 18,186 3,561 681 2,803 3,088 Offer HRA or HSA 34.0% 42.7% 47.0% 39.7% 35.0% Annual Employer Contribution $1,353 $1,415 $1,037 $1,272 $1,403 Percent of Employees Waiving
2015 Economic Forecast: Insights from Small and Mid-Sized Business Owners
 2015 Economic Forecast: Insights from Small and Mid-Sized Business Owners Craig Everett, Ph.D., MBA Director, Pepperdine Private Capital Markets Project 02.10.15 PUBLISHED BY 2012 2015 Pepperdine University.
Arkansas Economic Outlook
 Arkansas Economic Forecast Conference 2011 Arkansas Economic Outlook Dr. Michael Pakko Chief Economist and State Economic Forecaster Institute for Economic Advancement, UALR November 2, 2011 Arkansas Experience
The Changing Revenue Landscape
 The Changing Revenue Landscape NCSL Legislative Summit, 2018 July 30, 2018 Lucy Dadayan July 30, 2018 Lucy Dadayan State Revenue Trends and Volatility TCJA, South Dakota vs. Wayfair, Sports Betting Overview
Asheville Metro Economic Report 2014 First Quarter
 Asheville Metro Economic Report Johnson Price Sprinkle PA HIGHLIGHTS: ASHEVILLE METRO Employment gains slowed in the first quarter of 2014 dropping behind five other N.C. Metros and lagging behind both
KENTUCKY. August 18, 2016
 KENTUCKY August 18, 2016 Cathy_Booth@ncci.com 202-655-2699 Sean_Cooper@ncci.com 561-893-3072 Mona_Carter@ncci.com 561-893-3045 Ed O Daniel, Esq. 859-336-9611 Kentucky Workers Compensation State Advisory
Transportation Performance Index. Key Findings
 Transportation Performance Index Key Findings Sponsored in part by The U.S. Chamber of Commerce is the world s largest business federation representing the interests of more than 3 million businesses of
Center for Business and Economic Research Dixon Hughes Goodman Triad Business (July 2014)
") Center for Business and Economic Research Dixon Hughes Goodman Triad Business (July 2014) The is developed and maintained by: Dr. G. Donald Jud, Center for Bus. & Eco. Res., Bryan School of Bus. & Eco.,
Center for Business and Economic Research Dixon Hughes Goodman Triad Business (July 2014) The is developed and maintained by: Dr. G. Donald Jud, Center for Bus. & Eco. Res., Bryan School of Bus. & Eco.,
Utah. Demographic and Economic Profile. Metro and Nonmetro Counties in Utah
 Demographic and Economic Profile Utah Updated July 2006 Metro and Nonmetro Counties in Utah Based on the most recent listing of core based statistical areas by the Office of Management and Budget (December
TCJA and the States Responding to SALT Limits
 TCJA and the States Responding to SALT Limits Kim S. Rueben Tuesday, January 29, 2019 1 What does this mean for Individuals under TCJA About two-thirds of taxpayers will receive a tax cut with the largest
Demographic and Economic Profile. Delaware. Updated December 2006
 Demographic and Economic Profile Delaware Updated December 2006 Metro and Nonmetro Counties in Delaware Based on the most recent listing of core based statistical areas by the Office of Management and
2016 Workers compensation premium index rates
 2016 Workers compensation premium index rates NH WA OR NV CA AK ID AZ UT MT WY CO NM MI VT ND MN SD WI NY NE IA PA IL IN OH WV VA KS MO KY NC TN OK AR SC MS AL GA TX LA FL ME MA RI CT NJ DE MD DC = Under
Pennsylvania. Demographic and Economic Profile. Metro and Nonmetro Counties in Pennsylvania
 Demographic and Economic Profile Pennsylvania Updated June 2006 Metro and Nonmetro Counties in Pennsylvania Based on the most recent listing of core based statistical areas by the Office of Management
Taxing Food for Home Consumption
 Taxing Food for Home Consumption Taxing the Poor: Road Map Regional differences in income poverty & poverty related outcomes Historical patterns of property tax Emergence of supermajority rules Growth
Mississippi s Business Monitoring The State s Economy
 Mississippi s Business January 2012 Monitoring The State s Economy ECONOMY AT A GLANCE Volume 70 - Number 1 A Publication of the University Research Center, Mississippi Institutions of Higher Learning
Demographic and Economic Profile. Kentucky. Updated June 2006
 Demographic and Economic Profile Kentucky Updated June 2006 Metro and Nonmetro Counties in Kentucky Based on the most recent listing of core based statistical areas by the Office of Management and Budget
Utah Land Title Association Economic Overview February 1, 2016
 Utah Land Title Association Economic Overview February 1, 2016 Utah is One of the Fastest Growing CA 0.9% States in the Country Percent Change in Population for States: 2012 to 2013 WA 1.1% OR 0.8% NV
Demographic and Economic Profile. Nevada. Updated May 2006
 Demographic and Economic Profile Nevada Updated May 2006 Metro and Nonmetro Counties in Nevada Based on the most recent listing of core based statistical areas by the Office of Management and Budget (December
COMMUNITY CREDIT CHART BOOK
 2016 COMMUNITY CREDIT CHART BOOK FEDERAL RESERVE B ANK of NEW YORK Editors Kausar Hamdani, Ph.D. SVP and Senior Advisor Claire Kramer Mills, Ph.D. AVP and Community Affairs Officer Data Support Jessica
SIGNIFICANT PROVISIONS OF STATE UNEMPLOYMENT INSURANCE LAWS JANUARY 2008
 U.S. DEPARTMENT OF LABOR EMPLOYMENT AND TRAINING ADMINISTRATION Office Workforce Security SIGNIFICANT PROVISIONS OF STATE UNEMPLOYMENT INSURANCE LAWS JANUARY 2008 AL AK AZ AR CA CO CT DE DC FL GA HI /
State & Local Health Departments Challenges & Opportunities
 State & Local Health Departments Challenges & Opportunities Judith A. Monroe, MD, FAAFP Deputy Director, Centers for Disease Control and Prevention Director, Office for State, Tribal, Local and Territorial
Property Tax Deferral: A Proposal to Help Massachusetts Seniors
 Property Tax Deferral: A Proposal to Help Massachusetts Seniors Alicia H. Munnell and Abigail N. Walters Center for Retirement Research at Boston College Economic Perspectives on State and Local Taxes
U.S. Consumer Sentiment Jan 2011 Jan 2012
 2012 Economic Update Information provided by Jacksonville State University Center for Economic Development and College of Commerce and Business Administration U.S. Consumer Sentiment Jan 2011 Jan 2012
Demographic and Economic Profile. Florida. Updated May 2006
 Demographic and Economic Profile Florida Updated May 2006 Metro and Nonmetro Counties in Florida Based on the most recent listing of core based statistical areas by the Office of Management and Budget
ehealth, Inc Fall Cost Report for Individual and Family Policyholders
 ehealth, Inc. 2010 Fall Cost Report for and Family Policyholders Table of Contents Page Methodology.................................................................. 2 ehealth, Inc. 2010 Fall Cost Report
2018 Texas Economic Outlook: Firing on All Cylinders
 218 Texas Economic Outlook: Firing on All Cylinders Keith Phillips Assistant Vice President and Senior Economist 4/5/218 The views expressed in this presentation are strictly those of the presenter and
DOWNLOAD OR READ : DEVELOPMENT OF THE INCOME SMOOTHING LITERATURE VOL 4 A FOCUS ON THE UNITED STATES PDF EBOOK EPUB MOBI
 DOWNLOAD OR READ : DEVELOPMENT OF THE INCOME SMOOTHING LITERATURE 1893 1998 VOL 4 A FOCUS ON THE UNITED STATES PDF EBOOK EPUB MOBI Page 1 Page 2 development of the income smoothing literature 1893 1998
Who s Above the Social Security Payroll Tax Cap? BY NICOLE WOO, JANELLE JONES, AND JOHN SCHMITT*
 Issue Brief September 2011 Center for Economic and Policy Research 1611 Connecticut Ave, NW Suite 400 Washington, DC 20009 tel: 202-293-5380 fax: 202-588-1356 www.cepr.net Who s Above the Social Security
Center for Business and Economic Research Dixon Hughes Goodman Triad Business (July 2015)
") Center for Business and Economic Research Dixon Hughes Goodman Triad Business (July 2015) The is developed and maintained by: Dr. Andrew C. Brod, Center for Business & Economic Research, Bryan School of
Center for Business and Economic Research Dixon Hughes Goodman Triad Business (July 2015) The is developed and maintained by: Dr. Andrew C. Brod, Center for Business & Economic Research, Bryan School of
State Treatment of Social Security Treatment of Pension Income Other Income Tax Breaks Property Tax Breaks
 State-By-State Tax Breaks for Seniors, 2016 State Treatment of Social Security Treatment of Pension Income Other Income Tax Breaks Property Tax Breaks AL Payments from defined benefit private plans are
Today s Uncertain Economy: Implications for P/C Insurance
 Today s Uncertain Economy: Implications for P/C Insurance CAMAR Spring Meeting Great Valley, PA May 24, 2018 Steven N. Weisbart, Ph.D., CLU, Senior Vice President & Chief Economist Insurance Information
Maximizing Your State of the Line Experience
 Maximizing Your State of the Line Experience P/C INDUSTRY NET WRITTEN PREMIUM SLIDE 4 The net written premium in this slide provides a measure of the size of each major line of business in the property/casualty
NC Community College System:
 NC Community College System: Budget Overview Presentation to the Joint Appropriations Committee on Education Brett Altman Fiscal Research Division March 8, 2017 Presentation Agenda 1. NCCCS Background
Mega-Trends Influencing the Workers Compensation Insurance Industry
 Mega-Trends Influencing the Workers Compensation Insurance Industry 12 th Annual National Workers Compensation Insurance ExecuSummit Uncasville CT, February 3, 2015 Steven N. Weisbart, Ph.D., CLU, Senior
Western Treasure Valley Economic Breakfast Economic Overview March 17, 2016
 Western Treasure Valley Economic Breakfast Economic Overview March 17, 2016 Utah is One of the Fastest Growing CA 0.9% States in the Country Percent Change in Population for States: 2012 to 2013 WA 1.1%
Eye on the South Carolina Housing Market presented at 2008 HBA of South Carolina State Convention August 1, 2008
 Eye on the South Carolina Housing Market presented at 28 HBA of South Carolina State Convention August 1, 28 Robert Denk Assistant Staff Vice President, Forecasting & Analysis 2, US Single Family Housing
Atlanta Regional Commission Link. Overview of the Greater Washington Region: Trends and Challenges
 Atlanta Regional Commission Link Overview of the Greater Washington Region: Trends and Challenges Stephen S. Fuller, Ph.D. Dwight Schar Faculty Chair and University Professor Director, Center for Regional
The Oil Market: From Boom to Gloom
 The Oil Market: From Boom to Gloom Mine Yücel Senior Vice President and Director of Research February 12, 216 The views expressed are those of the speaker and should not be attributed to the or the Federal