Mega-Trends Influencing the Workers Compensation Insurance Industry
|
|
|
- Phyllis Bond
- 5 years ago
- Views:
Transcription
 494-5945 stevenw@iii.org")
1 Mega-Trends Influencing the Workers Compensation Insurance Industry 12 th Annual National Workers Compensation Insurance ExecuSummit Uncasville CT, February 3, 2015 Steven N. Weisbart, Ph.D., CLU, Senior Vice President & Chief Economist Insurance Information Institute 110 William Street New York, NY Office: Cell: (917)
2 Presentation Outline: 6 Mega-Trends 1. A Growing Exposure Base, but with a Different Mix of Risks 2. Workplace Safety Improvement Continues, but Room for More 3. Inflation, WC-style 4. Low Investment Returns 5. The Aging Workforce 6. The Obesity Epidemic 2
3 WC Profitability 3
4 Workers Comp Return on Net Worth, % 10.1% 9.6% 10.0% Profits down during and after a severe recession: cause and effect? 9% 9.0% 6% 6.9% 5.1% 6.2% 5.9% 7.1% 4.2% 3.9% 3% 2.4% 0% Sources: NAIC; Insurance Information Institute 4
5 14.9% 14.5% 14.0% 13.4% 12.5% 12.0% 11.9% 11.8% 11.4% 11.1% 10.3% 10.3% 9.9% 9.8% 9.4% 9.4% 9.1% 9.1% 8.9% 8.8% 8.4% 8.1% 7.8% 7.8% 7.8% Workers Comp Return on Net Worth, by State, % Top 25 States 12 states posted doubledigit profit percentages in WC in % 12% 10% 8% 6% 4% 2% 0% WY NY WV OH MI MT SD VT AR KS AK NH NM NV TX TX AL FL MO UT ND TN NE WA SC 5
6 3.0% 2.5% 2.5% 5.3% 5.2% 5.2% 5.2% 5.1% 4.8% 4.5% 4.3% 4.1% 3.6% 7.7% 7.6% 7.6% 7.5% 7.5% 7.3% 7.2% 6.7% 6.6% 6.4% 6.2% 6.1% 5.9% Workers Comp Return on Net Worth, by State, % Bottom 25 States 9% 8% 7% 6% 5% 4% 3% 2% 1% 0% MN NC OR IL KY VA US IN PA AZ MA RI GA ID CO CT OK IA MD NJ ME LA HI CA DE WI 6
7 Workers Compensation Combined Ratio: P Does the WC line get in trouble once each decade? P Workers Comp underwriting results were the worst they have been in a decade but lately are improving. Sources: A.M. Best; Insurance Information Institute. Data for P are from Exhibit 6, Best s Special Report, U.S. Workers Compensation Results Sustain Recent Improvement, November 10,
8 1. A Growing Exposure Base, but with a Different Mix of Risks Health Care, Education, Services Will Lead 8
9 Jan- Feb Mar Apr- May Jun- Jul-11 Aug Sep Oct- Nov Dec Jan- Feb Mar Apr- May Jun- Jul-12 Aug Sep Oct- Nov Dec Jan- Feb Mar Apr- May Jun- Jul-13 Aug Sep Oct- Nov Dec Jan- Feb Mar Apr- May Jun- Jul-14 Aug Sep Oct- Nov Monthly Change in Nonfarm Employment, Thousands Average Monthly Gain 2011: 173, : 186, : 194, *: 240, The pace of job growth varies considerably from month to month. *Seasonally adjusted. Oct 2014 and Nov 2014 are preliminary data. Monthly gain for 2014 is average for January-November Sources: US Bureau of Labor Statistics; Insurance Information Institute 9
10 Nonfarm Payroll (Wages and Salaries), Quarterly, :Q3 Billions $7,750 $7,500 $7,250 $7,000 $6,750 $6,500 $6,250 $6,000 $5,750 $5,500 Prior Peak was 2008:Q3 at $6.54 trillion Recent trough (2009:Q1) was $6.23 trillion, down 5.3% from prior peak Latest (2014:Q3) was $7.46 trillion, a new peak 05:Q1 05:Q2 05:Q3 05:Q4 06:Q1 06:Q2 06:Q3 06:Q4 07:Q1 07:Q2 07:Q3 07:Q4 08:Q1 08:Q2 08:Q3 08:Q4 09:Q1 09:Q2 09:Q3 09:Q4 10:Q1 10:Q2 10:Q3 10:Q4 11:Q1 11:Q2 11:Q3 11:Q4 12:Q1 12:Q2 12:Q3 12:Q4 13:Q1 13:Q2 13:Q3 13:Q4 14:Q1 14:Q2 14:Q3 Note: Recession indicated by gray shaded column. Data are seasonally adjusted annual rates. Sources: National Bureau of Economic Research (recession dates); Insurance Information Institute. 10
11 Workers Comp Net Written Premiums vs. Payroll, :Q3 Payroll Base* $Billions $8,000 $7,000 $6,000 $5,000 $4,000 $3,000 Wage & Salary Disbursements WC NPW 7/90-3/91 3/01-11/01 WC premium volume dropped two years before the recession began 12/07-6/09 WC NWP $Billions $50 $45 $40 $35 $30 $2, :3Q Continued Payroll Growth and Rate Increases Suggest WC NWP Will Grow Again in 2015 $25 *Private employment; Shaded areas indicate recessions. Sources: NBER (recessions); Federal Reserve Bank of St. Louis at ; NCCI; I.I.I. 11
12 1/31/2010 2/28/2010 3/31/2010 4/28/2010 5/31/2010 6/30/2010 7/31/2010 8/31/2010 9/30/ /30/ /30/ /30/2010 1/31/2011 2/28/2011 3/31/2011 4/28/2011 5/31/2011 6/30/2011 7/31/2011 8/31/2011 9/30/ /30/ /30/ /30/2011 1/30/2012 2/30/2012 3/30/2012 4/30/2012 5/30/2012 6/30/2012 7/30/2012 8/30/2012 9/30/ /30/ /30/ /30/2012 1/30/2013 Feb-13 3/30/2013 4/30/2013 5/30/2013 6/30/2013 7/30/2013 8/30/2013 9/30/ /30/ /30/ /31/2013 1/31/2014 2/28/2014 3/31/2014 4/30/2014 5/31/2014 6/30/2014 7/31/2014 8/31/2014 9/30/ /31/ /30/2014 5,587 5,508 5,536 5,555 5,524 5,512 5,502 5,525 5,503 5,507 5,504 5,462 5,432 5,464 5,475 5,496 5,520 5,524 5,551 5,553 5,590 5,584 5,585 5,606 5,627 5,622 5,627 5,630 5,613 5,620 5,635 5,647 5,648 5,666 5,687 5,720 5,743 5,789 5,813 5,811 5,816 5,829 5,830 5,836 5,849 5,864 5,896 5,876 5,927 5,951 5,964 6,000 6,009 6,017 6,047 6,064 6,082 6,089 6,109 Construction Employment, Jan November 2014* (Thousands) 6,200 6,100 6,000 5,900 5,800 5,700 5,600 5,500 Construction employment is +677,000 above Jan (+12.5%). 5,400 Construction and manufacturing employment constitute 1/3 of all workers comp payroll exposure. *Seasonally adjusted; Oct and Nov 2014 are preliminary Sources: US Bureau of Labor Statistics at Insurance Information Institute. 12
13 Manufacturing Employment, Monthly, January 2010 November 2014* 11,462 11,453 11,458 11,493 11,527 11,543 11,571 11,550 11,557 11,557 11,581 11,592 11,620 11,653 11,675 11,704 11,711 11,723 11,755 11,763 11,766 11,773 11,771 11,798 11,837 11,859 11,901 11,916 11,928 11,939 11,979 11,956 11,942 11,947 11,951 11,965 11,982 12,004 12,007 12,001 11,994 11,991 11,982 11,990 11,993 12,011 12,046 12,053 12,061 12,081 12,085 12,094 12,109 12,130 12,154 12,157 12,169 12,189 12,217 1/31/ 2/28/ 3/31/ 4/28/ 5/31/ 6/30/ 7/31/ 8/31/ 9/30/ 10/30 11/30 12/30 1/31/ 2/28/ 3/31/ 4/28/ 5/31/ 6/30/ 7/31/ 8/31/ 9/30/ 10/30 11/30 12/30 1/30/ 2/30/ 3/30/ 4/30/ 5/30/ 6/30/ 7/30/ 8/30/ 9/30/ 10/30 11/30 12/30 1/31/ 2/28/ 3/31/ 4/30/ 5/31/ 6/30/ 7/31/ 8/31/ 9/30/ 10/31 11/30 12/31 1/31/ 2/28/ 3/31/ 4/30/ 5/31/ 6/30/ 7/31/ 8/31/ 9/30/ 10/31 11/30 (Thousands) 12,500 Manufacturing employment is 750,000+ above Jan (+6.6%) and still growing. 12,250 12,000 11,750 11,500 11,250 11,000 Manufacturing employment is a surprising source of strength in the economy. Employment in the sector is at a multi-year high. *Seasonally adjusted; Oct and Nov 2014 are preliminary Sources: US Bureau of Labor Statistics at Insurance Information Institute. 13
14 U.S. Employment in Health Care & Social Services, Monthly, * 1/31/1990 9/30/1990 5/31/1991 1/31/1992 9/30/1992 5/31/1993 1/31/1994 9/30/1994 5/31/1995 1/31/1996 9/30/1996 5/31/1997 1/31/1998 9/30/1998 5/31/1999 1/31/2000 9/30/2000 5/31/2001 1/31/2002 9/30/2002 5/31/2003 1/31/2004 9/30/2004 5/31/2005 1/31/2006 9/30/2006 5/31/2007 1/31/2008 9/30/2008 5/31/2009 1/31/2010 9/30/2010 5/31/2011 1/31/2012 9/30/2012 5/31/2013 1/31/2014 9/30/2014 Millions Employment in the health care and social service sector grew in virtually every month for the last 24 years, unaffected by recessions, Cumulative growth over 25 years: 100.1% and this growth is expected to continue indefinitely 9 HC & SS employment *As of Nov 2014 (Nov 2014 and Oct 2014 are preliminary); Seasonally adjusted Note: Recessions indicated by gray shaded columns. Sources: US Bureau of Labor Statistics; National Bureau of Economic Research (recession dates); Insurance Information Institute. 14
15 2. Workplace Safety Improvement Continues, but Room for More The WC industry has certainly helped create/support the improvement 15
16 Fewer Occupational Deaths p Number of Fatal Injuries 7,000 6,500 6,000 5,500 6,217 6,331 6,632 6,275 6,202 6,238 6,055 6,054 5,920 5,915 5,534 5,575 5,764 5,734 5,840 5,657 5,214 5,000 4,500 4,551 4,690 4,693 4,628 4,405 4,000 3, p The death rate per 100,000 full-time-equivalent workers was 3.2 in 2013, down from 3.4 in 2012 and 3.5 in p = preliminary; final data will be released in late Spring 2015 Source: U.S. Bureau of Labor Statistics, National Census of Fatal Occupational Injuries in 2013 (Preliminary Results), released September 11,
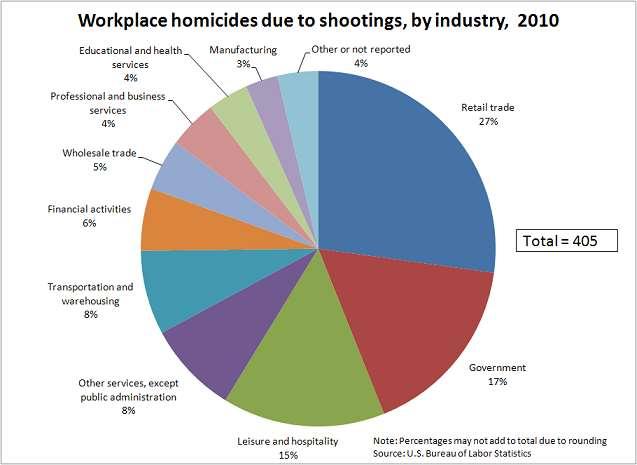
17 Number of Workplace Homicides,
18 18
19 407, , , , , , , , , , , , , , , , , , , , , ,560 Private Industry: Fewer Injuries & Illnesses with Days Away from Work Number 1,000, ,000 Goods-producing, 2013 vs. 2003: down 43.7% service-producing goods-producing Service-producing, 2013 vs. 2003: down 24.3% Slight increase because employment rose. 600, , , The total number of illnesses and injuries dropped from 2003 to 2007 despite growth in employment and the aging of the workforce. The drop continued through the Great Recession. Source: U.S. Bureau of Labor Statistics, National Occupational Injuries and Illnesses Requiring Days Away from Work, 2013, Table 1, released December 16, 2014: 19
20 Accidents per 10,000 Full-Time Private Workers, Healthcare Workers Are Injured by Violence at Almost Four Times the National Rate. Contact With Objects Much Less Common in Healthcare Fall on Same Level Violence Contact With Objects Lifting/Lowering Slip, No Fall Health Care and Social Assistance Service Producing Total Private 167,150 Lost-Time Injuries and Illnesses in the Healthcare Sector in 2013, 13% a Result of Violence. Source: U.S. Bureau of Labor Statistics, National Occupational Injuries and Illnesses Requiring Days Away from Work, 2013, Table 1, released December 16, 2014: 20
21 3. Inflation and Claim Severity The Low CPI Doesn t Reflect WC Cost Pressures 21
22 Workers Compensation Medical Severity Moderate Increase in 2011 Medical Claim Cost ($000s) Annual Change : +1.9% Annual Change : +8.9% Annual Change : +6.0% $8.1 Cumulative Change = 245% ( p) +6.8%+1.3%-2.1% +9.0%+5.1%+7.4% $8.2 $8.1 $8.8 $9.2 Average Medical Cost per Lost-Time Claim $ % +7.3% +10.1% +8.3% $10.9 $11.8 $13.1 $ % +5.4% +8.8% +13.5% $15.9 $17.3 Accident Year 2011p: Preliminary based on data valued as of 12/31/ : Based on data through 12/31/2010, developed to ultimate. Based on the states where NCCI provides ratemaking services; Excludes high 22 deductible policies. $18.7 $ % +5.9% +8.5% $21.3 $22.6 $ % +6.1% $25.5 $26.6 $ % +1.3% p $28.0
23 WC Medical Severity No Longer Rising Faster Than the Medical CPI Rate 10% 9% 8% 7% 6% 5% 4% 3% 2% 1% 0% 8.8% 4.7% 7.7% 5.4% 7.8% 5.8% 6.1% 4.0% 4.4% 4.2% 4.0% 4.4% Change in Medical CPI The average annual growth in WC medical severity from 2002 through 2009 was over 6% vs. the medical CPI (about 4%), which itself was higher than the overall CPI 6.8% 3.7% Change Med Cost per Lost Time Claim 4.0% 3.2% 3.4% 3.0% 1.2% but since 2010 growth in WC medical severity has closely tracked the medical CPI 2.6% 3.0% 3.0% 3.5% 2.5% 2.3% * *I.I.I. estimate based on data through October 2014 Sources: CPI and Med CPI from US Bureau of Labor Statistics, WC med severity from NCCI based on NCCI states.
24 Workers Comp Indemnity Claim Costs, p Indemnity Claim Cost ($ 000s) Average Indemnity Cost per Lost-Time Claim Average indemnity costs per claim have been at or below $22,500 since % +1.0% -3.1% -2.8% +4.9% +1.7% $9.2 $9.7 $9.8 $10.4 $11.2 $ % $ % $ % +3.6% +4.6% +3.1% +10.1% +10.1%+9.2% $16.2 $16.7 $17.5 $17.6 $18.3 $19.3 $ %+6.5% +0.6% p $22.3 $20.8 $21.9 $22.1 $22.2 $22.7 Accident Year 2010p: Preliminary based on data valued as of 12/31/ : Based on data through 12/31/2010, developed to ultimate Based on the states where NCCI provides ratemaking services Excludes high deductible policies
25 % 10% 8% 6% 4% 2% 0% WC Indemnity Severity No Longer Grows Faster than Wages, % 5.9% 7.7% 1.7% 2.3% 2.7% 9.0% 10.1% 10.1% 9.2% 5.0%4.9% 4.0% 3.5% Change in Median Usual Weekly Earnings Change in Indemnity Cost per Lost-Time Claim 4.6% 3.1% 3.1% 5.9% 6.5% 9.1% 2.9% 3.1% 3.6%3.9% 2.0% 2.4% 1.0% 1.1% 1.1% 2.0%2.0% 0.5% 2.0% 1.0% 1.2% 1.6% 1.0% -2% -4% -2.7% NCCI data on WC severity is based on the states where NCCI provides ratemaking services. Excludes the effects of deductible policies. Sources: NCCI, BLS, from Current Population Survey
26 4. Low Investment Returns 26
27 Jan-90 Jan-91 Jan-92 Jan-93 Jan-94 Jan-95 Jan-96 Jan-97 Jan-98 Jan-99 Jan-00 Jan-01 Jan-02 Jan-03 Jan-04 Jan-05 Jan-06 Jan-07 Jan-08 Jan-09 Jan-10 Jan-11 Jan-12 Jan-13 Jan-14 9% 8% 7% U.S. Treasury 2- and 10-Year Note Yields*: Yields on 10-Year U.S. Treasury Notes have been essentially below 5% for over a dozen years. 6% 5% U.S. Treasury 10-year note yields spiked 4% 3% 2% 1% Recession 2-Yr Yield 10-Yr Yield 0% Since roughly 80% of P/C bond/cash investments are in 10-year or shorter durations, most P/C insurer portfolios will have low-yielding bonds for years to come. *Monthly, constant maturity, nominal rates, through December Sources: Federal Reserve Bank at National Bureau of Economic Research (recession dates); Insurance Information Institutes. 27
28 Long-Term Reduction in the Level of Investment Earnings: Outlook Fed actions will likely keep interest rates low for at least 2015 In a prolonged period of low interest rates, each year maturing higher-rate bonds are replaced with lower rates, building in a low portfolio yield that will last for the duration of the newer bonds Industry must be prepared to operate in an environment in which investment returns are a much smaller fraction of profits Drives rates higher? Regulators will not accept this Stiffens underwriting discipline? Yet to manifest itself Source: Insurance Information Institute. 28
29 5. The Aging Workforce 29
30 Labor Force Participation Rate, Ages 65-69, Quarterly, 1998:Q1-2014:Q4 Labor Force participation rate 34% 32% 30% 28% 26% 24% 22% 20% 22.1% 22.5% 22.3% 23.0% 22.8% 23.0% 22.9% 23.5% 24.4% 24.4% 24.3% 24.9% 24.4% 24.4% 24.8% The brown bars indicate recessions in 3 in this age group are working. Virtually none of them are baby boomers % 25.2% 26.3% 26.5% 26.2% 27.9% 27.2% % % 27.9% 27.3% 27.8% 27.6% 26.8% 27.6% 29.3% 29.5% 27.9% 28.5% 28.7% % 29.3% 30.1% 29.1% 30.3% 30.1% 30.9% 31.0% 30.7% 31.0% 31.4% 30.9% 31.2% 31.6% 31.3% 31.5% 31.4% 32.8% 32.3% 31.1% 32.2% 32.2% 32.5% 31.8% 31.8% 31.7% 32.9% 32.1% 31.8% 31.6% 31.9% 31.3% 31.5% The switch from DB pension plans (with early-retirement incentives) to DC plans (with, in effect, later-retirement incentives) might be partly responsible for raising this rate. Not seasonally adjusted. Sources: US Bureau of Labor Statistics, US Department of Labor; Insurance Information Institute
31 Labor Force Participation Rate, Ages 70-74, Quarterly, 1998:Q1-2014:Q4 Labor Force participation rate 20% 18% 16% 14% 12% 12.5% 12.2% 12.4% 12.4% 12.9% 13.1% 13.6% Nearly 1 in 5 in this age group is working. 15 years ago it was 1 in % 13.3% 13.5% 13.6% 13.8% 14.4% 13.7% 14.2% 14.2% 13.8% 14.2% 14.0% 14.0% 14.4% 14.4% 14.6% 14.9% 14.9% 15.4% 15.6% 15.3% 16.4%17.0% 15.8% 16.2%16.7% 16.9% 17.2% 17.0% 16.7% 16.8% 18.0% 17.5% 17.3% 16.9% 18.6% 18.2% 17.7% 17.9% 18.9% 19.2% 18.0% 18.1% 17.4% 18.4% 18.0% 18.4% 19.3% 19.5% 19.2% 19.1% 19.9% 19.6% 18.8% 19.3% 19.7% 19.0% 19.0% 19.0% 18.9% 18.8% 10% The labor force participation rate for workers grew by about 50% since Growth in the participation rate has stalled at about 19% since Source: US Bureau of Labor Statistics, US Department of Labor; Insurance Information Institute
32 Labor Force Participation Rate, Ages 70-74, Quarterly, 1998:Q1-2014:Q4 Labor Force participation rate 26% 24% 22% 20% 18% 16% 14% 12% 10% 8% Nearly 1 in 4 men and 1 in 7 women in this age group is working. The percent of women working has nearly doubled The labor force participation rate for workers grew by about 50% since Growth in the participation rate has stalled at about 19% since Source: US Bureau of Labor Statistics, US Department of Labor; Insurance Information Institute
33 Labor Force Participation Rate, Quarterly Ages 75 and over, :Q4 Labor Force participation rate 9% 7% 5% 4.5% 4.6% 4.6% 5.0% 4.8% 5.1% 5.4% 5.2% 5.4% 5.3% 5.2% 5.3% 5.2% 5.2% 5.1% The labor force participation rate for workers 75 and over could hit 10% soon. This is close to what the rate was for the group a decade ago. 5.4% 5.1% 5.1% 5.2% 5.0% 5.5%5.9% 5.8% 5.8% 5.9% 6.0% 6.1% 6.5% 6.1% 6.6% 6.3% 6.7% 6.4% 6.6% 6.0% 6.5% 6.5% 7.1% 7.0% 6.9% 6.9% 7.2% 7.4% 7.6% 7.6% 7.0% 7.2% 7.3% 7.3% 6.9% 7.7% 7.5% 7.1% 7.5% 7.6% 7.7% 7.6% 7.6% 7.4% 7.8% 8.6% 7.9% 7.4% 7.7% 8.3% 8.0% 7.6% 8.0% 3% In the last 15 years, the labor force participation rate for workers 75 and over grew from 4.5% to 8.6% (in 2013:Q1), but has since fallen slightly. Sources: US Bureau of Labor Statistics, US Department of Labor; Insurance Information Institute.
34 Labor Force Participation Rate, Quarterly Ages 75 and over, :Q4 Labor Force participation rate 14% 12% Nearly 1 in 8 men in this age group is working. 10% 8% 6% 4% 2% The percent of women in this age group that is working has doubled. 0% The labor force participation rate for workers 75 and over has doubled since 1998, but growth in the participation rate has slowed recently. Source: US Bureau of Labor Statistics, US Department of Labor; Insurance Information Institute
35 Fatal Work Injury Rates Improved Slightly Since 2006 but Still Climb Sharply With Age Fatal Work Injury Rate per 100,000 full-time-equivalent workers The fatality rate for workers 65 and older was 4 times that of workers age The workplace of the future will have to be completely redesigned to accommodate the surge in older workers data are preliminary Source: U.S. Bureau of Labor Statistics, at 35
36 Median Days Away From Work Older Workers Lose More Days from Work Due to Injury or Illness Youngest baby boomer is age 51 (in 2015) Oldest baby boomer is age 69 (in 2015) Median lost time of workers age 65+ is 2-3X that of workers age These numbers are pretty stable they haven t changed much since Source: US Bureau of Labor Statistics, Nonfatal Occupational Injuries and Illnesses Requiring Days Away From Work, 2013 (Table 10), released December 16,
37 Percent of Days-Away-from-Work Cases, by Days Lost and Age Group, day 2 days 3-5 days 6-10 days days days 31 days or more Over one-third of days-lost cases of older workers involved a month or more away from work. And virtually 9 of 10 cases were for at least two days, compared to 8 of 10 for the youngest workers. Source: US Bureau of Labor Statistics, Nonfatal Occupational Injuries and Illnesses Requiring Days Away From Work, 2012 (Table 10), released November 26,
38 Percent of Days-Away-from-Work Cases, by Days Lost and Age Group, day 2 days 3-5 days 6-10 days days days 31 days or more Over one-third of days-lost cases of older workers involved a month or more away from work. And over 9 of 10 cases were for at least two days, compared to 8 of 10 for the youngest workers. Source: US Bureau of Labor Statistics, Nonfatal Occupational Injuries and Illnesses Requiring Days Away From Work, 2012 (Table 10), released November 26,
39 Older Workers Are Much More Likely to Break a Bone Incidence Rate* (2012) Fractures Multiple Traumatic Injuries *per 10,000 full-time-equivalent workers Source: US Bureau of Labor Statistics, US Department of Labor at Table 14 39
40 Older Workers Are Much More Likely to Break a Bone Incidence Rate* (2013) Fractures Multiple Traumatic Injuries *per 10,000 full-time-equivalent workers Source: US Bureau of Labor Statistics, US Department of Labor at Table 14 40
41 Older Workers Are More Likely Than Younger Workers to Slip/Fall, but Less Likely to Overexert Themselves Incidence Rate (2012) Source/Nature of Injury: Falls, slips, trips Overexertion Source: US Bureau of Labor Statistics, US Department of Labor at Table 14 41
42 Older Workers Are More Likely Than Younger Workers to Slip/Fall, but Less Likely to Overexert Themselves Incidence Rate (2013) Source/Nature of Injury: Falls, slips, trips Overexertion Source: US Bureau of Labor Statistics, US Department of Labor at Table 14 42
43 6. The Obesity Epidemic In 1994, in no state was the percent of adults who were obese as high as 20%. By 2010, all 50 states had adult obesity rates of 20% or more. In 18 states in 2013, 30% of the adults were obese. 43

44 Obesity Trends Among U.S. Adults BRFSS, 1994 Source: 44

45 Obesity Trends Among U.S. Adults BRFSS, 2013 Source:
46 Lost Workdays per 100 FTEs Claims per 100 FTEs The Most Obese Workers File Twice as Many WC Claims as Healthy-Weight Workers BMI <18.5 (Underweight) The most obese have twice as many claims and 13 times more lost workdays than healthy weight workers (Healthy Weight) (Overweight) (Obese (Obese Class I) Class II) (Obese Class III) Lost Workdays Claims Source: Ostbye, T., et al, Obesity and Workers Compensation, Archives of Internal Medicine, April 23,
47 $7,109 $3,924 $7,503 $5,396 $13,338 $13,569 $19,661 $23,633 $23,373 $34,293 $51,091 $59,178 WC Medical Claims and Indemnity Costs are 5-10x Higher for the Most Obese Workers $70,000 $60,000 Indemnity costs are 11 times higher for the most obese workers than for healthy-weight workers. $50,000 $40,000 $30,000 $20,000 $10,000 $0 BMI <18.5 (Underweight) (Healthy Weight) (Overweight) (Obese Class I) (Obese Class II) 40+ (Obese Class III) Medical Claims Costs Indemnity Claims Costs Source: Ostbye, T., et al, Obesity and Workers Compensation, Archives of Internal Medicine, April 23,
48 Additional (to WC) Costs of Obese Workers Estimated Per Capita Costs $6,000 $5,000 $4,000 The most obese workers cost employers for greater medical care and by being less productive (by being absent more and being less productive when at work. $3,792 $3,000 $2,000 $1,010 $1,026 $1,000 $0 $657 $391 $277 $1,269 $85 $0 $824 $148 $ (Overweight) (Obese Class I) (Obese Class II) 40+ (Obese Class II) Medical Claims Costs Absenteeism Presenteeism Source: Finkelstein, E., et al, The Costs of Obesity in the Workplace, Journal of Occupational and Environmental Medicine, Volume 52, No. 10 (October 2010), pp
49 Insurance Information Institute Online: Thank you for your time and your attention!
P/C Insurance Industry Overview & Outlook
 P/C Insurance Industry Overview & Outlook Alexander & Schmidt Loss Control Forum 2016 Portland, ME September 14, 2016 Steven N. Weisbart, Ph.D., CLU, Senior Vice President & Chief Economist Insurance Information
2016 Workers compensation premium index rates
 2016 Workers compensation premium index rates NH WA OR NV CA AK ID AZ UT MT WY CO NM MI VT ND MN SD WI NY NE IA PA IL IN OH WV VA KS MO KY NC TN OK AR SC MS AL GA TX LA FL ME MA RI CT NJ DE MD DC = Under
Economic Trends, Challenges, and Opportunities Affecting the P/C and Surety LOB
 Economic Trends, Challenges, and Opportunities Affecting the P/C and Surety LOB New Jersey Surety Association September 13, 2012 Steven N. Weisbart, Ph.D., CLU, Senior Vice President & Chief Economist
Plunging Crude Prices: Impact on U.S. and State Economies
 Plunging Crude Prices: Impact on U.S. and State Economies Mine Yücel Senior Vice President and Director of Research August 7, 215 Oil and gas prices plunge Nominal price, $, weekly 16 14 12 Oil Price 1
Florida 1/1/2016 Workers Compensation Rate Filing
 Florida 1/1/2016 Workers Compensation Rate Filing Kirt Dooley, FCAS, MAAA October 21, 2015 1 $ Billions 4.0 3.5 3.0 2.5 2.0 1.5 1.0 0.5 0.0 Florida s Workers Compensation Premium Volume 2.368 0.765 0.034
Mega-Trends Influencing the Workers Compensation Insurance Industry
 Mega-Trends Influencing the Workers Compensation Insurance Industry 5th Annual National Workers Compensation Insurance ExecuSummit New York, NY February 5, 2008 Steven N. Weisbart, Ph.D., CLU, Vice President
Today s Uncertain Economy: Implications for P/C Insurance
 Today s Uncertain Economy: Implications for P/C Insurance CAMAR Spring Meeting Great Valley, PA May 24, 2018 Steven N. Weisbart, Ph.D., CLU, Senior Vice President & Chief Economist Insurance Information
Texas Economic Outlook: Cruising in Third Gear
 Texas Economic Outlook: Cruising in Third Gear Keith Phillips Assistant Vice President and Senior Economist 1/19/17 The views expressed in this presentation are strictly those of the presenter and do not
Texas Economic Outlook: Strong Growth Continues
 Texas Economic Outlook: Strong Growth Continues Keith Phillips Assistant Vice President and Senior Economist 1/23/18 The views expressed in this presentation are strictly those of the presenter and do
Zions Bank Economic Overview
 Zions Bank Economic Overview Jackson Hole Mountain Resort March 20, 2018 National Economic Conditions When Good News is Bad News Is Good News?? Dow Tops 26,000 Up 44% Since 2016 Election Source: Wall Street
2018 Texas Economic Outlook: Firing on All Cylinders
 218 Texas Economic Outlook: Firing on All Cylinders Keith Phillips Assistant Vice President and Senior Economist 4/5/218 The views expressed in this presentation are strictly those of the presenter and
Older consumers and student loan debt by state
 August 2017 Older consumers and student loan debt by state New data on the burden of student loan debt on older consumers In January, the Bureau published a snapshot of older consumers and student loan
Black Knight Mortgage Monitor
 Black Knight Mortgage Monitor Mortgage Market Performance Observations Data as of May, 2014 Month-end Black Knight First Look May 2014 Total U.S. loan delinquency rate (loans 30 or more days past due,
Zions Bank Economic Overview
 Zions Bank Economic Overview Utah League of Cities and Towns June 18, 2018 Utah Economic Conditions CA 0.6% OR 1.4% WA 1.7% NV 2.0% Utah Population 3 rd Fastest Growing in U.S. ID 2.2% UT 1.9% AZ 1.6%
ehealth, Inc Fall Cost Report for Individual and Family Policyholders
 ehealth, Inc. 2010 Fall Cost Report for and Family Policyholders Table of Contents Page Methodology.................................................................. 2 ehealth, Inc. 2010 Fall Cost Report
Texas Mid-Year Economic Outlook: Strong Growth Continues
 Texas Mid-Year Economic Outlook: Strong Growth Continues Keith Phillips Assistant Vice President and Senior Economist 9/27/18 The views expressed in this presentation are strictly those of the presenter
Recap of 2017: The Best Year in a Decade
 NOVEMBER 217 Recap of 217: The Best Year in a Decade Macroeconomic conditions remained favorable for housing and mortgage markets in 217. Despite challenges, the housing markets remain on track for their
Refinance Report August 2012
 This report contains data on refinance program activity of Fannie Mae and Freddie Mac (the Enterprises) through. Report Highlights Refinance volume continued to be strong in August as 30-year mortgage
Plunging Oil Prices: Impact on the U.S. and State Economies
 Plunging Oil Prices: Impact on the U.S. and State Economies Mine Yücel Senior Vice President and Director of Research November 17, 216 Nominal price, weekly 16 14 Oil and gas prices volatile 12 1 Oil price
Maximizing Your State of the Line Experience
 Maximizing Your State of the Line Experience P/C INDUSTRY NET WRITTEN PREMIUM SLIDE 4 The net written premium in this slide provides a measure of the size of each major line of business in the property/casualty
PRODUCER ANNUITY SUITABILITY TRAINING REQUIREMENTS BY STATE As of September 11, 2017
 PRODUCER ANNUITY SUITABILITY TRAINING REQUIREMENTS BY STATE As of September 11, 2017 This document provides a summary of the annuity training requirements that agents are required to complete for each
Utah Land Title Association Economic Overview February 1, 2016
 Utah Land Title Association Economic Overview February 1, 2016 Utah is One of the Fastest Growing CA 0.9% States in the Country Percent Change in Population for States: 2012 to 2013 WA 1.1% OR 0.8% NV
STATE OF THE LINE REPORT
 ANNUAL ISSUES SYMPOSIUM STATE OF THE LINE REPORT T H E SYSTEM @WORK KATHY ANTONELLO, FCAS, FSA, MAAA CHIEF ACTUARY NCCI Copyright NCCI Holdings, Inc. All Rights Reserved. ANNUAL ISSUES SYMPOSIUM PROPERTY/CASUALTY
Tax Freedom Day 2019 is April 16th
 Apr. 2019 Tax Freedom Day 2019 is April 16th Erica York Economist Madison Mauro Research Assistant Emma Wei Research Assistant Key Findings This year, Tax Freedom Day falls on April 16, or 105 days into
Paying Out-of-Pocket
 September 2017 Paying Out-of-Pocket The Healthcare Spending of 2 Million US Families Healthcare costs are rising for families. In 2015 the US spent 18 percent of Gross Domestic Product (GDP) on healthcare,
Uinta Basin Energy Summit Economic Overview September 10, 2015
 Uinta Basin Energy Summit Economic Overview September 10, 2015 Overview National Economic Conditions Utah Economic Conditions Utah is One of the Fastest Growing CA States in the Country Percent Change
Comparative Revenues and Revenue Forecasts Prepared By: Bureau of Legislative Research Fiscal Services Division State of Arkansas
 Comparative Revenues and Revenue Forecasts 2010-2014 Prepared By: Bureau of Legislative Research Fiscal Services Division State of Arkansas Comparative Revenues and Revenue Forecasts This data shows tax
Who s Above the Social Security Payroll Tax Cap? BY NICOLE WOO, JANELLE JONES, AND JOHN SCHMITT*
 Issue Brief September 2011 Center for Economic and Policy Research 1611 Connecticut Ave, NW Suite 400 Washington, DC 20009 tel: 202-293-5380 fax: 202-588-1356 www.cepr.net Who s Above the Social Security
Eye on the South Carolina Housing Market presented at 2008 HBA of South Carolina State Convention August 1, 2008
 Eye on the South Carolina Housing Market presented at 28 HBA of South Carolina State Convention August 1, 28 Robert Denk Assistant Staff Vice President, Forecasting & Analysis 2, US Single Family Housing
The Oil Market: From Boom to Gloom
 The Oil Market: From Boom to Gloom Mine Yücel Senior Vice President and Director of Research February 12, 216 The views expressed are those of the speaker and should not be attributed to the or the Federal
Zions Bank Economic Overview
 Zions Bank Economic Overview Utah Institute of Real Estate Management Economic Summit September 12, 2017 National Economic Conditions August Job Indicators Indicator Expectation Actual Total Nonfarm Payrolls
Unemployment Insurance Benefit Adequacy: How many? How much? How Long?
 Unemployment Insurance Benefit Adequacy: How many? How much? How Long? Joel Sacks, Deputy Commissioner Washington State Employment Security Department March 1, 2012 1 Outline How many get unemployment
Workers Compensation Outlook Recap
 Workers Compensation Outlook Recap Evolving Workplace Premium Growth in the Latest Year Underwriting Results Improved Again Frequency Continues to Decline Economic Recovery 2 Property/Casualty (P/C) Results
Oregon: Where Taxes Are Low, Fees Are High and Revenue Is Slightly Below Average
 Issue Brief March 6, 2012 Oregon: Where Taxes Are Low, Fees Are High and Revenue Is Slightly Below Average The money we pay in fees and taxes helps create jobs, build a strong economy, and preserve Oregon
TCJA and the States Responding to SALT Limits
 TCJA and the States Responding to SALT Limits Kim S. Rueben Tuesday, January 29, 2019 1 What does this mean for Individuals under TCJA About two-thirds of taxpayers will receive a tax cut with the largest
Massachusetts Budget and Policy Center
 Progressive Massachusetts 2013 Policy Conference March 24, 2013 Lasell College Newton, MA Presentation by Massachusetts Budget and Policy Center Our State Budget: Building a Better Future Together Massachusetts
Analyzing State-Level Construction Fatality Rates,
 Analyzing State-Level Construction Fatality Rates, 1992-2016 John Mendeloff Professor of Public Affairs University of Pittsburgh jmen@pitt.edu Wayne B. Gray Professor of Economics Clark University wgray@clarku.edu
Nevada Labor Market Briefing: January Summary of Labor Market Economic Indicators
 Nevada Labor Market Briefing: January 2019 Summary of Labor Market Economic Indicators Department of Employment, Training, & Rehabilitation Dr. Tiffany Tyler-Garner, Director Dennis Perea, Deputy Director
Marilyn Tavenner, CMS Administrator Don Moulds, Acting Assistant Secretary for Planning and Evaluation
 TO: The Secretary Through: DS COS ES FROM: Marilyn Tavenner, CMS Administrator Don Moulds, Acting Assistant Secretary for Planning and Evaluation DATE: September 5, 2013 SUBJECT: Projected Monthly Targets
Alaska Transportation Finance Study Alaska Municipal League
 Alaska Transportation Finance Study Alaska Municipal League presented to Alaska House Transportation Committee presented by Christopher Wornum Cambridge Systematics, Inc. February 12, 2009 Transportation
Workers Compensation and the Economy
 Workers Compensation and the Economy Trends, Challenges and Opportunities Workers Compensation Education Conference Orlando, FL August 20, 2013 Robert P. Hartwig, Ph.D., CPCU, President & Economist Insurance
Mississippi s Business Monitoring The State s Economy
 Mississippi s Business January 2012 Monitoring The State s Economy ECONOMY AT A GLANCE Volume 70 - Number 1 A Publication of the University Research Center, Mississippi Institutions of Higher Learning
Property Tax Relief in New England
 Property Tax Relief in New England January 23, 2015 Adam H. Langley Senior Research Analyst Lincoln Institute of Land Policy www.lincolninst.edu Property Tax as a % of Personal Income OK AL IN UT SD MS
A Perspective from the Federal Reserve Institute of Internal Auditors San Antonio Chapter August 19, 2015 Blake Hastings Senior Vice President
 A Perspective from the Federal Reserve Institute of Internal Auditors San Antonio Chapter August 19, 215 Blake Hastings Senior Vice President The views expressed in this presentation are strictly those
Maryland. September 7,
 Maryland September 7, 2018 David_Benedict@ncci.com 804-380-3005 Dawn_Ingham@ncci.com 561-893-3165 Robert_Moss@ncci.com 561-893-3794 Maryland State Advisory Forum The Future@Work (Video) Countrywide Workers
State of the Automotive Finance Market
 State of the Automotive Finance Market A look at loans and leases in Q4 2017 Presented by: Melinda Zabritski Sr. Director, Financial Solutions www.experian.com/automotive 2018 Experian Information Solutions,
State Treatment of Social Security Treatment of Pension Income Other Income Tax Breaks Property Tax Breaks
 State-By-State Tax Breaks for Seniors, 2016 State Treatment of Social Security Treatment of Pension Income Other Income Tax Breaks Property Tax Breaks AL Payments from defined benefit private plans are
Cost and Coverage Implications of the ACA Medicaid Expansion: National and State by State Analysis
 Cost and Coverage Implications of the ACA Medicaid Expansion: National and State by State Analysis Report Authors: John Holahan, Matthew Buettgens, Caitlin Carroll, and Stan Dorn Urban Institute November
Tax Freedom Day 2018 is April 19th
 Apr. 2018 Tax Freedom Day 2018 is April 19th Erica York Analyst Key Findings Tax Freedom Day is a significant date for taxpayers and lawmakers because it represents how long Americans as a whole have to
2018 National Electric Rate Study
 2018 National Electric Rate Study Ranking of Typical Residential, Commercial and Industrial Electric Bills LES Administrative Board June 15, 2018 Emily N. Koenig Director of Finance & Rates 1 Why is the
Construction, Manufacturing and Oil & Gas Industries and the P/C Insurance Industry:
 Construction, Manufacturing and Oil & Gas Industries and the P/C Insurance Industry: Trends, Challenges & Opportunities Insurance Information Institute June 12, 2013 Download at www.iii.org/presentations
Mega-Trends Affecting the Workers Compensation Insurance Industry
 Mega-Trends Affecting the Workers Compensation Insurance Industry Challenges Amid the Economic Crisis 6 th Annual National Workers Compensation ExecuSummit Uncasville, CT February 2, 2009 Robert P. Hartwig,
Western Treasure Valley Economic Breakfast Economic Overview March 17, 2016
 Western Treasure Valley Economic Breakfast Economic Overview March 17, 2016 Utah is One of the Fastest Growing CA 0.9% States in the Country Percent Change in Population for States: 2012 to 2013 WA 1.1%
NCCI Research Investigating the Drivers of the 2015 Workers Compensation Medical Severity Decline
 NCCI Research Investigating the Drivers of the 2015 Workers Compensation Medical Severity Decline By David Colón, ACAS, MAAA Associate Actuary, NCCI Introduction NCCI reported at its 2016 Annual Issues
The Acquisition of Regions Insurance Group. April 6, 2018
 The Acquisition of Regions Insurance Group April 6, 2018 Forward-Looking Statements This presentation contains "forward-looking statements" within the meaning of the Private Securities Litigation Reform
Texas Economic Outlook: Tapping on the Brakes
 National Economy Picking Up After Q1 Pause Texas Economic Outlook: Tapping on the Brakes Keith Phillips Assistant Vice President and Senior Economist Consumer spending picked up in 1 as housing prices
Texas Mid-Year Economic Outlook: The Skies are Beginning to Clear Keith Phillips Assistant Vice President and Senior Economist
 Texas Mid-Year Economic Outlook: The Skies are Beginning to Clear Keith Phillips Assistant Vice President and Senior Economist The views expressed in this presentation are strictly those of the presenter
State of the Line AIS AIS th Anniversary th Anniversary. Copyright 2018 NCCI Holdings, Inc. All Rights Reserved.
 State of the Line Copyright NCCI Holdings, Inc. All Rights Reserved. PROPERTY/CASUALTY (P/C) RESULTS Copyright NCCI Holdings, Inc. All Rights Reserved. P/C Industry Net Written Premium Growth Private Carriers
The Lincoln National Life Insurance Company Term Portfolio
 The Lincoln National Life Insurance Company Term Portfolio State Availability as of 7/16/2018 PRODUCTS AL AK AZ AR CA CO CT DE DC FL GA GU HI ID IL IN IA KS KY LA ME MP MD MA MI MN MS MO MT NE NV NH NJ
The Changing Revenue Landscape
 The Changing Revenue Landscape NCSL Legislative Summit, 2018 July 30, 2018 Lucy Dadayan July 30, 2018 Lucy Dadayan State Revenue Trends and Volatility TCJA, South Dakota vs. Wayfair, Sports Betting Overview
2016 Texas Economic Outlook: Riding the Energy Roller Coaster Keith Phillips Assistant Vice President and Senior Economist
 216 Texas Economic Outlook: Riding the Energy Roller Coaster Keith Phillips Assistant Vice President and Senior Economist The views expressed in this presentation are strictly those of the presenter and
SIGNIFICANT PROVISIONS OF STATE UNEMPLOYMENT INSURANCE LAWS JANUARY 2008
 U.S. DEPARTMENT OF LABOR EMPLOYMENT AND TRAINING ADMINISTRATION Office Workforce Security SIGNIFICANT PROVISIONS OF STATE UNEMPLOYMENT INSURANCE LAWS JANUARY 2008 AL AK AZ AR CA CO CT DE DC FL GA HI /
Black Knight Mortgage Monitor
 Black Knight Mortgage Monitor Mortgage Market Performance Observations Data as of April, 2014 Month-end Black Knight First Look April 2014 2 Focus Points Prepayment activity and originations ARM loans
CONNECTICUT. October 5,
 CONNECTICUT October 5, 2016 Laura_Backus_Hall@ncci.com 802-454-1800 Jim_Davis@ncci.com 561-893-3097 Opening Remarks Economic Outlook: Countrywide and Connecticut Workers Compensation System Overview: Countrywide
Utah Association of Special Districts Economic Overview November 5, 2015
 Utah Association of Special Districts Economic Overview November 5, 2015 Utah is One of the Fastest Growing CA 0.9% States in the Country Percent Change in Population for States: 2012 to 2013 WA 1.1% OR
Local Anesthesia Administration by Dental Hygienists State Chart
 Education or AK 1981 General Both Specific Yes WREB 16 hrs didactic; 6 hrs ; 8 hrs lab AZ 1976 General Both Accredited Yes WREB 36 hrs; 9 types of AR 1995 Direct Both Accredited/ Board Approved No 16 hrs
Tax Breaks for Elderly Taxpayers in the States in 2016
 AL Payments from defined benefit private plans are exempt; most public systems are exempt; military and US Civil service are exempt Special Homestead ion for 65+ +25.2% +2.4% AK No PIT Homestead ion for
Indexed Universal Life Caps
 Indexed Universal Life Caps Effective March 15, 2013, the caps on FG Life-Elite II will be changing as follows: Cap Illustrative Rate 100% Participation Annual Point-to-Point 14.75% 8.32% 140% Participation
NCCI Research Workers Compensation and Prescription Drugs 2016 Update
 NCCI Research Workers Compensation and Prescription Drugs 2016 Update By Barry Lipton, FCAS, MAAA, Practice Leader and Senior Actuary, NCCI David Colón, ACAS, MAAA, Associate Actuary, NCCI Introduction
One Year Later: Update on Claim Payouts to Alabama Policyholders
 One Year Later: Update on Claim Payouts to Alabama Policyholders Insurance and Economic Recovery in the Wake of the April 211 Tornadoes Insurance Information Institute April 19, 212 Download at www.iii.org/presentations
KENTUCKY. August 18, 2016
 KENTUCKY August 18, 2016 Cathy_Booth@ncci.com 202-655-2699 Sean_Cooper@ncci.com 561-893-3072 Mona_Carter@ncci.com 561-893-3045 Ed O Daniel, Esq. 859-336-9611 Kentucky Workers Compensation State Advisory
Regional Economic Update
 Regional Economic Update Roberto Coronado Assistant Vice President in Charge and Sr. Economist July 23, 2015 The views expressed in this presentation are strictly those of the authors and do not necessarily
State Trust Fund Solvency
 Unemployment Insurance State Trust Fund Solvency National Employment Law Project Conference - Washington DC December 7, 2009 Robert Pavosevich pavosevich.robert@dol.gov Unemployment Insurance Program
Obamacare in Pictures
 Obamacare in Pictures VISUALIZING THE EFFECTS OF THE PATIENT PROTECTION AND AFFORDABLE CARE ACT Spring 2014 If you like your health care plan, can you really keep it? At least 4.7 million health care plans
Alternative Paths to Medicaid Expansion
 Alternative Paths to Medicaid Expansion Robin Rudowitz Kaiser Commission on Medicaid and the Uninsured Kaiser Family Foundation National Health Policy Forum March 28, 2014 Figure 1 The goal of the ACA
RESEARCH REPORT VARIABLE RATE DEMAND OBLIGATIONS 2010 UPDATE OCTOBER New York n Washington. Volume V No.
 RESEARCH REPORT OCTOBER 21 VARIABLE RATE DEMAND OBLIGATIONS 21 UPDATE Volume V No. 16 New York n Washington Variable Rate Demand Obligations Q2 29-21 VARIABLE RATE DEMAND OBLIGATIONS Variable rate demand
Fourth Quarter 2014 Financial Results Supplement
 Fourth Quarter 20 Financial Results Supplement February 19, 2015 Table of contents Financial Results Segment Business Information 2 - Annual Financial Results 12 - Single-Family New Funding Volume 3 -
Taxing Investment Income in the States New Hampshire Fiscal Policy Institute 2 nd Annual Budget and Policy Conference Concord, NH January 23, 2015
 Taxing Investment Income in the States New Hampshire Fiscal Policy Institute 2 nd Annual Budget and Policy Conference Concord, NH January 23, 2015 Norton Francis State and Local Finance Initiative Urban-Brookings
RLI TRANSPORTATION A Division of RLI Insurance Company 2970 Clairmont Road, Suite 1000 Atlanta, GA Phone: Fax:
 RLI TRANSPORTATION A Division of RLI Insurance Company 2970 Clairmont Road, Suite 1000 Atlanta, GA 30329 Phone: 404-315-9515 Fax: 404-315-6558 AGENCY/BROKER PROFILE Please type your answers. Use a separate
Premium Savings Program Broker Training
 Quality health plans & benefits Healthier living Financial well-being Intelligent solutions Premium Savings Program Broker Training April 2013 We are responding to ACA changes Pricing volatility Rate shock
Understanding the New Trump Economy Economic Overview. November 15, 2016
 Understanding the New Trump Economy Economic Overview November 15, 2016 Uncertainty at the Na@onal and Interna@onal Level Source: Bureau of Labor Statistics The Trump Bump Why? National Job Growth 500
Old Dominion University 2013 National Economic Outlook
 Old Dominion University 2013 National Economic Outlook January 30, 2013 Professor Vinod Agarwal Professor Mohammad Najand Professor Gary A. Wagner www.odu.edu/forecasting 1 Presentation Outline 2012 Scorecard
Zions Bank Economic Overview Alta High School. March 24, 2017
 Zions Bank Economic Overview Alta High School March 24, 2017 Economic Fundamentals Scarcity Based on limited resources Scarce resources must be allocated using a method of distribution Example: Food Clean
Latinas Access to Health Insurance
 FACT SHEET Latinas Access to Health Insurance APRIL 2018 Data released by the U.S. Census Bureau show that, despite significant health insurance gains since the Affordable Care Act (ACA) was implemented,
Workers Compensation Temporary Total Disability Indemnity Benefit Duration 2011 Update
 April 2012 by Barry Lipton, John Robertson, and Katy Porter Workers Compensation Temporary Total Disability Indemnity Benefit Duration 2011 Update KEY FINDINGS This brief updates our previous paper 1 published
ALASKA. October 19,
 ALASKA October 19, 2016 Maggie_Karpuk@ncci.com 818-707-8374 John_Deacon@ncci.com 818-707-8376 Alaska Workers Compensation State Advisory Forum State of the Industry Economic Overview Alaska Workers Compensation
Percent of Employees Waiving Coverage 27.0% 30.6% 29.1% 23.4% 24.9%
 Number of Health Plans Reported 18,186 3,561 681 2,803 3,088 Offer HRA or HSA 34.0% 42.7% 47.0% 39.7% 35.0% Annual Employer Contribution $1,353 $1,415 $1,037 $1,272 $1,403 Percent of Employees Waiving
SCHIP: Let the Discussions Begin
 Figure 0 SCHIP: Let the Discussions Begin Diane Rowland, Sc.D. Executive Vice President, Henry J. Kaiser Family Foundation and Executive Director, Kaiser Commission on for Alliance for Health Reform February
Medicare Alert: Temporary Member Access
 Medicare Alert: Temporary Member Access Plan Sponsor: Coventry/Aetna Medicare Part D Effective Date: Jan. 12, 2015 Geographic Area: National If your pharmacy is a Non Participating provider in the Aetna/Coventry
Yolanda K. Kodrzycki New England Public Policy Center Federal Reserve Bank of Boston
 The Growing Instability of Revenues over the Business Cycle: Putting the New England States in Perspective Yolanda K. Kodrzycki New England Public Policy Center Federal Reserve Bank of Boston Lincoln Institute
MEMORANDUM. SUBJECT: Benchmarks for the Second Half of 2008 & 12 Months Ending 12/31/08
 MEMORANDUM TO: FROM: HR Investment Center Members Matt Cinque, Managing Director DATE: March 12, 2009 SUBJECT: Benchmarks for the Second Half of 2008 & 12 Months Ending 12/31/08 Please find enclosed the
While one in five Californians overall is uninsured, the rate among those who work is even higher: one in four.
 : By the Numbers December 2013 Introduction California had the greatest number of uninsured residents of any state, 7 million, and the seventh largest percentage of uninsured residents under 65 in the
Obamacare in Pictures. Visualizing the Effects of the Patient Protection and Affordable Care Act
 Visualizing the Effects of the Patient Protection and Affordable Care Act Fall 2012 expands dependence on government health care dumps millions into Medicaid and creates new federal subsidies for government-approved
Report to Congressional Defense Committees
 Report to Congressional Defense Committees The Department of Defense Comprehensive Autism Care Demonstration December 2016 Quarterly Report to Congress In Response to: Senate Report 114-255, page 205,
Increase Profitability by Controlling Insurance Premiums
 Increase Profitability by Controlling Insurance Premiums Increase Profitability by Controlling Insurance Premiums Jeff Mount Senior Vice President Federated Insurance This session is eligible for 1.5 Continuing
Zions Bank Salt Lake Northeast Region Officers Mee8ng Economic Overview. July 28, 2016
 Zions Bank Salt Lake Northeast Region Officers Mee8ng Economic Overview July 28, 2016 National Economic Conditions Readings on the U.S. economy since the turn of the year have been somewhat mixed. - Janet
IMPROVING COLLEGE ACCESS
 IMPROVING COLLEGE ACCESS Grants and Resources for Education Leaders West Virginia Leaders of Education Conference December 3, 2018 THE EDUCATION ALLIANCE Statewide non-profit organization W E brings B
2018 ADDENDUM INSTRUCTIONS
 2018 ADDENDUM INSTRUCTIONS FEBRUARY 22, 2019 UPDATE: 2018 MUNICIPAL REFERENCE BOOK 1. DELAWARE funds are listed on page 15. You may note on page 15 to see the addendum for additional Delaware funds. The
Changes in Monday Claims
 September 2018 By Chun Shyong, Barry Lipton, and John Robertson Changes in Monday Claims INTRODUCTION Sometimes, workers compensation (WC) pays claims for injuries that are reported as work related but
Mega Trends in Workers Compensation
 Mega Trends in Workers Compensation Past, Present and Future 16 th Annual AMCOMP Conference Las Vegas, NV March 27, 2014 Download at www.iii.org/presentations Robert P. Hartwig, Ph.D., CPCU, President