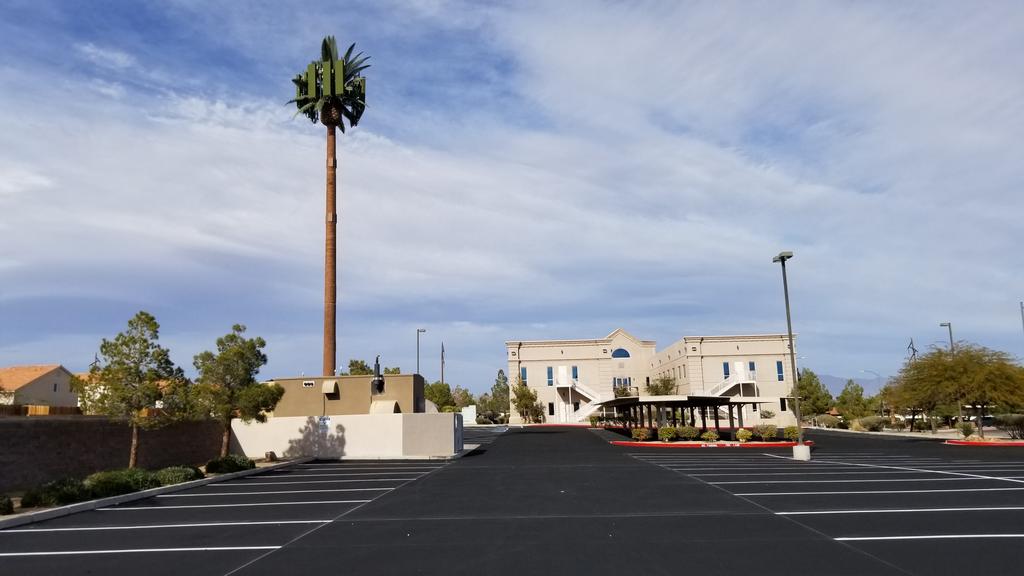
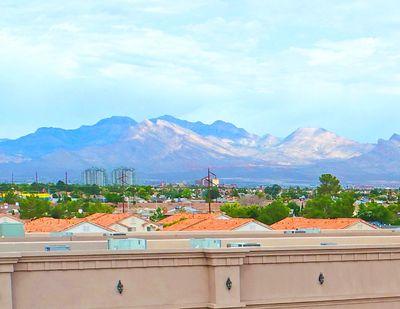
7401 W Charleston Blvd, Las Vegas, NV 89117
|
|
|
- Collin Raymond Hodges
- 5 years ago
- Views:
Transcription


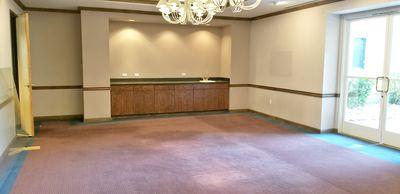
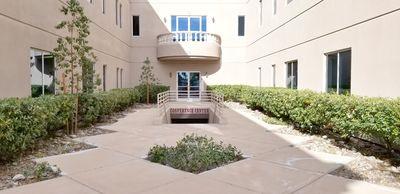
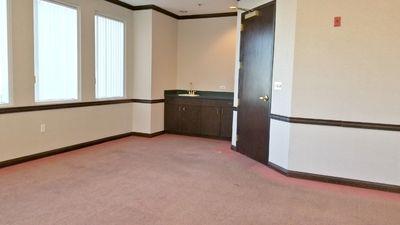
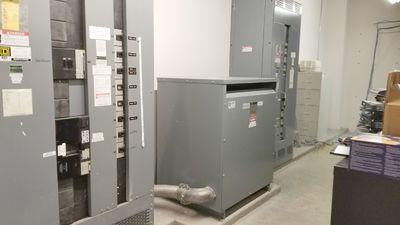
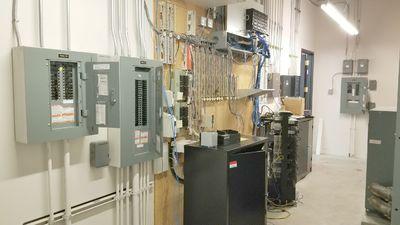
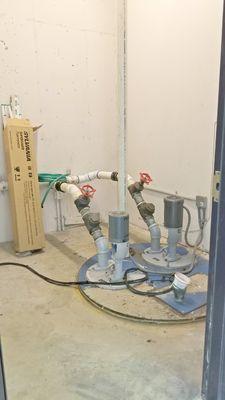
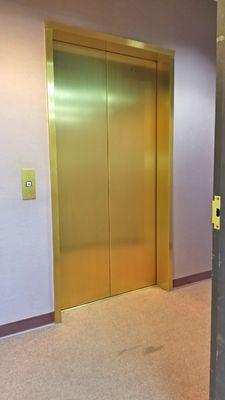
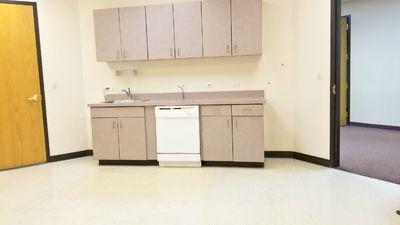
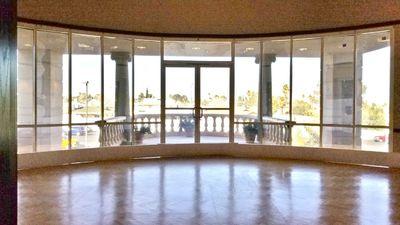
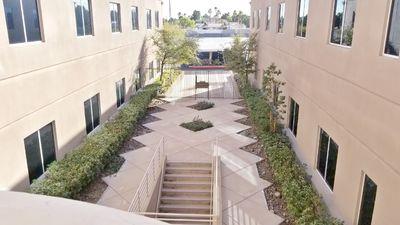
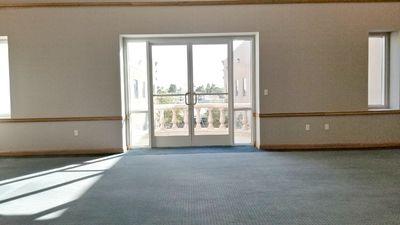
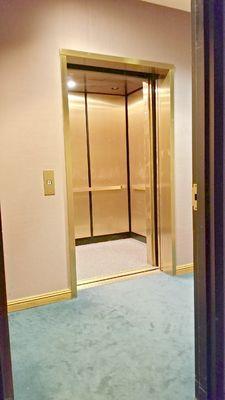
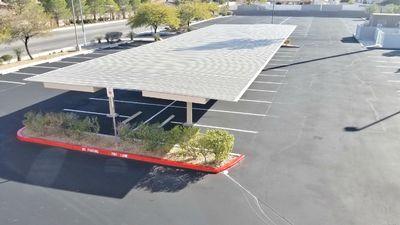
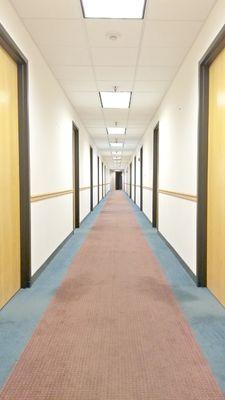
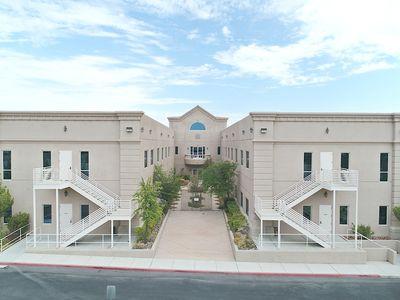
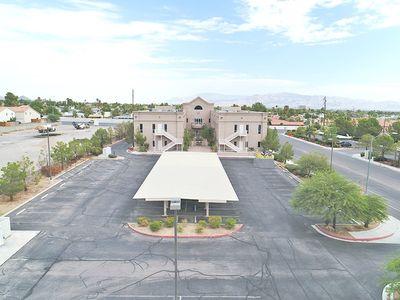
1 Cool $1.25 Million Discounted Las Vegas Company HQ Office 7401 W Charleston Blvd, Las Vegas, NV Listing ID: Status: Property Type: Office Type: Size: Sale Price: Unit Price: Sale Terms: Overview/Comments Active Office For Sale Business Park Office Building 34,034 SF $8,749,999 $ PSF Cash to Seller * Cool $1,250, Discounted from Sale Price * Was advertised at $10m, now reduced by $1.25m for quick close * 100% available, purchase or lease. * 34,037' square foot three-story professional office building on 2.22 acres * Signage, frontage, visibility, high image, four balconies, Strip views * Qualifies 10% down owner user SBA loan, 5.4% fixed 10/20 $1.55 psf payments * 42,000 daily traffic to Summerlin (highly affluent community) * Fiber Optics, cell tower w/ $24K income, street monument sign, alarm system * 3-Phase, 1,800 amps, 480Y/270V power w/ private transformer, full sprinklers, * Previous law firm, will fit any professional w/ 80+/- individual offices, fresh paint * Reception/waiting, multiple conferences, high-end fixtures, private elevator * Four owner/partner private offices w/ wet bar adjoining four secretary offices * Multiple private restrooms on each floor, break rooms, private gated courtyard * 125+ parking: front, rear, covered, reserved, street, new slurry coat/ stripping * Quick to I-95, 215, I-15, swc Charleston and S. Tenaya, on 24/7 bus line * APN: , built 1997, remodeled 2003 * City of Las Vegas zoned Professional Offices and Parking (P-R) * Clark County Land Use Offices, Professional Business Services * Recent Phase One, Survey, and Preliminary Title Report * Broker/Owner/Developer making dreams happen daily * Or lease starting at $1.49 rent plus 35c psf operating expenses Own for $1.55 Per Square Foot Per Month
 Investment, Vacant/Owner-User Building Name: Class of Space: Gross Building Area:")
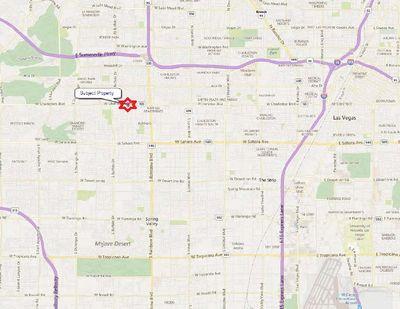
2 General Information Taxing Authority: Tax ID/APN: Office Type: Zoning: Property Use Type: City of Las Vegas Business Park, Executive Suites, Governmental, High-Tech, Institutional, Medical, Office Building, Research & Development CITY OF LAS VEGAS ZONED PROFESSIONAL OFFICES AND PARKING (P-R) Investment, Vacant/Owner-User Building Name: Class of Space: Gross Building Area: Building/Unit Size (RSF): Land Area: Sale Terms: Cool $1.25 Million Discounted Las Vegas Company HQ Office Class A 34,034 SF 34,034 SF 2.22 Acres Cash to Seller Area & Location Property Located Between: Property Visibility: Highway Access: S. Tenaya and Buffalo Excellent I-95, 215, I-15 Building Related Total Number of Buildings: Number of Stories: Typical SF / Floor: Year Built: Year Renovated: Parking Ratio: ,037 SF (per 1000 SF) Parking Description: Passenger Elevators: Freight Elevators: Sprinklers: front/rear parking, covered, reserved, can add parking, 1 0 Wet MSA: Submarket: Las Vegas-Henderson-Paradise West Central Land Related Zoning Description: City of Las Vegas zoned Professional Offices and Parking (P-R) Location Address: County: 7401 W Charleston Blvd, Las Vegas, NV Clark
3 Basement Elevator
4 1st Floor

5 Second Floor
6


7 Property Images 1 Alverson Taylor Mortensen & Sanders Building in Las Vegas, NV listed for sale _ CommercialSearch _ First Floor Floor Plan For Advertising _ Page 3
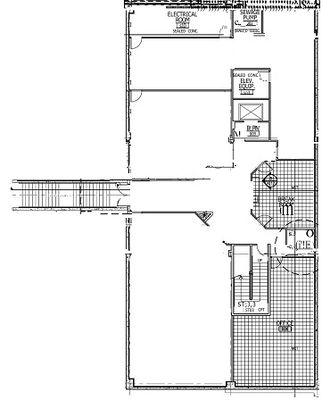
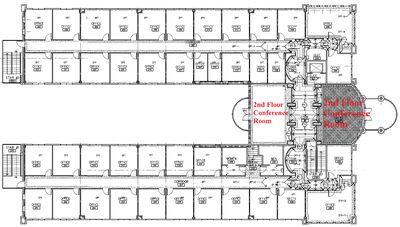
8 _ _ Basement Floor Plan For Advertising _ _ Second Floor Floor Plan For Advert _ Page 4
9 _ _ _ Page 5

10 _ _ _ _ _ _ Page 6
11 _ _DJI_0033 Canyon_Gate_Office_Map _ Canyon_Gate_Office_OM _ _DJI_0045 Page 7


12 504 PSF W Charleston Blvd, Las Vegas, NV Property Contacts 702Michael Hawkes Great Bridge Properties [M] [O] 702Michael@702Michael.com Page 8 Copyright Catylist. All Rights Reserved. The information presented herein is provided as is, without warranty of any kind. Neither the administrators of this site nor Catylist assume any liability for errors or omissions.

13 Demographics, Labor/Workforce, and Consumer Expenditures 7401 W Charleston Blvd, Las Vegas, NV Disclaimer: While we believe this information (via GeoLytics) to be reliable, we have not checked its accuracy and make no guarantee as to its validity. By using the information provided on this page, the user acknowledges that the data may contain errors or other nonconformities. You and/or your client should diligently and independently verify the specifics of the information that you are using. Population 2020 Projection 29, , , Estimate 25, , , Census 23, , ,766 Growth % 14.72% 12.65% Growth % 10.12% 10.98% Population (Male) 2020 Projection 14, , , Estimate 12, , , Census 12, , ,641 Growth % 14.75% 12.66% Growth % 8.38% 9.36% Page 9 Copyright Catylist. All Rights Reserved. The information presented herein is provided as is, without warranty of any kind. Neither the administrators of this site nor Catylist assume any liability for errors or omissions.
14 Population (Female) 2020 Projection 14, , , Estimate 13, , , Census 11, , ,125 Growth % 14.69% 12.64% Growth % 11.85% 12.58% Population by Age (2015 Estimate) Age 0 to 5 1,917 19,594 43,409 Age 5 to 10 1,899 19,717 44,431 Age 10 to 15 1,640 17,113 39,163 Age 15 to 20 1,541 15,697 35,903 Age 20 to 25 1,637 15,662 35,399 Age 25 to 30 1,692 15,953 35,464 Age 30 to 35 1,662 16,142 35,655 Age 35 to 40 1,676 16,817 37,274 Age 40 to 45 1,739 17,743 39,663 Age 45 to 50 1,849 18,659 41,658 Age 50 to 55 1,768 17,680 40,005 Age 55 to 60 1,667 16,342 37,192 Age 60 to 65 1,505 14,246 32,777 Age 65 and over 3,624 35,796 95,490 Total Population 25, , ,483 Median Age Age 0 to 5 Age 5 to 10 Age 10 to 15 Age 15 to 20 Age 20 to 25 Age 25 to 30 Age 30 to 35 Age 35 to 40 Age 40 to 45 Age 45 to 50 Age 50 to 55 Age 55 to 60 Age 60 to 65 Age 65 and over 7% 8% 7% 7% 8% 7% 6% 7% 7% 6% 6% 6% 6% 6% 6% 7% 6% 6% 6% 6% 6% 6% 7% 6% 7% 7% 7% 7% 7% 7% 7% 7% 7% 6% 6% 6% 6% 6% 6% 14% 14% 16% Median Age (Male) 2010 Census Median Age (Female) 2010 Census High School Graduates Age 25+ by Educational Attainment (2015 Estimate) High School Graduate (or GED) 5,474 52, ,610 Some College, No Degree 5,176 47, ,642 Associate or Bachelor's Degree 784 9,982 22,787 Master's Degree 686 6,473 16,451 Professional School Degree 418 3,742 9,707 Doctorate Degree 204 1,308 3,312 Total High School Graduates Age , , ,509 High School Graduate (or GED) Some College, No Degree Associate or Bachelor's Degree Master's Degree Professional School Degree Doctorate Degree 43% 43% 41% 41% 39% 40% 6% 8% 8% 5% 5% 6% 3% 3% 4% 2% 1% 1% Page 10 Copyright Catylist. All Rights Reserved. The information presented herein is provided as is, without warranty of any kind. Neither the administrators of this site nor Catylist assume any liability for errors or omissions.
15 Households 2020 Projection 10, , , Estimate 9,551 97, , Census 8,854 89, ,282 Growth % 14% 11.64% Growth % 9.52% 10.13% Population in Households 2010 Census 23, , ,766 Average Household Size 2020 Projection Estimate Census Growth % 0.04% 0.03% Growth % 0.61% 0.87% Page 11 Copyright Catylist. All Rights Reserved. The information presented herein is provided as is, without warranty of any kind. Neither the administrators of this site nor Catylist assume any liability for errors or omissions.
16 Households by Household Type and Size and Presence of Children (2015 Estimate) Family Households 6,181 61, ,436 Married-couple family 4,042 39,163 95,033 With own 1,585 16,398 38,739 No own 2,457 22,765 56,294 Male Householder: 751 7,363 16,038 no wife present With own 309 3,387 7,382 No own 442 3,976 8,656 Female Householder: no husband 1,388 14,575 32,365 present With own 667 7,562 16,867 No own 721 7,013 15,498 Nonfamily Households 3,370 36,548 85,948 1 Person households 2,442 27,085 64, Unrelated people 928 9,463 21,630 Total Households 9,551 97, ,384 Family Households Married-couple family With own No own Male Householder: no wife present With own No own Female Householder: no husband present With own No own Nonfamily Households 1 Person households 2+ Unrelated people 65% 63% 63% 42% 40% 41% 17% 17% 17% 26% 23% 25% 8% 8% 7% 3% 3% 3% 5% 4% 4% 15% 15% 14% 7% 8% 7% 8% 7% 7% 35% 37% 37% 26% 28% 28% 10% 10% 9% Page 12 Copyright Catylist. All Rights Reserved. The information presented herein is provided as is, without warranty of any kind. Neither the administrators of this site nor Catylist assume any liability for errors or omissions.
17 Households by Household Income (2015 Estimate) Less than $25,000 1,803 19,584 43,531 $25,000 to $49,999 2,761 27,551 61,882 $50,000 to $74,999 1,850 21,547 49,669 $75,000 to $99,999 1,293 11,521 29,819 $100,000 to $124, ,779 17,764 $125,000 to $149, ,693 9,229 $150,000 to $199, ,183 8,597 $200,000 or more 435 3,791 8,893 Total Households 9,551 97, ,384 Average Household Income $67, $65, $68, Median Household Income $58, $57, $60, Less than $25,000 $25,000 to $49,999 $50,000 to $74,999 $75,000 to $99,999 $100,000 to $124,999 $125,000 to $149,999 $150,000 to $199,999 $200,000 or more 19% 20% 19% 29% 28% 27% 19% 22% 22% 14% 12% 13% 8% 7% 8% 4% 4% 4% 3% 3% 4% 5% 4% 4% Households by Household Income (2020 Projection) Less than $25,000 2,054 22,473 48,867 $25,000 to $49,999 3,179 31,686 69,882 $50,000 to $74,999 2,087 24,616 55,483 $75,000 to $99,999 1,473 13,109 33,160 $100,000 to $124, ,642 19,628 $125,000 to $149, ,121 10,120 $150,000 to $199, ,525 9,364 $200,000 or more 477 4,152 9,577 Total Households 10, , ,081 Average Household Income $70, $65, $68, Median Household Income $58, $58, $61, Less than $25,000 $25,000 to $49,999 $50,000 to $74,999 $75,000 to $99,999 $100,000 to $124,999 $125,000 to $149,999 $150,000 to $199,999 $200,000 or more 19% 20% 19% 29% 28% 27% 19% 22% 22% 14% 12% 13% 8% 7% 8% 4% 4% 4% 3% 3% 4% 4% 4% 4% Per Capita Income 2015 Estimate $24, $24, $26, Unemployment Rate 2015 Estimate 9.73% 9.59% 10.04% Page 13 Copyright Catylist. All Rights Reserved. The information presented herein is provided as is, without warranty of any kind. Neither the administrators of this site nor Catylist assume any liability for errors or omissions.
18 Population Age 16+ By Employment Status (2015 Estimate) Labor Force 14, , ,637 Civilian, Employed 13, , ,935 Civilian, Unemployed 1,025 9,954 23,702 Not in Labor Force 9,519 93, ,545 Total Population Age , , ,182 Labor Force Civilian, Employed Civilian, Unemployed Not in Labor Force 60% 60% 59% 55% 55% 54% 4% 4% 4% 40% 40% 41% Employed Civilian Population Age 16+ by Industry (2015 Estimate) Agriculture, forestry, fishing and hunting, mining and 1,160 12,259 25,260 construction Manufacturing 285 3,705 8,767 Wholesale & retail trade 2,090 19,937 42,038 Transportation and warehousing, and 500 5,651 13,791 utilities Information 318 3,259 5,909 Finance, insurance, real estate and 646 4,650 12,268 rental and leasing Professional, scientific, and 1,524 15,023 35,642 technical services Educational, health and social services 2,203 18,538 43,345 Arts, entertainment, recreation, accommodation and 3,574 39,828 90,087 food services Other services (except public 1,143 10,780 24,453 administration) Public Administration 385 3,822 9,750 Total Employed Civilian Population Age , , ,310 Agriculture, forestry, fishing and hunting, mining and construction Manufacturing Wholesale & retail trade Transportation and warehousing, and utilities Information Finance, insurance, real estate and rental and leasing Professional, scientific, and technical services Educational, health and social services Arts, entertainment, recreation, accommodation and food services Other services (except public administration) Public Administration 8% 9% 8% 2% 3% 3% 15% 15% 14% 4% 4% 4% 2% 2% 2% 5% 3% 4% 11% 11% 11% 16% 13% 14% 26% 29% 29% 8% 8% 8% 3% 3% 3% Housing Units by Tenure (2015 Estimate) Vacant Housing Units 1,562 15,888 53,237 Occupied Housing Units 9,551 97, ,384 Owner- Occupied 5,371 49, ,015 Renter- Occupied 4,180 48, ,369 Total Housing Units 11, , ,621 Vacant Housing Units Occupied Housing Units Owner- Occupied Renter- Occupied 14% 14% 19% 86% 86% 81% 48% 44% 44% 38% 42% 38% Page 14 Copyright Catylist. All Rights Reserved. The information presented herein is provided as is, without warranty of any kind. Neither the administrators of this site nor Catylist assume any liability for errors or omissions.
7401 W Charleston Blvd, Las Vegas, NV 89117
 Cool $1,000,000.00 Discount Off Sale Price 7401 W Charleston Blvd, Las Vegas, NV 89117 Listing ID: 30193298 Status: Active Property Type: Office For Sale Office Type: Business Park, Executive Suites Size:
1320 S Casino Center Blvd, Las Vegas, NV 89104
 Professional or Attorney Office Arts District Casino Center 1320 S Casino Center Blvd, Las Vegas, NV 89104 Listing ID: 30030990 Status: Active Property Type: Office For Sale Office Type: Business Park,
2365 Reynolds Ave, North Las Vegas, NV 89030
 10% Down $77 psf 7,072' Medical Office Elevator & Gray Shell 2365 Reynolds Ave, North Las Vegas, NV 89030 Listing ID: 29944110 Status: Active Property Type: Office For Sale Office Type: Business Park,
2965 S Jones Blvd, Las Vegas, NV 89146
 10% Down Data Center Office Call Center Fiber Optic Cubicles 2965 S Jones Blvd, Las Vegas, NV 89146 Listing ID: 30029430 Status: Active Property Type: Office For Sale Office Type: Business Park, Governmental
1208 S Eastern Ave, Las Vegas, NV 89104
 Office Medical Veterinarin Signage Frontage Visibility 89104 1208 S Eastern Ave, Las Vegas, NV 89104 Listing ID: 30138546 Status: Active Property Type: Office For Lease Office Type: Governmental, High-Tech
2415 Reynolds Ave, North Las Vegas, NV 89030
 7,221' *Reynolds Medical Center* Gray Shell w/ Elevator 89030 2415 Reynolds Ave, North Las Vegas, NV 89030 Listing ID: 29944098 Status: Active Property Type: Office For Sale (also listed as Special Purpose)
2465 Reynolds Ave, North Las Vegas, NV 89030
 12,020' Reynolds Medical & Attorney Build-Out Elevator 89030 2465 Reynolds Ave, North Las Vegas, NV 89030 Listing ID: 29944111 Status: Active Property Type: Office For Sale (also listed as Special Purpose)
5419 S Decatur Blvd, Las Vegas, NV 89118
 10% Down, Call Center, Office, Showroom, Warehouse, Auto, Flex 5419 S Decatur Blvd, Las Vegas, NV 89118 Listing ID: 29978727 Status: Active Property Type: Industrial For Sale Industrial Type: Flex Space,
5419 S Decatur Blvd, Las Vegas, NV 89118
 Call Center, Office, Showroom, Warehouse, Auto, Flex 5419 S Decatur Blvd, Las Vegas, NV 89118 Listing ID: 29978730 Status: Active Property Type: Office For Lease Office Type: Business Park, Governmental
5715 W. Alexander #150, Las Vegas, NV 89130
 10% Down Office Condo 49c PSF Payments 5715 W. Alexander #150, Las Vegas, NV 89130 Listing ID: 30279469 Status: Active Property Type: Office For Sale Office Type: Business Park, Executive Suites Size:
5715 W. Alexander #150, Las Vegas, NV 89130
 Brand New Everything! NW Professional Office Condo 5715 W. Alexander #150, Las Vegas, NV 89130 Listing ID: 30279487 Status: Active Property Type: Office For Lease Office Type: Business Park, Executive
4575 Bay Rd, Saginaw, MI 48603
 Georges 4575 Bay Rd, Saginaw, MI 48603 Listing ID: 30340682 Status: Active Property Type: Business Opportunity For Sale Industry: Professional Services Size: 6,600 SF Sale Price: $852,000 Sale Terms: Cash
3424 East Road, Saginaw, MI 48601
 R & W Investment 3424 East Road, Saginaw, MI 48601 Listing ID: 30298825 Status: Active Property Type: Industrial For Sale Industrial Type: Flex Space, Free-Standing Size: 7,564 SF Sale Price: $230,000
1112 Carroll Creek Rd, Johnson City, TN 37601
 Deanwood Apartments for Sale 1112 Carroll Creek Rd, Johnson City, TN 37601 Listing ID: 30363543 Status: Active Property Type: Multi-Family For Sale Multi-Family Type: Low-Rise/Garden Size: 23,432 SF Sale
Benchmark Avenue, Fort Myers, FL 33905
 Available October 2017 Benchmark Industrial For Lease 1681-1687 Benchmark Avenue, Fort Myers, FL 33905 Listing ID: 30132311 Status: Active Property Type: Industrial For Lease Industrial Type: Flex Space,
11701 Orpington St, Orlando, FL 32817
 Professional Space for Lease 11701 Orpington St, Orlando, FL 32817 Listing ID: 30295554 Status: Active Property Type: Office For Lease Office Type: Business Park, Governmental Contiguous Space: 1,250 SF
2908 E Oakland Ave, Johnson City, TN 37601
 Office/retail Lease 2908 E Oakland Ave, Johnson City, TN 37601 Listing ID: 30369980 Status: Active Property Type: Office For Lease Office Type: Executive Suites, Governmental Contiguous Space: 2,800-7,800
 12519 S Cleveland Ave Details Prepared on Prepared By Josh Burdine 239-362-3173 josh@rockstar-realestate.com Page 1 14,000 sq feet building on 41 in Fort Myers 12519 S Cleveland Ave, Fort Myers, FL 33907
3280 E Tropicana Ave, Las Vegas, NV 89121
 65c Rent NNN Various Size Retail Shop Office Store Medical 3280 E Tropicana Ave, Las Vegas, NV 89121 Listing ID: 29848683 Status: Active Property Type: Retail-Commercial For Lease (also listed as Office,
Contact: Larry Hausman (502) Outer Loop, Louisville, KY Knobview Shopping Center
 Outer Loop, Louisville, KY Knobview Shopping Center") 5603-5637 Outer Loop, Louisville, KY 40219 Knobview Shopping Center Jefferson Mall Academy Sports Center SUBJECT Knobview Shopping Center offers a diverse mix of local and national tenants. The center
5603-5637 Outer Loop, Louisville, KY 40219 Knobview Shopping Center Jefferson Mall Academy Sports Center SUBJECT Knobview Shopping Center offers a diverse mix of local and national tenants. The center
46 Acres - Fronting Interstate 81 & Hopewell Rd. Prime Location - Zoned Industrial Potential for 2 Building Complexes
 46 Acre Land Opportunity - I-81 Frontage Design Concept: 2 Potential Building Parcels Prepared on 46 Acres - Fronting Interstate 81 & Hopewell Rd. Prime Location - Zoned Industrial Potential for 2 Building
14114 Palm Beach Blvd, Fort Myers, FL 33905
 Palm Beach Boulevard Land 14114 Palm Beach Blvd, Fort Myers, FL 33905 Listing ID: 30318883 Status: Active Property Type: Vacant Land For Sale Possible Uses: Office, Retail Gross Land Area: 18,000 SF Sale
E. Flamingo Rd, Las Vegas, NV 89121
 School Restaurant Retail Office Convenience 89c to $1.25 3620 3650 3654 E. Flamingo Rd, Las Vegas, NV 89121 Listing ID: 30284747 Status: Active Property Type: Retail-Commercial For Lease Retail-Commercial
E. Flamingo Rd, Las Vegas, NV 89121
 Restaurant Supper Club Retail Office Convenience 89c to $1.25 3620 3650 3654 E. Flamingo Rd, Las Vegas, NV 89121 Listing ID: 30214834 Status: Active Property Type: Retail-Commercial For Lease Retail-Commercial
5200 Ocean Blvd, Siesta Key, FL 34242
 Siesta Key Restaurant- BEST LOCATION IN THE VILLAGE! 5200 Ocean Blvd, Siesta Key, FL 34242 Listing ID: 29826583 Status: Active Property Type: Business Opportunity For Sale Industry: Food and Beverage Size:
SOUTH DAKOTA KIDS COUNT BEACOM SCHOOL OF BUSINESS UNIVERSITY OF SOUTH DAKOTA 414 E. CLARK STREET VERMILLION, SD
 Brookings County Compared to o SDSD Undergrad Enrollment approximately 11,225 o USD Undergrad Enrollment approximately 7,600 o Brookings County 1 year population estimate for 2013 is 32,968 o 1 year population
Mid - City Industrial
 Minneapolis neighborhood profile October 2011 Mid - City Industrial About this area The Mid-City Industrial neighborhood is bordered by I- 35W, Highway 280, East Hennepin Avenue, and Winter Street Northeast.
SELECTED ECONOMIC CHARACTERISTICS American Community Survey 5-Year Estimates
 DP03 SELECTED ECONOMIC CHARACTERISTICS 2008-2012 American Community Survey 5-Year Estimates Supporting documentation on code lists, subject definitions, data accuracy, and statistical testing can be found
American Community Survey 5-Year Estimates
 DP03 SELECTED ECONOMIC CHARACTERISTICS 2013-2017 American Community Survey 5-Year Estimates Supporting documentation on code lists, subject definitions, data accuracy, and statistical testing can be found
Tell us what you think. Provide feedback to help make American Community Survey data more useful for you.
 DP03 SELECTED ECONOMIC CHARACTERISTICS 2016 American Community Survey 1-Year Estimates Supporting documentation on code lists, subject definitions, data accuracy, and statistical testing can be found on
American Community Survey 5-Year Estimates
 DP03 SELECTED ECONOMIC CHARACTERISTICS 2012-2016 American Community Survey 5-Year Estimates Supporting documentation on code lists, subject definitions, data accuracy, and statistical testing can be found
American Community Survey 5-Year Estimates
 DP03 SELECTED ECONOMIC CHARACTERISTICS 2012-2016 American Community Survey 5-Year Estimates Supporting documentation on code lists, subject definitions, data accuracy, and statistical testing can be found
American Community Survey 5-Year Estimates
 DP03 SELECTED ECONOMIC CHARACTERISTICS 2012-2016 American Community Survey 5-Year Estimates Supporting documentation on code lists, subject definitions, data accuracy, and statistical testing can be found
American Community Survey 5-Year Estimates
 DP03 SELECTED ECONOMIC CHARACTERISTICS 2012-2016 American Community Survey 5-Year Estimates Supporting documentation on code lists, subject definitions, data accuracy, and statistical testing can be found
American Community Survey 5-Year Estimates
 DP03 SELECTED ECONOMIC CHARACTERISTICS 2012-2016 American Community Survey 5-Year Estimates Supporting documentation on code lists, subject definitions, data accuracy, and statistical testing can be found
American Community Survey 5-Year Estimates
 DP03 SELECTED ECONOMIC CHARACTERISTICS 2012-2016 American Community Survey 5-Year Estimates Supporting documentation on code lists, subject definitions, data accuracy, and statistical testing can be found
American Community Survey 5-Year Estimates
 DP03 SELECTED ECONOMIC CHARACTERISTICS 2012-2016 American Community Survey 5-Year Estimates Supporting documentation on code lists, subject definitions, data accuracy, and statistical testing can be found
American Community Survey 5-Year Estimates
 DP03 SELECTED ECONOMIC CHARACTERISTICS 2012-2016 American Community Survey 5-Year Estimates Supporting documentation on code lists, subject definitions, data accuracy, and statistical testing can be found
American Community Survey 5-Year Estimates
 DP03 SELECTED ECONOMIC CHARACTERISTICS 2012-2016 American Community Survey 5-Year Estimates Supporting documentation on code lists, subject definitions, data accuracy, and statistical testing can be found
American Community Survey 5-Year Estimates
 DP03 SELECTED ECONOMIC CHARACTERISTICS 2012-2016 American Community Survey 5-Year Estimates Supporting documentation on code lists, subject definitions, data accuracy, and statistical testing can be found
American Community Survey 5-Year Estimates
 DP03 SELECTED ECONOMIC CHARACTERISTICS 2012-2016 American Community Survey 5-Year Estimates Supporting documentation on code lists, subject definitions, data accuracy, and statistical testing can be found
American Community Survey 5-Year Estimates
 DP03 SELECTED ECONOMIC CHARACTERISTICS 2012-2016 American Community Survey 5-Year Estimates Supporting documentation on code lists, subject definitions, data accuracy, and statistical testing can be found
American Community Survey 5-Year Estimates
 DP03 SELECTED ECONOMIC CHARACTERISTICS 2012-2016 American Community Survey 5-Year Estimates Supporting documentation on code lists, subject definitions, data accuracy, and statistical testing can be found
American Community Survey 5-Year Estimates
 DP03 SELECTED ECONOMIC CHARACTERISTICS 2012-2016 American Community Survey 5-Year Estimates Supporting documentation on code lists, subject definitions, data accuracy, and statistical testing can be found
American Community Survey 5-Year Estimates
 DP03 SELECTED ECONOMIC CHARACTERISTICS 2012-2016 American Community Survey 5-Year Estimates Supporting documentation on code lists, subject definitions, data accuracy, and statistical testing can be found
American Community Survey 5-Year Estimates
 DP03 SELECTED ECONOMIC CHARACTERISTICS 2012-2016 American Community Survey 5-Year Estimates Supporting documentation on code lists, subject definitions, data accuracy, and statistical testing can be found
American Community Survey 5-Year Estimates
 DP03 SELECTED ECONOMIC CHARACTERISTICS 2012-2016 American Community Survey 5-Year Estimates Supporting documentation on code lists, subject definitions, data accuracy, and statistical testing can be found
American Community Survey 5-Year Estimates
 DP03 SELECTED ECONOMIC CHARACTERISTICS 2012-2016 American Community Survey 5-Year Estimates Supporting documentation on code lists, subject definitions, data accuracy, and statistical testing can be found
American Community Survey 5-Year Estimates
 DP03 SELECTED ECONOMIC CHARACTERISTICS 2012-2016 American Community Survey 5-Year Estimates Supporting documentation on code lists, subject definitions, data accuracy, and statistical testing can be found
American Community Survey 5-Year Estimates
 DP03 SELECTED ECONOMIC CHARACTERISTICS 2012-2016 American Community Survey 5-Year Estimates Supporting documentation on code lists, subject definitions, data accuracy, and statistical testing can be found
American Community Survey 5-Year Estimates
 DP03 SELECTED ECONOMIC CHARACTERISTICS 2012-2016 American Community Survey 5-Year Estimates Supporting documentation on code lists, subject definitions, data accuracy, and statistical testing can be found
American Community Survey 5-Year Estimates
 DP03 SELECTED ECONOMIC CHARACTERISTICS 2012-2016 American Community Survey 5-Year Estimates Supporting documentation on code lists, subject definitions, data accuracy, and statistical testing can be found
American Community Survey 5-Year Estimates
 DP03 SELECTED ECONOMIC CHARACTERISTICS 2012-2016 American Community Survey 5-Year Estimates Supporting documentation on code lists, subject definitions, data accuracy, and statistical testing can be found
American Community Survey 5-Year Estimates
 DP03 SELECTED ECONOMIC CHARACTERISTICS 2012-2016 American Community Survey 5-Year Estimates Supporting documentation on code lists, subject definitions, data accuracy, and statistical testing can be found
American Community Survey 5-Year Estimates
 DP03 SELECTED ECONOMIC CHARACTERISTICS 2012-2016 American Community Survey 5-Year Estimates Supporting documentation on code lists, subject definitions, data accuracy, and statistical testing can be found
American Community Survey 5-Year Estimates
 DP03 SELECTED ECONOMIC CHARACTERISTICS 2012-2016 American Community Survey 5-Year Estimates Supporting documentation on code lists, subject definitions, data accuracy, and statistical testing can be found
University of Minnesota
 neighborhood profile October 2011 About this area The University neighborhood is bordered by 11th Avenue Southeast, University Avenue, 15th Avenue Southeast, the railroad tracks, Oak Street, and the Mississippi
Camden Industrial. Minneapolis neighborhood profile. About this area. Trends in the area. Neighborhood in Minneapolis.
 Minneapolis neighborhood profile October 2011 Camden Industrial About this area The Camden Industrial neighborhood is bordered by 48th Avenue North, the Mississippi River, Dowling Avenue North, Washington
Shingle Creek. Minneapolis neighborhood profile. About this area. Trends in the area. Neighborhood in Minneapolis. October 2011
 neighborhood profile October 2011 About this area The neighborhood is bordered by 53rd Avenue North, Humboldt Avenue North, 49th Avenue North, and Xerxes Avenue North. It is home to Olson Middle School.
Town Profiles: Demographic, Economic, and Housing Statistics for De Smet City and Wall Town, SOuth Dakota
 South Dakota State University Open PRAIRIE: Open Public Research Access Institutional Repository and Information Exchange Census Data Center News Releases SDSU Census Data Center 12-7-2017 Town Profiles:
Average persons in household. Top three industries Post-secondary education (25 64 years) 7.1% Unemployment rate
 7.1% Unemployment rate") Demographic snapshot The Town of Oakville City of Burl ington City of Mis sissauga Town of Milton Population 198,042 Median age Average persons in household 41 2.8 years old $149,945 Average household
Demographic snapshot The Town of Oakville City of Burl ington City of Mis sissauga Town of Milton Population 198,042 Median age Average persons in household 41 2.8 years old $149,945 Average household
TABLE 1. PROFILE OF GENERAL DEMOGRAPHIC CHARACTERISTICS
 Waterloo city, Iowa TABLE 1. PROFILE OF GENERAL DEMOGRAPHIC CHARACTERISTICS Estimate Lower Bound Upper Bound Total population 66,659 64,093 69,225 SEX AND AGE Male 32,096 30,415 33,777 Female 34,563 33,025
LAND FOR SALE Blair Road, Mint Hill, NC PROPERTY OVERVIEW. Large parcel with I-485 access via Blair Road exit in the path of. growth.
 LAND FOR SALE 10395 Blair Road, Mint Hill, NC 28227 OFFERING SUMMARY SALE PRICE: $1,000,000 PROPERTY OVERVIEW Large parcel with I485 access via Blair Road exit in the path of growth. LOT SIZE: 9.28 Acres
Procter Properties P.O. Box 3484 Greensboro, NC
 Procter Properties P.O. Box 3484 Greensboro, NC 27402 3208 West Gate City Boulevard 3208 W Gate City Blv Greensboro, NC 27407 Property Type Retail Building Size 11,747 SF Owner (Legal) Property Subtype
Daniel Jung CRENSHAW BLVD CRENSHAW BLVD INGLEWOOD CA, CA Priming Capital 6 Centerpointe Dr La Palma, CA
 11225 CRENSHAW BLVD 11225 CRENSHAW BLVD INGLEWOOD CA, CA 90303 Property Type Retail Building Size Owner (Legal) Property Subtype Auto Dealer Office SF Owner (True) Zoning Industrial SF County Los Angeles
Economic Overview City of Tyler, TX. January 8, 2018
 Economic Overview City of Tyler, TX January 8, 2018 DEMOGRAPHIC PROFILE...3 EMPLOYMENT TRENDS...5 WAGE TRENDS...5 COST OF LIVING INDEX...6 INDUSTRY SNAPSHOT...7 OCCUPATION SNAPSHOT...9 INDUSTRY CLUSTERS...
Economic Overview York County, South Carolina. February 14, 2018
 Economic Overview York County, February 14, 2018 DEMOGRAPHIC PROFILE... 3 EMPLOYMENT TRENDS... 5 UNEMPLOYMENT RATE... 5 WAGE TRENDS... 6 COST OF LIVING INDEX... 6 INDUSTRY SNAPSHOT... 7 OCCUPATION SNAPSHOT...
W Republic Rd, Springfield, MO 65807
 Republic Plaza, All Available Suites 2141-2155 W Republic Rd, Springfield, MO 65807 Listing ID: 29778068 Status: Active Property Type: Shopping Center For Lease (also listed as Retail-Commercial, Office)
ECONOMIC OVERVIEW DuPage County, Illinois
 ECONOMIC OVERVIEW DuPage County, Illinois DEMOGRAPHIC PROFILE... 3 EMPLOYMENT TRENDS... 5 UNEMPLOYMENT RATE... 5 WAGE TRENDS... 6 COST OF LIVING INDEX... 7 INDUSTRY SNAPSHOT... 8 OCCUPATION SNAPSHOT...
Economic Overview. Lawrence, KS MSA
 Economic Overview Lawrence, KS MSA March 5, 2019 DEMOGRAPHIC PROFILE... 3 EMPLOYMENT TRENDS... 5 UNEMPLOYMENT RATE... 5 WAGE TRENDS... 6 COST OF LIVING INDEX... 7 INDUSTRY SNAPSHOT... 8 OCCUPATION SNAPSHOT...
City of Edmonton Population Change by Age,
 Population Change by Age, 1996-2001 2001 Edmonton Demographic Profile The City of Edmonton s 2001population increased by 49,800 since the 1996 census. Migration figures are not available at the municipal
FOR SALE UARE E SQ TH The Square
 THE SQUARE FOR SALE SITE PLAN TENAYA WAY POST ROAD The SQUARE, is a newly constructed, office condo development in the desirable Southwest Las Vegas submarket. The project is uniquely designed with modern
Economic Overview Monterey County, California. July 22, 2016
 Economic Overview Monterey July 22, 2016 DEMOGRAPHIC PROFILE... 3 EMPLOYMENT TRENDS... 5 UNEMPLOYMENT RATE... 5 WAGE TRENDS... 6 COST OF LIVING INDEX... 6 INDUSTRY SNAPSHOT... 7 OCCUPATION SNAPSHOT...
EVEREST. Retail Investment Opportunity. Ivy Hills Retail Center 7397 Main Street Newtown, OH CONTACT: Chris Nachtrab.
 Retail Investment Opportunity CONTACT: Chris Nachtrab chris.nachtrab@everestrealestate.com 513/769-2509 John Thompson john.thompson@everestrealestate.com 513/769-2514 Ivy Hills Retail Center 7397 Main
For Lease. Free-standing Retail / Office Building 1304 Saratoga Avenue San Jose, CA
 For Lease Free-standing Retail / Office Building 1304 Saratoga Avenue San Jose, CA 95117 Description Approximately 4,500 sf plus mezzanine Outstanding identity and visibility In neighborhood shopping center
Economic Overview Loudoun County, Virginia. October 23, 2017
 Economic Overview October 23, 2017 DEMOGRAPHIC PROFILE... 3 EMPLOYMENT TRENDS... 5 UNEMPLOYMENT RATE... 5 WAGE TRENDS... 6 COST OF LIVING INDEX... 6 INDUSTRY SNAPSHOT... 7 OCCUPATION SNAPSHOT... 9 INDUSTRY
DEMOGRAPHIC PROFILE...3 EMPLOYMENT TRENDS...5 UNEMPLOYMENT RATE...5 WAGE TRENDS...6 COST OF LIVING INDEX...6 INDUSTRY SNAPSHOT...7
 March 14, 2017 DEMOGRAPHIC PROFILE...3 EMPLOYMENT TRENDS...5 UNEMPLOYMENT RATE...5 WAGE TRENDS...6 COST OF LIVING INDEX...6 INDUSTRY SNAPSHOT...7 OCCUPATION SNAPSHOT...9 INDUSTRY CLUSTERS... 12 EDUCATION
Economic Overview Long Island
 Report created on August 29, 2017 Economic Overview Long Island Contact: Lisa.Montiel@suny.edu DEMOGRAPHIC PROFILE... 3 EMPLOYMENT TRENDS... 5 UNEMPLOYMENT RATE... 5 WAGE TRENDS... 6 COST OF LIVING INDEX...
Monte Vista Population, ,744 4,651 4,564 4,467 4,458 4,432 4,451
 1 Monte Vista 4,8 4,7 4,6 4,5 4,4 4,3 4,2 4,1 4,61 4,612 4,61 4,676 Monte Vista, 2-213 4,744 4,651 4,564 4,467 4,458 4,432 4,451 4,418 4,412 4,355 2 21 22 23 24 25 26 27 28 29 21 211 212 213 Year Monte
Economic Overview Western New York
 Report created on August 29, 2017 Economic Overview Western New Contact: Lisa.Montiel@suny.edu DEMOGRAPHIC PROFILE... 3 EMPLOYMENT TRENDS... 5 UNEMPLOYMENT RATE... 5 WAGE TRENDS... 6 COST OF LIVING INDEX...
October 28, Economic Overview Yellowstone County, Montana
 October 28, 2016 Economic Overview Yellowstone DEMOGRAPHIC PROFILE...3 EMPLOYMENT TRENDS...5 UNEMPLOYMENT RATE...5 WAGE TRENDS...6 COST OF LIVING INDEX...6 INDUSTRY SNAPSHOT...7 OCCUPATION SNAPSHOT...9
Economic Overview Fairfax / Falls Church. October 23, 2017
 Economic Overview Fairfax / Falls Church October 23, 2017 DEMOGRAPHIC PROFILE... 3 EMPLOYMENT TRENDS... 5 UNEMPLOYMENT RATE... 5 WAGE TRENDS... 6 COST OF LIVING INDEX... 6 INDUSTRY SNAPSHOT... 7 OCCUPATION
Economic Overview 45-Minute Commute From Airport Park. June 6, 2017
 Economic Overview 45-Minute Commute From Airport Park June 6, 2017 DEMOGRAPHIC PROFILE... 3 EMPLOYMENT TRENDS... 5 WAGE TRENDS... 5 COST OF LIVING INDEX... 6 INDUSTRY SNAPSHOT... 7 OCCUPATION SNAPSHOT...
Economic Overview Prince William/Manassas. October 23, 2017
 Economic Overview Prince William/Manassas October 23, 2017 DEMOGRAPHIC PROFILE... 3 EMPLOYMENT TRENDS... 5 UNEMPLOYMENT RATE... 5 WAGE TRENDS... 6 COST OF LIVING INDEX... 6 INDUSTRY SNAPSHOT... 7 OCCUPATION
ACS DEMOGRAPHIC AND HOUSING ESTIMATES American Community Survey 1-Year Estimates
 DP05 ACS DEMOGRAPHIC AND HOUSING ESTIMATES 2012 American Community Survey 1-Year Estimates Supporting documentation on code lists, subject definitions, data accuracy, and statistical testing can be found
Economic Overview Capital District
 August 29, 2017 Economic Overview Capital District Contact: Lisa.Montiel@suny.edu DEMOGRAPHIC PROFILE... 3 EMPLOYMENT TRENDS... 5 UNEMPLOYMENT RATE... 5 WAGE TRENDS... 6 COST OF LIVING INDEX... 6 INDUSTRY
$1,600,000. Boston Reid LAKESIDE BUSINESS PARK. 117 Crosslake Park Drive Mooresville, NC SITE FEATURES. Lead 2 Real Estate Group
 LAKESIDE BUSINESS PARK 117 Crosslake Park Drive Mooresville, NC 28117 $1,600,000 Marketed By SITE FEATURES 17,000 + SF Industrial Building on 2.6 Acres Located in Lakeside Business Park High Power for
Economic Overview Mohawk Valley
 Report created on August 29, 2017 Economic Overview Mohawk Valley Contact: Lisa.Montiel@suny.edu DEMOGRAPHIC PROFILE... 3 EMPLOYMENT TRENDS... 5 UNEMPLOYMENT RATE... 5 WAGE TRENDS... 6 COST OF LIVING INDEX...
ACS DEMOGRAPHIC AND HOUSING ESTIMATES American Community Survey 1-Year Estimates
 DP05 ACS DEMOGRAPHIC AND HOUSING ESTIMATES 2010 American Community Survey 1-Year s Supporting documentation on code lists, subject definitions, data accuracy, and statistical testing can be found on the
Woodlands County Economic Indicators 2015
 Woodlands County Economic Indicators 215 Message from the Mayor In my time as Mayor, I have witnessed several recessions, and it certainly says a lot about our community. In 28, while businesses around
Economic Overview Plant City Region. April 5, 2017
 Economic Overview Plant City Region April 5, 2017 DEMOGRAPHIC PROFILE... 3 EMPLOYMENT TRENDS... 5 WAGE TRENDS... 5 COST OF LIVING INDEX... 6 INDUSTRY SNAPSHOT... 7 OCCUPATION SNAPSHOT... 9 INDUSTRY CLUSTERS...
Economic Overview New York
 Report created on October 20, 2015 Economic Overview Created using: Contact: Lisa.Montiel@suny.edu DEMOGRAPHIC PROFILE...3 EMPLOYMENT TRENDS...5 UNEMPLOYMENT RATE...5 WAGE TRENDS...6 COST OF LIVING INDEX...6
Economic Overview Long Island
 Report created on October 20, 2015 Economic Overview Long Island Created using: Contact: Lisa.Montiel@suny.edu DEMOGRAPHIC PROFILE...3 EMPLOYMENT TRENDS...5 UNEMPLOYMENT RATE...5 WAGE TRENDS...6 COST OF
OWNER USER / SBA FINANCING: Office Building For Sale. PROPERTY HIGHLIGHTS: Currently 90% Occupied, but in 2016 the whole top floor.
 OWNER USER / SBA FINANCING: Office Building For Sale Investment Lake Sahara Plaza at 8685 West Sahara Avenue is an 11,858 +/ SF Office building located in the prestigious Lakes subdivision on the edge
PROPOSED SHOPPING CENTER
 PROPOSED SHOPPING CENTER Southeast Corner I-95 & Highway 192 Melbourne, Florida In a 5 Mile Radius 80,862 Population 32,408 Households $61K Avg HH Income SOONER INVESTMENT Commercial & Investment Real
Tell us what you think. Provide feedback to help make American Community Survey data more useful for you.
 DP05 ACS DEMOGRAPHIC AND HOUSING ESTIMATES 2016 American Community Survey 1-Year Estimates Supporting documentation on code lists, subject definitions, data accuracy, and statistical testing can be found
IAG Commercial. Albertville Retail - Land. For Sale. Prepared By:
 Albertville Retail - Land For Sale Albertville Retail - Land 6600 Laketowne Place Albertville, MN 55301 Prepared By: IAG Commercial 222 South Ninth Street, Suite 1600 Minneapolis, MN 55402 Jeff LaFavre,
The Economic Base of San Miguel County, NM. PREPARED BY: The Office of Policy Analysis at Arrowhead Center, New Mexico State University
 The Economic Base of San Miguel County, NM PREPARED BY: The Office of Policy Analysis at Arrowhead Center, New Mexico State University DATE: July 2015 The Economic Base of San Miguel County, New Mexico
SDs from Regional Peer Group Mean. SDs from Size Peer Group Mean
 Family: Population Demographics Population Entire MSA 2414616 Central Cities (CC) 764431 Outside Central Cities 1650185 Percent of Entire MSA 31.66% Population in CC Percent Change in Population from 1999
June 9, Economic Overview Billings, MT MSA
 June 9, 2016 Economic Overview Billings, MT MSA DEMOGRAPHIC PROFILE... 3 EMPLOYMENT TRENDS... 5 UNEMPLOYMENT RATE... 5 WAGE TRENDS... 6 COST OF LIVING INDEX... 6 INDUSTRY SNAPSHOT... 7 OCCUPATION SNAPSHOT...