5715 W. Alexander #150, Las Vegas, NV 89130
|
|
|
- Dominick Lindsey
- 5 years ago
- Views:
Transcription

 square foot professional office condo for lease or purchase * Three or four private")
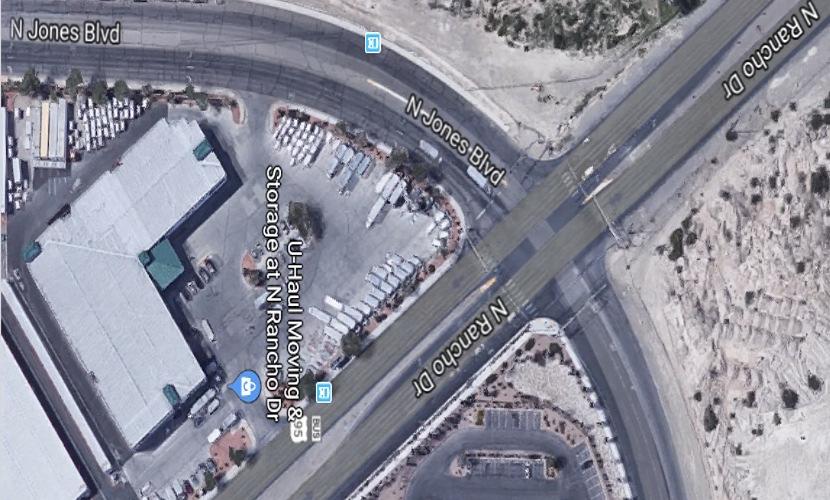
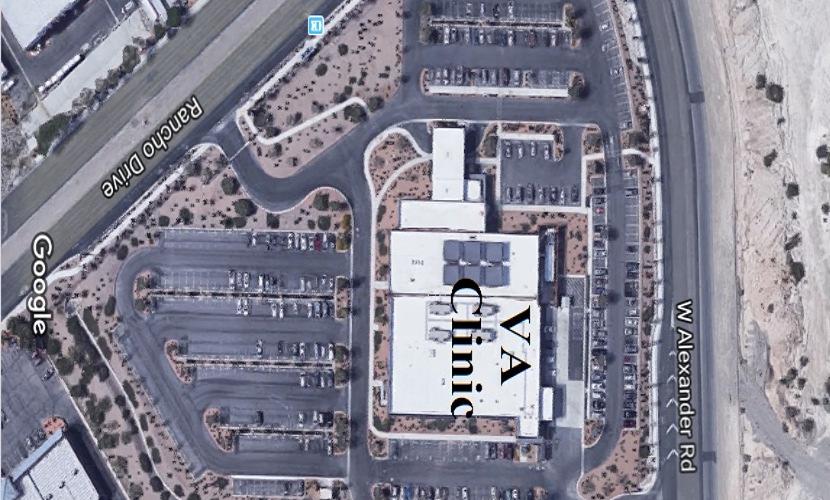
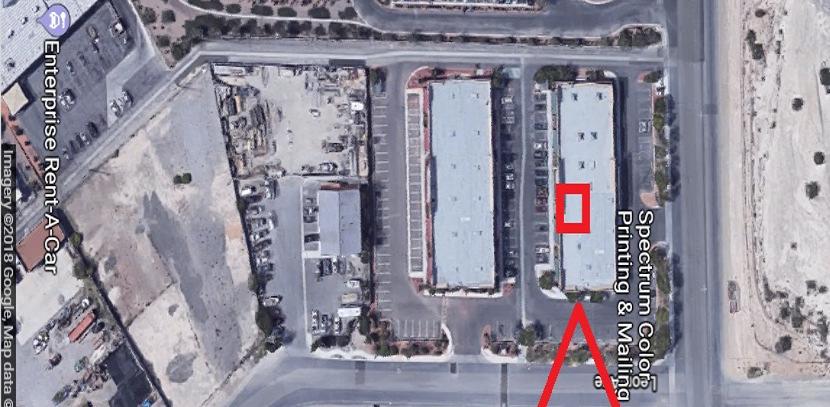
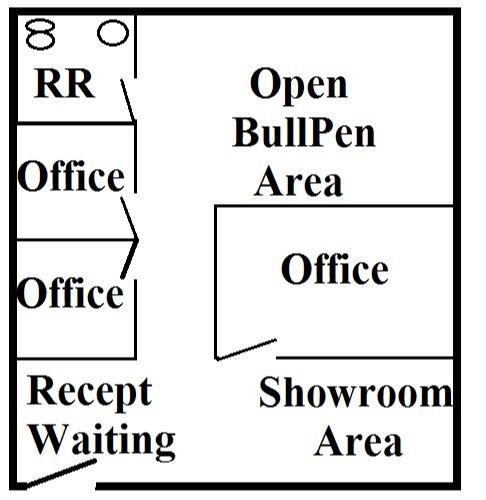
1 Brand New Everything! NW Professional Office Condo 5715 W. Alexander #150, Las Vegas, NV Listing ID: Status: Active Property Type: Office For Lease Office Type: Business Park, Executive Suites Contiguous Space: 1,199 SF Total Available: 1,199 SF Lease Rate: $1.10 PSF (Monthly) Unit Price: $13.20 PSF (Annual) Base Monthly Rent: $1,318 Lease Type: NNN Ceiling: 9 ft. Overview/Comments * Brand New Everything! N.W. Professional Office Condo * 5715 W Alexander #150 LV NV 89130, APN * 1,199' rentable (1,121' usable) square foot professional office condo for lease or purchase * Three or four private offices, and/or large open area bullpen for cubicles or workstations. * Receptionist, waiting area, display showroom area, one private restroom. * High-end brand-new professional office build-out, new paint, new HVAC * Pick your own brand-new flooring carpet or tile. * Active business complex with lots of foot traffic and synergy. * Could be medical office since we are next door to the VA Clinic * City of Las Vegas zoned O "Professional Office" * Clark County Land Use Offices, Professional and Business Services * HOA maintains the trash, water, landscaping, sprinklers, roof, parking lot. * Close N. Jones, N. Rancho, and W. Alexander by the VA Clinic. * Perfect for CPA, attorney, chiropractor, call center, insurance, mortgage, contractor, MD doctor, psychologist, psychiatrist, collection agency, * OR Purchase this office condo using only 10% down with an SBA loan and fixed 5.3% interest for 10. Payments only 49c per square foot per month. * If this listing is not perfect for you, please call as we have over 40 other listings around the valley to choose from. * Owner / Broker/ Developer More Information Online QR Code Scan this image with your mobile device: General Information Taxing Authority: City of Las Vegas Tax ID/APN: Page 1
2 Office Type: Zoning: Business Park, Executive Suites, Governmental, High-Tech, Institutional, Medical, Mixed Use, Net Leased, Office Building CITY OF LAS VEGAS ZONED O PROFESSIONAL OFFICE Building Name: Class of Space: Gross Building Area: Building/Unit Size (RSF): Usable Size (USF): Brand New Everything! NW Professional Office Condo Class B 1,199 SF 1,199 SF 1,121 SF Available Space Suite/Unit Number: 150 Suite Floor/Level: 1 Space Available: 1,199 SF Minimum Divisible: 1,199 SF Maximum Contiguous: 1,199 SF Space Subcategory 1: Office Building Space Subcategory 2: Business Park Space Type: New Date Available: 06/01/2018 Lease Term (Months): 60 Months Lease Rate: $1.10 PSF (Monthly) Lease Type: NNN Conference Rooms: 1 Offices: 4 Operating Expenses: $4.20 PSF (Annual) Rent Escalators: Step-Up Lease Space Description * Brand New Everything! N.W. Professional Office Condo * 5715 W Alexander #150 LV NV 89130, APN * 1,199' rentable (1,121' usable) square foot professional office condo for lease or purchase * Three or four private offices, and/or large open area bullpen for cubicles or workstations. * Receptionist, waiting area, display showroom area, one private restroom. * High-end brand-new professional office build-out, new paint, new HVAC * Pick your own brandnew flooring carpet or tile. * Active business complex with lots of foot traffic and synergy. * Could be medical office since we are next door to the VA Clinic * City of Las Vegas zoned O "Professional Office" * Clark County Land Use Offices, Professional and Business Services * HOA maintains the trash, water, landscaping, sprinklers, roof, parking lot. * Close N. Jones, N. Rancho, and W. Alexander by the VA Clinic. * Perfect for CPA, attorney, chiropractor, call center, insurance, mortgage, contractor, MD doctor, psychologist, psychiatrist, collection agency, * OR Purchase this office condo using only 10% down with an SBA loan and fixed 5.3% interest for 10. Payments only 49c per square foot per month. * If this listing is not perfect for you, please call as we have over 40 other listings around the valley to choose from. * Owner / Broker/ Developer Area & Location Property Located Between: Property Visibility: N. Jones, N. Rancho and W. Alexander Good Highway Access: 95 Airports: North Las Vegas Building Related Total Number of Buildings: 1 Number of Stories: 1 Typical SF / Floor: 1,199 SF Year Built: 2007 Year Renovated: 2018 Ceiling Height: 9 Loading Doors: 0 Loading Docks: 0 Passenger Elevators: 0 Freight Elevators: 0 Land Related Zoning Description: Water Service: Sewer Type: City of Las Vegas zoned O professional office Clark County Land Use Offices, Professional and Business Services Municipal Municipal Location Address: 5715 W. Alexander #150, Las Vegas, NV County: Clark MSA: Submarket: Las Vegas-Henderson-Paradise Northwest Page 2


3 SBA 504 Loan Scenario NW Professional Office Condo Scenario as of: 5/22/2018 Own the Business? Own the Building. Purchase Price $149, W. Alexander #150, Las Vegas, NV Improvements $0 Building Size 1,199 sf Other $0 Total Project Costs $149,999 Price per Sq. Ft. $125 psf For Property Information: Michael Hawkes Great Bridge Properties % SBA 504 Financing Example Financing Package Amount Rate Term Amort Monthly Pymt Bank 1st Mortgage 50% $ 75, % 10 Yrs 25 Yrs $ 461 SBA 504 2nd Mortgage* 40% $ 64, % 25 Yrs 25 Yrs $ 384 Down Payment 10% $ 15,000 *Includes financed SBA fee of $4, % $0.70 PSF $ 845 Monthly Costs Adjusted Monthly Costs PSF Monthly PSF Monthly Mortgage Payments $0.70 $845 Total Monthly Payment $0.70 $845 Less Depreciation ($0.21) -$256 Total Monthly Payment $0.70 PSF $845 Total Adjusted Monthly Pa $0.49 PSF $588 Out of Pocket Expenses Cash Down Payment 10.0% $15,000 Estimated Bank Fees 1.5% $1,125 Estimated Appraisal & Environmental $500 Invest in Your Future: Equity Over First 10 Years $80,000 $60,000 $40,000 $20,000 EQUITY $ Assumptions: The following assumptions were made in the preparation of this sample. Please let us know if there are specific values you'd like to see. Bank rate, terms and fees are estimated and vary depending on lender. Operating costs, title and insurance are estimates. SBA rate is as of May '18. Actual rate is set at debenture sale. Depreciation is estimated at an 80% bracket over 39. SBA Fee is estimated at 2.15% plus a $2,500 legal fee. Fees are financed. 90% LTV financing generally does not require additional collateral. For more information contact your 504 loan experts: Chris Hunter TMC Financing SVP, Business Development Officer chris@tmcfinancing.com
4
5


6 Property Images Clean Front Google Earth Floor Plan Page 3

![Properties 702-642-4235 [M]](/docs-images/86/93808202/images/7-1.jpg "702-642-4235 [O]")
7 _ Property Contacts 702Michael Hawkes Great Bridge Properties [M] [O] Page 4
 to be reliable, we have not checked its accuracy and make no guarantee as to its validity.")
8 Demographics, Labor/Workforce, and Consumer Expenditures 5715 W. Alexander #150, Las Vegas, NV Disclaimer: While we believe this information (via GeoLytics) to be reliable, we have not checked its accuracy and make no guarantee as to its validity. By using the information provided on this page, the user acknowledges that the data may contain errors or other nonconformities. You and/or your client should diligently and independently verify the specifics of the information that you are using. Population 2020 Projection 18, , , Estimate 16, , , Census 15, , ,648 Growth % 13.69% 12.28% Growth % 11.75% 12.55% Population (Male) 2020 Projection 8, , , Estimate 7, , , Census 7,801 95, ,838 Growth % 13.54% 11.72% Growth % 11.81% 13.42% Page 5
9 Population (Female) 2020 Projection 9, , , Estimate 8, , , Census 7,872 97, ,810 Growth % 13.84% 12.84% Growth % 11.69% 11.68% Population by Age (2015 Estimate) Age 0 to 5 1,177 17,068 42,342 Age 5 to 10 1,197 17,814 45,071 Age 10 to 15 1,078 16,236 41,928 Age 15 to 20 1,049 15,171 39,258 Age 20 to 25 1,071 14,618 37,087 Age 25 to 30 1,049 13,776 33,919 Age 30 to ,980 31,472 Age 35 to ,081 31,748 Age 40 to ,778 33,936 Age 45 to 50 1,093 14,590 36,209 Age 50 to 55 1,130 14,086 35,376 Age 55 to 60 1,107 12,908 33,048 Age 60 to 65 1,024 11,153 29,224 Age 65 and over 2,798 28,621 81,599 Total Population 16, , ,217 Median Age Age 0 to 5 Age 5 to 10 Age 10 to 15 Age 15 to 20 Age 20 to 25 Age 25 to 30 Age 30 to 35 Age 35 to 40 Age 40 to 45 Age 45 to 50 Age 50 to 55 Age 55 to 60 Age 60 to 65 Age 65 and over 7% 8% 8% 7% 8% 8% 6% 8% 8% 6% 7% 7% 6% 7% 7% 6% 6% 6% 6% 6% 6% 5% 6% 6% 6% 6% 6% 7% 7% 7% 7% 7% 6% 7% 6% 6% 6% 5% 5% 17% 13% 15% Median Age (Male) 2010 Census Median Age (Female) 2010 Census High School Graduates Age 25+ by Educational Attainment (2015 Estimate) High School Graduate (or GED) 3,343 40,216 96,827 Some College, No Degree 3,711 40,038 95,389 Associate or Bachelor's Degree ,729 25,472 Master's Degree 637 6,848 15,222 Professional School Degree 164 2,229 6,876 Doctorate Degree ,567 Total High School Graduates Age 25+ 8, , ,353 High School Graduate (or GED) Some College, No Degree Associate or Bachelor's Degree Master's Degree Professional School Degree Doctorate Degree 38% 40% 40% 43% 40% 39% 9% 11% 10% 7% 7% 6% 2% 2% 3% 1% 1% 1% Page 6
10 Households 2020 Projection 6,748 86, , Estimate 6,041 76, , Census 5,693 68, ,805 Growth % 13.38% 11.57% Growth % 11.36% 11.6% Population in Households 2010 Census 15, , ,648 Average Household Size 2020 Projection Estimate Census Growth % -0.07% -0.01% Growth % 0.81% 0.94% Page 7
11 Households by Household Type and Size and Presence of Children (2015 Estimate) Family Households 4,289 53, ,720 Married-couple family 3,032 35,986 90,909 With own 1,090 15,877 41,500 No own 1,942 20,109 49,409 Male Householder: 423 5,606 13,457 no wife present With own 200 2,813 6,803 No own 223 2,793 6,654 Female Householder: no husband ,959 29,354 present With own 414 6,693 16,405 No own 420 5,266 12,949 Nonfamily Households 1,752 23,043 60,242 1 Person households 1,273 17,096 45, Unrelated people 479 5,947 15,145 Total Households 6,041 76, ,962 Family Households Married-couple family With own No own Male Householder: no wife present With own No own Female Householder: no husband present With own No own Nonfamily Households 1 Person households 2+ Unrelated people 71% 70% 69% 50% 47% 47% 18% 21% 21% 32% 26% 25% 7% 7% 7% 3% 4% 4% 4% 4% 3% 14% 16% 15% 7% 9% 8% 7% 7% 7% 29% 30% 31% 21% 22% 23% 8% 8% 8% Page 8
12 Households by Household Income (2015 Estimate) Less than $25,000 1,162 12,753 33,287 $25,000 to $49,999 1,157 18,934 46,958 $50,000 to $74,999 1,379 16,719 41,774 $75,000 to $99, ,796 28,941 $100,000 to $124, ,794 16,849 $125,000 to $149, ,851 10,400 $150,000 to $199, ,670 9,240 $200,000 or more 216 2,077 6,513 Total Households 6,041 76, ,962 Average Household Income $74, $71, $72, Median Household Income $63, $63, $65, Less than $25,000 $25,000 to $49,999 $50,000 to $74,999 $75,000 to $99,999 $100,000 to $124,999 $125,000 to $149,999 $150,000 to $199,999 $200,000 or more 19% 17% 17% 19% 25% 24% 23% 22% 22% 16% 15% 15% 7% 9% 9% 6% 5% 5% 6% 5% 5% 4% 3% 3% Households by Household Income (2020 Projection) Less than $25,000 1,314 14,657 37,587 $25,000 to $49,999 1,323 21,732 52,939 $50,000 to $74,999 1,525 18,961 46,682 $75,000 to $99,999 1,067 13,261 32,190 $100,000 to $124, ,608 18,520 $125,000 to $149, ,292 11,375 $150,000 to $199, ,068 10,068 $200,000 or more 236 2,262 7,042 Total Households 6,748 86, ,403 Average Household Income $76, $70, $72, Median Household Income $62, $63, $66, Less than $25,000 $25,000 to $49,999 $50,000 to $74,999 $75,000 to $99,999 $100,000 to $124,999 $125,000 to $149,999 $150,000 to $199,999 $200,000 or more 19% 17% 17% 20% 25% 24% 23% 22% 22% 16% 15% 15% 7% 9% 9% 6% 5% 5% 6% 5% 5% 3% 3% 3% Per Capita Income 2015 Estimate $26, $25, $25, Unemployment Rate 2015 Estimate 8.14% 10.45% 11.81% Page 9
13 Population Age 16+ By Employment Status (2015 Estimate) Labor Force 8, , ,147 Civilian, Employed 8, , ,513 Civilian, Unemployed 553 9,042 25,634 Not in Labor Force 6,316 75, ,634 Total Population Age , , ,781 Labor Force Civilian, Employed Civilian, Unemployed Not in Labor Force 58% 61% 60% 55% 56% 55% 4% 5% 5% 42% 39% 40% Employed Civilian Population Age 16+ by Industry (2015 Estimate) Agriculture, forestry, fishing and hunting, mining and ,016 26,506 construction Manufacturing 353 3,803 8,945 Wholesale & retail trade 1,276 15,405 40,263 Transportation and warehousing, and 652 5,656 12,740 utilities Information 134 2,058 5,688 Finance, insurance, real estate and 347 4,658 11,153 rental and leasing Professional, scientific, and ,857 32,642 technical services Educational, health and social services 1,415 18,606 48,420 Arts, entertainment, recreation, accommodation and 1,699 27,035 68,214 food services Other services (except public 626 8,093 21,758 administration) Public Administration 491 5,669 15,265 Total Employed Civilian Population Age 16+ 8, , ,594 Agriculture, forestry, fishing and hunting, mining and construction Manufacturing Wholesale & retail trade Transportation and warehousing, and utilities Information Finance, insurance, real estate and rental and leasing Professional, scientific, and technical services Educational, health and social services Arts, entertainment, recreation, accommodation and food services Other services (except public administration) Public Administration 9% 10% 9% 4% 3% 3% 15% 13% 14% 8% 5% 4% 2% 2% 2% 4% 4% 4% 9% 11% 11% 16% 16% 17% 20% 24% 23% 7% 7% 7% 6% 5% 5% Housing Units by Tenure (2015 Estimate) Vacant Housing Units ,671 32,434 Occupied Housing Units 6,041 76, ,962 Owner- Occupied 4,424 48, ,229 Renter- Occupied 1,617 28,376 72,733 Total Housing Units 6,798 87, ,396 Vacant Housing Units Occupied Housing Units Owner- Occupied Renter- Occupied 11% 12% 14% 89% 88% 86% 65% 55% 54% 24% 33% 32% Page 10
5715 W. Alexander #150, Las Vegas, NV 89130
 10% Down Office Condo 49c PSF Payments 5715 W. Alexander #150, Las Vegas, NV 89130 Listing ID: 30279469 Status: Active Property Type: Office For Sale Office Type: Business Park, Executive Suites Size:
5419 S Decatur Blvd, Las Vegas, NV 89118
 10% Down, Call Center, Office, Showroom, Warehouse, Auto, Flex 5419 S Decatur Blvd, Las Vegas, NV 89118 Listing ID: 29978727 Status: Active Property Type: Industrial For Sale Industrial Type: Flex Space,
2365 Reynolds Ave, North Las Vegas, NV 89030
 10% Down $77 psf 7,072' Medical Office Elevator & Gray Shell 2365 Reynolds Ave, North Las Vegas, NV 89030 Listing ID: 29944110 Status: Active Property Type: Office For Sale Office Type: Business Park,
1208 S Eastern Ave, Las Vegas, NV 89104
 Office Medical Veterinarin Signage Frontage Visibility 89104 1208 S Eastern Ave, Las Vegas, NV 89104 Listing ID: 30138546 Status: Active Property Type: Office For Lease Office Type: Governmental, High-Tech
2415 Reynolds Ave, North Las Vegas, NV 89030
 7,221' *Reynolds Medical Center* Gray Shell w/ Elevator 89030 2415 Reynolds Ave, North Las Vegas, NV 89030 Listing ID: 29944098 Status: Active Property Type: Office For Sale (also listed as Special Purpose)
2965 S Jones Blvd, Las Vegas, NV 89146
 10% Down Data Center Office Call Center Fiber Optic Cubicles 2965 S Jones Blvd, Las Vegas, NV 89146 Listing ID: 30029430 Status: Active Property Type: Office For Sale Office Type: Business Park, Governmental
2465 Reynolds Ave, North Las Vegas, NV 89030
 12,020' Reynolds Medical & Attorney Build-Out Elevator 89030 2465 Reynolds Ave, North Las Vegas, NV 89030 Listing ID: 29944111 Status: Active Property Type: Office For Sale (also listed as Special Purpose)
5419 S Decatur Blvd, Las Vegas, NV 89118
 Call Center, Office, Showroom, Warehouse, Auto, Flex 5419 S Decatur Blvd, Las Vegas, NV 89118 Listing ID: 29978730 Status: Active Property Type: Office For Lease Office Type: Business Park, Governmental
1320 S Casino Center Blvd, Las Vegas, NV 89104
 Professional or Attorney Office Arts District Casino Center 1320 S Casino Center Blvd, Las Vegas, NV 89104 Listing ID: 30030990 Status: Active Property Type: Office For Sale Office Type: Business Park,
Benchmark Avenue, Fort Myers, FL 33905
 Available October 2017 Benchmark Industrial For Lease 1681-1687 Benchmark Avenue, Fort Myers, FL 33905 Listing ID: 30132311 Status: Active Property Type: Industrial For Lease Industrial Type: Flex Space,
7401 W Charleston Blvd, Las Vegas, NV 89117
 Cool $1,000,000.00 Discount Off Sale Price 7401 W Charleston Blvd, Las Vegas, NV 89117 Listing ID: 30193298 Status: Active Property Type: Office For Sale Office Type: Business Park, Executive Suites Size:
7401 W Charleston Blvd, Las Vegas, NV 89117
 Cool $1.25 Million Discounted Las Vegas Company HQ Office 7401 W Charleston Blvd, Las Vegas, NV 89117 Listing ID: Status: Property Type: Office Type: Size: Sale Price: Unit Price: Sale Terms: Overview/Comments
3424 East Road, Saginaw, MI 48601
 R & W Investment 3424 East Road, Saginaw, MI 48601 Listing ID: 30298825 Status: Active Property Type: Industrial For Sale Industrial Type: Flex Space, Free-Standing Size: 7,564 SF Sale Price: $230,000
2908 E Oakland Ave, Johnson City, TN 37601
 Office/retail Lease 2908 E Oakland Ave, Johnson City, TN 37601 Listing ID: 30369980 Status: Active Property Type: Office For Lease Office Type: Executive Suites, Governmental Contiguous Space: 2,800-7,800
4575 Bay Rd, Saginaw, MI 48603
 Georges 4575 Bay Rd, Saginaw, MI 48603 Listing ID: 30340682 Status: Active Property Type: Business Opportunity For Sale Industry: Professional Services Size: 6,600 SF Sale Price: $852,000 Sale Terms: Cash
11701 Orpington St, Orlando, FL 32817
 Professional Space for Lease 11701 Orpington St, Orlando, FL 32817 Listing ID: 30295554 Status: Active Property Type: Office For Lease Office Type: Business Park, Governmental Contiguous Space: 1,250 SF
3280 E Tropicana Ave, Las Vegas, NV 89121
 65c Rent NNN Various Size Retail Shop Office Store Medical 3280 E Tropicana Ave, Las Vegas, NV 89121 Listing ID: 29848683 Status: Active Property Type: Retail-Commercial For Lease (also listed as Office,
1112 Carroll Creek Rd, Johnson City, TN 37601
 Deanwood Apartments for Sale 1112 Carroll Creek Rd, Johnson City, TN 37601 Listing ID: 30363543 Status: Active Property Type: Multi-Family For Sale Multi-Family Type: Low-Rise/Garden Size: 23,432 SF Sale
E. Flamingo Rd, Las Vegas, NV 89121
 School Restaurant Retail Office Convenience 89c to $1.25 3620 3650 3654 E. Flamingo Rd, Las Vegas, NV 89121 Listing ID: 30284747 Status: Active Property Type: Retail-Commercial For Lease Retail-Commercial
 12519 S Cleveland Ave Details Prepared on Prepared By Josh Burdine 239-362-3173 josh@rockstar-realestate.com Page 1 14,000 sq feet building on 41 in Fort Myers 12519 S Cleveland Ave, Fort Myers, FL 33907
E. Flamingo Rd, Las Vegas, NV 89121
 Restaurant Supper Club Retail Office Convenience 89c to $1.25 3620 3650 3654 E. Flamingo Rd, Las Vegas, NV 89121 Listing ID: 30214834 Status: Active Property Type: Retail-Commercial For Lease Retail-Commercial
14114 Palm Beach Blvd, Fort Myers, FL 33905
 Palm Beach Boulevard Land 14114 Palm Beach Blvd, Fort Myers, FL 33905 Listing ID: 30318883 Status: Active Property Type: Vacant Land For Sale Possible Uses: Office, Retail Gross Land Area: 18,000 SF Sale
46 Acres - Fronting Interstate 81 & Hopewell Rd. Prime Location - Zoned Industrial Potential for 2 Building Complexes
 46 Acre Land Opportunity - I-81 Frontage Design Concept: 2 Potential Building Parcels Prepared on 46 Acres - Fronting Interstate 81 & Hopewell Rd. Prime Location - Zoned Industrial Potential for 2 Building
Contact: Larry Hausman (502) Outer Loop, Louisville, KY Knobview Shopping Center
 Outer Loop, Louisville, KY Knobview Shopping Center") 5603-5637 Outer Loop, Louisville, KY 40219 Knobview Shopping Center Jefferson Mall Academy Sports Center SUBJECT Knobview Shopping Center offers a diverse mix of local and national tenants. The center
5603-5637 Outer Loop, Louisville, KY 40219 Knobview Shopping Center Jefferson Mall Academy Sports Center SUBJECT Knobview Shopping Center offers a diverse mix of local and national tenants. The center
5200 Ocean Blvd, Siesta Key, FL 34242
 Siesta Key Restaurant- BEST LOCATION IN THE VILLAGE! 5200 Ocean Blvd, Siesta Key, FL 34242 Listing ID: 29826583 Status: Active Property Type: Business Opportunity For Sale Industry: Food and Beverage Size:
SOUTH DAKOTA KIDS COUNT BEACOM SCHOOL OF BUSINESS UNIVERSITY OF SOUTH DAKOTA 414 E. CLARK STREET VERMILLION, SD
 Brookings County Compared to o SDSD Undergrad Enrollment approximately 11,225 o USD Undergrad Enrollment approximately 7,600 o Brookings County 1 year population estimate for 2013 is 32,968 o 1 year population
1540 S. Grand Avenue Santa Ana, CA 92705
 SALE PRICE: $1,250,000 Property Highlights 3 Stories, 4,668 SF Class C Office Flex Space Major Street Frontage and Signage Zoned M1 Fenced and Paved Yard Land:.17 AC (7,405 SF) Year Built: 1981 Great owner
Mid - City Industrial
 Minneapolis neighborhood profile October 2011 Mid - City Industrial About this area The Mid-City Industrial neighborhood is bordered by I- 35W, Highway 280, East Hennepin Avenue, and Winter Street Northeast.
University of Minnesota
 neighborhood profile October 2011 About this area The University neighborhood is bordered by 11th Avenue Southeast, University Avenue, 15th Avenue Southeast, the railroad tracks, Oak Street, and the Mississippi
SELECTED ECONOMIC CHARACTERISTICS American Community Survey 5-Year Estimates
 DP03 SELECTED ECONOMIC CHARACTERISTICS 2008-2012 American Community Survey 5-Year Estimates Supporting documentation on code lists, subject definitions, data accuracy, and statistical testing can be found
American Community Survey 5-Year Estimates
 DP03 SELECTED ECONOMIC CHARACTERISTICS 2013-2017 American Community Survey 5-Year Estimates Supporting documentation on code lists, subject definitions, data accuracy, and statistical testing can be found
Camden Industrial. Minneapolis neighborhood profile. About this area. Trends in the area. Neighborhood in Minneapolis.
 Minneapolis neighborhood profile October 2011 Camden Industrial About this area The Camden Industrial neighborhood is bordered by 48th Avenue North, the Mississippi River, Dowling Avenue North, Washington
Shingle Creek. Minneapolis neighborhood profile. About this area. Trends in the area. Neighborhood in Minneapolis. October 2011
 neighborhood profile October 2011 About this area The neighborhood is bordered by 53rd Avenue North, Humboldt Avenue North, 49th Avenue North, and Xerxes Avenue North. It is home to Olson Middle School.
Tell us what you think. Provide feedback to help make American Community Survey data more useful for you.
 DP03 SELECTED ECONOMIC CHARACTERISTICS 2016 American Community Survey 1-Year Estimates Supporting documentation on code lists, subject definitions, data accuracy, and statistical testing can be found on
Town Profiles: Demographic, Economic, and Housing Statistics for De Smet City and Wall Town, SOuth Dakota
 South Dakota State University Open PRAIRIE: Open Public Research Access Institutional Repository and Information Exchange Census Data Center News Releases SDSU Census Data Center 12-7-2017 Town Profiles:
For Sale: Office Condominium
 4302 Redwood Hwy., Ste. 100, San Rafael Owner/User Opportunity High Ceilings Freeway Frontage Excellent On-Site Parking Offering Summary Asking Price: $695,000 Price Per Sq. Ft.: $363 psf Building Sq.
American Community Survey 5-Year Estimates
 DP03 SELECTED ECONOMIC CHARACTERISTICS 2012-2016 American Community Survey 5-Year Estimates Supporting documentation on code lists, subject definitions, data accuracy, and statistical testing can be found
American Community Survey 5-Year Estimates
 DP03 SELECTED ECONOMIC CHARACTERISTICS 2012-2016 American Community Survey 5-Year Estimates Supporting documentation on code lists, subject definitions, data accuracy, and statistical testing can be found
American Community Survey 5-Year Estimates
 DP03 SELECTED ECONOMIC CHARACTERISTICS 2012-2016 American Community Survey 5-Year Estimates Supporting documentation on code lists, subject definitions, data accuracy, and statistical testing can be found
American Community Survey 5-Year Estimates
 DP03 SELECTED ECONOMIC CHARACTERISTICS 2012-2016 American Community Survey 5-Year Estimates Supporting documentation on code lists, subject definitions, data accuracy, and statistical testing can be found
American Community Survey 5-Year Estimates
 DP03 SELECTED ECONOMIC CHARACTERISTICS 2012-2016 American Community Survey 5-Year Estimates Supporting documentation on code lists, subject definitions, data accuracy, and statistical testing can be found
American Community Survey 5-Year Estimates
 DP03 SELECTED ECONOMIC CHARACTERISTICS 2012-2016 American Community Survey 5-Year Estimates Supporting documentation on code lists, subject definitions, data accuracy, and statistical testing can be found
American Community Survey 5-Year Estimates
 DP03 SELECTED ECONOMIC CHARACTERISTICS 2012-2016 American Community Survey 5-Year Estimates Supporting documentation on code lists, subject definitions, data accuracy, and statistical testing can be found
American Community Survey 5-Year Estimates
 DP03 SELECTED ECONOMIC CHARACTERISTICS 2012-2016 American Community Survey 5-Year Estimates Supporting documentation on code lists, subject definitions, data accuracy, and statistical testing can be found
American Community Survey 5-Year Estimates
 DP03 SELECTED ECONOMIC CHARACTERISTICS 2012-2016 American Community Survey 5-Year Estimates Supporting documentation on code lists, subject definitions, data accuracy, and statistical testing can be found
American Community Survey 5-Year Estimates
 DP03 SELECTED ECONOMIC CHARACTERISTICS 2012-2016 American Community Survey 5-Year Estimates Supporting documentation on code lists, subject definitions, data accuracy, and statistical testing can be found
American Community Survey 5-Year Estimates
 DP03 SELECTED ECONOMIC CHARACTERISTICS 2012-2016 American Community Survey 5-Year Estimates Supporting documentation on code lists, subject definitions, data accuracy, and statistical testing can be found
American Community Survey 5-Year Estimates
 DP03 SELECTED ECONOMIC CHARACTERISTICS 2012-2016 American Community Survey 5-Year Estimates Supporting documentation on code lists, subject definitions, data accuracy, and statistical testing can be found
American Community Survey 5-Year Estimates
 DP03 SELECTED ECONOMIC CHARACTERISTICS 2012-2016 American Community Survey 5-Year Estimates Supporting documentation on code lists, subject definitions, data accuracy, and statistical testing can be found
American Community Survey 5-Year Estimates
 DP03 SELECTED ECONOMIC CHARACTERISTICS 2012-2016 American Community Survey 5-Year Estimates Supporting documentation on code lists, subject definitions, data accuracy, and statistical testing can be found
American Community Survey 5-Year Estimates
 DP03 SELECTED ECONOMIC CHARACTERISTICS 2012-2016 American Community Survey 5-Year Estimates Supporting documentation on code lists, subject definitions, data accuracy, and statistical testing can be found
American Community Survey 5-Year Estimates
 DP03 SELECTED ECONOMIC CHARACTERISTICS 2012-2016 American Community Survey 5-Year Estimates Supporting documentation on code lists, subject definitions, data accuracy, and statistical testing can be found
American Community Survey 5-Year Estimates
 DP03 SELECTED ECONOMIC CHARACTERISTICS 2012-2016 American Community Survey 5-Year Estimates Supporting documentation on code lists, subject definitions, data accuracy, and statistical testing can be found
American Community Survey 5-Year Estimates
 DP03 SELECTED ECONOMIC CHARACTERISTICS 2012-2016 American Community Survey 5-Year Estimates Supporting documentation on code lists, subject definitions, data accuracy, and statistical testing can be found
American Community Survey 5-Year Estimates
 DP03 SELECTED ECONOMIC CHARACTERISTICS 2012-2016 American Community Survey 5-Year Estimates Supporting documentation on code lists, subject definitions, data accuracy, and statistical testing can be found
American Community Survey 5-Year Estimates
 DP03 SELECTED ECONOMIC CHARACTERISTICS 2012-2016 American Community Survey 5-Year Estimates Supporting documentation on code lists, subject definitions, data accuracy, and statistical testing can be found
American Community Survey 5-Year Estimates
 DP03 SELECTED ECONOMIC CHARACTERISTICS 2012-2016 American Community Survey 5-Year Estimates Supporting documentation on code lists, subject definitions, data accuracy, and statistical testing can be found
American Community Survey 5-Year Estimates
 DP03 SELECTED ECONOMIC CHARACTERISTICS 2012-2016 American Community Survey 5-Year Estimates Supporting documentation on code lists, subject definitions, data accuracy, and statistical testing can be found
American Community Survey 5-Year Estimates
 DP03 SELECTED ECONOMIC CHARACTERISTICS 2012-2016 American Community Survey 5-Year Estimates Supporting documentation on code lists, subject definitions, data accuracy, and statistical testing can be found
American Community Survey 5-Year Estimates
 DP03 SELECTED ECONOMIC CHARACTERISTICS 2012-2016 American Community Survey 5-Year Estimates Supporting documentation on code lists, subject definitions, data accuracy, and statistical testing can be found
American Community Survey 5-Year Estimates
 DP03 SELECTED ECONOMIC CHARACTERISTICS 2012-2016 American Community Survey 5-Year Estimates Supporting documentation on code lists, subject definitions, data accuracy, and statistical testing can be found
American Community Survey 5-Year Estimates
 DP03 SELECTED ECONOMIC CHARACTERISTICS 2012-2016 American Community Survey 5-Year Estimates Supporting documentation on code lists, subject definitions, data accuracy, and statistical testing can be found
CRESCENT PLACE CONDO FOR LEASE
 For More Information CRESCENT PLACE CONDO Retail Property $28.00 SF/yr (NNN) September 23, 2018 EXECUTIVE SUMMARY Executive Summary LEASE RATE $28.00 SF/YR OFFERING SUMMARY Available SF: 840 SF Lease Rate:
TABLE 1. PROFILE OF GENERAL DEMOGRAPHIC CHARACTERISTICS
 Waterloo city, Iowa TABLE 1. PROFILE OF GENERAL DEMOGRAPHIC CHARACTERISTICS Estimate Lower Bound Upper Bound Total population 66,659 64,093 69,225 SEX AND AGE Male 32,096 30,415 33,777 Female 34,563 33,025
Average persons in household. Top three industries Post-secondary education (25 64 years) 7.1% Unemployment rate
 7.1% Unemployment rate") Demographic snapshot The Town of Oakville City of Burl ington City of Mis sissauga Town of Milton Population 198,042 Median age Average persons in household 41 2.8 years old $149,945 Average household
Demographic snapshot The Town of Oakville City of Burl ington City of Mis sissauga Town of Milton Population 198,042 Median age Average persons in household 41 2.8 years old $149,945 Average household
W Republic Rd, Springfield, MO 65807
 Republic Plaza, All Available Suites 2141-2155 W Republic Rd, Springfield, MO 65807 Listing ID: 29778068 Status: Active Property Type: Shopping Center For Lease (also listed as Retail-Commercial, Office)
Daniel Jung CRENSHAW BLVD CRENSHAW BLVD INGLEWOOD CA, CA Priming Capital 6 Centerpointe Dr La Palma, CA
 11225 CRENSHAW BLVD 11225 CRENSHAW BLVD INGLEWOOD CA, CA 90303 Property Type Retail Building Size Owner (Legal) Property Subtype Auto Dealer Office SF Owner (True) Zoning Industrial SF County Los Angeles
Durango. Medical Building ±15,163 SF $3,639,000 UNIQUE OPPORTUNITY SINGLE-STORY MEDICAL BUILDING FOR SALE VIRTUAL TOUR
 FOR SALE 3012 S. Drive, Las Vegas, NV 89117 DO NOT DISTURB BUSINESS OPERATOR. CALL FOR DETAILS OR TO SCHEDULE A TOUR WITH BROKER. UNIQUE OPPORTUNITY SINGLE-STORY MEDICAL BUILDING ±15,163 SF $3,639,000
SEVEN HILLS MEDICAL & BUSINESS PARK
 PROPERTY HIGHLIGHTS: Turnkey medical and professional suites available Unit sizes range from ±1,808 - ±8,130 SF Lease rate: $1.29 - $1.50 SF/M NNN CAM s: $0.40 SF/M Zoning: C-O (Office Commercial) Parcel
Economic Overview City of Tyler, TX. January 8, 2018
 Economic Overview City of Tyler, TX January 8, 2018 DEMOGRAPHIC PROFILE...3 EMPLOYMENT TRENDS...5 WAGE TRENDS...5 COST OF LIVING INDEX...6 INDUSTRY SNAPSHOT...7 OCCUPATION SNAPSHOT...9 INDUSTRY CLUSTERS...
Monte Vista Population, ,744 4,651 4,564 4,467 4,458 4,432 4,451
 1 Monte Vista 4,8 4,7 4,6 4,5 4,4 4,3 4,2 4,1 4,61 4,612 4,61 4,676 Monte Vista, 2-213 4,744 4,651 4,564 4,467 4,458 4,432 4,451 4,418 4,412 4,355 2 21 22 23 24 25 26 27 28 29 21 211 212 213 Year Monte
Economic Overview York County, South Carolina. February 14, 2018
 Economic Overview York County, February 14, 2018 DEMOGRAPHIC PROFILE... 3 EMPLOYMENT TRENDS... 5 UNEMPLOYMENT RATE... 5 WAGE TRENDS... 6 COST OF LIVING INDEX... 6 INDUSTRY SNAPSHOT... 7 OCCUPATION SNAPSHOT...
3855 ATHERTON ROAD ROCKLIN EXCELLENT OWNER-USER OPPORTUNITY
 3855 ROCKLIN AVAILABLE FOR SALE OR LEASE EXCELLENT OWNER-USER OPPORTUNITY Rick Phillips, CCIM Principal Tel: (916) 677-8139 rphillips@tricommercial.com BRE Lic. #01061757 Brandon Sessions Vice President
City of Edmonton Population Change by Age,
 Population Change by Age, 1996-2001 2001 Edmonton Demographic Profile The City of Edmonton s 2001population increased by 49,800 since the 1996 census. Migration figures are not available at the municipal
$1,600,000. Boston Reid LAKESIDE BUSINESS PARK. 117 Crosslake Park Drive Mooresville, NC SITE FEATURES. Lead 2 Real Estate Group
 LAKESIDE BUSINESS PARK 117 Crosslake Park Drive Mooresville, NC 28117 $1,600,000 Marketed By SITE FEATURES 17,000 + SF Industrial Building on 2.6 Acres Located in Lakeside Business Park High Power for
Procter Properties P.O. Box 3484 Greensboro, NC
 Procter Properties P.O. Box 3484 Greensboro, NC 27402 3208 West Gate City Boulevard 3208 W Gate City Blv Greensboro, NC 27407 Property Type Retail Building Size 11,747 SF Owner (Legal) Property Subtype
ECONOMIC OVERVIEW DuPage County, Illinois
 ECONOMIC OVERVIEW DuPage County, Illinois DEMOGRAPHIC PROFILE... 3 EMPLOYMENT TRENDS... 5 UNEMPLOYMENT RATE... 5 WAGE TRENDS... 6 COST OF LIVING INDEX... 7 INDUSTRY SNAPSHOT... 8 OCCUPATION SNAPSHOT...
Economic Overview. Lawrence, KS MSA
 Economic Overview Lawrence, KS MSA March 5, 2019 DEMOGRAPHIC PROFILE... 3 EMPLOYMENT TRENDS... 5 UNEMPLOYMENT RATE... 5 WAGE TRENDS... 6 COST OF LIVING INDEX... 7 INDUSTRY SNAPSHOT... 8 OCCUPATION SNAPSHOT...
LAND FOR SALE Blair Road, Mint Hill, NC PROPERTY OVERVIEW. Large parcel with I-485 access via Blair Road exit in the path of. growth.
 LAND FOR SALE 10395 Blair Road, Mint Hill, NC 28227 OFFERING SUMMARY SALE PRICE: $1,000,000 PROPERTY OVERVIEW Large parcel with I485 access via Blair Road exit in the path of growth. LOT SIZE: 9.28 Acres
Economic Overview 45-Minute Commute From Airport Park. June 6, 2017
 Economic Overview 45-Minute Commute From Airport Park June 6, 2017 DEMOGRAPHIC PROFILE... 3 EMPLOYMENT TRENDS... 5 WAGE TRENDS... 5 COST OF LIVING INDEX... 6 INDUSTRY SNAPSHOT... 7 OCCUPATION SNAPSHOT...
CAMARILLO CORPORATE PLAZA
 CAMARILLO, CA CAMARILLO CORPORATE PLAZA CLASS A OFFICE CONDOMINIUMS UNIT SIZES: 952 RSF - 1,661 RSF POSSIBLE TO COMBINE UNITS FOR LARGER SPACES Subject to Structural Engineer Analysis 2151 ALESSANDRO DRIVE
Economic Overview Monterey County, California. July 22, 2016
 Economic Overview Monterey July 22, 2016 DEMOGRAPHIC PROFILE... 3 EMPLOYMENT TRENDS... 5 UNEMPLOYMENT RATE... 5 WAGE TRENDS... 6 COST OF LIVING INDEX... 6 INDUSTRY SNAPSHOT... 7 OCCUPATION SNAPSHOT...
Economic Overview Mohawk Valley
 Report created on August 29, 2017 Economic Overview Mohawk Valley Contact: Lisa.Montiel@suny.edu DEMOGRAPHIC PROFILE... 3 EMPLOYMENT TRENDS... 5 UNEMPLOYMENT RATE... 5 WAGE TRENDS... 6 COST OF LIVING INDEX...
Economic Overview Loudoun County, Virginia. October 23, 2017
 Economic Overview October 23, 2017 DEMOGRAPHIC PROFILE... 3 EMPLOYMENT TRENDS... 5 UNEMPLOYMENT RATE... 5 WAGE TRENDS... 6 COST OF LIVING INDEX... 6 INDUSTRY SNAPSHOT... 7 OCCUPATION SNAPSHOT... 9 INDUSTRY
ACS DEMOGRAPHIC AND HOUSING ESTIMATES American Community Survey 1-Year Estimates
 DP05 ACS DEMOGRAPHIC AND HOUSING ESTIMATES 2012 American Community Survey 1-Year Estimates Supporting documentation on code lists, subject definitions, data accuracy, and statistical testing can be found
DEMOGRAPHIC PROFILE...3 EMPLOYMENT TRENDS...5 UNEMPLOYMENT RATE...5 WAGE TRENDS...6 COST OF LIVING INDEX...6 INDUSTRY SNAPSHOT...7
 March 14, 2017 DEMOGRAPHIC PROFILE...3 EMPLOYMENT TRENDS...5 UNEMPLOYMENT RATE...5 WAGE TRENDS...6 COST OF LIVING INDEX...6 INDUSTRY SNAPSHOT...7 OCCUPATION SNAPSHOT...9 INDUSTRY CLUSTERS... 12 EDUCATION
Economic Overview Long Island
 Report created on August 29, 2017 Economic Overview Long Island Contact: Lisa.Montiel@suny.edu DEMOGRAPHIC PROFILE... 3 EMPLOYMENT TRENDS... 5 UNEMPLOYMENT RATE... 5 WAGE TRENDS... 6 COST OF LIVING INDEX...
Economic Overview Western New York
 Report created on August 29, 2017 Economic Overview Western New Contact: Lisa.Montiel@suny.edu DEMOGRAPHIC PROFILE... 3 EMPLOYMENT TRENDS... 5 UNEMPLOYMENT RATE... 5 WAGE TRENDS... 6 COST OF LIVING INDEX...
October 28, Economic Overview Yellowstone County, Montana
 October 28, 2016 Economic Overview Yellowstone DEMOGRAPHIC PROFILE...3 EMPLOYMENT TRENDS...5 UNEMPLOYMENT RATE...5 WAGE TRENDS...6 COST OF LIVING INDEX...6 INDUSTRY SNAPSHOT...7 OCCUPATION SNAPSHOT...9
ACS DEMOGRAPHIC AND HOUSING ESTIMATES American Community Survey 1-Year Estimates
 DP05 ACS DEMOGRAPHIC AND HOUSING ESTIMATES 2010 American Community Survey 1-Year s Supporting documentation on code lists, subject definitions, data accuracy, and statistical testing can be found on the
Economic Overview Fairfax / Falls Church. October 23, 2017
 Economic Overview Fairfax / Falls Church October 23, 2017 DEMOGRAPHIC PROFILE... 3 EMPLOYMENT TRENDS... 5 UNEMPLOYMENT RATE... 5 WAGE TRENDS... 6 COST OF LIVING INDEX... 6 INDUSTRY SNAPSHOT... 7 OCCUPATION
for lease CHICAGO GATEWAY 1825 & 1955 CHICAGO AVENUE RIVERSIDE, CA
 for lease CHICAGO GATEWAY 1825 & 1955 CHICAGO AVENUE RIVERSIDE, CA For information, please contact: THOMAS P. PIERIK, SIOR 951.276.3610 tpierik@lee-associates.com DRE Lic. #00982027 DAVID G. MUDGE, CCIM,
Economic Overview Prince William/Manassas. October 23, 2017
 Economic Overview Prince William/Manassas October 23, 2017 DEMOGRAPHIC PROFILE... 3 EMPLOYMENT TRENDS... 5 UNEMPLOYMENT RATE... 5 WAGE TRENDS... 6 COST OF LIVING INDEX... 6 INDUSTRY SNAPSHOT... 7 OCCUPATION
Economic Overview Capital District
 August 29, 2017 Economic Overview Capital District Contact: Lisa.Montiel@suny.edu DEMOGRAPHIC PROFILE... 3 EMPLOYMENT TRENDS... 5 UNEMPLOYMENT RATE... 5 WAGE TRENDS... 6 COST OF LIVING INDEX... 6 INDUSTRY
PROPOSED SHOPPING CENTER
 PROPOSED SHOPPING CENTER Southeast Corner I-95 & Highway 192 Melbourne, Florida In a 5 Mile Radius 80,862 Population 32,408 Households $61K Avg HH Income SOONER INVESTMENT Commercial & Investment Real
Woodlands County Economic Indicators 2015
 Woodlands County Economic Indicators 215 Message from the Mayor In my time as Mayor, I have witnessed several recessions, and it certainly says a lot about our community. In 28, while businesses around
The Economic Base of Sandoval County, NM. PREPARED BY: The Office of Policy Analysis at Arrowhead Center, New Mexico State University.
 The Economic Base of Sandoval County, NM PREPARED BY: The Office of Policy Analysis at Arrowhead Center, New Mexico State University DATE: July 2015 The Economic Base of Sandoval County, New Mexico Introduction
Jefferson County, Mississippi (MS)
") UPDATED 3/ Jefferson County, Mississippi (MS) Mississippi Development Bank, Special Obligation Bonds, (Jefferson County, Mississippi Regional Correctional Facility Refunding Bond Project), $2,845,000,
UPDATED 3/ Jefferson County, Mississippi (MS) Mississippi Development Bank, Special Obligation Bonds, (Jefferson County, Mississippi Regional Correctional Facility Refunding Bond Project), $2,845,000,
June 9, Economic Overview Billings, MT MSA
 June 9, 2016 Economic Overview Billings, MT MSA DEMOGRAPHIC PROFILE... 3 EMPLOYMENT TRENDS... 5 UNEMPLOYMENT RATE... 5 WAGE TRENDS... 6 COST OF LIVING INDEX... 6 INDUSTRY SNAPSHOT... 7 OCCUPATION SNAPSHOT...
The Economic Base of Sandoval County, NM. PREPARED BY: The Office of Policy Analysis at Arrowhead Center, New Mexico State University.
 The Economic Base of Sandoval County, NM PREPARED BY: The Office of Policy Analysis at Arrowhead Center, New Mexico State University DATE: July 2016 The Economic Base of Sandoval County, New Mexico Introduction