Contact: Larry Hausman (502) Outer Loop, Louisville, KY Knobview Shopping Center
|
|
|
- Ferdinand Payne
- 5 years ago
- Views:
Transcription


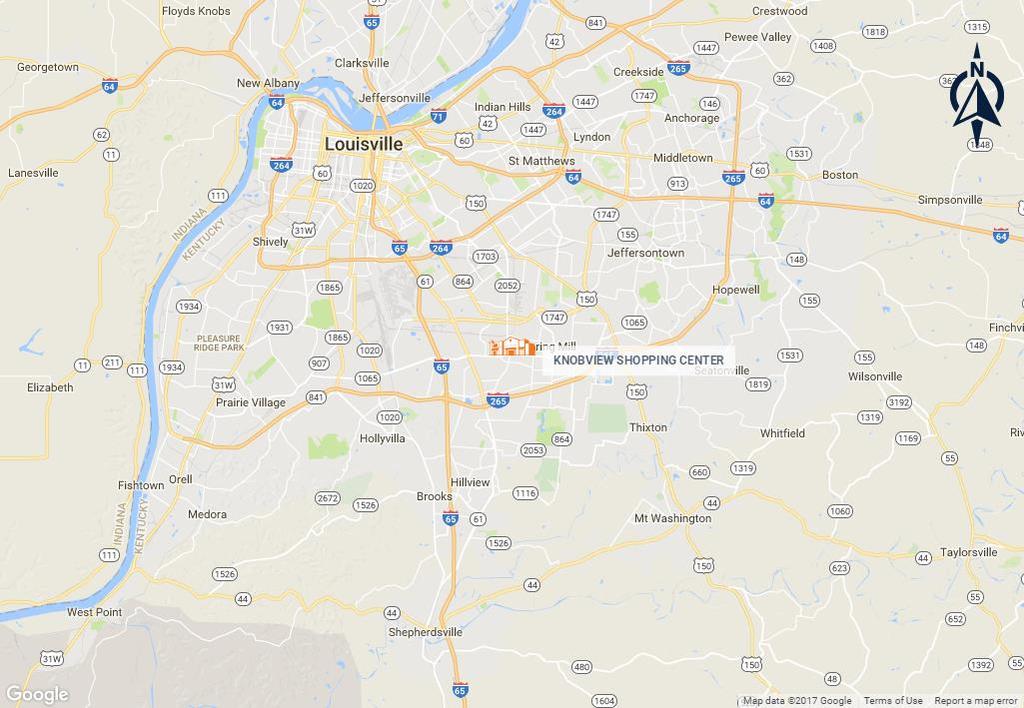
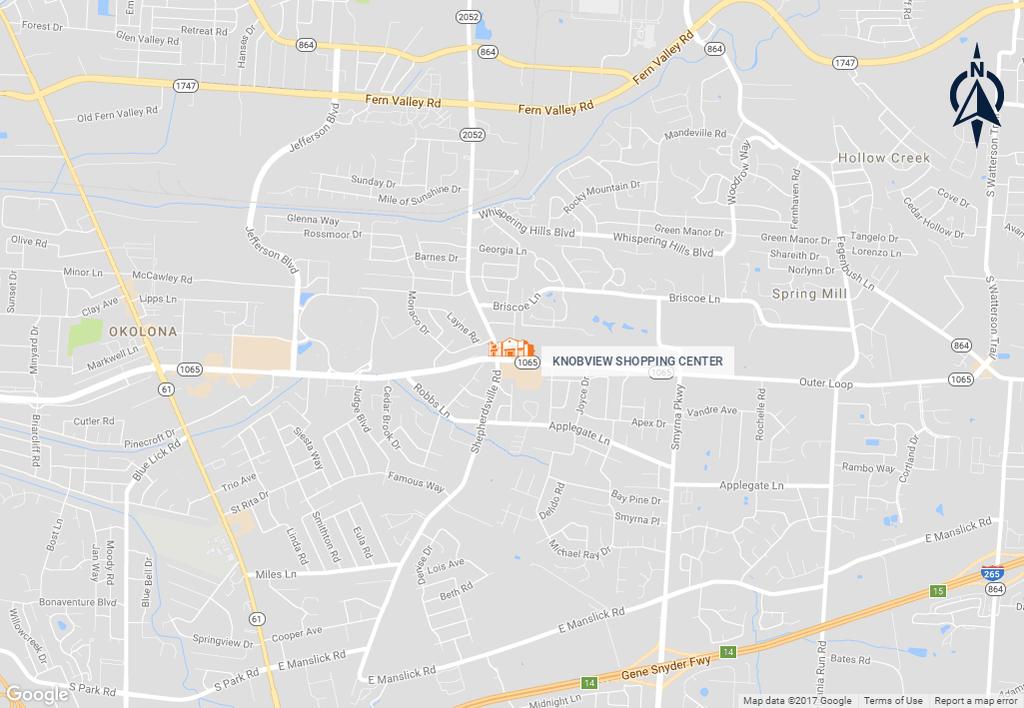
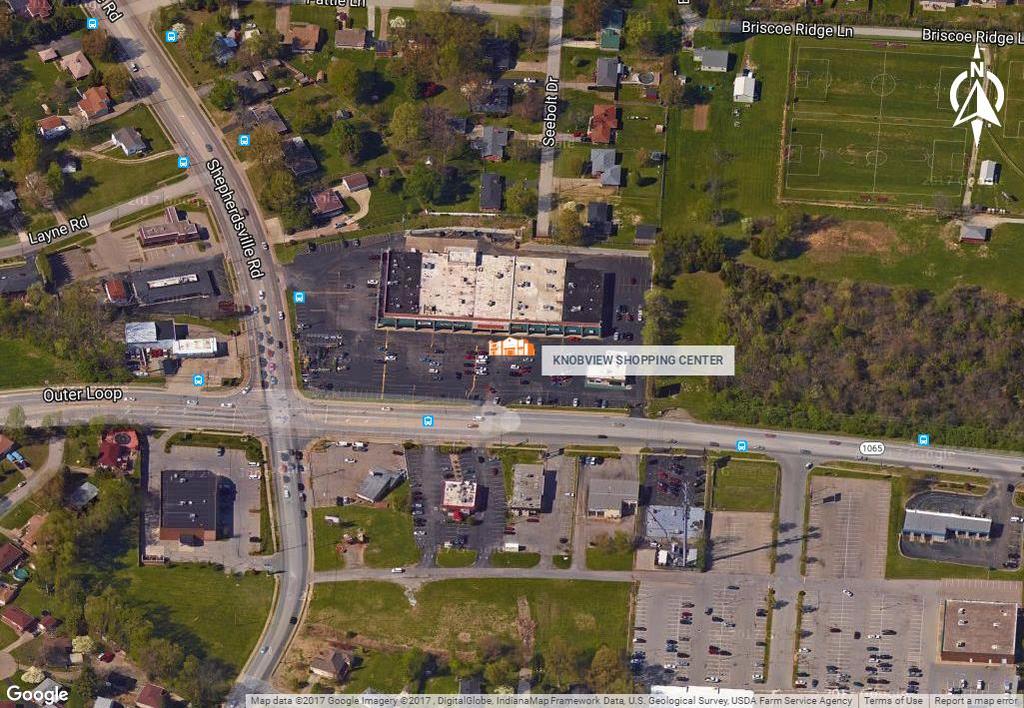
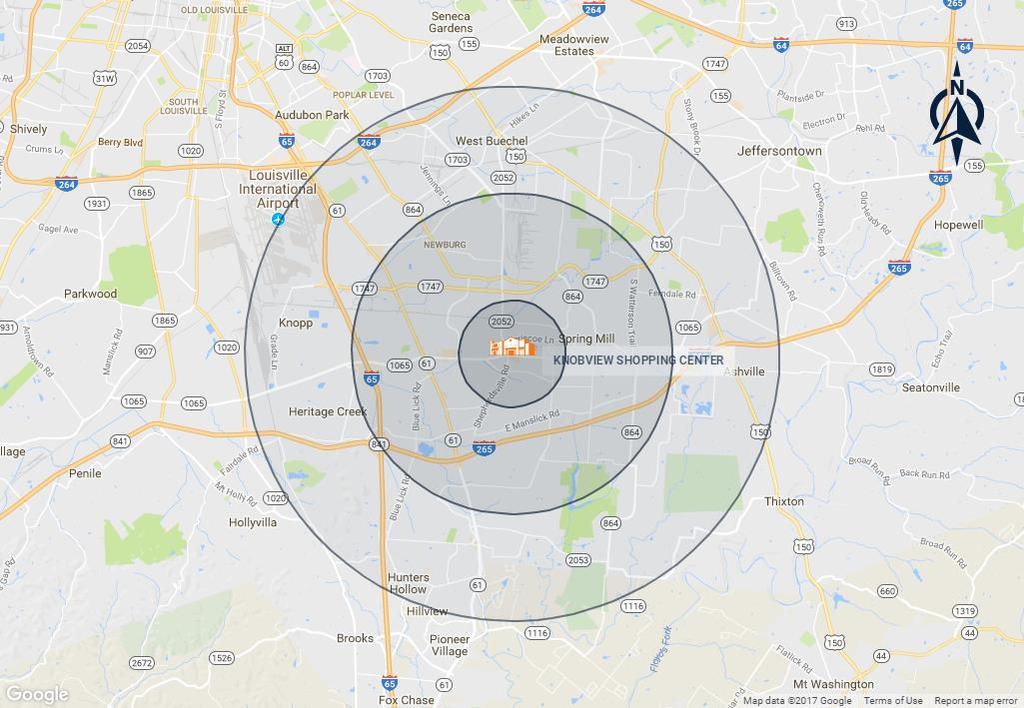
1 Outer Loop, Louisville, KY Knobview Shopping Center Jefferson Mall Academy Sports Center SUBJECT Knobview Shopping Center offers a diverse mix of local and national tenants. The center has excellent access and visibility at one of the busiest intersections in growing south central Louisville. This densely populated neighborhood is located two miles from General Electric, UPS and Ford which combined provide over 35,000 high paying blue and white collar jobs. 1 Mile Pop: 13,845 Income AHH: $56,419 3 Mile Pop: 98,640 Income AHH: $52,485 5 Mile Pop: 229,746 Income AHH: $56,966 Average Daily Traffic Count is 46,000 vehicles a day Knobview Shopping Center 265 Contact: Larry Hausman (502) Larry.hausman@marcusmillichap.com
 East China (1,400 SF) (8,400 SF) (7,925 SF) Approximately")
 Vacant (2,000 SF) 33 by 60 Potentially Available (up to 1,700 SF)")
2 Available (2,000 SF) Potential Drive Through Bluegrass Magic (5,400 SF) (2,800 SF) Latin Grocery (6,800 SF) East China (1,400 SF) (8,400 SF) (7,925 SF) Approximately 10,000 10,000 SF SF (10,500 SF) CHIKY s (1,480 SF) Latin Grocery (2,900 SF) Melton s Market (2,050 SF) Vacant (2,000 SF) 33 by 60 Potentially Available (up to 1,700 SF) 28 by 60
3 Major Tenants Tenant Name Family Dollar Goodwill Industries Senor Iguana s Mexican Restaurant Latin Grocery Advance Auto Parts East China Check Smart Major Employers Company # Employees UPS 22,080 Jefferson County Public Schools 14,739 Ford Motor Company 12,990 Humana, Inc 12,500 Norton Healthcare Inc 11,389 University of Louisville 6,375 Baptist Healthcare System 4,995 Amazon 6,000 Louisville-Jefferson County Metro Government 6,095 GE Appliances 6,000 Demographics 1-Mile 3-Mile 5-Mile 2015 Total Population 13,845 98, , Total Population 14, , , Total Households 5,674 38,896 93, Total Households 5,836 40,904 97,375 Median HH Income $54,966 $47,122 $49,746 Average HH Income $56,419 $52,485 $56,966
4 2,000 SF available End Cap
5 2,000 SF available End Cap
6 Potential Drive Through Space
7

8 Knobview Shopping Center LOUISVILLE, KY DEMOGRAPHIC ANALYSIS TRAFFIC COUNTS Traffic Count data 2012 by TrafficMetrix. All rights reserved. Two-way, average daily traffic volumes. * Traffic Count Estimate This information has been secured from sources we believe to be reliable, but we make no representations or warranties, expressed or implied, as to the accuracy of the information. References to square footage or age are approximate. Buyer must verify the information and bears all risk for any inaccuracies. Marcus & Millichap is a trademark of Marcus & Millichap Real Estate Investment Services, Inc Marcus & Millichap. All rights reserved. 35

9 4
10 5
11 6
![Prepared by Larry Hausman, Marcus & Millichap Nov 15, 2017 on KCREA 502-417-7784 [M] 502-664-0766 [O] larry.hausman@marcusmillichap.](/docs-images/84/89301966/images/12-0.jpg "com Real Estate License: 47731 Demographics, Labor/Workforce, and Consumer Expenditures 5603-5637 Outer Loop, Louisville, KY Disclaimer: While we believe this information (via GeoLytics) to be")
12 Prepared by Larry Hausman, Marcus & Millichap Nov 15, 2017 on KCREA [M] [O] Real Estate License: Demographics, Labor/Workforce, and Consumer Expenditures Outer Loop, Louisville, KY Disclaimer: While we believe this information (via GeoLytics) to be reliable, we have not checked its accuracy and make no guarantee as to its validity. By using the information provided on this page, the user acknowledges that the data may contain errors or other nonconformities. You and/or your client should diligently and independently verify the specifics of the information that you are using. Population 2020 Projection 14, , , Estimate 13,845 98, , Census 13,242 91, ,547 Growth % 5.26% 4.63% Growth % 7.64% 6.59% Population (Male) 2020 Projection 6,985 50, , Estimate 6,757 48, , Census 6,351 44, ,484 Growth % 5.44% 4.88% Growth % 8.8% 6.95% Population (Female) 2020 Projection 7,244 52, , Estimate 7,088 50, , Census 6,891 47, ,063 Growth % 5.08% 4.39% Growth % 6.56% 6.24% Page 1
13 Prepared by Larry Hausman, Marcus & Millichap Nov 15, 2017 on KCREA [M] [O] Real Estate License: Population by Age (2015 Estimate) Age 0 to ,169 15,608 Age 5 to ,725 16,890 Age 10 to ,179 15,763 Age 15 to ,831 15,143 Age 20 to ,630 14,768 Age 25 to ,283 14,243 Age 30 to ,923 13,814 Age 35 to ,877 13,988 Age 40 to ,043 14,619 Age 45 to ,328 15,506 Age 50 to ,271 15,446 Age 55 to ,025 14,826 Age 60 to ,441 13,272 Age 65 and over 2,665 14,915 35,860 Total Population 13,845 98, ,746 Median Age Age 0 to 5 Age 5 to 10 Age 10 to 15 Age 15 to 20 Age 20 to 25 Age 25 to 30 Age 30 to 35 Age 35 to 40 Age 40 to 45 Age 45 to 50 Age 50 to 55 Age 55 to 60 Age 60 to 65 Age 65 and over 6% 7% 7% 7% 8% 7% 6% 7% 7% 6% 7% 7% 6% 7% 6% 6% 6% 6% 6% 6% 6% 6% 6% 6% 6% 6% 6% 7% 6% 7% 6% 6% 7% 6% 6% 6% 6% 6% 6% 19% 15% 16% Median Age (Male) 2010 Census Median Age (Female) 2010 Census High School Graduates Age 25+ by Educational Attainment (2015 Estimate) High School Graduate (or GED) 3,637 22,475 50,235 Some College, No Degree 2,142 15,713 37,856 Associate or Bachelor's Degree 785 5,031 11,165 Master's Degree 362 2,099 7,199 Professional School Degree ,689 Doctorate Degree Total High School Graduates Age 25+ 7,060 45, ,905 High School Graduate (or GED) Some College, No Degree Associate or Bachelor's Degree Master's Degree Professional School Degree Doctorate Degree 52% 49% 46% 30% 34% 35% 11% 11% 10% 5% 5% 7% 1% 1% 2% 1% 0% 1% Households 2020 Projection 5,836 40,904 97, Estimate 5,674 38,896 93, Census 5,424 36,171 87,594 Growth % 5.16% 4.49% Growth % 7.53% 6.39% Page 2
14 2,000 SF available End Cap
15 2,000 SF available End Cap
16 Potential Drive Through Space
17 Major Tenants Tenant Name Family Dollar Goodwill Industries Senor Iguana s Mexican Restaurant Latin Grocery Advance Auto Parts East China Check Smart Major Employers Company # Employees UPS 22,080 Jefferson County Public Schools 14,739 Ford Motor Company 12,990 Humana, Inc 12,500 Norton Healthcare Inc 11,389 University of Louisville 6,375 Baptist Healthcare System 4,995 Amazon 6,000 Louisville-Jefferson County Metro Government 6,095 GE Appliances 6,000 Demographics 1-Mile 3-Mile 5-Mile 2015 Total Population 13,845 98, , Total Population 14, , , Total Households 5,674 38,896 93, Total Households 5,836 40,904 97,375 Median HH Income $54,966 $47,122 $49,746 Average HH Income $56,419 $52,485 $56,966
18
19 Prepared by Larry Hausman, Marcus & Millichap Nov 15, 2017 on KCREA [M] [O] Real Estate License: Population in Households 2010 Census 13,242 91, ,547 Average Household Size 2020 Projection Estimate Census Growth % 0% 0.01% Growth % 0.36% 0.57% Households by Household Type and Size and Presence of Children (2015 Estimate) Family Households 3,766 26,170 61,157 Married-couple family 2,662 16,705 41,411 With own 955 6,551 16,117 No own 1,707 10,154 25,294 Male Householder: 289 2,277 5,052 no wife present With own 124 1,133 2,505 No own 165 1,144 2,547 Female Householder: no husband 815 7,188 14,694 present With own 402 4,168 8,317 No own 413 3,020 6,377 Nonfamily Households 1,908 12,726 32,038 1 Person households 1,603 10,449 26, Unrelated people 305 2,277 5,824 Total Households 5,674 38,896 93,195 Family Households Married-couple family With own No own Male Householder: no wife present With own No own Female Householder: no husband present With own No own Nonfamily Households 1 Person households 2+ Unrelated people 66% 67% 66% 47% 43% 44% 17% 17% 17% 30% 26% 27% 5% 6% 5% 2% 3% 3% 3% 3% 3% 14% 18% 16% 7% 11% 9% 7% 8% 7% 34% 33% 34% 28% 27% 28% 5% 6% 6% Page 3
20 Prepared by Larry Hausman, Marcus & Millichap Nov 15, 2017 on KCREA [M] [O] Real Estate License: Households by Household Income (2015 Estimate) Less than $25,000 1,192 10,062 22,275 $25,000 to $49,999 1,701 12,052 27,602 $50,000 to $74,999 1,192 7,903 19,260 $75,000 to $99, ,117 12,078 $100,000 to $124, ,229 6,066 $125,000 to $149, ,156 $150,000 to $199, ,912 $200,000 or more Total Households 5,674 38,896 93,195 Average Household Income $56, $52, $56, Median Household Income $54, $47, $49, Less than $25,000 $25,000 to $49,999 $50,000 to $74,999 $75,000 to $99,999 $100,000 to $124,999 $125,000 to $149,999 $150,000 to $199,999 $200,000 or more 21% 26% 24% 30% 31% 30% 21% 20% 21% 17% 13% 13% 9% 6% 7% 1% 2% 3% 1% 1% 2% 0% 0% 1% Households by Household Income (2020 Projection) Less than $25,000 1,233 10,793 23,608 $25,000 to $49,999 1,751 12,679 28,907 $50,000 to $74,999 1,227 8,242 20,038 $75,000 to $99, ,316 12,533 $100,000 to $124, ,309 6,255 $125,000 to $149, ,220 $150,000 to $199, ,950 $200,000 or more Total Households 5,836 40,904 97,375 Average Household Income $55, $52, $56, Median Household Income $56, $47, $49, Less than $25,000 $25,000 to $49,999 $50,000 to $74,999 $75,000 to $99,999 $100,000 to $124,999 $125,000 to $149,999 $150,000 to $199,999 $200,000 or more 21% 26% 24% 30% 31% 30% 21% 20% 21% 17% 13% 13% 9% 6% 6% 1% 2% 3% 1% 1% 2% 0% 0% 1% Per Capita Income 2015 Estimate $22, $20, $22, Unemployment Rate 2015 Estimate 3.2% 3.06% 2.8% Page 4
21 Prepared by Larry Hausman, Marcus & Millichap Nov 15, 2017 on KCREA [M] [O] Real Estate License: Population Age 16+ By Employment Status (2015 Estimate) Labor Force 7,011 50, ,817 Civilian, Employed 6,806 48, ,882 Civilian, Unemployed 205 1,350 2,935 Not in Labor Force 4,609 29,828 70,665 Total Population Age ,620 80, ,482 Labor Force Civilian, Employed Civilian, Unemployed Not in Labor Force 60% 63% 63% 59% 61% 62% 2% 2% 2% 40% 37% 37% Employed Civilian Population Age 16+ by Industry (2015 Estimate) Agriculture, forestry, fishing and hunting, mining and 588 3,261 7,167 construction Manufacturing 813 6,789 15,680 Wholesale & retail trade 1,386 7,451 18,307 Transportation and warehousing, and 675 4,644 10,413 utilities Information ,684 Finance, insurance, real estate and 508 3,259 8,143 rental and leasing Professional, scientific, and 441 3,976 11,245 technical services Educational, health and social services 1,280 10,093 25,836 Arts, entertainment, recreation, accommodation and 458 4,698 10,587 food services Other services (except public 482 4,402 9,300 administration) Public Administration 131 1,242 3,394 Total Employed Civilian Population Age 16+ 6,832 50, ,756 Agriculture, forestry, fishing and hunting, mining and construction Manufacturing Wholesale & retail trade Transportation and warehousing, and utilities Information Finance, insurance, real estate and rental and leasing Professional, scientific, and technical services Educational, health and social services Arts, entertainment, recreation, accommodation and food services Other services (except public administration) Public Administration 9% 6% 6% 12% 13% 13% 20% 15% 15% 10% 9% 8% 1% 2% 2% 7% 6% 7% 6% 8% 9% 19% 20% 21% 7% 9% 9% 7% 9% 8% 2% 2% 3% Housing Units by Tenure (2015 Estimate) Vacant Housing Units 454 2,857 7,381 Occupied Housing Units 5,674 38,896 93,195 Owner- Occupied 4,288 25,688 63,664 Renter- Occupied 1,386 13,208 29,531 Total Housing Units 6,128 41, ,576 Vacant Housing Units Occupied Housing Units Owner- Occupied Renter- Occupied 7% 7% 7% 93% 93% 93% 70% 62% 63% 23% 32% 29% Copyright Kentucky Commercial Real Estate Alliance. All Rights Reserved. The information presented herein is provided as is, without warranty of any kind. Neither Kentucky Commercial Real Estate Alliance nor Catylist Real Estate Software, Inc. assume any liability for errors or omissions. Page 5
22
4575 Bay Rd, Saginaw, MI 48603
 Georges 4575 Bay Rd, Saginaw, MI 48603 Listing ID: 30340682 Status: Active Property Type: Business Opportunity For Sale Industry: Professional Services Size: 6,600 SF Sale Price: $852,000 Sale Terms: Cash
2415 Reynolds Ave, North Las Vegas, NV 89030
 7,221' *Reynolds Medical Center* Gray Shell w/ Elevator 89030 2415 Reynolds Ave, North Las Vegas, NV 89030 Listing ID: 29944098 Status: Active Property Type: Office For Sale (also listed as Special Purpose)
1320 S Casino Center Blvd, Las Vegas, NV 89104
 Professional or Attorney Office Arts District Casino Center 1320 S Casino Center Blvd, Las Vegas, NV 89104 Listing ID: 30030990 Status: Active Property Type: Office For Sale Office Type: Business Park,
2365 Reynolds Ave, North Las Vegas, NV 89030
 10% Down $77 psf 7,072' Medical Office Elevator & Gray Shell 2365 Reynolds Ave, North Las Vegas, NV 89030 Listing ID: 29944110 Status: Active Property Type: Office For Sale Office Type: Business Park,
7401 W Charleston Blvd, Las Vegas, NV 89117
 Cool $1,000,000.00 Discount Off Sale Price 7401 W Charleston Blvd, Las Vegas, NV 89117 Listing ID: 30193298 Status: Active Property Type: Office For Sale Office Type: Business Park, Executive Suites Size:
1112 Carroll Creek Rd, Johnson City, TN 37601
 Deanwood Apartments for Sale 1112 Carroll Creek Rd, Johnson City, TN 37601 Listing ID: 30363543 Status: Active Property Type: Multi-Family For Sale Multi-Family Type: Low-Rise/Garden Size: 23,432 SF Sale
2465 Reynolds Ave, North Las Vegas, NV 89030
 12,020' Reynolds Medical & Attorney Build-Out Elevator 89030 2465 Reynolds Ave, North Las Vegas, NV 89030 Listing ID: 29944111 Status: Active Property Type: Office For Sale (also listed as Special Purpose)
11701 Orpington St, Orlando, FL 32817
 Professional Space for Lease 11701 Orpington St, Orlando, FL 32817 Listing ID: 30295554 Status: Active Property Type: Office For Lease Office Type: Business Park, Governmental Contiguous Space: 1,250 SF
 12519 S Cleveland Ave Details Prepared on Prepared By Josh Burdine 239-362-3173 josh@rockstar-realestate.com Page 1 14,000 sq feet building on 41 in Fort Myers 12519 S Cleveland Ave, Fort Myers, FL 33907
46 Acres - Fronting Interstate 81 & Hopewell Rd. Prime Location - Zoned Industrial Potential for 2 Building Complexes
 46 Acre Land Opportunity - I-81 Frontage Design Concept: 2 Potential Building Parcels Prepared on 46 Acres - Fronting Interstate 81 & Hopewell Rd. Prime Location - Zoned Industrial Potential for 2 Building
7401 W Charleston Blvd, Las Vegas, NV 89117
 Cool $1.25 Million Discounted Las Vegas Company HQ Office 7401 W Charleston Blvd, Las Vegas, NV 89117 Listing ID: Status: Property Type: Office Type: Size: Sale Price: Unit Price: Sale Terms: Overview/Comments
3424 East Road, Saginaw, MI 48601
 R & W Investment 3424 East Road, Saginaw, MI 48601 Listing ID: 30298825 Status: Active Property Type: Industrial For Sale Industrial Type: Flex Space, Free-Standing Size: 7,564 SF Sale Price: $230,000
14114 Palm Beach Blvd, Fort Myers, FL 33905
 Palm Beach Boulevard Land 14114 Palm Beach Blvd, Fort Myers, FL 33905 Listing ID: 30318883 Status: Active Property Type: Vacant Land For Sale Possible Uses: Office, Retail Gross Land Area: 18,000 SF Sale
1208 S Eastern Ave, Las Vegas, NV 89104
 Office Medical Veterinarin Signage Frontage Visibility 89104 1208 S Eastern Ave, Las Vegas, NV 89104 Listing ID: 30138546 Status: Active Property Type: Office For Lease Office Type: Governmental, High-Tech
Benchmark Avenue, Fort Myers, FL 33905
 Available October 2017 Benchmark Industrial For Lease 1681-1687 Benchmark Avenue, Fort Myers, FL 33905 Listing ID: 30132311 Status: Active Property Type: Industrial For Lease Industrial Type: Flex Space,
2908 E Oakland Ave, Johnson City, TN 37601
 Office/retail Lease 2908 E Oakland Ave, Johnson City, TN 37601 Listing ID: 30369980 Status: Active Property Type: Office For Lease Office Type: Executive Suites, Governmental Contiguous Space: 2,800-7,800
2965 S Jones Blvd, Las Vegas, NV 89146
 10% Down Data Center Office Call Center Fiber Optic Cubicles 2965 S Jones Blvd, Las Vegas, NV 89146 Listing ID: 30029430 Status: Active Property Type: Office For Sale Office Type: Business Park, Governmental
5419 S Decatur Blvd, Las Vegas, NV 89118
 Call Center, Office, Showroom, Warehouse, Auto, Flex 5419 S Decatur Blvd, Las Vegas, NV 89118 Listing ID: 29978730 Status: Active Property Type: Office For Lease Office Type: Business Park, Governmental
5419 S Decatur Blvd, Las Vegas, NV 89118
 10% Down, Call Center, Office, Showroom, Warehouse, Auto, Flex 5419 S Decatur Blvd, Las Vegas, NV 89118 Listing ID: 29978727 Status: Active Property Type: Industrial For Sale Industrial Type: Flex Space,
5200 Ocean Blvd, Siesta Key, FL 34242
 Siesta Key Restaurant- BEST LOCATION IN THE VILLAGE! 5200 Ocean Blvd, Siesta Key, FL 34242 Listing ID: 29826583 Status: Active Property Type: Business Opportunity For Sale Industry: Food and Beverage Size:
5715 W. Alexander #150, Las Vegas, NV 89130
 10% Down Office Condo 49c PSF Payments 5715 W. Alexander #150, Las Vegas, NV 89130 Listing ID: 30279469 Status: Active Property Type: Office For Sale Office Type: Business Park, Executive Suites Size:
5715 W. Alexander #150, Las Vegas, NV 89130
 Brand New Everything! NW Professional Office Condo 5715 W. Alexander #150, Las Vegas, NV 89130 Listing ID: 30279487 Status: Active Property Type: Office For Lease Office Type: Business Park, Executive
3280 E Tropicana Ave, Las Vegas, NV 89121
 65c Rent NNN Various Size Retail Shop Office Store Medical 3280 E Tropicana Ave, Las Vegas, NV 89121 Listing ID: 29848683 Status: Active Property Type: Retail-Commercial For Lease (also listed as Office,
SOUTH DAKOTA KIDS COUNT BEACOM SCHOOL OF BUSINESS UNIVERSITY OF SOUTH DAKOTA 414 E. CLARK STREET VERMILLION, SD
 Brookings County Compared to o SDSD Undergrad Enrollment approximately 11,225 o USD Undergrad Enrollment approximately 7,600 o Brookings County 1 year population estimate for 2013 is 32,968 o 1 year population
SELECTED ECONOMIC CHARACTERISTICS American Community Survey 5-Year Estimates
 DP03 SELECTED ECONOMIC CHARACTERISTICS 2008-2012 American Community Survey 5-Year Estimates Supporting documentation on code lists, subject definitions, data accuracy, and statistical testing can be found
American Community Survey 5-Year Estimates
 DP03 SELECTED ECONOMIC CHARACTERISTICS 2013-2017 American Community Survey 5-Year Estimates Supporting documentation on code lists, subject definitions, data accuracy, and statistical testing can be found
EVEREST. Retail Investment Opportunity. Ivy Hills Retail Center 7397 Main Street Newtown, OH CONTACT: Chris Nachtrab.
 Retail Investment Opportunity CONTACT: Chris Nachtrab chris.nachtrab@everestrealestate.com 513/769-2509 John Thompson john.thompson@everestrealestate.com 513/769-2514 Ivy Hills Retail Center 7397 Main
Tell us what you think. Provide feedback to help make American Community Survey data more useful for you.
 DP03 SELECTED ECONOMIC CHARACTERISTICS 2016 American Community Survey 1-Year Estimates Supporting documentation on code lists, subject definitions, data accuracy, and statistical testing can be found on
University of Minnesota
 neighborhood profile October 2011 About this area The University neighborhood is bordered by 11th Avenue Southeast, University Avenue, 15th Avenue Southeast, the railroad tracks, Oak Street, and the Mississippi
American Community Survey 5-Year Estimates
 DP03 SELECTED ECONOMIC CHARACTERISTICS 2012-2016 American Community Survey 5-Year Estimates Supporting documentation on code lists, subject definitions, data accuracy, and statistical testing can be found
American Community Survey 5-Year Estimates
 DP03 SELECTED ECONOMIC CHARACTERISTICS 2012-2016 American Community Survey 5-Year Estimates Supporting documentation on code lists, subject definitions, data accuracy, and statistical testing can be found
American Community Survey 5-Year Estimates
 DP03 SELECTED ECONOMIC CHARACTERISTICS 2012-2016 American Community Survey 5-Year Estimates Supporting documentation on code lists, subject definitions, data accuracy, and statistical testing can be found
American Community Survey 5-Year Estimates
 DP03 SELECTED ECONOMIC CHARACTERISTICS 2012-2016 American Community Survey 5-Year Estimates Supporting documentation on code lists, subject definitions, data accuracy, and statistical testing can be found
American Community Survey 5-Year Estimates
 DP03 SELECTED ECONOMIC CHARACTERISTICS 2012-2016 American Community Survey 5-Year Estimates Supporting documentation on code lists, subject definitions, data accuracy, and statistical testing can be found
American Community Survey 5-Year Estimates
 DP03 SELECTED ECONOMIC CHARACTERISTICS 2012-2016 American Community Survey 5-Year Estimates Supporting documentation on code lists, subject definitions, data accuracy, and statistical testing can be found
American Community Survey 5-Year Estimates
 DP03 SELECTED ECONOMIC CHARACTERISTICS 2012-2016 American Community Survey 5-Year Estimates Supporting documentation on code lists, subject definitions, data accuracy, and statistical testing can be found
American Community Survey 5-Year Estimates
 DP03 SELECTED ECONOMIC CHARACTERISTICS 2012-2016 American Community Survey 5-Year Estimates Supporting documentation on code lists, subject definitions, data accuracy, and statistical testing can be found
American Community Survey 5-Year Estimates
 DP03 SELECTED ECONOMIC CHARACTERISTICS 2012-2016 American Community Survey 5-Year Estimates Supporting documentation on code lists, subject definitions, data accuracy, and statistical testing can be found
American Community Survey 5-Year Estimates
 DP03 SELECTED ECONOMIC CHARACTERISTICS 2012-2016 American Community Survey 5-Year Estimates Supporting documentation on code lists, subject definitions, data accuracy, and statistical testing can be found
American Community Survey 5-Year Estimates
 DP03 SELECTED ECONOMIC CHARACTERISTICS 2012-2016 American Community Survey 5-Year Estimates Supporting documentation on code lists, subject definitions, data accuracy, and statistical testing can be found
American Community Survey 5-Year Estimates
 DP03 SELECTED ECONOMIC CHARACTERISTICS 2012-2016 American Community Survey 5-Year Estimates Supporting documentation on code lists, subject definitions, data accuracy, and statistical testing can be found
American Community Survey 5-Year Estimates
 DP03 SELECTED ECONOMIC CHARACTERISTICS 2012-2016 American Community Survey 5-Year Estimates Supporting documentation on code lists, subject definitions, data accuracy, and statistical testing can be found
American Community Survey 5-Year Estimates
 DP03 SELECTED ECONOMIC CHARACTERISTICS 2012-2016 American Community Survey 5-Year Estimates Supporting documentation on code lists, subject definitions, data accuracy, and statistical testing can be found
American Community Survey 5-Year Estimates
 DP03 SELECTED ECONOMIC CHARACTERISTICS 2012-2016 American Community Survey 5-Year Estimates Supporting documentation on code lists, subject definitions, data accuracy, and statistical testing can be found
American Community Survey 5-Year Estimates
 DP03 SELECTED ECONOMIC CHARACTERISTICS 2012-2016 American Community Survey 5-Year Estimates Supporting documentation on code lists, subject definitions, data accuracy, and statistical testing can be found
American Community Survey 5-Year Estimates
 DP03 SELECTED ECONOMIC CHARACTERISTICS 2012-2016 American Community Survey 5-Year Estimates Supporting documentation on code lists, subject definitions, data accuracy, and statistical testing can be found
American Community Survey 5-Year Estimates
 DP03 SELECTED ECONOMIC CHARACTERISTICS 2012-2016 American Community Survey 5-Year Estimates Supporting documentation on code lists, subject definitions, data accuracy, and statistical testing can be found
American Community Survey 5-Year Estimates
 DP03 SELECTED ECONOMIC CHARACTERISTICS 2012-2016 American Community Survey 5-Year Estimates Supporting documentation on code lists, subject definitions, data accuracy, and statistical testing can be found
American Community Survey 5-Year Estimates
 DP03 SELECTED ECONOMIC CHARACTERISTICS 2012-2016 American Community Survey 5-Year Estimates Supporting documentation on code lists, subject definitions, data accuracy, and statistical testing can be found
American Community Survey 5-Year Estimates
 DP03 SELECTED ECONOMIC CHARACTERISTICS 2012-2016 American Community Survey 5-Year Estimates Supporting documentation on code lists, subject definitions, data accuracy, and statistical testing can be found
American Community Survey 5-Year Estimates
 DP03 SELECTED ECONOMIC CHARACTERISTICS 2012-2016 American Community Survey 5-Year Estimates Supporting documentation on code lists, subject definitions, data accuracy, and statistical testing can be found
American Community Survey 5-Year Estimates
 DP03 SELECTED ECONOMIC CHARACTERISTICS 2012-2016 American Community Survey 5-Year Estimates Supporting documentation on code lists, subject definitions, data accuracy, and statistical testing can be found
American Community Survey 5-Year Estimates
 DP03 SELECTED ECONOMIC CHARACTERISTICS 2012-2016 American Community Survey 5-Year Estimates Supporting documentation on code lists, subject definitions, data accuracy, and statistical testing can be found
American Community Survey 5-Year Estimates
 DP03 SELECTED ECONOMIC CHARACTERISTICS 2012-2016 American Community Survey 5-Year Estimates Supporting documentation on code lists, subject definitions, data accuracy, and statistical testing can be found
American Community Survey 5-Year Estimates
 DP03 SELECTED ECONOMIC CHARACTERISTICS 2012-2016 American Community Survey 5-Year Estimates Supporting documentation on code lists, subject definitions, data accuracy, and statistical testing can be found
Mid - City Industrial
 Minneapolis neighborhood profile October 2011 Mid - City Industrial About this area The Mid-City Industrial neighborhood is bordered by I- 35W, Highway 280, East Hennepin Avenue, and Winter Street Northeast.
Camden Industrial. Minneapolis neighborhood profile. About this area. Trends in the area. Neighborhood in Minneapolis.
 Minneapolis neighborhood profile October 2011 Camden Industrial About this area The Camden Industrial neighborhood is bordered by 48th Avenue North, the Mississippi River, Dowling Avenue North, Washington
Shingle Creek. Minneapolis neighborhood profile. About this area. Trends in the area. Neighborhood in Minneapolis. October 2011
 neighborhood profile October 2011 About this area The neighborhood is bordered by 53rd Avenue North, Humboldt Avenue North, 49th Avenue North, and Xerxes Avenue North. It is home to Olson Middle School.
E. Flamingo Rd, Las Vegas, NV 89121
 School Restaurant Retail Office Convenience 89c to $1.25 3620 3650 3654 E. Flamingo Rd, Las Vegas, NV 89121 Listing ID: 30284747 Status: Active Property Type: Retail-Commercial For Lease Retail-Commercial
For Lease. Free-standing Retail / Office Building 1304 Saratoga Avenue San Jose, CA
 For Lease Free-standing Retail / Office Building 1304 Saratoga Avenue San Jose, CA 95117 Description Approximately 4,500 sf plus mezzanine Outstanding identity and visibility In neighborhood shopping center
Economic Overview York County, South Carolina. February 14, 2018
 Economic Overview York County, February 14, 2018 DEMOGRAPHIC PROFILE... 3 EMPLOYMENT TRENDS... 5 UNEMPLOYMENT RATE... 5 WAGE TRENDS... 6 COST OF LIVING INDEX... 6 INDUSTRY SNAPSHOT... 7 OCCUPATION SNAPSHOT...
E. Flamingo Rd, Las Vegas, NV 89121
 Restaurant Supper Club Retail Office Convenience 89c to $1.25 3620 3650 3654 E. Flamingo Rd, Las Vegas, NV 89121 Listing ID: 30214834 Status: Active Property Type: Retail-Commercial For Lease Retail-Commercial
Town Profiles: Demographic, Economic, and Housing Statistics for De Smet City and Wall Town, SOuth Dakota
 South Dakota State University Open PRAIRIE: Open Public Research Access Institutional Repository and Information Exchange Census Data Center News Releases SDSU Census Data Center 12-7-2017 Town Profiles:
ECONOMIC OVERVIEW DuPage County, Illinois
 ECONOMIC OVERVIEW DuPage County, Illinois DEMOGRAPHIC PROFILE... 3 EMPLOYMENT TRENDS... 5 UNEMPLOYMENT RATE... 5 WAGE TRENDS... 6 COST OF LIVING INDEX... 7 INDUSTRY SNAPSHOT... 8 OCCUPATION SNAPSHOT...
TABLE 1. PROFILE OF GENERAL DEMOGRAPHIC CHARACTERISTICS
 Waterloo city, Iowa TABLE 1. PROFILE OF GENERAL DEMOGRAPHIC CHARACTERISTICS Estimate Lower Bound Upper Bound Total population 66,659 64,093 69,225 SEX AND AGE Male 32,096 30,415 33,777 Female 34,563 33,025
Average persons in household. Top three industries Post-secondary education (25 64 years) 7.1% Unemployment rate
 7.1% Unemployment rate") Demographic snapshot The Town of Oakville City of Burl ington City of Mis sissauga Town of Milton Population 198,042 Median age Average persons in household 41 2.8 years old $149,945 Average household
Demographic snapshot The Town of Oakville City of Burl ington City of Mis sissauga Town of Milton Population 198,042 Median age Average persons in household 41 2.8 years old $149,945 Average household
Economic Overview. Lawrence, KS MSA
 Economic Overview Lawrence, KS MSA March 5, 2019 DEMOGRAPHIC PROFILE... 3 EMPLOYMENT TRENDS... 5 UNEMPLOYMENT RATE... 5 WAGE TRENDS... 6 COST OF LIVING INDEX... 7 INDUSTRY SNAPSHOT... 8 OCCUPATION SNAPSHOT...
Monte Vista Population, ,744 4,651 4,564 4,467 4,458 4,432 4,451
 1 Monte Vista 4,8 4,7 4,6 4,5 4,4 4,3 4,2 4,1 4,61 4,612 4,61 4,676 Monte Vista, 2-213 4,744 4,651 4,564 4,467 4,458 4,432 4,451 4,418 4,412 4,355 2 21 22 23 24 25 26 27 28 29 21 211 212 213 Year Monte
Economic Overview City of Tyler, TX. January 8, 2018
 Economic Overview City of Tyler, TX January 8, 2018 DEMOGRAPHIC PROFILE...3 EMPLOYMENT TRENDS...5 WAGE TRENDS...5 COST OF LIVING INDEX...6 INDUSTRY SNAPSHOT...7 OCCUPATION SNAPSHOT...9 INDUSTRY CLUSTERS...
City of Edmonton Population Change by Age,
 Population Change by Age, 1996-2001 2001 Edmonton Demographic Profile The City of Edmonton s 2001population increased by 49,800 since the 1996 census. Migration figures are not available at the municipal
LAND FOR SALE Blair Road, Mint Hill, NC PROPERTY OVERVIEW. Large parcel with I-485 access via Blair Road exit in the path of. growth.
 LAND FOR SALE 10395 Blair Road, Mint Hill, NC 28227 OFFERING SUMMARY SALE PRICE: $1,000,000 PROPERTY OVERVIEW Large parcel with I485 access via Blair Road exit in the path of growth. LOT SIZE: 9.28 Acres
PROPOSED SHOPPING CENTER
 PROPOSED SHOPPING CENTER Southeast Corner I-95 & Highway 192 Melbourne, Florida In a 5 Mile Radius 80,862 Population 32,408 Households $61K Avg HH Income SOONER INVESTMENT Commercial & Investment Real
LAKE FOREST NEIGHBORHOOD PROFILE
 LAKE FOREST NEIGHBORHOOD PROFILE July 2017 Prepared in Partnership Between the Kentucky State Data Center at the University of Louisville and Metro United Way This data profile uses 2010 census tract boundaries
Economic Overview Monterey County, California. July 22, 2016
 Economic Overview Monterey July 22, 2016 DEMOGRAPHIC PROFILE... 3 EMPLOYMENT TRENDS... 5 UNEMPLOYMENT RATE... 5 WAGE TRENDS... 6 COST OF LIVING INDEX... 6 INDUSTRY SNAPSHOT... 7 OCCUPATION SNAPSHOT...
Economic Overview Loudoun County, Virginia. October 23, 2017
 Economic Overview October 23, 2017 DEMOGRAPHIC PROFILE... 3 EMPLOYMENT TRENDS... 5 UNEMPLOYMENT RATE... 5 WAGE TRENDS... 6 COST OF LIVING INDEX... 6 INDUSTRY SNAPSHOT... 7 OCCUPATION SNAPSHOT... 9 INDUSTRY
Economic Overview Long Island
 Report created on August 29, 2017 Economic Overview Long Island Contact: Lisa.Montiel@suny.edu DEMOGRAPHIC PROFILE... 3 EMPLOYMENT TRENDS... 5 UNEMPLOYMENT RATE... 5 WAGE TRENDS... 6 COST OF LIVING INDEX...
DEMOGRAPHIC PROFILE...3 EMPLOYMENT TRENDS...5 UNEMPLOYMENT RATE...5 WAGE TRENDS...6 COST OF LIVING INDEX...6 INDUSTRY SNAPSHOT...7
 March 14, 2017 DEMOGRAPHIC PROFILE...3 EMPLOYMENT TRENDS...5 UNEMPLOYMENT RATE...5 WAGE TRENDS...6 COST OF LIVING INDEX...6 INDUSTRY SNAPSHOT...7 OCCUPATION SNAPSHOT...9 INDUSTRY CLUSTERS... 12 EDUCATION
TEMPE CROSSING II - RETAIL PAD
 Excellent infill pad opportunity in dynamic retail corridor, 1 mi. East of I-10 Fully finished pad. Over $250,000 worth of site work already completed. Buildable up to 8,500 square feet. Excellent parking!
Economic Overview Western New York
 Report created on August 29, 2017 Economic Overview Western New Contact: Lisa.Montiel@suny.edu DEMOGRAPHIC PROFILE... 3 EMPLOYMENT TRENDS... 5 UNEMPLOYMENT RATE... 5 WAGE TRENDS... 6 COST OF LIVING INDEX...
October 28, Economic Overview Yellowstone County, Montana
 October 28, 2016 Economic Overview Yellowstone DEMOGRAPHIC PROFILE...3 EMPLOYMENT TRENDS...5 UNEMPLOYMENT RATE...5 WAGE TRENDS...6 COST OF LIVING INDEX...6 INDUSTRY SNAPSHOT...7 OCCUPATION SNAPSHOT...9
Economic Overview Fairfax / Falls Church. October 23, 2017
 Economic Overview Fairfax / Falls Church October 23, 2017 DEMOGRAPHIC PROFILE... 3 EMPLOYMENT TRENDS... 5 UNEMPLOYMENT RATE... 5 WAGE TRENDS... 6 COST OF LIVING INDEX... 6 INDUSTRY SNAPSHOT... 7 OCCUPATION
EASTWOOD-LONG RUN NEIGHBORHOOD PROFILE
 EASTWOOD-LONG RUN NEIGHBORHOOD PROFILE July 2017 Prepared in Partnership Between the Kentucky State Data Center at the University of Louisville and Metro United Way This data profile uses 2010 census tract
The Trails. 1,500 sf Space Available. In a 3 Mile Radius 69,985 Population 25,450 Households $78,216 Avg HH Inc. 1,500 sf Corner Space
 1,500 sf Space Available The Trails Edmond Rd (2nd St) & Santa Fe Ave ~ Edmond, Oklahoma Current Tenancy: Edmond YMCA Spinal Wellness Clinic Lemongrass Thai Cuisine Kumon Learning Center Katie s Family
GERMANTOWN-PARISTOWN NEIGHBORHOOD PROFILE
 GERMANTOWN-PARISTOWN NEIGHBORHOOD PROFILE July 2017 Prepared in Partnership Between the Kentucky State Data Center at the University of Louisville and Metro United Way Louisville s traditional urban neighborhoods
Economic Overview Capital District
 August 29, 2017 Economic Overview Capital District Contact: Lisa.Montiel@suny.edu DEMOGRAPHIC PROFILE... 3 EMPLOYMENT TRENDS... 5 UNEMPLOYMENT RATE... 5 WAGE TRENDS... 6 COST OF LIVING INDEX... 6 INDUSTRY
SHELBY PARK NEIGHBORHOOD PROFILE
 SHELBY PARK NEIGHBORHOOD PROFILE July 2017 Prepared in Partnership Between the Kentucky State Data Center at the University of Louisville and Metro United Way Louisville s traditional urban neighborhoods
Economic Overview Mohawk Valley
 Report created on August 29, 2017 Economic Overview Mohawk Valley Contact: Lisa.Montiel@suny.edu DEMOGRAPHIC PROFILE... 3 EMPLOYMENT TRENDS... 5 UNEMPLOYMENT RATE... 5 WAGE TRENDS... 6 COST OF LIVING INDEX...
PORTLAND NEIGHBORHOOD PROFILE
 PORTLAND NEIGHBORHOOD PROFILE July 2017 Prepared in Partnership Between the Kentucky State Data Center at the University of Louisville and Metro United Way Louisville s traditional urban neighborhoods
Economic Overview 45-Minute Commute From Airport Park. June 6, 2017
 Economic Overview 45-Minute Commute From Airport Park June 6, 2017 DEMOGRAPHIC PROFILE... 3 EMPLOYMENT TRENDS... 5 WAGE TRENDS... 5 COST OF LIVING INDEX... 6 INDUSTRY SNAPSHOT... 7 OCCUPATION SNAPSHOT...
Economic Overview Prince William/Manassas. October 23, 2017
 Economic Overview Prince William/Manassas October 23, 2017 DEMOGRAPHIC PROFILE... 3 EMPLOYMENT TRENDS... 5 UNEMPLOYMENT RATE... 5 WAGE TRENDS... 6 COST OF LIVING INDEX... 6 INDUSTRY SNAPSHOT... 7 OCCUPATION
Tyler Area Economic Overview
 Tyler Area Economic Overview Demographic Profile. 2 Unemployment Rate. 4 Wage Trends. 4 Cost of Living Index...... 5 Industry Clusters. 5 Occupation Snapshot. 6 Education Levels 7 Gross Domestic Product
Economic Overview Plant City Region. April 5, 2017
 Economic Overview Plant City Region April 5, 2017 DEMOGRAPHIC PROFILE... 3 EMPLOYMENT TRENDS... 5 WAGE TRENDS... 5 COST OF LIVING INDEX... 6 INDUSTRY SNAPSHOT... 7 OCCUPATION SNAPSHOT... 9 INDUSTRY CLUSTERS...
SOUTH LOUISVILLE NEIGHBORHOOD PROFILE
 SOUTH LOUISVILLE NEIGHBORHOOD PROFILE July 2017 Prepared in Partnership Between the Kentucky State Data Center at the University of Louisville and Metro United Way Louisville s traditional urban neighborhoods
ACS DEMOGRAPHIC AND HOUSING ESTIMATES American Community Survey 1-Year Estimates
 DP05 ACS DEMOGRAPHIC AND HOUSING ESTIMATES 2010 American Community Survey 1-Year s Supporting documentation on code lists, subject definitions, data accuracy, and statistical testing can be found on the
$1,600,000. Boston Reid LAKESIDE BUSINESS PARK. 117 Crosslake Park Drive Mooresville, NC SITE FEATURES. Lead 2 Real Estate Group
 LAKESIDE BUSINESS PARK 117 Crosslake Park Drive Mooresville, NC 28117 $1,600,000 Marketed By SITE FEATURES 17,000 + SF Industrial Building on 2.6 Acres Located in Lakeside Business Park High Power for
CHEROKEE-SENECA NEIGHBORHOOD PROFILE
 CHEROKEE-SENECA NEIGHBORHOOD PROFILE July 2017 Prepared in Partnership Between the Kentucky State Data Center at the University of Louisville and Metro United Way Louisville s traditional urban neighborhoods
ACS DEMOGRAPHIC AND HOUSING ESTIMATES American Community Survey 1-Year Estimates
 DP05 ACS DEMOGRAPHIC AND HOUSING ESTIMATES 2012 American Community Survey 1-Year Estimates Supporting documentation on code lists, subject definitions, data accuracy, and statistical testing can be found
Economic Overview New York
 Report created on October 20, 2015 Economic Overview Created using: Contact: Lisa.Montiel@suny.edu DEMOGRAPHIC PROFILE...3 EMPLOYMENT TRENDS...5 UNEMPLOYMENT RATE...5 WAGE TRENDS...6 COST OF LIVING INDEX...6
June 9, Economic Overview Billings, MT MSA
 June 9, 2016 Economic Overview Billings, MT MSA DEMOGRAPHIC PROFILE... 3 EMPLOYMENT TRENDS... 5 UNEMPLOYMENT RATE... 5 WAGE TRENDS... 6 COST OF LIVING INDEX... 6 INDUSTRY SNAPSHOT... 7 OCCUPATION SNAPSHOT...
Economic Overview Long Island
 Report created on October 20, 2015 Economic Overview Long Island Created using: Contact: Lisa.Montiel@suny.edu DEMOGRAPHIC PROFILE...3 EMPLOYMENT TRENDS...5 UNEMPLOYMENT RATE...5 WAGE TRENDS...6 COST OF