For Lease. Free-standing Retail / Office Building 1304 Saratoga Avenue San Jose, CA
|
|
|
- Vernon Caldwell
- 5 years ago
- Views:
Transcription


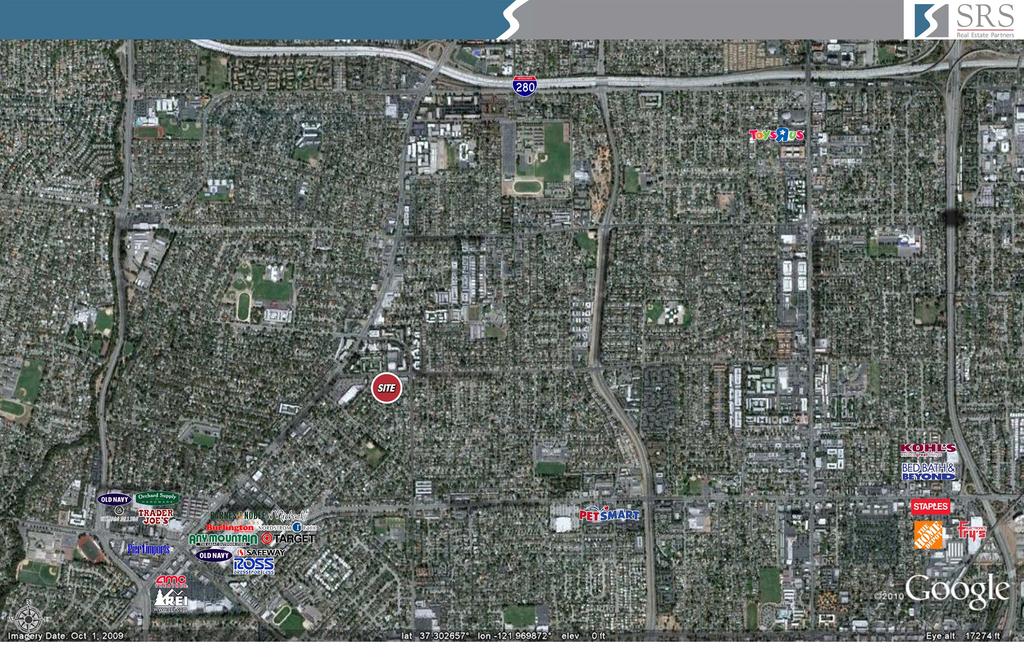
1 For Lease Free-standing Retail / Office Building 1304 Saratoga Avenue San Jose, CA Description Approximately 4,500 sf plus mezzanine Outstanding identity and visibility In neighborhood shopping center anchored by Fresh & Easy, Walgreens and dd's Discounts Ample parking Excellent ingress and egress Strong demographics Location Map Available 4,500 SF Rate Call for Rates Contact Robert G. Quigley bob.quigley@srsre.com Stephen P. Gazzera steve.gazzera@srsre.com Sarah Edwards sarah.edwards@srsre.com Map data 2011 Google - SRS Real Estate Partners 1871 The Alameda Suite 250 San Jose, CA CA Lic. Number(s): Quigley: # Gazzera: # Edwards: # Demographics 1 Mile 2 Mile 3 Mile Population 30, , ,291 Average HH Income $99,336 $105,052 $112,447 Daytime Population 6,284 25,865 81,515 Year: 2010 Source: Synergos Technologies, Inc. Traffic Counts Saratoga Avenue Year: 2005 Source: City of San Jose 36,000 CPD The information contained herein was obtained from sources deemed to be reliable. However, SRS Real Estate Partners makes no guarantees, warranties, or representations as to the completeness or accuracy thereof. Published:
2 San Jose, CA 1304 Saratoga Avenue SRS Real Estate Partners 1871 The Alameda, Suite 250, San Jose, CA This information contained herein was obtained from sources deemed to be reliable; However SRS Real Estate Partners makes no guarantees warranties or representations as to the completeness or accuracy thereof.


3 San Jose, CA 1304 Saratoga Avenue SRS Real Estate Partners 1871 The Alameda, Suite 250, San Jose, CA This information contained herein was obtained from sources deemed to be reliable; However SRS Real Estate Partners makes no guarantees warranties or representations as to the completeness or accuracy thereof.
4
5 Saratoga Ave & Payne Ave, San Jose, CA Full Demographic Report Date: April 5, 2011 Population 1.00 Mile 2.00 Mile 3.00 Mile Current Estimated Population 2015 Projected Population 2000 Census Population 1990 Census Population 30,176 30,632 29,289 27, , , , , , , , ,237 Historical Annual Growth 1990 to 2000 Estimated Annual Growth 2000 to 2010 Projected Annual Growth 2010 to % 0.29 % 0.30 % 0.81 % 0.04 % 0.29 % 0.82 % 0.13 % 0.34 % Households Current Estimated Households 2015 Projected Households 2000 Census Households 1990 Census Households 11,073 11,241 10,746 10,470 41,597 42,215 41,393 39,724 81,126 82,521 80,088 76,925 Historical Annual Growth 1990 to 2000 Estimated Annual Growth 2000 to 2010 Projected Annual Growth 2010 to % 0.29 % 0.30 % 0.41 % 0.05 % 0.30 % 0.40 % 0.13 % 0.34 % Persons per Household Population by Age Population 0 to 4 Years Population 5 to 13 Years Population 14 to 21 Years Population 22 to 29 Years Population 30 to 44 Years Population 45 to 59 Years Population 60 to 74 Years Population 74 Years Plus 7.43 % % % 8.09 % % % % 5.82 % 7.21 % % % 8.09 % % % % 5.59 % 7.11 % % 9.89 % 7.93 % % % % 5.94 % Median Age Gender Male Population Female Population 15,139 15,037 56,188 55, , ,343 Income HH Income $500,000 or more HH Income $250,000 to $499,999 HH Income $200,000 to $249,999 HH Income $175,000 to $199,999 HH Income $150,000 to $174,999 HH Income $100,000 to $149,999 HH Income $75,000 to $99,999 HH Income $50,000 to $74,999 HH Income $35,000 to $49,999 HH Income $25,000 to $34,999 HH Income $15,000 to $24,999 HH Income $0 to $14, % 4.86 % 3.55 % 4.39 % 5.21 % % % % % 5.81 % 5.12 % 5.72 % 0.49 % 5.57 % 4.08 % 4.61 % 5.89 % % % % 9.49 % 4.71 % 5.10 % 5.61 % 0.58 % 6.57 % 4.81 % 4.83 % 6.29 % % % % 9.01 % 4.96 % 4.87 % 5.26 % Longitude: Latitude: Current data is Census, Q Estimates & Q Projections. Demographic data copyright 2011 by Synergos Technologies, Inc. The information contained herein was obtained from sources deemed to be reliable; however SRS Real Estate Partners makes no guarantees, warranties, or representations as to the completeness or accuracy thereof.
6 Saratoga Ave & Payne Ave, San Jose, CA Full Demographic Report Date: April 5, Mile 2.00 Mile 3.00 Mile Average Household Income Median Household Income Per Capita Income $99,336 $79,484 $36,879 $105,052 $86,101 $39,504 $112,447 $90,562 $43,443 Work place Workplace Establishments Workplace Employees (FTE) 666 6,284 2,499 25,865 7,101 81,515 Race Current Estimated Population White Black or African American Asian or Pacific Islander Other Races 30, % 3.05 % % 3.33 % 111, % 2.86 % % 3.76 % 211, % 2.51 % % 3.54 % Hispanic 2010 Hispanic Population 2010 Hispanic Population Percent 2000 Hispanic Population Percent 1990 Hispanic Population Percent 6, % % % 21, % % 9.92 % 36, % % 9.46 % Education (Age 25+) Adult Population (25 Years or Older) Elementary Some High School High School Graduate Some College Associates Degree Bachelors Degree Graduate Degree 19, % 7.07 % % % 8.90 % % % 73, % 6.28 % % % 8.34 % % % 141, % 5.94 % % % 8.13 % % % Housing Total Housing Units Owner Occupied Percent Renter Occupied Percent Vacant Housing Percent 11, % % 1.77 % 42, % % 1.74 % 82, % % 1.76 % Homes Built By Year Homes Built 1990 to 2000 Homes Built 1980 to 1989 Homes Built 1970 to 1979 Homes Built 1960 to 1969 Homes Built 1950 to 1959 Homes Built 1940 to 1949 Homes Built Before % 6.83 % % % % 2.55 % 0.90 % 3.85 % 8.15 % % % % 2.96 % 0.90 % 5.32 % % % % % 4.22 % 1.29 % Home Value (Owner Occupied) Property Value $1,000,000 or more Property Value $750,000 to $999, % % % % % % Longitude: Latitude: Current data is Census, Q Estimates & Q Projections. Demographic data copyright 2011 by Synergos Technologies, Inc. The information contained herein was obtained from sources deemed to be reliable; however SRS Real Estate Partners makes no guarantees, warranties, or representations as to the completeness or accuracy thereof.
7 Saratoga Ave & Payne Ave, San Jose, CA Full Demographic Report Date: April 5, 2011 Property Value $500,000 to $749,999 Property Value $400,000 to $499,999 Property Value $300,000 to $399,999 Property Value $200,000 to $299,999 Property Value $150,000 to $199,999 Property Value $100,000 to $149,999 Property Value $60,000 to $99,999 Property Value $40,000 to $59,999 Property Value $0 to $39, Mile % % 3.24 % 0.57 % 0.10 % 0.21 % 2.26 % 0.83 % 0.06 % 2.00 Mile % % 4.70 % 2.31 % 0.52 % 0.59 % 1.52 % 0.72 % 0.12 % 3.00 Mile % % 4.60 % 2.35 % 0.86 % 0.98 % 1.66 % 0.67 % 0.19 % Median Home Value Median Rent (Census 2000) 689,507 1, ,461 1, ,091 1,450 Occupation (Employed Civilians Age 16+) Employed Civilian Population 16+ by Occupation Managerial/Executive Professional Specialty Healthcare Support Sales Office & Administrative Support Protective Service Food Preperation Building Maintenance & Cleaning Personal Care Farming, Fishing, & Forestry Construction Production & Transportation 13, % % 1.22 % % % 1.22 % 4.08 % 1.90 % 2.18 % 0.08 % 6.66 % 9.60 % 52, % % 1.10 % 9.97 % % 1.10 % 3.68 % 1.66 % 2.21 % 0.11 % 5.98 % 7.90 % 100, % % 1.06 % 9.83 % % 1.07 % 3.19 % 1.59 % 2.11 % 0.12 % 5.32 % 7.47 % Percent White Collar Percent Blue Collar % % % % % % Transportation To Work Drive to Work Alone Drive to Work Carpool Travel to Work by Public Transportation Drive to Work on Motorcycle Drive to Work on Bicycle Walked to Work Other Means Work at Home % % 3.66 % 0.32 % 0.72 % 1.75 % 0.66 % 2.28 % % % 2.79 % 0.32 % 0.71 % 1.42 % 0.36 % 3.09 % % % 2.40 % 0.24 % 0.86 % 1.51 % 0.38 % 3.05 % Travel Time To Work Travel Time in Less than 5 minutes Travel to Work in 5 to 9 minutes Travel to Work in 10 to 14 minutes Travel to Work in 15 to 19 minutes Travel to Work in 20 to 29 minutes Travel to Work in 30 to 44 minutes Travel to Work in 45 to 59 minutes Travel to Work in 60 minutes or more 1.24 % 5.88 % % % % % 7.04 % 4.76 % 1.03 % 5.60 % % % % % 6.82 % 4.64 % 1.24 % 6.47 % % % % % 6.59 % 4.69 % Average Travel Time to Work Longitude: Latitude: Current data is Census, Q Estimates & Q Projections. Demographic data copyright 2011 by Synergos Technologies, Inc. The information contained herein was obtained from sources deemed to be reliable; however SRS Real Estate Partners makes no guarantees, warranties, or representations as to the completeness or accuracy thereof.
Retail Space Available
 Retail Space Available SRS Real Estate Partners 1871 The Alameda, Suite 250 San Jose, CA 95126 408.553.6135 www.srsre.com Exclusive Leasing Agents Randol Mackley Bruce Frazer Senior Vice President Senior
Roseville Towne Center Gratiot Avenue Roseville, MI 48066
 Retail Space Available 65,000 SF Second Level Space and Outparcel Florence Street Massachusetts Street Gratiot Avenue E. 12 Mile Road Property Highlights is shadow-anchored by Walmart and includes national
PROPOSED SHOPPING CENTER
 PROPOSED SHOPPING CENTER Southeast Corner I-95 & Highway 192 Melbourne, Florida In a 5 Mile Radius 80,862 Population 32,408 Households $61K Avg HH Income SOONER INVESTMENT Commercial & Investment Real
The Trails. 1,500 sf Space Available. In a 3 Mile Radius 69,985 Population 25,450 Households $78,216 Avg HH Inc. 1,500 sf Corner Space
 1,500 sf Space Available The Trails Edmond Rd (2nd St) & Santa Fe Ave ~ Edmond, Oklahoma Current Tenancy: Edmond YMCA Spinal Wellness Clinic Lemongrass Thai Cuisine Kumon Learning Center Katie s Family
HIGH PROFILE ALTAMONTE SPRINGS RETAIL OPPORTUNITY 512 East Altamonte Drive Altamonte Springs, Florida 32701
 HIGH PROFILE ALTAMONTE SPRINGS RETAIL OPPORTUNITY 512 East Altamonte Drive Altamonte Springs, Florida 32701 AVAILABLE GLA 1,600 SF 7,835 SF RATE Call for Rates 1 Mile DEMOGRAPHICS Total Population 12,491
STANFORD PLAZA EAST FLORIDA AVE HEMET, CA. NICK EARLE License #
 Simon s Fish & Chips Helen Nails Chinese Food Coin Laundry Welch s Shoe & Repair Stanford Street Donut Shop Fast Auto and Payday Loans E. Florida Ave AVAILABILITY Unit # Size 41821 41855 4,064 SF Water
TitleMax INVESTMENT OFFERING. Todd Bunke South Western Avenue Blue Island, IL 60406
 INVESTMENT OFFERING TitleMax 12434 South Western Avenue Blue Island, IL 60406 Todd Bunke 404.964.9048 tbunke@atlantaregroup.com Confidentiality Agreement This is a confidential Memorandum intended solely
EVEREST. Retail Investment Opportunity. Ivy Hills Retail Center 7397 Main Street Newtown, OH CONTACT: Chris Nachtrab.
 Retail Investment Opportunity CONTACT: Chris Nachtrab chris.nachtrab@everestrealestate.com 513/769-2509 John Thompson john.thompson@everestrealestate.com 513/769-2514 Ivy Hills Retail Center 7397 Main
Spring Creek. Edmond, Oklahoma COLLETT& ASSOCIATES. 130,000+/- Square Feet Open-Air Shopping Center Development. The Bridges At
 The Bridges At Spring Creek E 15th Street & Bryant Avenue Edmond, Oklahoma 130,000+/- Square Feet Open-Air Shopping Center Development COLLETT& ASSOCIATES SOONER INVESTMENT Commercial & Investment Real
99TH AVENUE AND GLENDALE AVENUE
 N ATHAN & A SSOCIATES, I NC. 7600 East Doubletree Ranch Road Suite #150 Scottsdale Arizona 85258 Phone: 480.367.0700 Fax: 480.367.8341 www.nathanandassociatesinc.com 99TH AVENUE AND GLENDALE AVENUE S URROUNDING
AVAILABLE FOR LEASE Mayfield Road. Mayfield Heights, Ohio
 1,700 SF Retail Space For Lease Property Highlights Below market lease rates Refurbished in 2016 Furniture, fixtures and equipment available for purchase Fully built out restaurant space with hood Excellent
TEMPE CROSSING II - RETAIL PAD
 Excellent infill pad opportunity in dynamic retail corridor, 1 mi. East of I-10 Fully finished pad. Over $250,000 worth of site work already completed. Buildable up to 8,500 square feet. Excellent parking!
LAND FOR SALE Blair Road, Mint Hill, NC PROPERTY OVERVIEW. Large parcel with I-485 access via Blair Road exit in the path of. growth.
 LAND FOR SALE 10395 Blair Road, Mint Hill, NC 28227 OFFERING SUMMARY SALE PRICE: $1,000,000 PROPERTY OVERVIEW Large parcel with I485 access via Blair Road exit in the path of growth. LOT SIZE: 9.28 Acres
Commission District 4 Census Data Aggregation
 Commission District 4 Census Data Aggregation 2011-2015 American Community Survey Data, U.S. Census Bureau Table 1 (page 2) Table 2 (page 2) Table 3 (page 3) Table 4 (page 4) Table 5 (page 4) Table 6 (page
Mid - City Industrial
 Minneapolis neighborhood profile October 2011 Mid - City Industrial About this area The Mid-City Industrial neighborhood is bordered by I- 35W, Highway 280, East Hennepin Avenue, and Winter Street Northeast.
SDs from Regional Peer Group Mean. SDs from Size Peer Group Mean
 Family: Population Demographics Population Entire MSA 602894 Central Cities (CC) 227,818 Outside Central Cities 375,076 Percent of Entire MSA 37.79% Population in CC Percent Change in Population from 1999
SDs from Regional Peer Group Mean. SDs from Size Peer Group Mean
 Family: Population Demographics Population Entire MSA 1187941 Central Cities (CC) 511,843 Outside Central Cities 676,098 Percent of Entire MSA 43.09% Population in CC Percent Change in Population from
SDs from Regional Peer Group Mean. SDs from Size Peer Group Mean
 Family: Population Demographics Population Entire MSA 661645 Central Cities (CC) 247,057 Outside Central Cities 414,588 Percent of Entire MSA 37.34% Population in CC Percent Change in Population from 1999
SDs from Regional Peer Group Mean. SDs from Size Peer Group Mean
 Family: Population Demographics Population Entire MSA 583845 Central Cities (CC) 316,649 Outside Central Cities 267,196 Percent of Entire MSA 54.24% Population in CC Percent Change in Population from 1999
SDs from Regional Peer Group Mean. SDs from Size Peer Group Mean
 Family: Population Demographics Population Entire MSA 1251509 Central Cities (CC) 540,423 Outside Central Cities 711,086 Percent of Entire MSA 43.18% Population in CC Percent Change in Population from
SDs from Regional Peer Group Mean. SDs from Size Peer Group Mean
 Family: Population Demographics Population Entire MSA 1135614 Central Cities (CC) 677,766 Outside Central Cities 457,848 Percent of Entire MSA 59.68% Population in CC Percent Change in Population from
SDs from Regional Peer Group Mean. SDs from Size Peer Group Mean
 Family: Population Demographics Population Entire MSA 591932 Central Cities (CC) 260,970 Outside Central Cities 330,962 Percent of Entire MSA 44.09% Population in CC Percent Change in Population from 1999
SDs from Regional Peer Group Mean. SDs from Size Peer Group Mean
 Family: Population Demographics Population Entire MSA 1100491 Central Cities (CC) 735,617 Outside Central Cities 364,874 Percent of Entire MSA 66.84% Population in CC Percent Change in Population from
SDs from Regional Peer Group Mean. SDs from Size Peer Group Mean
 Family: Population Demographics Population Entire MSA 540258 Central Cities (CC) 198,915 Outside Central Cities 341,343 Percent of Entire MSA 36.82% Population in CC Percent Change in Population from 1999
SDs from Regional Peer Group Mean. SDs from Size Peer Group Mean
 Family: Population Demographics Population Entire MSA 1249763 Central Cities (CC) 691,295 Outside Central Cities 558,468 Percent of Entire MSA 55.31% Population in CC Percent Change in Population from
SDs from Regional Peer Group Mean. SDs from Size Peer Group Mean
 Family: Population Demographics Population Entire MSA 1088514 Central Cities (CC) 272,953 Outside Central Cities 815,561 Percent of Entire MSA 25.08% Population in CC Percent Change in Population from
SDs from Regional Peer Group Mean. SDs from Size Peer Group Mean
 Family: Population Demographics Population Entire MSA 922516 Central Cities (CC) 470,859 Outside Central Cities 451,657 Percent of Entire MSA 51.04% Population in CC Percent Change in Population from 1999
SDs from Regional Peer Group Mean. SDs from Size Peer Group Mean
 Family: Population Demographics Population Entire MSA 687249 Central Cities (CC) 198,500 Outside Central Cities 488,749 Percent of Entire MSA 28.88% Population in CC Percent Change in Population from 1999
SDs from Regional Peer Group Mean. SDs from Size Peer Group Mean
 Family: Population Demographics Population Entire MSA 542149 Central Cities (CC) 181870 Outside Central Cities 360279 Percent of Entire MSA 33.55% Population in CC Percent Change in Population from 1999
SDs from Regional Peer Group Mean. SDs from Size Peer Group Mean
 Family: Population Demographics Population Entire MSA 1025598 Central Cities (CC) 293,834 Outside Central Cities 731,764 Percent of Entire MSA 28.65% Population in CC Percent Change in Population from
SDs from Regional Peer Group Mean. SDs from Size Peer Group Mean
 Family: Population Demographics Population Entire MSA 875583 Central Cities (CC) 232,835 Outside Central Cities 642,748 Percent of Entire MSA 26.59% Population in CC Percent Change in Population from 1999
SDs from Regional Peer Group Mean. SDs from Size Peer Group Mean
 Family: Population Demographics Population Entire MSA 716998 Central Cities (CC) 448,275 Outside Central Cities 268,723 Percent of Entire MSA 62.52% Population in CC Percent Change in Population from 1999
SDs from Regional Peer Group Mean. SDs from Size Peer Group Mean
 Family: Population Demographics Population Entire MSA 1333914 Central Cities (CC) 284,943 Outside Central Cities 1,048,971 Percent of Entire MSA 21.36% Population in CC Percent Change in Population from
SDs from Regional Peer Group Mean. SDs from Size Peer Group Mean
 Family: Population Demographics Population Entire MSA 712738 Central Cities (CC) 448,607 Outside Central Cities 264,131 Percent of Entire MSA 62.94% Population in CC Percent Change in Population from 1999
SDs from Regional Peer Group Mean. SDs from Size Peer Group Mean. Population Entire MSA
 Family: Population Demographics Population Entire MSA 1169641 Central Cities (CC) 0 Outside Central Cities 1,169,641 Percent of Entire MSA 0% Population in CC Percent Change in Population from 1999 to
SDs from Regional Peer Group Mean. SDs from Size Peer Group Mean
 Family: Population Demographics Population Entire MSA 3251876 Central Cities (CC) 2,078,750 Outside Central Cities 1,173,126 Percent of Entire MSA 63.92% Population in CC Percent Change in Population from
SDs from Regional Peer Group Mean. SDs from Size Peer Group Mean
 Family: Population Demographics Population Entire MSA 1592383 Central Cities (CC) 1,181,140 Outside Central Cities 411,243 Percent of Entire MSA 74.17% Population in CC Percent Change in Population from
SDs from Regional Peer Group Mean. SDs from Size Peer Group Mean
 Family: Population Demographics Population Entire MSA 1776062 Central Cities (CC) 716,793 Outside Central Cities 1,059,269 Percent of Entire MSA 40.36% Population in CC Percent Change in Population from
SDs from Regional Peer Group Mean. SDs from Size Peer Group Mean
 Family: Population Demographics Population Entire MSA 4112198 Central Cities (CC) 416,474 Outside Central Cities 3,695,724 Percent of Entire MSA 10.13% Population in CC Percent Change in Population from
SDs from Regional Peer Group Mean. SDs from Size Peer Group Mean
 Family: Population Demographics Population Entire MSA 9519338 Central Cities (CC) 4408996 Outside Central Cities 5110342 Percent of Entire MSA 46.32% Population in CC Percent Change in Population from
SDs from Regional Peer Group Mean. SDs from Size Peer Group Mean
 Family: Population Demographics Population Entire MSA 1623018 Central Cities (CC) 152397 Outside Central Cities 1470621 Percent of Entire MSA 9.39% Population in CC Percent Change in Population from 1999
SDs from Regional Peer Group Mean. SDs from Size Peer Group Mean
 Family: Population Demographics Population Entire MSA 1731183 Central Cities (CC) 776733 Outside Central Cities 954450 Percent of Entire MSA 44.87% Population in CC Percent Change in Population from 1999
SDs from Regional Peer Group Mean. SDs from Size Peer Group Mean
 Family: Population Demographics Population Entire MSA 2968806 Central Cities (CC) 669,769 Outside Central Cities 2,299,037 Percent of Entire MSA 22.56% Population in CC Percent Change in Population from
SDs from Regional Peer Group Mean. SDs from Size Peer Group Mean
 Family: Population Demographics Population Entire MSA 2846289 Central Cities (CC) 809063 Outside Central Cities 2037226 Percent of Entire MSA 28.43% Population in CC Percent Change in Population from 1999
SDs from Regional Peer Group Mean. SDs from Size Peer Group Mean
 Family: Population Demographics Population Entire MSA 4441551 Central Cities (CC) 1147720 Outside Central Cities 3293831 Percent of Entire MSA 25.84% Population in CC Percent Change in Population from
SDs from Regional Peer Group Mean. SDs from Size Peer Group Mean
 Family: Population Demographics Population Entire MSA 1500741 Central Cities (CC) 661799 Outside Central Cities 838942 Percent of Entire MSA 44.1% Population in CC Percent Change in Population from 1999
SDs from Regional Peer Group Mean. SDs from Size Peer Group Mean
 Family: Population Demographics Population Entire MSA 2552994 Central Cities (CC) 686992 Outside Central Cities 1866002 Percent of Entire MSA 26.91% Population in CC Percent Change in Population from 1999
Northwest Census Data Aggregation
 Northwest Census Data Aggregation 2011-2015 American Community Survey Data, U.S. Census Bureau Table 1 (page 2) Table 2 (page 2) Table 3 (page 3) Table 4 (page 4) Table 5 (page 4) Table 6 (page 5) Table
Riverview Census Data Aggregation
 Riverview Census Data Aggregation 2011-2015 American Community Survey Data, U.S. Census Bureau Table 1 (page 2) Table 2 (page 2) Table 3 (page 3) Table 4 (page 4) Table 5 (page 4) Table 6 (page 5) Table
SDs from Regional Peer Group Mean. SDs from Size Peer Group Mean
 Family: Population Demographics Population Entire MSA 2414616 Central Cities (CC) 764431 Outside Central Cities 1650185 Percent of Entire MSA 31.66% Population in CC Percent Change in Population from 1999
Zipe Code Census Data Aggregation
 Zipe Code 66101 Census Data Aggregation 2011-2015 American Community Survey Data, U.S. Census Bureau Table 1 (page 2) Table 2 (page 2) Table 3 (page 3) Table 4 (page 4) Table 5 (page 4) Table 6 (page 5)
Zipe Code Census Data Aggregation
 Zipe Code 66103 Census Data Aggregation 2011-2015 American Community Survey Data, U.S. Census Bureau Table 1 (page 2) Table 2 (page 2) Table 3 (page 3) Table 4 (page 4) Table 5 (page 4) Table 6 (page 5)
Commercial Land for Sale. Messina Highlands Acres / W. Market St. & Richland Ave West Market Street; York, PA SITE
 3 2018 Messina Highlands 2.21 Acres / W. Market St. & Richland Ave. ; SITE York Fuel Stop / Tobacco Outlet T & D Car Wash 2.21 Acres Commercial Land Available for Sale 12,000 CPD on West Market Street
University of Minnesota
 neighborhood profile October 2011 About this area The University neighborhood is bordered by 11th Avenue Southeast, University Avenue, 15th Avenue Southeast, the railroad tracks, Oak Street, and the Mississippi
Camden Industrial. Minneapolis neighborhood profile. About this area. Trends in the area. Neighborhood in Minneapolis.
 Minneapolis neighborhood profile October 2011 Camden Industrial About this area The Camden Industrial neighborhood is bordered by 48th Avenue North, the Mississippi River, Dowling Avenue North, Washington
PRIME COMMERCIAL LAND FOR SALE
 PRIME COMMERCIAL LAND AVENUE P-4 & 5 TH STREET WEST OUTSTANDING HWY. 14 EXPOSURE COMING SOON TRADE & COMMERCE CENTER HEART OF S RETAIL & BUSINESS CORRIDOR The depiction in the included photograph of any
Shingle Creek. Minneapolis neighborhood profile. About this area. Trends in the area. Neighborhood in Minneapolis. October 2011
 neighborhood profile October 2011 About this area The neighborhood is bordered by 53rd Avenue North, Humboldt Avenue North, 49th Avenue North, and Xerxes Avenue North. It is home to Olson Middle School.
Contact: Larry Hausman (502) Outer Loop, Louisville, KY Knobview Shopping Center
 Outer Loop, Louisville, KY Knobview Shopping Center") 5603-5637 Outer Loop, Louisville, KY 40219 Knobview Shopping Center Jefferson Mall Academy Sports Center SUBJECT Knobview Shopping Center offers a diverse mix of local and national tenants. The center
5603-5637 Outer Loop, Louisville, KY 40219 Knobview Shopping Center Jefferson Mall Academy Sports Center SUBJECT Knobview Shopping Center offers a diverse mix of local and national tenants. The center
University Town Center
 University Town Center Norman, Oklahoma 2,000,000 +/- SF Regional Lifestyle Center Phase I Anchored by Target ~ Phase II Anchored by Kohls Home to the John Q. Hammons Embassy Suites Hotel & Convention
Brannon Crossing 4089 Lexington Road Lexington, KY 40356
 Brannon Crossing Retail Space Available 1.075 1.33 Acres 4,051 Cars Per Day 45,448 Cars Per Day Lexington/Nicolasville Road, U.S. 27 Brannon Road, KY 2080 Property Highlights Located in strong retail corridor
S A N J O S E C A L I F O R N I A
 SAN JOSE CALIFORNIA SANTA CLARA: A TOP U.S. COUNTY Compared to the 20 Most Populous Counties Santa Clara County ranks #1 in average household income at over $145,000 1. Santa Clara, CA 2. Alameda, CA (Oakland)
Tyler Area Economic Overview
 Tyler Area Economic Overview Demographic Profile. 2 Unemployment Rate. 4 Wage Trends. 4 Cost of Living Index...... 5 Industry Clusters. 5 Occupation Snapshot. 6 Education Levels 7 Gross Domestic Product
LEASE City Avenue Philadelphia, PA Agent Contact: LEASE FOR $20 S/F PLUS UTILITES. Lisa Trout
 LEASE 4920-50 City Avenue Philadelphia, PA 19131 C APITAL COMMERCIAL R EAL ESTATE G ROUP 3748 West Chester Pike Newtown Square, PA 19073 Phone: 610-359-9700 Fax: 610-359-9750 www.capitalcomre.com BEAUTIFUL
FOR LEASE SUGARCREEK VILLAGE SW Freeway, Sugar Land, Texas 77478
 FOR LEASE SUGARCREEK VILLAGE 13703 SW Freeway, Sugar Land, Texas 77478 Property Features: 4,150 Sq. Ft. End Cap on Sugar Creek Boulevard available 1,480 Sq. Ft. available 12/1/18 Anchored by Fishing Tackle
OWNER USER / SBA FINANCING: Office Building For Sale. PROPERTY HIGHLIGHTS: Currently 90% Occupied, but in 2016 the whole top floor.
 OWNER USER / SBA FINANCING: Office Building For Sale Investment Lake Sahara Plaza at 8685 West Sahara Avenue is an 11,858 +/ SF Office building located in the prestigious Lakes subdivision on the edge
CVS/Pharmacy. Absolute NNN Lease IREA. Actual Photo S Garey Ave, Pomona, CA 91766
 CVS/Pharmacy Absolute NNN Lease 1485 S Garey Ave, Pomona, CA 91766 IREA Actual Photo IREA INVESTMENT REAL ESTATE ASSOCIATES OFFICE 16501 Ventura Blvd. Suite 448 Encino, CA 91436 Phone: 818.386.6888 Fax:
Town Profiles: Demographic, Economic, and Housing Statistics for De Smet City and Wall Town, SOuth Dakota
 South Dakota State University Open PRAIRIE: Open Public Research Access Institutional Repository and Information Exchange Census Data Center News Releases SDSU Census Data Center 12-7-2017 Town Profiles:
TABLE 1. PROFILE OF GENERAL DEMOGRAPHIC CHARACTERISTICS
 Waterloo city, Iowa TABLE 1. PROFILE OF GENERAL DEMOGRAPHIC CHARACTERISTICS Estimate Lower Bound Upper Bound Total population 66,659 64,093 69,225 SEX AND AGE Male 32,096 30,415 33,777 Female 34,563 33,025
Independence, MO Data Profile 2015
 , MO Data Profile 2015 5 year American Community Survey (ACS) Jackson County, Missouri Data sources: U.S. Census Bureau, American Community Survey (ACS), 2011 2015 (released December 8, 2016), compared
Demographics for 2020 S Main St, South Jacksonville, Illinois, United States
 Demographics for 2020 S Main St, South Jacksonville, Illinois, United States Population Population Total Population (US Census 2010) 3,200 19,103 24,773 Total Population (Current Year) 3,168 18,852 24,419
2016 Labor Market Profile
 2016 Labor Market Profile Prepared by The Tyler Economic Development Council Tyler Area Sponsor June 2016 The ability to demonstrate a regions availability of talented workers has become a vital tool
RIDGECREST TOWNE CENTER
 700-840 N. CHINA LAKE BLVD. RIDGECREST, CALIFORNIA 1,400SF, 1,750SF, 2,205SF, 2,633SF AND 6,620SF AVAILABLE CENTER OF TOWN LOCATION AND COMING SOON: N. China Lake Blvd. Anchored by Stater Brothers, Big
Economic Overview City of Tyler, TX. January 8, 2018
 Economic Overview City of Tyler, TX January 8, 2018 DEMOGRAPHIC PROFILE...3 EMPLOYMENT TRENDS...5 WAGE TRENDS...5 COST OF LIVING INDEX...6 INDUSTRY SNAPSHOT...7 OCCUPATION SNAPSHOT...9 INDUSTRY CLUSTERS...
Savannah Agee Direct:
 Demographics for 7071 S Bilbo Rd, Orange, Texas 77632, United States Savannah Agee Direct: 409-833-5055 Population Population Total Population (US Census 2010) 358 4,419 8,486 Total Population (Current
Economic Overview York County, South Carolina. February 14, 2018
 Economic Overview York County, February 14, 2018 DEMOGRAPHIC PROFILE... 3 EMPLOYMENT TRENDS... 5 UNEMPLOYMENT RATE... 5 WAGE TRENDS... 6 COST OF LIVING INDEX... 6 INDUSTRY SNAPSHOT... 7 OCCUPATION SNAPSHOT...
ECONOMIC OVERVIEW DuPage County, Illinois
 ECONOMIC OVERVIEW DuPage County, Illinois DEMOGRAPHIC PROFILE... 3 EMPLOYMENT TRENDS... 5 UNEMPLOYMENT RATE... 5 WAGE TRENDS... 6 COST OF LIVING INDEX... 7 INDUSTRY SNAPSHOT... 8 OCCUPATION SNAPSHOT...
2365 Reynolds Ave, North Las Vegas, NV 89030
 10% Down $77 psf 7,072' Medical Office Elevator & Gray Shell 2365 Reynolds Ave, North Las Vegas, NV 89030 Listing ID: 29944110 Status: Active Property Type: Office For Sale Office Type: Business Park,
Contingent and Alternative Employment Arrangements, May U.S. BUREAU OF LABOR STATISTICS bls.gov
 Contingent and Alternative Employment Arrangements, May 2017 1 U.S. BUREAU OF LABOR STATISTICS bls.gov Gig economy No official BLS definition of gig economy or gig workers Researchers use many different
Economic Overview. Lawrence, KS MSA
 Economic Overview Lawrence, KS MSA March 5, 2019 DEMOGRAPHIC PROFILE... 3 EMPLOYMENT TRENDS... 5 UNEMPLOYMENT RATE... 5 WAGE TRENDS... 6 COST OF LIVING INDEX... 7 INDUSTRY SNAPSHOT... 8 OCCUPATION SNAPSHOT...
SUPPLEMENTAL INFORMATION
 SUPPLEMENTAL INFORMATION Statement of Net Position (as of June 30, 2013) Component Business Total Unit Total Governmental Type Primary Manassas City Reporting Activities Activities Government Public Schools
2465 Reynolds Ave, North Las Vegas, NV 89030
 12,020' Reynolds Medical & Attorney Build-Out Elevator 89030 2465 Reynolds Ave, North Las Vegas, NV 89030 Listing ID: 29944111 Status: Active Property Type: Office For Sale (also listed as Special Purpose)
Urban Action Agenda Community Profiles COVER TO GO HERE. City of Beacon
 Urban Action Agenda Community Profiles COVER TO GO HERE City of Beacon COMMUNITY OVERVIEW MAP POPULATION & DEMOGRAPHICS Population Basics 2,212 Population (2015) Population Change 2. since 2000 0.5 Square
Linden Market. 132nd & W. Dodge Rd., Omaha, NE W. Dodge Rd., Ste 270 Omaha, NE (p)
") Linden Market 132nd & W. Dodge Rd., Omaha, NE 68154 Agent: Dennis Thaemert Phone: 402-502-4706 Email: dthaemert@lernerco.com Agent: Boh Kurylo Phone: 402-502-4707 Email: bkurylo@lernerco.com 10855 W. Dodge
Linden Market 132nd & W. Dodge Rd., Omaha, NE 68154 Agent: Dennis Thaemert Phone: 402-502-4706 Email: dthaemert@lernerco.com Agent: Boh Kurylo Phone: 402-502-4707 Email: bkurylo@lernerco.com 10855 W. Dodge
Economic Overview Capital District
 August 29, 2017 Economic Overview Capital District Contact: Lisa.Montiel@suny.edu DEMOGRAPHIC PROFILE... 3 EMPLOYMENT TRENDS... 5 UNEMPLOYMENT RATE... 5 WAGE TRENDS... 6 COST OF LIVING INDEX... 6 INDUSTRY
2415 Reynolds Ave, North Las Vegas, NV 89030
 7,221' *Reynolds Medical Center* Gray Shell w/ Elevator 89030 2415 Reynolds Ave, North Las Vegas, NV 89030 Listing ID: 29944098 Status: Active Property Type: Office For Sale (also listed as Special Purpose)
Economic Overview Monterey County, California. July 22, 2016
 Economic Overview Monterey July 22, 2016 DEMOGRAPHIC PROFILE... 3 EMPLOYMENT TRENDS... 5 UNEMPLOYMENT RATE... 5 WAGE TRENDS... 6 COST OF LIVING INDEX... 6 INDUSTRY SNAPSHOT... 7 OCCUPATION SNAPSHOT...
Economic Overview New York
 Report created on October 20, 2015 Economic Overview Created using: Contact: Lisa.Montiel@suny.edu DEMOGRAPHIC PROFILE...3 EMPLOYMENT TRENDS...5 UNEMPLOYMENT RATE...5 WAGE TRENDS...6 COST OF LIVING INDEX...6
Former Sports Authority
 Former Sports Authority Agent: Boh Kurylo Phone: 402-502-4707 Email: bkurylo@lernerco.com Agent: Ben Meier Phone: 402-502-4715 Email: bmeier@lernerco.com 10855 W. Dodge Rd., Ste 270 Omaha, NE 68154 402-330-5480
APPENDIX 6: CENSUS DATA BURLINGTON, VERMONT
 APPENDIX 6: CENSUS DATA BURLINGTON, VERMONT 2000 CENSUS DATA 2005-2007 AMERICAN COMMUNITY SURVEY Burlington city, Vermont - Fact Sheet - American FactFinder Page 1 of 2 FACT SHEET Burlington
ACS DEMOGRAPHIC AND HOUSING ESTIMATES American Community Survey 1-Year Estimates
 DP05 ACS DEMOGRAPHIC AND HOUSING ESTIMATES 2010 American Community Survey 1-Year s Supporting documentation on code lists, subject definitions, data accuracy, and statistical testing can be found on the
Economic Overview Long Island
 Report created on October 20, 2015 Economic Overview Long Island Created using: Contact: Lisa.Montiel@suny.edu DEMOGRAPHIC PROFILE...3 EMPLOYMENT TRENDS...5 UNEMPLOYMENT RATE...5 WAGE TRENDS...6 COST OF
1208 S Eastern Ave, Las Vegas, NV 89104
 Office Medical Veterinarin Signage Frontage Visibility 89104 1208 S Eastern Ave, Las Vegas, NV 89104 Listing ID: 30138546 Status: Active Property Type: Office For Lease Office Type: Governmental, High-Tech
Economic Overview Long Island
 Report created on August 29, 2017 Economic Overview Long Island Contact: Lisa.Montiel@suny.edu DEMOGRAPHIC PROFILE... 3 EMPLOYMENT TRENDS... 5 UNEMPLOYMENT RATE... 5 WAGE TRENDS... 6 COST OF LIVING INDEX...
11701 Orpington St, Orlando, FL 32817
 Professional Space for Lease 11701 Orpington St, Orlando, FL 32817 Listing ID: 30295554 Status: Active Property Type: Office For Lease Office Type: Business Park, Governmental Contiguous Space: 1,250 SF
Economic Overview 45-Minute Commute From Airport Park. June 6, 2017
 Economic Overview 45-Minute Commute From Airport Park June 6, 2017 DEMOGRAPHIC PROFILE... 3 EMPLOYMENT TRENDS... 5 WAGE TRENDS... 5 COST OF LIVING INDEX... 6 INDUSTRY SNAPSHOT... 7 OCCUPATION SNAPSHOT...
Mattydale K-Mart Plaza Brewerton Road (Rt. 11) Syracuse, NY 13211
 Syracuse, NY 13211") Exclusive Offering FOR LEASE Mattydale K-Mart Plaza Brewerton Road (Rt. 11) Syracuse, NY 13211 Exterior Renovations Completed! SITE I-81 SITE Rt.11 I-81 SYRACUSE AIRPORT I-90 I-90 FEATURES: High Visibility
Exclusive Offering FOR LEASE Mattydale K-Mart Plaza Brewerton Road (Rt. 11) Syracuse, NY 13211 Exterior Renovations Completed! SITE I-81 SITE Rt.11 I-81 SYRACUSE AIRPORT I-90 I-90 FEATURES: High Visibility
Economic Overview Loudoun County, Virginia. October 23, 2017
 Economic Overview October 23, 2017 DEMOGRAPHIC PROFILE... 3 EMPLOYMENT TRENDS... 5 UNEMPLOYMENT RATE... 5 WAGE TRENDS... 6 COST OF LIVING INDEX... 6 INDUSTRY SNAPSHOT... 7 OCCUPATION SNAPSHOT... 9 INDUSTRY
5200 Ocean Blvd, Siesta Key, FL 34242
 Siesta Key Restaurant- BEST LOCATION IN THE VILLAGE! 5200 Ocean Blvd, Siesta Key, FL 34242 Listing ID: 29826583 Status: Active Property Type: Business Opportunity For Sale Industry: Food and Beverage Size:
DEMOGRAPHIC PROFILE...3 EMPLOYMENT TRENDS...5 UNEMPLOYMENT RATE...5 WAGE TRENDS...6 COST OF LIVING INDEX...6 INDUSTRY SNAPSHOT...7
 March 14, 2017 DEMOGRAPHIC PROFILE...3 EMPLOYMENT TRENDS...5 UNEMPLOYMENT RATE...5 WAGE TRENDS...6 COST OF LIVING INDEX...6 INDUSTRY SNAPSHOT...7 OCCUPATION SNAPSHOT...9 INDUSTRY CLUSTERS... 12 EDUCATION
Gain Deeper Insights for Better Targeting. Report Date: 00/00/2016
 Gain Deeper Insights for Better Targeting Report Date: 00/00/2016 SnapShot Summary Record Input Summary: Record Type Records Input Matched Match Rate Customers 2,359 1,865 79.1 % Having enough records