Scenarios and drivers - for High & Low salmon prices 2018
|
|
|
- Suzan Peters
- 5 years ago
- Views:
Transcription


1 Scenarios and drivers - for High & Low salmon prices 2018 BRUSSELS SEMINAR Hotel Bloom 23rd Apr 2018 by Ragnar Nystøyl
2 Atlantic Salmon Market Development All markets / / e 18/17 Q ,1 % ,8 % ,1 % Q ,8 % ,6 % ,0 % Q ,2 % ,0 % ,5 % Q ,8 % ,7 % ,4 % Total ,7 % ,7 % ,7 % Q1: EU: tonnes (+ 6,7 %) USA: tonnes (+ 6,9 %) Japan: tonnes (- 2,0 %) Russia: tonnes (+ 38 %) All Others: tonnes (+ 12,4 %) Totalt: tonnes (+ 9,1 %) Price Change Q1: In NOK: - 8 % In EUR: - 14 %


3 Development through the quarter. A different story Supply All Markets Spot price change In NOK (& EUR)


4 Feedsales development ; Including 2017 EUROPA AMERICAS
5 Outlook; Harvest volume Atlantic salmon Expectations can change swiftly Our estimate Medio Jan 2018: + 7 % : tonn WFE Our estimate Ultimo April 2018: + 4 % : tonn WFE - What did happen during these 3 months?
6 Feedsales Europe; Q1-18 Norway: tonnes (- 4%) Scotland: tonnes (-25 %) Færøyene: tonnes (- 20%) Total sample: tonnes ( - 8 %)
7 Feedsales Americas; Q1-18 Chile: tonnes (+ 6 %) Herof Atlantics: tonnes (+ 4 %) North America: tonnes (+ 10 %) Americas - Atlantic tonnes (+ 6 %)
8 Relative Feeding; Atlantics Chile

9 Relative Feeding; Atlantics Norway

10 NOK / Kilo Contract prices (& Contract-level) 80,00 70,00 60,00 SSB Nasdaq +1,00 +2,16 +0,25 +2,95-0,74-0,49-3,03-4,34-1,60 50,00 40,00-2,45-2,67-2,80-1,72 30,00 20,00 10,00 0,00 Q1 Q2 Q3 Q4 Q1 Q2 Q3 Q4 Q1 Q2 Q3 Q4 Q
11 European price vs. American price
 Chile + 33 000 tonnes (+ 25")
12 Americas Atlantic Salmon Harvest Estimates per Quarter Hereof: North America tonnes (+ 2 %) Chile tonnes (+ 25 %)
13 US West Coast; Fresh Whole Strong large-fish premium

14 Europe Atlantic Salmon Harvest Estimates per Quarter
15 EU Major growth countries Q Q1-17 Q1-18e Chg. % Chg. Volume France % UK % Italy % Belgium % Finland % Sweden % Spain % 940 Portugal % 670 Netherlands % 590 Germany %


16 Fresh salmon Retail price level; «Not competitive» or Change of league?


17 Fresh salmon Retail price level; «Not competitive» or Change of league?
18 Alternative Europe Supply Scenario - Second Half 18 Focus Norway

19 Norway; Relative Feeding «Before» and «Now»
20 2018; A «late» cold winter / Cold spring Also affecting end-april- & May-growth
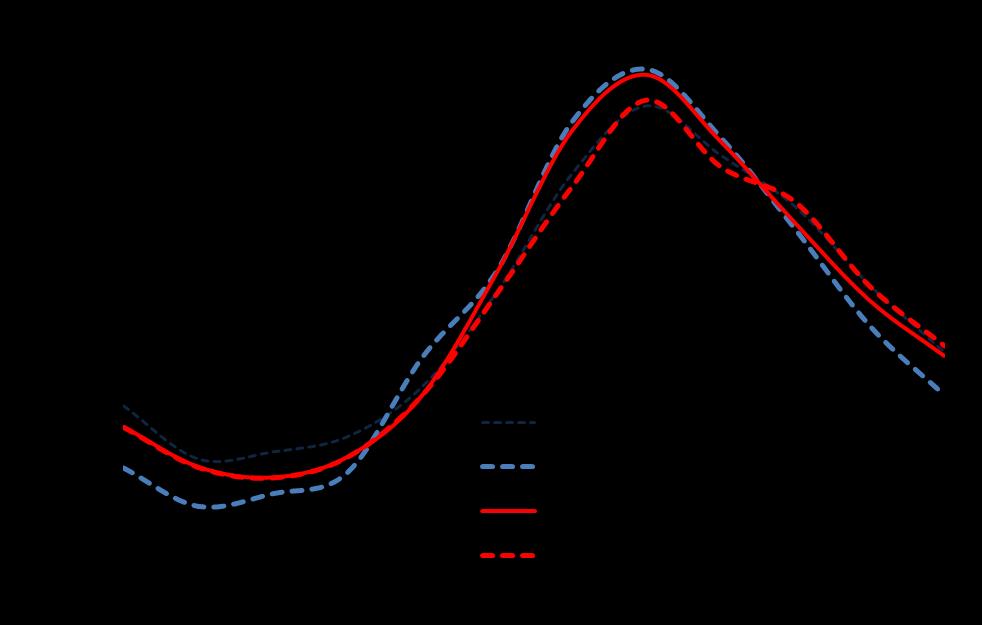
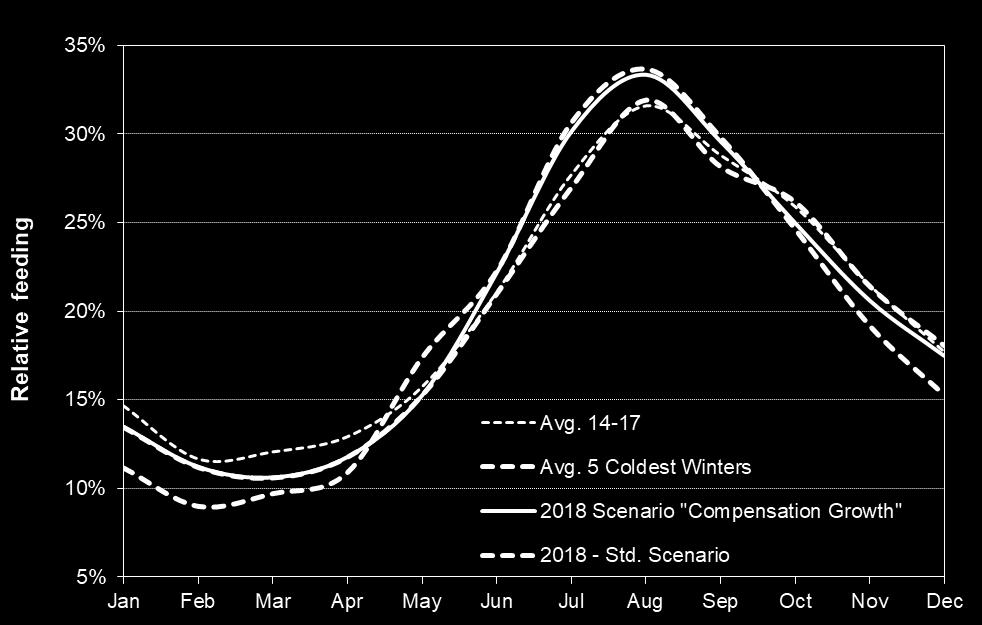
21 Compensation Growth?? Second Half 2018??
22 Compensation Growth 2nd Half 18 Effects vs. Std. Scenario... July December 2018: Increased Feedconsumption: Increased Harvest volume: tonnes tonnes WFE Hereof Q tonnes «Hereof Q tonnes «Increased Average Harvest weight + 0,10 0,12 kilo

23 Scenarios For High / Low Salmon Prices
24 Q Spot Price? (In NOK) Scenario A: At Q level (Mid) Still decline feedsales Europe May picking up in June Scenario B: At Q level (Low) Retail price level shifts up (Fresh) + No campaigns. Current price level hampering Asia / China sales Chile presence Compensation growth already from May. Scenario C: Over Q2-level (High) Asia sales
25 Second Half Scenario A: 2016-level (NOK 61 66; High) No compensation growth Sea-lice combat not making this possible Further challenges Scotland, Faroes, Iceland Chile productivity declines.. EUR / NOK stilll above 9,50. Absence China grey trade -> Spurring demand/smoothing normal channels.. Scenario B: 2017-level (NOK 50 56; Low) Q2-18» - Slow harvests May /June -Europe yet production picks up Compensation growth in Norway + other Europe Chile surprise positively with respect to productivity & Growth pressure US The price-hike from Q1-Q2, has seriously hampered demand in Europe No campaigns in Q3, Reluctance from buyers EUR / NOK below 9,30 - New protectionism measures from China? Scenario C: As Fishpool (NOK 57 60; Mid) A mix of Scenario A & B?
26 Playing with statistics.. Last 15 years; - Norwegian Spot price (NOK) How many years have 2nd Half price, been below the April-price? How many years have the Q2-price, been higher than the Q1-price? How many years have the 2nd Half price, been more than 5 % below the Q2-price? How many years have the 2nd Half price, been more than 10 % below the Q2-price? How many years have the Q4-price been higher than the Q3-price?
27 Last 15 years; - Norwegian Spot price (NOK) 2nd Half price, below the April-price? 11 out of 15 5 out of 6 with «Cold winters» Q2-price, higher than the Q1-price? 9 out of 15 5 out of 6 with «Cold winters» 2nd Half price, more than 5 % below the Q2-price? 9 out of 15 5 out of 6 with «Cold winters» 2nd Half price, more than 10 % below the Q2-price? 4 out of 15 3 out of 6 with «Cold winters» Q4-price, higher than the Q3-price? 6 out of 15 (Hereof 5 during the last 6 years) 1 out of 6 with «Cold winters»

28 Thank you for the attention
The answers to your questions.
 The answers to your questions. By / Ragnar Nystøyl CHRISTMAS SEMINAR Bergen, 19. November 2014 Agenda - Norwegian Production & Supply issues - Global Production & Supply issues - Market- & Price-related
Salmon price, demand and market trends
 Salmon price, demand and market trends Kolbjørn Giskeødegård, Director 21 November 2018 Salmon supply growth dramaticly down after 2012 2 500 2013-17: CAGR 2% 2 000 1 500 2003-12: CAGR 8% 1 000 500 0 2003
Weekly Salmon Outlook Week
 Week 10-20 Page 1 of 8 Harvest of Atlantic salmon in Norway continued to grow in week 9. The harvest volume (23 000 tonnes wfe) was up 1000 tonnes from the previous week and 3% higher than in the corresponding
Q May 12th Oslo
 Q1 2016 May 12th Oslo Lerøy Seafood Group ASA CEO Henning Beltestad CFO Sjur S. Malm Agenda Highlights Key financial figures Outlook Q1 2016 EBIT before FV adj. NOK 584.5 million EBIT/kg all inclusive
Fishpool Christmas Seminar 2017 Bearish signals going into 2018
 Photo: SB1 Markets SEAFOOD SALMON FARMING Fishpool Christmas Seminar 2017 Bearish signals going into 2018 Tore A. Tønseth Phone : (+47) 24 14 74 18 Mobile : (+47) 95 80 62 77 E-mail : tore.tonseth@sb1markets.no
Lerøy Seafood Group SEPTEMBER 2018
 Lerøy Seafood Group SEPTEMBER 2018 1. Lerøy Seafood Group 2. Key market trends supply and demand Our vision To be the leading and most profitable global supplier of sustainable high-quality seafood History
Marine Harvest. Q Presentation 10 May 2017
 Marine Harvest Q1 2017 Presentation 10 May 2017 1 Forward looking statements This presentation may be deemed to include forward-looking statements, such as statements that relate to Marine Harvest s contracted
Q BAKKAFROST GROUP Oslo 20 February 2018
 BAKKAFROST GROUP Oslo 20 February 2018 DISCLAIMER This presentation includes statements regarding future results, which are subject to risks and uncertainties. Consequently, actual results may differ significantly
Marine Harvest. Q Presentation 24 August 2017
 Marine Harvest Q2 2017 Presentation 24 August 2017 1 Forward looking statements This presentation may be deemed to include forward-looking statements, such as statements that relate to Marine Harvest s
 - - - - - - - 20 000 15 000 10 000 5 000 0 2017 2014 2013 2012 2011 2010 2009 2008 2007 2006 2005 2004 2003 2002 2001 2000 1999 1995 1 400 30 1 200 25 1 000 800 600 400 777 20 15 10 16,5 200 5 0 0 Q4/17
Presentation of Cermaq
 Presentation of Cermaq North Atlantic Seafood Seminar Oslo, 8 th March 2012 Agenda Introduction to Cermaq Key results 2011 Focus on Mainstream Chile Outlook 2012 Photograph: Alf Børjesson 2 This is Cermaq
Questions - Fishpool seminar Bergen
 Questions - Fishpool seminar Bergen Paul Aandahl, Seafood Analyst, Norwegian Seafood Council 22.11.2018 Global supply Global Trade Estimates Atlantic Salmon Volume wfe Value 2 000 000 1 800 000 1 600 000
Marine Harvest. Q Presentation 1 November 2017
 Marine Harvest 1 Q3 2017 Presentation 1 November 2017 Forward looking statements This presentation may be deemed to include forward-looking statements, such as statements that relate to Marine Harvest
Q BAKKAFROST GROUP Oslo 19 February 2019
 BAKKAFROST GROUP Oslo 19 February 2019 DISCLAIMER This presentation includes statements regarding future results, which are subject to risks and uncertainties. Consequently, actual results may differ significantly
Marine Harvest. Q Presentation 14 February 2018
 Marine Harvest Q4 2017 Presentation 14 February 2018 1 Forward looking statements This presentation may be deemed to include forward-looking statements, such as statements that relate to Marine Harvest
Lerøy Seafood Group. Quarterly report First quarter May 12th Helge Singelstad. Henning Beltestad. Ivan Vindheim.
 Lerøy Seafood Group Quarterly report First quarter 2010 May 12th 2010 Helge Singelstad Chairman Henning Beltestad CEO Ivan Vindheim CFO 1 Agenda 1. 1 Considerations 2. 2 Key financial figures Q1 2010 3.
Chilean volume reduction Impact on global markets. North Atlantic Seafood Forum Steven Rafferty CFO Cermaq ASA 5 March 2009
 Chilean volume reduction Impact on global markets North Atlantic Seafood Forum Steven Rafferty CFO Cermaq ASA 5 March 2009 Context Chilean Atlantic salmon supply will drop by 50% + in 2009 Further drop
Operating revenue NOK million Operational EBIT NOK million. Harvest volume (HOG) tonnes Q3 09 Q4 09 Q1 10 Q2 10 Q3 10
 tonnes Q3 09 Q4 09 Q1 10 Q2 10 Q3 10") Solid performance in a strong market Strong price achievement and solid results in Norway Return on Capital Employed of 18.9% in the quarter Favourable market balance expected to support a strong market
Solid performance in a strong market Strong price achievement and solid results in Norway Return on Capital Employed of 18.9% in the quarter Favourable market balance expected to support a strong market
Marine Harvest Q Presentation
 Marine Harvest Q2 2015 Presentation Forward looking statements This presentation may be deemed to include forward-looking statements, such as statements that relate to Marine Harvest s contracted volumes,
Marine Harvest. Q Presentation 22 August 2018
 Marine Harvest Q2 2018 Presentation 22 August 2018 Forward looking statements This presentation may be deemed to include forward-looking statements, such as statements that relate to Marine Harvest s contracted
Financial wealth of private households worldwide
 Economic Research Financial wealth of private households worldwide Munich, October 217 Recovery in turbulent times Assets and liabilities of private households worldwide in EUR trillion and annualrate
Q BAKKAFROST GROUP Oslo 21 August 2018
 BAKKAFROST GROUP Oslo 21 August DISCLAIMER This presentation includes statements regarding future results, which are subject to risks and uncertainties. Consequently, actual results may differ significantly
NORWAY ROYA L S A L M ON PRESENTATION Q Oslo, 7 November 2017 Charles Høstlund, CEO Ola Loe, CFO 1
 PRESENTATION Q3 2017 Oslo, 7 November 2017 Charles Høstlund, CEO Ola Loe, CFO 1 AGENDA: Highlights for the period Segment information Group financials Markets Outlook 2 Highlights in Q3 2017 Operational
Lerøy Seafood Group. Quarterly report Second quarter August 19th Helge Singelstad. Ivan Vindheim CEO CFO
 Lerøy Seafood Group Quarterly report Second quarter 2009 August 19th 2009 Helge Singelstad CEO Ivan Vindheim CFO 1 Agenda 1. 1 Considerations 2. 2 Key financial figures Q2 2009 3. 3 Lerøy at a glance 4.
Q MAY 8TH 2018
 Q1 2018 MAY 8TH 2018 1. Highlights 2. Key Financial Figures 3. Outlook Highlights Klikke for å legge til annet bilde Q1 2018 - EBIT beforefv adj. NOK 960 million - Harvest volume 37576 GWT - EBIT/kg all
Q November 9th. Lerøy Seafood Group ASA. CEO Henning Beltestad CFO Sjur S. Malm
 Q3 2017 November 9th Lerøy Seafood Group ASA CEO Henning Beltestad CFO Sjur S. Malm Agenda Highlights Key financial figures Outlook Q3 2017 EBIT before FV adj. NOK 861 million Harvest volume 46 024 GWT
Lerøy Seafood Group. Preliminary financial figures February 25th Helge Singelstad. Alf-Helge Aarskog. Ivan Vindheim.
 Lerøy Seafood Group Preliminary financial figures 2009 February 25th 2010 Helge Singelstad Chairman Alf-Helge Aarskog CEO Ivan Vindheim CFO 1 Agenda 1. 1 Considerations 2. 2 Key financial figures Q4 2009
Costs related to Equity Trading
 Costs related to Equity Trading 1. Overview of costs When you buy or sell shares you pay a fee to DNB. The fee is a transaction cost paid when the trade is settled. 1.1 Brokerage fee for Norwegian Shares
Q NOVEMBER 8TH 2018
 Q3 2018 NOVEMBER 8TH 2018 1. Highlights 2. Key Financial Figures 3. Outlook Highlights Klikke for å legge til annet bilde Q3 2018 - EBIT before FV adj. NOK 660 million - Harvest volume 37 227 GWT - EBIT/kg
Corrigendum. OECD Pensions Outlook 2012 DOI: ISBN (print) ISBN (PDF) OECD 2012
 ISBN (PDF) OECD 2012") OECD Pensions Outlook 2012 DOI: http://dx.doi.org/9789264169401-en ISBN 978-92-64-16939-5 (print) ISBN 978-92-64-16940-1 (PDF) OECD 2012 Corrigendum Page 21: Figure 1.1. Average annual real net investment
OECD Pensions Outlook 2012 DOI: http://dx.doi.org/9789264169401-en ISBN 978-92-64-16939-5 (print) ISBN 978-92-64-16940-1 (PDF) OECD 2012 Corrigendum Page 21: Figure 1.1. Average annual real net investment
SalMar ASA. Presentation Q CEO Yngve Myhre, CFO Trond Tuvstein Oslo, 14 November w w w. s a l m a r. n o
 Presentation Q3 2013 SalMar ASA CEO Yngve Myhre, CFO Trond Tuvstein Oslo, 14 November 2013 2 Agenda Highlights Financial update Operational update Market and outlook Third quarter highlights Another strong
International Statistical Release
 International Statistical Release This release and additional tables of international statistics are available on efama s website (www.efama.org) Worldwide Investment Fund Assets and Flows Trends in the
Highlights for the quarter Q2 / EBIT NOK 60 million pre biomass write-down
 Half year report Highlights for the quarter EBIT NOK 60 million pre biomass write-down EBIT pre fair value and biomass write-down (NOK million) 318 348 300 101 60 Mainstream results negatively impacted
Q August 24th. Lerøy Seafood Group ASA. CEO Henning Beltestad CFO Sjur S. Malm
 Q2 2017 August 24th Lerøy Seafood Group ASA CEO Henning Beltestad CFO Sjur S. Malm Agenda Highlights Key financial figures Outlook Q2 2017 EBIT before FV adj. NOK 801 million Harvest volume 26 156 GWT
Understanding the wildfish harvesting business. Webjørn Barstad CEO HAVFISK ASA
 Understanding the wildfish harvesting business Webjørn Barstad CEO HAVFISK ASA HAVFISK ASA Agenda The Global Picture Supply side Markets From science to individual vessel quotas Norwegian fisheries and
RS Platou Markets. Seafood conference. 10th June 2010
 RS Platou Markets Seafood conference 10th June 2010 Agenda Introduction to Cermaq Highlights Q1 2010 and outlook full year Chile Recovery 2 Overview of Cermaq One of the global leaders in the aquaculture
PRESENTATION Q Oslo, 26 February 2014 John Binde, CEO Ola Loe, CFO
 PRESENTATION Q4 2013 Oslo, 26 February 2014 John Binde, CEO Ola Loe, CFO AGENDA: Highlights for the period Segment information Group financials Outlook 2 Highlights in Q4 2013: The best quarterly and yearly
Appendix 2 to Fish Pool Rulebook
 Appendix 2 to Fish Pool Rulebook Calculation of settlement price (FPI) Table of contents: Table of contents:... 1 General provisions... 2 Purpose of Fish Pool Index TM (FPI)... 2 Access to Fish Pool Index...
International Statistical Release
 International Statistical Release This release and additional tables of international statistics are available on efama s website (www.efama.org). Worldwide Regulated Open-ended Fund Assets and Flows Trends
International Statistical Release
 International Statistical Release This release and additional tables of international statistics are available on efama s website (www.efama.org). Worldwide Investment Fund Assets and Flows Trends in the
International Statistical Release
 International Statistical Release This release and additional tables of international statistics are available on efama s website (www.efama.org). Worldwide Investment Fund Assets and Flows Trends in the
Interim Report Q2-18
 Interim Report Q2-18 HIGHLIGHTS Operational EBIT of NOK 181 million o Operational EBIT per kg of NOK 24.73 in Region North o Operational EBIT per kg of NOK 23.49 in Region South o Non-recurring item of
Villa Organic AS fourth quarter 2012
 Notice to shareholders; Villa Organic AS fourth quarter 2012 Highlights fourth quarter 2012 The average prices were approximately at the same level as Q3, but improvement was observed towards the end of
International Statistical Release
 International Statistical Release This release and additional tables of international statistics are available on efama s website (www.efama.org) Worldwide Investment Fund Assets and Flows Trends in the
Advice September Herring in Subareas I, II, and V, and in Divisions IVa and XIVa (Norwegian spring-spawning herring).
.") 9.3.11 Advice September 2014 ECOREGION STOCK Widely distributed and migratory stocks Herring in Subareas I, II, and V, and in Divisions IVa and XIVa (Norwegian spring-spawning herring) Advice for 2015
9.3.11 Advice September 2014 ECOREGION STOCK Widely distributed and migratory stocks Herring in Subareas I, II, and V, and in Divisions IVa and XIVa (Norwegian spring-spawning herring) Advice for 2015
International Statistical Release
 International Statistical Release This release and additional tables of international statistics are available on efama s website (www.efama.org). wide Regulated Open-ended Fund Assets and Flows Trends
Q1 Financial Presentation. Arne Møgster CEO Britt K. Drivenes - CFO
 Q1 Financial Presentation Arne Møgster CEO Britt K. Drivenes - CFO As a globally integrated pelagic fishery and seafood specialist, (AUSS) operates through subsidiaries and associated companies, fishing
Green Climate Fund Trust Fund Financial Report as of 31 December 2015
 Meeting of the Board 8 10 March 2016 Songdo, Incheon, Republic of Korea Provisional agenda item 25 GCF/B.12/Inf.09 4 March 2016 Green Climate Fund Financial Report as of 31 December 2015 Summary The financial
SalMar ASA First quarter
 SalMar ASA First quarter 2009 1 STRONG SALMON PRICES AND SATISFACTORY EARNINGS Strong salmon prices contributed to satisfactory earnings for the SalMar Group in the first quarter 2009. While Scottish Sea
International Statistical Release
 International Statistical Release This release and additional tables of international statistics are available on efama s website (www.efama.org) Worldwide Investment Fund Assets and Flows Trends in the
Growth has peaked amidst escalating risks
 OECD ECONOMIC OUTLOOK Growth has peaked amidst escalating risks 1 November 18 Ángel Gurría OECD Secretary-General Laurence Boone OECD Chief Economist http://www.oecd.org/eco/outlook/economic-outlook/ ECOSCOPE
Marine Harvest Q Presentation
 Marine Harvest Q2 2014 Presentation Forward looking statements This presentation may be deemed to include forward-looking statements, such as statements that relate to Marine Harvest s contracted volumes,
HELSINKI TOURISM STATISTICS APRIL 2016
 HELSINKI TOURISM STATISTICS APRIL 2016 Bednights up 14 per cent In April 2016, 247,000 overnight stays were recorded in Helsinki, of which 128,000 were spent by domestic visitors and 119,000 nights by
Chile, que pasa? -an update of the situation for salmon farming in Chile, - issues and potential solutions
 Chile, que pasa? -an update of the situation for salmon farming in Chile, - issues and potential solutions Intrafish / DNB investor conference London, 4 November, 2015 Jon Hindar CEO Cermaq Group The starting
Consumer & Retail Conference
 Consumer & Retail Conference 3.12.13 Brad Dickerson CHief financial officer FORWARD LOOKING STATEMENTS Some of the statements in this presentation and our responses to various questions may constitute
DnB NOR Group 1st half and 2nd quarter 2010 results. Bjørn Erik Næss, chief financial officer
 DnB NOR Group 1st half and 2nd quarter 2010 results Rune Bjerke, group chief executive Rune Bjerke, group chief executive Bjørn Erik Næss, chief financial officer 1st half and 2nd quarter 2010 Rising credit
Marine Harvest Q Presentation
 Marine Harvest Q1 2014 Presentation Forward looking statements This presentation may be deemed to include forward-looking statements, such as statements that relate to Marine Harvest s contracted volumes,
The euro area in a globalized economy: An ESM perspective
 The euro area in a globalized economy: An ESM perspective Rolf Strauch, Chief Economist, Member of the Management Board 3 rd Annual BBVA European Debt Conference New York, 4 October 217 The euro area:
Fiscal Projections in OECD Countries: What is produced and what lessons can be learned?
 Fiscal Projections in OECD Countries: What is produced and what lessons can be learned? James Sheppard Policy Analyst, Public Governance and Territorial Development Directorate Joint OECD-IPSASB Seminar
3Q Financial Results Presentation. Manuel Fernandez de Sousa-Faro, Chairman Joaquín Viña Tamargo, CAO & IR
 3Q 211- Financial Results Presentation Manuel Fernandez de Sousa-Faro, Chairman Joaquín Viña Tamargo, CAO & IR Disclaimer This document is purely informative and does not intend to be comprehensive. Financial
Marine Harvest Q Presentation
 Marine Harvest Q1 2015 Presentation Forward looking statements This presentation may be deemed to include forward-looking statements, such as statements that relate to Marine Harvest s contracted volumes,
Annuities: a private solution to longevity risk
 Annuities: a private solution to longevity risk Product & Knowledge Fair 2007 Rüschlikon 30 March 2007 Thomas Hess Head of Economic Research & Consulting Veronica Scotti Client Solutions Need for private
Turkey s Saving Deficit Issue From an Institutional Perspective
 Turkey s Saving Deficit Issue From an Institutional Perspective Engin KURUN, Ph.D CEO, Ziraat Asset Management Oct. 25th, 2011 - Istanbul 1 PRESENTATION Household and Institutional Savings Institutional
Spain France. England Netherlands. Wales Ukraine. Republic of Ireland Czech Republic. Romania Albania. Serbia Israel. FYR Macedonia Latvia
 Germany Belgium Portugal Spain France Switzerland Italy England Netherlands Iceland Poland Croatia Slovakia Russia Austria Wales Ukraine Sweden Bosnia-Herzegovina Republic of Ireland Czech Republic Turkey
Strong platform in Norway. Untapped opportunities for profitable growth
 Strong platform in Norway Untapped opportunities for profitable growth 2 Strong market shares Well positioned in home market product areas and customer segments Retail market Lending Deposits Policyholders
CONDITIONS FOR PRIVATE BANKING AND TREASURY SALES. Valid Since
 CONDITIONS FOR PRIVATE BANKING AND TREASURY SALES Valid Since 02.01.2018 Private Banking Version 8 This list of fees is a supplement to the published general list of fees of DenizBank AG. The general list
EU-28 STEEL SCRAP STATISTICS. by Rolf Willeke Statistics Advisor of the BIR Ferrous Division For EFR a branch of EuRIC (30 October 2017)
") EU-28 STEEL SCRAP STATISTICS (JANUARY JUNE 2017) by Rolf Willeke Statistics Advisor of the BIR Ferrous Division For EFR a branch of EuRIC (30 October 2017) C O N T E N T S EU-28 and World Crude Steel Production
EU-28 STEEL SCRAP STATISTICS (JANUARY JUNE 2017) by Rolf Willeke Statistics Advisor of the BIR Ferrous Division For EFR a branch of EuRIC (30 October 2017) C O N T E N T S EU-28 and World Crude Steel Production
Enterprise Europe Network SME growth outlook
 Enterprise Europe Network SME growth outlook 2018-19 een.ec.europa.eu 2 Enterprise Europe Network SME growth outlook 2018-19 Foreword The European Commission wants to ensure that small and medium-sized
Introduction to NORWAY
 Introduction to NORWAY As a result of North Sea oil and gas, Norway has become one of the richest countries in Europe in terms of income per capita. The revenues from the petroleum industry have allowed
Building the expert platform for Asian investments. asiafundmanagers.com
 Building the expert platform for Asian investments 1 There is a gap of 9 trn. USD 9 21 trn. USD if allocated to world GDP** 12trn. USD today* trn. USD * 17,29 percent of world equity market cap (MSCI,
Approach to Employment Injury (EI) compensation benefits in the EU and OECD
 compensation benefits in the EU and OECD") Approach to (EI) compensation benefits in the EU and OECD The benefits of protection can be divided in three main groups. The cash benefits include disability pensions, survivor's pensions and other short-
Approach to (EI) compensation benefits in the EU and OECD The benefits of protection can be divided in three main groups. The cash benefits include disability pensions, survivor's pensions and other short-
IFC / CWDI 2010 Report: Accelerating Board Diversity
 IFC / CWDI 2010 Report: Accelerating Board Diversity Comparative Percentages of Women Directors -- Europe Country # of in Survey Percentage of with Women Directors Percent of Women Directors Norway 517
May 2012 Euro area international trade in goods surplus of 6.9 bn euro 3.8 bn euro deficit for EU27
 108/2012-16 July 2012 May 2012 Euro area international trade in goods surplus of 6.9 3.8 deficit for EU27 The first estimate for the euro area 1 (EA17) trade in goods balance with the rest of the world
The Economics of Public Health Care Reform in Advanced and Emerging Economies
 The Economics of Public Health Care Reform in Advanced and Emerging Economies Benedict Clements Fiscal Affairs Department, IMF November 2012 This presentation represents the views of the author and should
PENSIONS IN OECD COUNTRIES: INDICATORS AND DEVELOPMENTS
 PENSIONS IN OECD COUNTRIES: INDICATORS AND DEVELOPMENTS Marius Lüske Directorate for Employment, Labour and Social Affairs, OECD Lisbon, 28.09.2018 Marius.LUSKE@oecd.org www.oecd.org/els OUTLINE Talk based
Lithuania: in a wind of change. Robertas Dargis President of the Lithuanian Confederation of Industrialists
 Lithuania: in a wind of change Robertas Dargis President of the Lithuanian Confederation of Industrialists 2017 06 15 Lithuanian Confederation of Industrialists - the largest business organisation in Lithuania
15,000 12, , , , ,158 13,004 12, , ,664
 15,000 12,000 13,004 10,934 12,940 13,158 10,664 350 307 300 9,000 335 255 254 30 26.34 21.58 22.26 23.22 16 Q2 16 Q3 16 24.33 20 200 6,000 10 100 3,000 0 400 16 Q2 16 Q3 16 Q4 16 17 0 16 Q2 16 Q3 16 Q4
Stronger growth, but risks loom large
 OECD ECONOMIC OUTLOOK Stronger growth, but risks loom large Ángel Gurría OECD Secretary-General Álvaro S. Pereira OECD Chief Economist ad interim Paris, 3 May Global growth will be around 4% Investment
June 2014 Euro area international trade in goods surplus 16.8 bn 2.9 bn surplus for EU28
 127/2014-18 August 2014 June 2014 Euro area international trade in goods surplus 16.8 bn 2.9 bn surplus for EU28 The first estimate for the euro area 1 (EA18) trade in goods balance with the rest of the
June 2012 Euro area international trade in goods surplus of 14.9 bn euro 0.4 bn euro surplus for EU27
 121/2012-17 August 2012 June 2012 Euro area international trade in goods surplus of 14.9 0.4 surplus for EU27 The first estimate for the euro area 1 (EA17) trade in goods balance with the rest of the world
Sølvtrans Holding ASA Q Oslo, 14 August Roger Halsebakk, CEO Jon Kvalø, CFO
 Sølvtrans Holding ASA Q2 2012 Oslo, 14 August 2012 Roger Halsebakk, CEO Jon Kvalø, CFO 1 Highlights in the quarter 2 Financial review 3 Operational and market review 5 Summary and outlook 6 Appendix Highlights
AIECE Spring Meeting General Report. Bologna, 12/13 May Ferdinand Fichtner, Christoph Große Steffen, Michael Hachula DIW Berlin
 AIECE Spring Meeting 2016 General Report Ferdinand Fichtner, Christoph Große Steffen, Michael Hachula DIW Berlin Overview: Discussion of General Report Thursday Friday 14.30 14.45 14.45 16.00 16.20 16.35
August 2012 Euro area international trade in goods surplus of 6.6 bn euro 12.6 bn euro deficit for EU27
 146/2012-16 October 2012 August 2012 Euro area international trade in goods surplus of 6.6 12.6 deficit for EU27 The first estimate for the euro area 1 (EA17) trade in goods balance with the rest of the
Please note: The present advice replaces the catch advice given for 2017 (in September 2016) and the catch advice given for 2018 (in September 2017).
 and the catch advice given for 2018 (in September 2017).") ICES Advice on fishing opportunities, catch, and effort Northeast Atlantic and Arctic Ocean Published 29 September 2017 Version 2: 30 October 2017, Version 3: 23 January 2018 DOI: 10.17895/ices.pub.3392
ICES Advice on fishing opportunities, catch, and effort Northeast Atlantic and Arctic Ocean Published 29 September 2017 Version 2: 30 October 2017, Version 3: 23 January 2018 DOI: 10.17895/ices.pub.3392
Can performance continue?
 Can performance continue? UBS 13 th Annual Nordic Financial Services Conference 2 September 21 CEO Rune Bjerke Strong pre-crisis position 35 3 25 2 15 1 5 3 25 2 15 1 5 2 4 Pre-crisis market capitalisation
SECOND QUARTER and FIRST HALF 2012
 SECOND QUARTER and FIRST HALF 2012 Highlights from second quarter 2012 include: Revenues of 948 MNOK (952 MNOK in second quarter 2011) Unchanged in local currencies +4% in Sorting Solutions - 2% in Collection
Second Quarter Trading Update 9 July 2010
 Second Quarter Trading Update 9 July 2010 Michael Page International Second Quarter Trading Update 2010 2 Group gross profit Constant Group gross profit m m Reported exchange 2010 vs 2009 111.5 83.8 +33.1%
Q Financial presentation. Arne Møgster CEO Britt Kathrine Drivenes CFO
 Q2 2015 Financial presentation Arne Møgster CEO Britt Kathrine Drivenes CFO Highlights All figures in NOK 1,000 Q2 2015 (restated) Q2 2014 H1 2015 (restated) H1 2014 2014 Revenue 4 107 801 3 606 154 7
P/F Bakkafrost Condensed Consolidated Interim Report for Q and 9 months 2013
 P/F Bakkafrost Condensed Consolidated Interim Report for Q3 2013 and 9 months 2013 15000 10000 5000 0 Harvest volume - TGW Q3 12 Q4 12 Q1 13 Q2 13 Q3 13 Operational EBIT mdkk 200 150 100 50 0 Q3 12 Q4
PRESENTATION Q Oslo, 15 August 2013 John Binde, CEO Ola Loe, CFO
 PRESENTATION Q2 2013 Oslo, 15 August 2013 John Binde, CEO Ola Loe, CFO AGENDA: Highlights for the period Segment information Group financials Outlook 2 Highlights in Q2 2013: Best quarterly operational
ECFIN-C3 (2009) PART 1 MAIN DEVELOPMENTS
 PART 1 MAIN DEVELOPMENTS") ECFIN-C3 (2009) PART 1 MAIN DEVELOPMENTS Methodological note Since the issue for the second quarter of 2004, nominal and real effective exchange rates presented in this report are calculated based on a
ECFIN-C3 (2009) PART 1 MAIN DEVELOPMENTS Methodological note Since the issue for the second quarter of 2004, nominal and real effective exchange rates presented in this report are calculated based on a
THE AFRICA OPPORTUNITY
 PETER WELBORN THE AFRICA OPPORTUNITY API CONFERENCE 2016 Africa: the growth 1continent AFRICA S POPULATION GROWTH Africa has the fastest population growth of any global region. Africa s population has
EU Market Situation for Poultry. Committee for the Common Organisation of the Agricultural Markets 22 March 2018
 EU Market Situation for Poultry Committee for the Common Organisation of the Agricultural Markets 22 March 218 -.2% -.8% -1.1% -2.4% -2.9% -3.3% -4.2% -4.5% 5.1% 4.6% 4.5% 3.8% 3.3% 2.7% 2.4% 1.5% 1.1%
Name Organisation Date
 European Public Leadership Driving Innovation In Construction and Operations Name Organisation Date Construction: declining productivity and low digitalisation Productivity Digitalisation Other non-farm
ILLUSTRATIVE SCENARIOS FOR GEF-5 CONTRIBUTIONS
 Fifth Meeting for the Fifth Replenishment of the GEF Trust Fund March 9-10, 2010 Rome, Italy GEF/R.5/27 February 16, 2010 ILLUSTRATIVE SCENARIOS FOR GEF-5 CONTRIBUTIONS (PREPARED BY THE WORLD BANK AS TRUSTEE)
Public Pension Spending Trends and Outlook in Emerging Europe. Benedict Clements Fiscal Affairs Department International Monetary Fund March 2013
 Public Pension Spending Trends and Outlook in Emerging Europe Benedict Clements Fiscal Affairs Department International Monetary Fund March 13 Plan of Presentation I. Trends and drivers of public pension
San Francisco Retiree Health Care Trust Fund Education Materials on Public Equity
 M E K E T A I N V E S T M E N T G R O U P 5796 ARMADA DRIVE SUITE 110 CARLSBAD CA 92008 760 795 3450 fax 760 795 3445 www.meketagroup.com The Global Equity Opportunity Set MSCI All Country World 1 Index
2017 Asia and Pacific Regional Economic Outlook:
 217 Asia and Pacific Regional Economic Outlook: Preparing for Choppy Seas Ranil Salgado International Monetary Fund Asia and Pacific Department May 12, 217 OAP Seminar Key messages and roadmap The near-term
HORIZON The EU Framework Programme for Research and Innovation. Open to the World. Mary Kavanagh
 HORIZON 2020 The EU Framework Programme for Research and Innovation Open to the World Mary Kavanagh European Union Delegation: Research and Innovation What is Horizon 2020? The EU s programme for research
Aging, the Future of Work and Sustainability of Pension System
 Aging, the Future of Work and Sustainability of Pension System WKÖ & Salzburg Global Seminar Event Dénes Kucsera Agenda Austria Vienna, Austria November 5, 2015 Introduction Increasing pressure on the