Marine Harvest Q Presentation
|
|
|
- Beryl Flynn
- 5 years ago
- Views:
Transcription

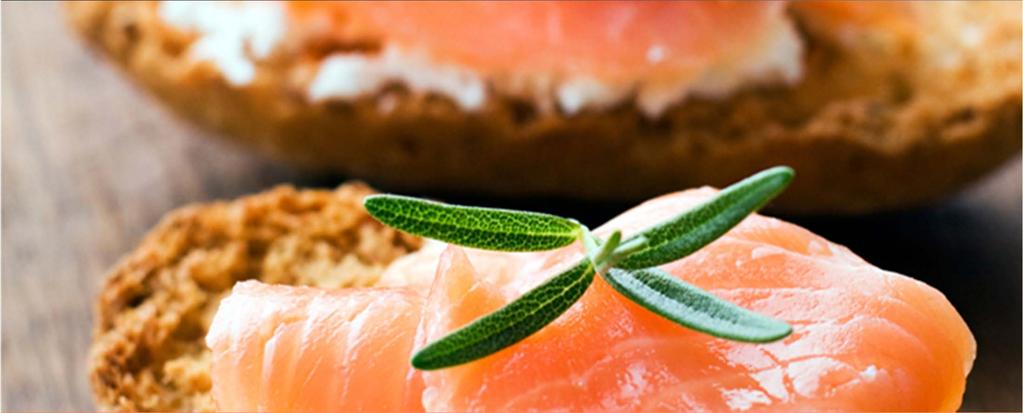
1 Marine Harvest Q Presentation
2 Forward looking statements This presentation may be deemed to include forward-looking statements, such as statements that relate to Marine Harvest s contracted volumes, goals and strategies, including strategic focus areas, salmon prices, ability to increase or vary harvest volume, production capacity, expectations of the completion and capacity of our fish feed plant, trends in the seafood industry, including industry supply outlook, exchange rate and interest rate hedging policies and fluctuations, dividend policy and guidance, asset base investments, capital expenditures and net working capital guidance, NIBD target, cash flow guidance and financing update, guidance on financial commitments and cost of debt and various other matters (including developments with respect to laws, regulations and governmental policies regulating the industry and changes in accounting policies, standards and interpretations) on Marine Harvest's business and results. These statements speak of Marine Harvest s plans, goals, targets, strategies, beliefs, and expectations, and refer to estimates or use similar terms. Actual results could differ materially from those indicated by these statements because the realization of those results is subject to many risks and uncertainties. Our registration statement on Form 20-F filed with the US Securities and Exchange Commission in 2014 contain information about specific factors that could cause actual results to differ, and you are urged to read them. Marine Harvest disclaims any continuing accuracy of the information provided in this presentation after today. 2
3 Highlights Record high operational EBIT of NOK 1,090 million All time high prices in Norway and Canada Result partly offset by contract coverage and high costs in Norway Agreement to divest UK farming assets to meet EC remedies Proceeds of GBP 122.5m expected Partial refinancing through issuance of EUR 375m convertible bond Favourable terms Quarterly dividend of NOK 5 per share proposed to AGM 3
4 Key financials Marine Harvest Group - main figures NOK million Q1. 14 Q Operational revenue and other income Operational EBIT 1) Cash flow from operations Net interest-bearing debt (NIBD) Underlying EPS (NOK) 2) Net cash flow per share (NOK) 3) ROCE 4) 21.5% 14.0% 18.5% Harvest volume (gutted weight tons, salmon) Operational EBIT - NOK per kg 5) Norway Scotland Canada Chile ) Excluding change in unrealised gain/losses from salmon derivatives, fair value adjustment of biomass, onerous contracts provision, results from associated companies, restructuring cost and write-downs of fixed assets/intangibles and other non-operating items 2) Underlying EPS: Operational EBIT adjusted for accrued payable interest, with estimated weighted tax rate 3) Net cash flow per share: Cash flow from operations and investments, net financial items paid and realised currency effects 4) ROCE: Annualised return on average capital employed based on EBIT excluding fair value adjustments of biomass, onerous contracts provision and other non-operating items/ average NIBD + Equity, excluding fair value adjustments of biomass, onerous contracts provision and net assets held for sale, unless there are material transactions in the period 5) Operational EBIT per kg including allocated margin from Sales and marketing (from own salmon) 4
5 Record high prices in Europe Global supply growth ~4% Strong prices in all markets Price of Canadian salmon in Seattle outperformed Chilean salmon in Miami 5
, Scotland (NOS+ NOK 3.")
6 Price achievement by origin Contract share 40% 64% 0% 29% Superior share 91% 95% 76% 84% Note: Q average price achievement is measured versus reference prices in all markets (Norway/Faroes (NOS), Scotland (NOS+ NOK 3.58), Canada (UB Seattle), Chile (UB Miami) 6
7 Norway SALMON OF NORWEGIAN ORIGIN NOK million Q Q Operational EBIT Harvest volume Operational EBIT per kg of which MH Markets of which MH VAP Europe of which Morpol na Exceptional items incl in op. EBIT Exceptional items per kg Price achievement/reference price 94% 95% Contract coverage 40% 28% Superior share 91% 84% All time high prices in the quarter Adverse impact by sales contracts and high costs in the quarter Successive costs reduction expected for remainder of the year High sea lice awareness Note: Details on Nova Sea listed in appendix 7

8 Norway: Sales contract portfolio Note: Marine Harvest Norway s fixed price/fixed volume contracts with third party customers and MH s processing entities. MH s processing entities covers a large proportion of their sales exposure through third party end product contracts. 8

9 Norway: Operational EBIT/kg per region Harvest volume 12,315 17,310 11,596 13,886 55,107 Superior share 91% 95% 92% 87% 91% Including contribution from Sales and Marketing 9
10 Scotland SALMON OF SCOTTISH ORIGIN NOK million Q Q Operational EBIT Harvest volume Operational EBIT per kg of which MH Markets of which MH VAP Europe of which Morpol 0.07 na Exceptional items incl in op. EBIT 0 0 Exceptional items per kg Price achievement/reference price 93% 91% Contract coverage 64% 61% Superior share 95% 94% Price achievement impacted by the generally high contract coverage High costs in the quarter High feed costs Sea lice and AGD mitigation Good biological status at present 10
11 Canada SALMON OF CANADIAN ORIGIN NOK million Q Q Operational EBIT Harvest volume Operational EBIT per kg of which MH Markets of which MH VAP Europe of which Morpol 0.00 na Exceptional items incl in op. EBIT 0-6 Exceptional items per kg Price achievement/reference price 99% 100% Contract coverage 0% 3% Superior share 76% 83% Very strong result in the quarter Temporary exit from areas with Kudoa impacts volumes in 2014 Q1 typically the strongest quarter in Canada Increased costs expected for the remainder of the year 11
12 Chile SALMON OF CHILEAN ORIGIN NOK million Q Q Operational EBIT Harvest volume Operational EBIT per kg of which MH Markets of which MH VAP Europe of which Morpol 0.00 na Exceptional items incl in op. EBIT -1-3 Exceptional items per kg Price achievement/reference price 103% 94% Contract coverage 29% 39% Superior share 84% 82% Result positively impacted by high prices in the quarter Costs remain at very high level USD 4.7 (USD 4.9 in Q1 2013) Salmosan approved in Chile and this has temporarily relived some of the pressure on biology Structural issues remain and causes long term uncertainty 12
13 Ireland and Faroes SALMON OF IRISH ORIGIN NOK million Q Q Operational EBIT 4 18 Harvest volume Operational EBIT per kg of which MH Markets of which MH VAP Europe of which Morpol 0.00 na Exceptional items incl in op. EBIT 0 0 Exceptional items per kg Price achievement/reference price na na Contract coverage 96% 95% Superior share 90% 91% SALMON OF FAROESE ORIGIN NOK million Q Q Operational EBIT Harvest volume Operational EBIT per kg of which MH Markets of which MH VAP Europe of which Morpol 0.00 na Exceptional items incl in op. EBIT 0 0 Exceptional items per kg Price achievement/reference price 101% 97% Contract coverage 0% 14% Superior share 97% 95% 13
14 Value Added Products Europe (VAP Europe) MH VAP EUROPE NOK million Q Q Operating revenues Operational EBIT Operational EBIT % -2.2% -2.0% Volume sold (tons product weight) Exceptional items 0 0 Volume share salmon 62% 58% Revenue share salmon 71% 65% Gross margin share salmon 52% 51% Poor performance in the quarter Inability to fully pass through high raw material costs High structural costs being addressed Restructuring programme will yield improvements from 2H 2014 Please note that the operational EBIT for salmon in MH VAP Europe also is included in the results per country of origin 14
 11 358 na Exceptional items 0 na Volume share salmon 92% na Revenue share salmon 89% na Inability to fully pass through high raw material costs ~80% raw")
15 Morpol MORPOL PROCESSING NOK million Q Q Operating revenues na Operational EBIT - 38 na Operational EBIT % -3.7% na Volume sold (tons product weight) na Exceptional items 0 na Volume share salmon 92% na Revenue share salmon 89% na Inability to fully pass through high raw material costs ~80% raw material purchased in the spot market Good operational performance Break even raw material price remains at NOK ~44 for Q Please see historic figures for Morpol in appendix 15
 ~NOK 800m investment - Completion June/July 2014 Notes: (1) Based on 2014 harvest volume")
16 Fish feed project proceeding according to plan 220 thousand tonnes capacity 60% of MHG requirement in Norway (1) ~NOK 800m investment - Completion June/July 2014 Notes: (1) Based on 2014 harvest volume estimate 16
17 First Quarter 2014 Financials, Harvest Volumes and Markets 17
18 Profit and Loss Marine Harvest Group Q1. 14 Q NOK million Operational revenue and other income Operational EBIT 1) Unrealised gains on salmon derivatives Fair value adjustment on biological assets Onerous contracts provisions Restructuring costs Non-operational legal issues Income/loss from associated companies Impairment losses EBIT Net financial items ,204 Earnings before tax Profit or loss for the period Underlying EPS (NOK) 2) Net cash flow per share (NOK) 3) Operational EBIT margin 18.6% 12.9% 16.7% Harvest volume, HOG tons (salmonids) Operational EBIT per kg incl margin from Sales and Marketing 5) ROCE 4 ) 21.5 % 14.0 % 18.5 % 1) Excluding change in unrealised gain/losses from salmon derivatives, fair value adjustment of biomass, onerous contracts provision, results from associated companies, restructuring cost and write-downs of fixed assets/intangibles and other non-operating items 2) Underlying EPS: Operational EBIT adjusted for accrued payable interest, with estimated weighted tax rate 3) Net cash flow per share: Cash flow from operations and investments, net financial items paid and realised currency effects 4) ROCE: Annualised return on average capital employed based on EBIT excluding fair value adjustments of biomass, onerous contracts provision and other non-operating items/ average NIBD + Equity, excluding fair value adjustments of biomass, onerous contracts provision and net assets held for sale, unless there are material transactions in the period 5) Operational EBIT per kg including allocated margin from Sales and marketing (from own salmon) 18
19 Financial Position Marine Harvest Group NOK million Non-current assets Current assets Assets held for sale Total assets Equity Non-current liabilities Current liabilities Liabilities held for sale Total equity and liabilities Net interest-bearing debt NIBD/Equity 45.8% 50.3% 47.7% Equity ratio 49.9% 50.4% 48.5% NIBD/Equity within target of less than 50% 19
20 Cash Flow and Net Interest Bearing Debt Marine Harvest Group NOK million Q1. 14 Q NIBD beginning of period Operational EBITDA Change in working capital Taxes paid Other adjustments Cash flow from operations Capex Other investments Cash flow from investments Net interest and financial items paid Other items Bonds converted to equity Dividend distributed NIBD from consolidation of Morpol Net equity paid-in / Purchase own shares Translation effect on interest-bearing debt NIBD end of period Debt distribution 1) : EUR 64% 64% 62% USD 13% 13% 14% GBP 7% 4% 4% Other currencies 16% 19% 20% (1) Debt distribution including effect of cross currency swaps. (2) Currency effect on debt in Q1 is NOK 98 million. 20
21 2014 Cash Flow Guidance 2014 cash flow estimates Working capital buildup NOK 800m Requirements for commencing operations in feed plant Organic growth farming Scotland and Canada Capital expenditures NOK 1,700m NOK 1,000m Maintenance NOK 500m Structural investments organic growth and strengthen assets NOK 200m - Feed plant in Norway Interest expenses NOK 360m (run rate of ~NOK 300m) Tax payables NOK 250m Quarterly dividend of NOK 5.0 per share 2014 NIBD target set to NOK million (NOK 15 per kg Farming) Due to seawater growth patterns, WC is highly seasonal Slow seawater growth in 1H leads to working capital release and high seawater growth in 2H leads to working capital build up 21
22 Overview of financing EUR 775m Facility Agreement Maturity Q (extended from Q1 2015) Lenders: DNB, Nordea, Rabobank and ABN Amro Covenants: Declining NIBD/EBITDA(1) ratio 3.25 up to Q thereafter 40% equity ratio Facility to be downscaled as a result of recent convertible bond issuance Convertible bond EUR 350 issued in May 2013 Tenor 5 years, annual coupon 2.375%, conversion price EUR EUR 375 issued in April 2014 Tenor 5 years, annual coupon 0.875%, conversion price EUR NOK 1,250m bond issued in February 2013 Tenor 5 years, NIBOR + 3.5% Note: (1) Twelve month trailing EBITDA adjusted for certain items 22
23 Supply development Q Estimated volumes Compared to Q Est. volumes Q Q Volume % Q Suppliers Norway 236, ,200 3, % 308,800 Chile 130, ,400 21, % 115,700 Scotland 29,800 28,400 1, % 41,100 North America 23,600 32,200-8, % 28,300 Faroe Islands 15,800 15, % 17,400 Australia 10,300 10, % 9,600 Ireland 1,400 2,400-1, % 2,500 Other 3,300 2, % 4,100 Sum 451, ,300 17, % 527,500 Europe 283, ,800 4, % 369,800 Americas 154, ,600 12, % 144,000 Source: Kontali 4% increase in global harvest volumes in line with expectations 1.5% in Europe 9.0% increase in the Americas Note: (1) Atlantic Salmon (HOG tons) 23
24 Development in reference prices Reference prices Q Change vs Q Change vs NOK Q Market (4) Q Norway (1) NOK % EUR % Chile (2) NOK % USD % North America (3) NOK % USD % Notes: (1) Average superior HOG price per kg (FCA Oslo) (2) Average C trim price per kg (Urner Barry Miami 2-3 lb), equivalent to NOK 40.0 and USD 6.6 HOG (3) Average superior HOG price per kg (Urner Barry Seattle lb) (4) Market price in local currency 24
25 Global volume by market Estimated volumes Compared to Q Est. volumes 12 month rolling Q Q Volume % Q LTM PTM Markets EU 183, , % 236, , ,100 USA 88,700 83,400 5, % 85, , ,100 Russia 29,500 33,400-3, % 45, , ,400 Brasil 23,500 18,000 5, % 22,400 83,100 68,900 China / Hong Kong 17,200 13,500 3, % 17,800 66,200 56,800 Japan 12,700 10,600 2, % 17,700 55,400 54,200 South Korea/Taiwan 6,800 8,300-1, % 8,500 30,200 35,600 Ukraina 4,100 6,700-2, % 6,900 22,700 27,600 Sum main markets 365, ,200 9, % 441,500 1,551,100 1,539,700 Other markets 68,900 66,300 2, % 84, , ,100 Total all markets 434, ,500 12, % 525,500 1,845,500 1,805,800 Inflow to US from Europe 22,500 16,400 6, % 25,400 88,300 69,200 Inflow to EU from Chile 10,400 10, % 9,500 45,000 30,900 EU growth somewhat lower than European supply growth Source: Kontali Very strong demand in the US markets, increased import from Europe Russian consumers sensitive to current high prices Generally good demand in South America and Asia Note: Atlantic Salmon (HOG tons) 25
26 Industry supply outlook Estim ates 2014 HOG tonnes (thousands) Low Y/Y growth High Y/Y growth Norw ay ,101 7% 1,151 12% Chile % 456 8% North America % 125 2% UK % 147 3% Other % % Total 1,347 1,328 1,310 1,471 1,799 1,839 1,914 4% 2,015 10% Q Q Q Q Q Q ESTIMATES Q HOG tonnes (thousands) Low Q/Q growth High Q/Q growth Norw ay % % Chile % 105 9% North America % 31-2% UK % 35 4% Other % 32 9% Total % % Q3/Q Q3/Q Q3/Q Q3/Q Q3/Q Q3/Q ESTIMATES Q3/Q HOG tonnes (thousands) Low Q/Q growth High Q/Q growth Norw ay % % Chile % 220 2% North America % 70 20% UK % 82 3% Other % 74 16% Total ,019 3% 1,096 11% Actual harvest volumes will be affected by e.g. water temperatures, development in biological growth, biological challenges such as diseases, algae blooms etc. and market developments. 26
27 MHG 2014 volume guidance Salmon species Q Q Q Q Q Q Q3-Q HOG tons (1000) Actual Actual Actual Actual Actual Actual Estimate Estimate Estimate Norway Growth % -25% -16% -9% -2% -13% 17% 27% 16% 19% Chile (1) Growth % -15% -100% -40% 28% -30% 115% n.a. 34% 110% Canada Growth % 15% -16% -25% -47% -18% -48% -22% 31% -12% Scotland Growth % 4% 17% 6% 74% 20% 9% 13% -6% 2% Other Units Growth % -39% 2% -45% -31% -29% -4% 10% 61% 30% Total Growth % -17% -20% -13% 0% -12% 15% 37% 17% 21% Assets to be divested in Shetland and Orkneys are excluded from the figures Actual harvest volumes will be affected by e.g. water temperatures, development in biological growth, biological challenges such as diseases, algae blooms etc. and market developments. 27
28 Outlook Strong demand expected to continue Forward prices of NOK 38.8 per kg for Q2-Q However, higher supply growth expected for remainder of year Strategic focus areas Successful development of green-field feed capacity Acquisitions in Norway and Chile Integration of Morpol High sea lice awareness in Norway Chile remains concerning Risk of adverse regulatory change in Norway Quarterly dividend of NOK 5 per share proposed to AGM 28
29 Appendix 29
30 Contract coverage and sales contract policy Q contract shares (% of guided volume): Norway 33% Scotland 46% Canada 0% Chile 17% SALES CONTRACT POLICY Min hedging rate (1) Max hedging rate (1) Norway (2) (3) 22.5 % 50.0 % Chile (3) 22.5 % 50.0 % Canada 0.0 % 30.0 % Scotland 40.0 % 75.0 % Ireland 0.0 % 30.0 % Faroes 0.0 % 30.0 % Weighted average 22.1 % 50.8 % Note: (1) Hedging rates for the next quarter, limits dropping over time (2) External and internal contract (including financial futures) (3) Contract rate can be increased to 65% under special circumstances Contracts typically have a duration of 3-12 months Contracts are entered into on a regular basis Policy opens for contracts of up to 36 month duration 30
 NOK 50.20 52.1% USD 8.24 40.4% Notes: (1) Average superior HOG price per kg (FCA Oslo) (2) Average C trim price per kg (Urner Barry Miami 2-3 lb), equivalent to NOK 40.")
31 Development in reference prices Reference prices Q Change vs Q Change vs NOK Q Market (4) Q Norway (1) NOK % EUR % Chile (2) NOK % USD % North America (3) NOK % USD % Notes: (1) Average superior HOG price per kg (FCA Oslo) (2) Average C trim price per kg (Urner Barry Miami 2-3 lb), equivalent to NOK 40.0 and USD 6.6 HOG (3) Average superior HOG price per kg (Urner Barry Seattle lb) (4) Market price in local currency 31
32 Key performance indicators MORPOL MH Markets MH VAP EUROPE PROCESSING Sales and Marketing Q1. 14 Q1. 14 Q1. 14 Operational revenues and other income Operational EBIT EBIT margin % 1.9% 2.2% 3.7% Q1. 14 Q1. 13 Group EBIT per kg (NOK) Contribution from Farming (NOK) Contribution from Markets (NOK) Contribution from VAP (NOK) Contribution from Morpol Processing (NOK) 0.41 na Group Harvest Volume (k tonnes) Operational EBIT from source of origin (NOK m) Operational EBIT from other units (NOK m) Group operational EBIT
33 Key financials Marine Harvest Group - main figures NOK million Q1. 14 Q Operational revenue Operational EBITDA 1) Operational EBIT 1) EBIT Net financial items Profit or loss for the period Cash flow from operations Total assets Net interest-bearing debt (NIBD) Earnings per share (NOK) Underlying EPS 2) Net cash flow per share (NOK) ROCE 4) 21.5% 14.0% 18.5% Equity ratio 49.9% 50.4% 48.5% NIBD/Equity 45.8% 50.3% 47.7% Harvest volume (gutted weight tons, salmon) Operational EBIT - NOK per kg 5) Norway Scotland Canada Chile ) Excluding change in unrealised gains/losses from salmon derivatives, fair value adjustment of biomass, onerous contracts provisions, results from associated companies, restructuring costs, write-downs of fixed assets/intangibles and other non-operational items. 2) Underlying EPS: Operational EBIT adjusted for accrued payable interest, with estimated weighted tax rate. 3) Net cash flow per share: Cash flow from operations and investments, net financial items paid and realised currency effects (Purchase of shares in M orpol ASA and gain from the investment in Cermaq ASA are not included). 4) ROCE: Annualised return on average capital employed based on EBIT excluding fair value adjustment of biomass, onerous contracts provisions and other non-operational items / Average NIBD + Equity, excluding fair value adjustment of biomass, onerous contracts provisions and, until fourth quarter, the investment in M orpol ASA, 5) Operational EBIT per kg including allocated margin from Sales and M arketing (from own salmon). 33
34 Q segment overview Marine Harvest Group - analytical figures SOURCES OF ORIGIN NOK million Norway Scotland Canada Chile Ireland Faroes Other 1) MH Group OPERATIONAL EBIT MH FARMING MH SALES AND MARKETING MH Markets MH VAP Europe Morpol Processing SUBTOTAL Other enities 2) TOTAL Harvest volume gutted weight tons (salmon) Operational EBIT per kg (NOK) 3) of which MH Markets of which MH VAP Europe of which Morpol Processing Price achievement/reference price (%) 4) 94% 93% 99% 103% 101% 95% Contract coverage (%) 40% 64% 0% 29% 96% 0% 37% Quality - superior share (%) 91% 95% 76% 84% 90% 97% 89% Exceptional items (NOK million) 5) Exceptional items per kg (NOK) 5) GUIDANCE Q harvest volume (gutted weight tons) harvest volume (gutted weight tons) Q contract share (%) 33% 46% 0% 17% 0% 0% 31% 1) Operational EBIT arising from non salmon speices and 3rd party salmon not allocated to source of origin 2) Sterling White Halibut, Headquarter and Holding companies 3) Excluding Sterling White Halibut, Headquarter and Holding companies 4) MH Markets' price achievement to third party, MH VAP Europe and Morpol 5) Exceptional items impacting operational EBIT 34
35 2013 segment overview Marine Harvest Group - analytical figures 2013 SOURCES OF ORIGIN NOK million Norway Scotland Canada Chile Ireland Faroes Other 1) MH Group OPERATIONAL EBIT MH FARMING MH SALES AND MARKETING MH Markets MH VAP Europe Morpol Processing SUBTOTAL Other enities 2) TOTAL Harvest volume gutted weight tons (salmon) Operational EBIT per kg (NOK) 3) of which MH Markets of which MH VAP Europe of which Morpol Processing Price achievement/reference price (%) 4) 94% 92% 101% 101% 98% 95% Contract coverage (%) 37% 61% 2% 32% 93% 6% 37% Quality superior share (%) 88% 93% 86% 87% 87% 95% 89% Exceptional items (NOK million) 5) Exceptional items per kg (NOK) 5) GUIDANCE Q harvest volume gutted weight tons harvest volume gutted weight tons Q contract share 42% 69% 0% 36% 95% na 45% 1) Operational EBIT arising from non salmon speices and 3rd party fish not allocated to source of origin 2) Sterling White Halibut, Headquarter and Holding companies 3) Excluding Sterling White Halibut, Headquarter and Holding companies 4) MH Marktes' price achievement to third party, MH VAP Europe and Morpol Processing 5) Exceptional items impacting operational EBIT. Refer to Note 6 to theinterim financial statements for further details 35
36 Q segment overview MH Operating Units Farming Farming Farming Farming Farming Farming MH Sales and Marketing Norway Scotland Canada Chile Ireland Faroes Markets VAP EU Morpol Other 1) Elim MH Group* Revenues and other income Operating EBITDA Operating EBIT Fair Value adj on biomass, contracts/ unrealised derivates Restructuring cost Other non-operational items Income/loss from associated companies Write-down of fixed assets/intangibles EBIT Contribution to operational EBIT from S&M Operational EBIT incl contribution from S&M Harvest / sales volume Operational EBIT/kg incl contribution from S&M of whitch S&M *Volume = harvested volume salmon in tons gutted weight 1) Inclusive MH Feed 36
37 Development in harvest volumes Total Total Total Total Total Q1 Q2 Q3 Q4 Total Q1 Q2 Q3 Q4 Total Q1 Q2E Q3/4E Total Norway Chile (1) Canada Scotland Other (2) Total GROWTH RELATIVE TO SAME PERIOD IN PREVIOUS YEAR Total Total Total Total Total Q1 Q2 Q3 Q4 Total Q1 Q2 Q3 Q4 Total Q1 Q2E Q3/4E Total Norway 19% 2% 18% 0% 7% 30% 18% 23% 4% 17% -25% -16% -9% -2% -13% 17% 27% 16% 19% Chile (1) -10% -17% -52% -71% 146% 255% 728% -11% 0% 55% -15% -100% -40% 28% -30% 115% n.a. 34% 110% Canada 16% -9% 1% -8% 1% 12% 36% 4% 23% 19% 15% -16% -25% -47% -18% -48% -22% 31% -12% Scotland 0% 4% 17% -12% 51% -11% -13% -8% -47% -20% 4% 17% 6% 74% 20% 9% 13% -6% 2% Other (2) 21% 12% 28% 7% -4% 4% -8% 48% 0% 7% -39% 2% -45% -31% -29% -4% 10% 61% 30% Total 8% -4% 0% -10% 16% 29% 24% 12% -1% 14% -17% -20% -13% 0% -12% 15% 37% 17% 21% Notes: (1) Sold volume, harvested volume from Q onwards (2) Ireland and the Faroes 37
38 Morpol ASA Historical data NOK million Q Q Q Q Q Q Q Q Q Q Q Q Q Q Q Q Q Total revenue , , , ,129 1,113 1, EBITDA before fair value adjustments EBIT ANALYTICAL DATA SECONDARY PROCESSING Processed volume, product weight 16,221 15,817 16,273 22,423 17,816 12,449 11,445 18,890 16,045 14,579 15,110 23,013 19,389 17,869 19,065 27,738 11,358 EBIT per kg, product weight EBIT margin secondary processing 6% 3% 2% 5% 0% 3% 17% 15% 9% 7% 6% 2% 9% 10% 2% 5% 4% 38

39 2014 Net capital expenditure guidance Maintenance level 39
40 2014 Net working capital guidance 40
41 Guidance on financial commitments and cost of debt Contractual repayments Interest expenses Please note the approximations are subject to changes 41
42 Dividend policy The dividend level shall reflect the present and future cash generation potential of the Company Marine Harvest will target a net interest-bearing debt/equity ratio of less than 0.5x When target level is met, at least 75% of the annual free cash flow after operational and financial commitments will be distributed as dividend Dividend policy operationalized by defining a target average NIBD for each calendar year Dividends applied to manage NIBD around the target level 2014 NIBD target determined to NOK 7 500m NOK 15 per kg Farming 42

43 Nova Sea Harvest volume (HOG) EBIT(1) per kg NIBD Ownership % Q Q Q Q /12/2013 Nova Sea 48% 34,529 34,910 9,387 6, Leading integrated salmon producer in Northern Norway wholly owned licenses 4 partly owned licenses Marine Harvest has an ownership in Nova Sea of ~48% through direct and indirect shareholdings 2013 dividends of NOK 40m (Q2) Marine Harvest s share NOK ~20m Proportion of income after tax reported as income from associated companies in Marine Harvest Norway NOK 12 million in Q IFRS adjustment of biomass NOK 8.9m 43
44 Debt distribution and interest rate hedging DEBT VOLUME HEDGED AND FIXED RATES OF INTEREST RATE HEDGES (MARCH-MARCH) (1) CURRENCY DEBT /03/2014 (2) Nominal value Fixed rate (3) Nominal value Fixed rate (3) Nominal value Fixed rate (3) Nominal value Fixed rate (3) Nominal value Fixed rate (3) Nominal value Fixed rate (3) EUR m % 1, % 1, % % % % USD m % % % % % % GBP m % % % % % % Other (NOK m) 1,454.7 Market value of IRS contracts in MNOK (31/03/14): Mark to market valuation effect in Q1 (4) : Difference in fixed vs floating rate settled in cash in Q Notes: (1) MHG choses March as the starting month for all new interest hedging contracts (2) Debt at book value after taking cross currency swaps into account (3) Financing margin not included (4) Quarterly change in market value booked against P/L POLICY: External interest bearing debt is distributed as follows: EUR 64%, USD 13%, GBP 7%, other currencies 16% Marine Harvest ASA shall hedge 100% of the Group s long-term interest-bearing debt by currency with fixed interest or interest rate derivatives for the first 3 years and 50% for the 5 following years. Interest-bearing debt includes external interest-bearing debt and leasing in the parent company or subsidiaries. The interest rate hedges shall be based on the targeted currency composition. Interest rate exposure in other currencies than EUR, USD and GBP shall not be hedged Please note that the current portfolio deviates from the policy due to inter alia the recent bond and convertible bond issuance. The policy will be reviewed. Policy last updated 7 February
45 Hedging and long term currency exposure POLICY EUR/NOK Marine Harvest shall hedge between 0% and 30% of its assumed annual expenses in NOK against the EUR with a horizon of one year. The annual hedging shall be evenly distributed across the months of the year. USD/CAD Marine Harvest shall not hedge the USD/CAD exposure. USD/CLP Marine Harvest shall not hedge the USD/CLP exposure Internal transaction hedging relating to bilateral sales contracts As of 1 April 2011, all bilateral sales contracts are subject to internal currency hedging of the exposure between the invoicing currency and NOK The operating entities hedge this exposure towards the parent company. In accordance with the general hedging policy, this exposure is not hedged towards external counterparties The purpose of the internal hedging is to allow for a more accurate comparison between the MH Farming entities (including contribution from Sales) and peers with respect to price achievement and operational EBIT Policy last updated 7 February
46 Long term currency hedging CURRENT PORTFOLIO EUR/NOK USD/CAD USD/CLP STRATEGIC CURRENCY HEDGING MEUR Rate MUSD Rate MUSD Rate P/L effect of contracts in Q1-10 (MNOK) MNOK Market value 31/12/ Change (1) 38 Market value 31/03/ Note: (1) Quarterly changes in market value booked against equity until maturity DESIGNATED MARKET CURRENCIES Norway Chile Canada Scotland VAP Faroes Cold Water Species Asia Morpol EUR USD USD GBP EUR DKK NOK USD EUR 46
47 Impact of currency/interest rate movements Average rates 1 CAD 1 EUR 1 GBP 1 USD Averge Q Average Q Average rates 1 CAD 1 EUR 1 GBP 1 USD Q vs Q % 12.4% 15.5% 8.4% End of quarter rates 1 CAD 1 EUR 1 GBP 1 USD 31/3/13 vs. 31/12/13-5.1% -1.5% -0.8% -1.6% Impact on Profit and Loss (versus Q1 2013) Currency impact on net financial items Positive impact of NOK 16m (Negative NOK 44m) Impact from currency on Financial Position (versus 31/12/13) Deacrease in interest-bearing debt due to currency NOK 98m 47
48 Fair value adjustment of biomass Under IFRS (IAS 41) the company is required to value biological assets at a fair market value. During the second half of 2011, the largest salmon farming companies in Norway, with support from audit firms, formed an industry working group where the objective was to reach a converged and improved common approach for estimating the fair value of the biomass in accordance with IAS 41. Following the working group s conclusions, Marine Harvest has with effect from the fourth quarter 2011, refined its calculation model. The model enhancements have been made to capture the fair value development during the lifetime of the fish in an improved manner. The revised model split the biomass into 3 groups based on size: Fish below 1 kg live weight ( smolt ) is valued at accumulated cost Fish between 1 kg and 4 kg live weight (immature fish) incorporates a proportionate share of the expected net profit at harvest Fish above 4 kg (mature fish) is valued at the expected net value The main drivers in the valuation are: Volume of biomass (and average weight per site) at every reporting date Expected cost at harvest Expected value at harvest (based on externally quoted forward prices where applicable and/or the most relevant price information available for the period in which the fish is expected to be harvested) Operationally, the value of biomass is reported at cost. In the Group accounts, fair value adjustments are added to costs of each operating unit and combined, the two elements constitute the fair value of biomass. The change in fair value adjustment is income or expense classified on a separate line in the Profit and Loss statement in each period. This item is not included in Operational EBIT. 48
49 Tax losses carried forward (YE 2013) Marine Harvest Group NOK million Recognised Unrecognised Total Chile USA Germany The Netherlands Ireland France Poland Vietnam Other Total Most of the deferred tax assets have been recognised on the statement of financial position The NOL s will be used to offset taxable profit in the countries going forward The utilisation of the deferred tax asset on NOL s gives rise to a tax expense in the accounts which do not normally have any cash effect Details are available in the 2013 Annual Report 49
50 The Board s current authorisations The Board was given the following proxies at the AGM General share capital increase (up to 10% of share capital) Proxy to set aside shareholders pre-emption right to subscribe Targeted authority to increase share capital Issuance of up to 82m shares in one or more occasion Authority may only be used to issue shares to shareholders in Cermaq ASA as full or partial consideration for transfer of shares in Cermaq ASA to the company. Purchase of own shares (up to 10% of share capital) Maximum price: NOK 120 per share Minimum price: NOK 7.5 per share Issuance of new convertible bond (utilised) Maximum amount: NOK 3,200m Maximum number of shares to be issued as settlement: 64m Authorisation to issue dividend from EGM of 15 November (utilised) Up to NOK 500m 50
51 Sensitivities ESTIMATED SENSITIVITIES ON ANNUAL RESULTS OP. EBIT EFFECT CASH FLOW EFFECT DRIVER NOK million Change in global average salmon price of NOK 1 (1) (2) Annual harvest volume Change in total harvest volume of 10,000 tonnes (3) (2) Marginal volume Change in global feed price of NOK 1 per kg 430 (4) 635 (4) (5) Feed consumption Notes: (1) Assuming all sales at spot prices, Please see contract policy and estimated contract rates in the latest quarterly presentation (2) Normally 30 days credit on sale of salmon, effect assumes stable volume between years and across months (3) Assuming EBIT per kg of NOK 6 (4) Annual harvest volume converted to live weight multiplied with feed conversion ratio (335 divided by 0.83 multiplied with 1.3 and NOK 1 = ~635) Assuming stable production and feed consumption between years and across months (5) 60 days credit time on feed 51
Marine Harvest Q Presentation
 Marine Harvest Q2 2014 Presentation Forward looking statements This presentation may be deemed to include forward-looking statements, such as statements that relate to Marine Harvest s contracted volumes,
Marine Harvest. Q Presentation 1 November 2017
 Marine Harvest 1 Q3 2017 Presentation 1 November 2017 Forward looking statements This presentation may be deemed to include forward-looking statements, such as statements that relate to Marine Harvest
Marine Harvest. Q Presentation 24 August 2017
 Marine Harvest Q2 2017 Presentation 24 August 2017 1 Forward looking statements This presentation may be deemed to include forward-looking statements, such as statements that relate to Marine Harvest s
Marine Harvest. Q Presentation 10 May 2017
 Marine Harvest Q1 2017 Presentation 10 May 2017 1 Forward looking statements This presentation may be deemed to include forward-looking statements, such as statements that relate to Marine Harvest s contracted
Marine Harvest Q Presentation
 Marine Harvest Q2 2015 Presentation Forward looking statements This presentation may be deemed to include forward-looking statements, such as statements that relate to Marine Harvest s contracted volumes,
Marine Harvest Q Presentation
 Marine Harvest Q1 2015 Presentation Forward looking statements This presentation may be deemed to include forward-looking statements, such as statements that relate to Marine Harvest s contracted volumes,
Marine Harvest. Q Presentation 14 February 2018
 Marine Harvest Q4 2017 Presentation 14 February 2018 1 Forward looking statements This presentation may be deemed to include forward-looking statements, such as statements that relate to Marine Harvest
Marine Harvest. Q Presentation 22 August 2018
 Marine Harvest Q2 2018 Presentation 22 August 2018 Forward looking statements This presentation may be deemed to include forward-looking statements, such as statements that relate to Marine Harvest s contracted
Operating revenue NOK million Operational EBIT NOK million. Harvest volume (HOG) tonnes Q3 09 Q4 09 Q1 10 Q2 10 Q3 10
 tonnes Q3 09 Q4 09 Q1 10 Q2 10 Q3 10") Solid performance in a strong market Strong price achievement and solid results in Norway Return on Capital Employed of 18.9% in the quarter Favourable market balance expected to support a strong market
Solid performance in a strong market Strong price achievement and solid results in Norway Return on Capital Employed of 18.9% in the quarter Favourable market balance expected to support a strong market
Harvest volume (GW) tonnes. Operating revenue NOK million. Operational EBIT NOK million Q1 11 Q2 11 Q3 11 Q4 11 Q1 12 Q1 11 Q2 11 Q3 11 Q4 11 Q1 12
 tonnes. Operating revenue NOK million. Operational EBIT NOK million Q1 11 Q2 11 Q3 11 Q4 11 Q1 12 Q1 11 Q2 11 Q3 11 Q4 11 Q1 12") 33 % industry supply growth market prices down 33 % from Q1 2011 Strong demand increased prices from Q4 2011 Strong performance in Scotland Poor results in VAP Europe Operational EBIT of NOK 276 million
33 % industry supply growth market prices down 33 % from Q1 2011 Strong demand increased prices from Q4 2011 Strong performance in Scotland Poor results in VAP Europe Operational EBIT of NOK 276 million
Harvest volume (HOG) tons. Operational EBIT NOK million. Operational revenue NOK million Q2 10 Q3 10 Q4 10 Q1 11 Q2 11 Q2 10 Q3 10 Q4 10 Q1 11 Q2 11
 tons. Operational EBIT NOK million. Operational revenue NOK million Q2 10 Q3 10 Q4 10 Q1 11 Q2 11 Q2 10 Q3 10 Q4 10 Q1 11 Q2 11") Improved price achievement in a falling market Operational EBIT increased 13% ROACE of 26% in the quarter NIBD NOK 5.8 billion after dividend of NOK 2.9 billion High contract share in the second half of
Improved price achievement in a falling market Operational EBIT increased 13% ROACE of 26% in the quarter NIBD NOK 5.8 billion after dividend of NOK 2.9 billion High contract share in the second half of
Presentation of Cermaq
 Presentation of Cermaq North Atlantic Seafood Seminar Oslo, 8 th March 2012 Agenda Introduction to Cermaq Key results 2011 Focus on Mainstream Chile Outlook 2012 Photograph: Alf Børjesson 2 This is Cermaq
Q BAKKAFROST GROUP Oslo 20 February 2018
 BAKKAFROST GROUP Oslo 20 February 2018 DISCLAIMER This presentation includes statements regarding future results, which are subject to risks and uncertainties. Consequently, actual results may differ significantly
Harvest volume (GW) tonnes. Operating revenue NOK million. Operational EBIT NOK million Q2 11 Q3 11 Q4 11 Q1 12 Q2 12 Q2 11 Q3 11 Q4 11 Q1 12 Q2 12
 tonnes. Operating revenue NOK million. Operational EBIT NOK million Q2 11 Q3 11 Q4 11 Q1 12 Q2 12 Q2 11 Q3 11 Q4 11 Q1 12 Q2 12") The market showed strong ability to absorb 30% industry growth Prices in line with Q1 - Down 24% in Europe and ~35% in the US compared to Q2 2011 Satisfactory performance in Norway - excellent result in
The market showed strong ability to absorb 30% industry growth Prices in line with Q1 - Down 24% in Europe and ~35% in the US compared to Q2 2011 Satisfactory performance in Norway - excellent result in
Highlights for the quarter Q2 / EBIT NOK 60 million pre biomass write-down
 Half year report Highlights for the quarter EBIT NOK 60 million pre biomass write-down EBIT pre fair value and biomass write-down (NOK million) 318 348 300 101 60 Mainstream results negatively impacted
Q BAKKAFROST GROUP Oslo 19 February 2019
 BAKKAFROST GROUP Oslo 19 February 2019 DISCLAIMER This presentation includes statements regarding future results, which are subject to risks and uncertainties. Consequently, actual results may differ significantly
THIRD QUARTER MARINE HARVEST GROUP
 / / Q3 2014 THIRD QUARTER MARINE HARVEST GROUP Strong earnings Successful start up of the feed plant Agreement to buy 40 000 tons farming capacity from Acuinova in Chile Quarterly dividend of NOK 1.10
Q BAKKAFROST GROUP Oslo 21 August 2018
 BAKKAFROST GROUP Oslo 21 August DISCLAIMER This presentation includes statements regarding future results, which are subject to risks and uncertainties. Consequently, actual results may differ significantly
Alternative Performance Measures (APM)/ Non-IFRS Financial Measures. Definitions of Alternative Performance Measures/ Non-IFRS Financial Measures
/ Non-IFRS Financial Measures. Definitions of Alternative Performance Measures/ Non-IFRS Financial Measures") Alternative Performance Measures (APM)/ Non-IFRS Financial Measures Our Alternative Performance Measures (APMs) present useful information which supplements the financial statements. These measures are
Alternative Performance Measures (APM)/ Non-IFRS Financial Measures Our Alternative Performance Measures (APMs) present useful information which supplements the financial statements. These measures are
Q May 12th Oslo
 Q1 2016 May 12th Oslo Lerøy Seafood Group ASA CEO Henning Beltestad CFO Sjur S. Malm Agenda Highlights Key financial figures Outlook Q1 2016 EBIT before FV adj. NOK 584.5 million EBIT/kg all inclusive
Alternative Performance Measures (APM) / Non-IFRS Financial Measures. Definitions of Alternative Performance Measures, Non-IFRS Financial Measures
 / Non-IFRS Financial Measures. Definitions of Alternative Performance Measures, Non-IFRS Financial Measures") Alternative Performance Measures (APM) / Non-IFRS Financial Measures Our Alternative Performance Measures (APMs) present useful information which supplements the financial statements. These measures are
Alternative Performance Measures (APM) / Non-IFRS Financial Measures Our Alternative Performance Measures (APMs) present useful information which supplements the financial statements. These measures are
Q NOVEMBER 8TH 2018
 Q3 2018 NOVEMBER 8TH 2018 1. Highlights 2. Key Financial Figures 3. Outlook Highlights Klikke for å legge til annet bilde Q3 2018 - EBIT before FV adj. NOK 660 million - Harvest volume 37 227 GWT - EBIT/kg
Q November 9th. Lerøy Seafood Group ASA. CEO Henning Beltestad CFO Sjur S. Malm
 Q3 2017 November 9th Lerøy Seafood Group ASA CEO Henning Beltestad CFO Sjur S. Malm Agenda Highlights Key financial figures Outlook Q3 2017 EBIT before FV adj. NOK 861 million Harvest volume 46 024 GWT
Q August 24th. Lerøy Seafood Group ASA. CEO Henning Beltestad CFO Sjur S. Malm
 Q2 2017 August 24th Lerøy Seafood Group ASA CEO Henning Beltestad CFO Sjur S. Malm Agenda Highlights Key financial figures Outlook Q2 2017 EBIT before FV adj. NOK 801 million Harvest volume 26 156 GWT
Financial report Q3 2014
 Financial report Q3 2014 Austevoll Seafood ASA Financial report Q3 2014 Index Key figures for the Group... 03 Q3 2014... 04 Operating segments... 04 Cash flows... 05 Financial information as of 30 September
Q MAY 8TH 2018
 Q1 2018 MAY 8TH 2018 1. Highlights 2. Key Financial Figures 3. Outlook Highlights Klikke for å legge til annet bilde Q1 2018 - EBIT beforefv adj. NOK 960 million - Harvest volume 37576 GWT - EBIT/kg all
P/F Bakkafrost Condensed Consolidated Interim Report for Q and 9 months 2013
 P/F Bakkafrost Condensed Consolidated Interim Report for Q3 2013 and 9 months 2013 15000 10000 5000 0 Harvest volume - TGW Q3 12 Q4 12 Q1 13 Q2 13 Q3 13 Operational EBIT mdkk 200 150 100 50 0 Q3 12 Q4
RS Platou Markets. Seafood conference. 10th June 2010
 RS Platou Markets Seafood conference 10th June 2010 Agenda Introduction to Cermaq Highlights Q1 2010 and outlook full year Chile Recovery 2 Overview of Cermaq One of the global leaders in the aquaculture
NORWAY ROYA L S A L M ON PRESENTATION Q Oslo, 7 November 2017 Charles Høstlund, CEO Ola Loe, CFO 1
 PRESENTATION Q3 2017 Oslo, 7 November 2017 Charles Høstlund, CEO Ola Loe, CFO 1 AGENDA: Highlights for the period Segment information Group financials Markets Outlook 2 Highlights in Q3 2017 Operational
Interim Report Q2-18
 Interim Report Q2-18 HIGHLIGHTS Operational EBIT of NOK 181 million o Operational EBIT per kg of NOK 24.73 in Region North o Operational EBIT per kg of NOK 23.49 in Region South o Non-recurring item of
SalMar ASA First quarter
 SalMar ASA First quarter 2009 1 STRONG SALMON PRICES AND SATISFACTORY EARNINGS Strong salmon prices contributed to satisfactory earnings for the SalMar Group in the first quarter 2009. While Scottish Sea
BAKKAFROST INTRAFISH SEAFOOD INVESTOR FORUM London 13 September 2018
 BAKKAFROST INTRAFISH SEAFOOD INVESTOR FORUM London 13 September 2018 DISCLAIMER This presentation includes statements regarding future results, which are subject to risks and uncertainties. Consequently,
Cermaq ASA Presentation for Pareto Securities Oslo, 14 th June 2012
 Cermaq ASA Presentation for Pareto Securities Oslo, 14 th June 2012 1 2020 2015 2010 2005 2000 1995 1990 1985 1980 1975 1970 1965 1960 1955 1950 Aquaculture: a sustainable growth industry Our growing population
PRESENTATION Q Oslo, 26 February 2014 John Binde, CEO Ola Loe, CFO
 PRESENTATION Q4 2013 Oslo, 26 February 2014 John Binde, CEO Ola Loe, CFO AGENDA: Highlights for the period Segment information Group financials Outlook 2 Highlights in Q4 2013: The best quarterly and yearly
Events after balance sheet date
 Austevoll Seafood ASA 0 Financial Report Q4 2011 Successful second fishing season for anchoveta in Peru A positive result recorded for fish farming, sale and distribution, in difficult conditions Seasonally,
PRESENTATION Q Oslo, 15 August 2013 John Binde, CEO Ola Loe, CFO
 PRESENTATION Q2 2013 Oslo, 15 August 2013 John Binde, CEO Ola Loe, CFO AGENDA: Highlights for the period Segment information Group financials Outlook 2 Highlights in Q2 2013: Best quarterly operational
All figures in NOK 1,000 Q3 11 Q3 10 Sept. 30, 2011 Sept. 30,
 Austevoll Seafood ASA 0 INTERIM REPORT Q3 2011 Significant reduction in interest-bearing liabilities in the quarter Third quarter is low season for production of pelagic fish in Europe and South America
Interim Report. January September 2013
 Interim Report January September 2013 Disclaimer Albain Bidco Norway AS is providing the following financial results for the third quarter of 2013 to holders of its EUR225,000,000 6.750% Senior Secured
Q U A R T E R L Y R E P O R T 2 N D Q U A R T E R
 Q U A R T E R L Y R E P O R T 2 N D Q U A R T E R 2 0 0 7 1. Grieg Seafood develops as planned Grieg Seafood was listed in June, and has now 869 shareholders after 2 shares issues of MNOK 700 in total.
Third QUARTER / 2017
 STRONG OPERATIONS AND IMPROVING BIOLOGY HIGHLIGHTS IN THE THIRD QUARTER Strong operations and effective management of the improving biological situation Lower production costs and higher prices achieved
 - - - - - - - 20 000 15 000 10 000 5 000 0 2017 2014 2013 2012 2011 2010 2009 2008 2007 2006 2005 2004 2003 2002 2001 2000 1999 1995 1 400 30 1 200 25 1 000 800 600 400 777 20 15 10 16,5 200 5 0 0 Q4/17
P/F Bakkafrost. Condensed Consolidated Interim Report for Q and 12 Months Operational EBIT mdkk
 P/F Bakkafrost Condensed Consolidated Interim Report for Q4 2015 and 12 Months 2015 Harvest volume TGW 15,000 12,000 9,000 6,000 3,000 Q4 14 Q1 15 Q2 15 Q3 15 Q4 15 Operational EBIT mdkk 300 250 200 150
Grieg Seafood ASA. griegseafood.com. Andreas Kvame CEO. Atle Harald Sandtorv CFO. 8 November 2017
 Grieg Seafood ASA Andreas Kvame CEO Atle Harald Sandtorv CFO 8 November 2017 1 Agenda Highlights This is Grieg Seafood Business Units (Regions) Financials Outlook 2 Highlights Q3 2017 Improved results
Q BAKKAFROST GROUP Oslo 10 May 2016
 2016 BAKKAFROST GROUP Oslo 10 May 2016 DISCLAIMER This presentation includes statements regarding future results, which are subject to risks and uncertainties. Consequently, actual results may differ significantly
Q BAKKAFROST GROUP New York 19 May 2016
 2016 BAKKAFROST GROUP New York 19 May 2016 DISCLAIMER This presentation includes statements regarding future results, which are subject to risks and uncertainties. Consequently, actual results may differ
THIRD QUARTER / 2018
 REPORT FOR THE THIRD QUARTER 2018 HIGHLIGHTS Operationally strong quarter, with cost improvements and good price achievement. Record-high volume for sales & processing with positive contribution Total
SalMar ASA. Presentation Q CEO Yngve Myhre, CFO Trond Tuvstein Oslo, 14 November w w w. s a l m a r. n o
 Presentation Q3 2013 SalMar ASA CEO Yngve Myhre, CFO Trond Tuvstein Oslo, 14 November 2013 2 Agenda Highlights Financial update Operational update Market and outlook Third quarter highlights Another strong
NOTE 3 FINANCIAL RISK MANAGEMENT
 NOTE 3 FINANCIAL RISK MANAGEMENT CAPITAL MANAGEMENT The Group aims to ensure that it has access to capital to enable the business to develop in accordance with adopted strategies. By so doing, the Group
Q BAKKAFROST GROUP Oslo February 24 th 2015
 Q4 2014 BAKKAFROST GROUP Oslo February 24 th 2015 DISCLAIMER This presentation includes statements regarding future results, which are subject to risks and uncertainties. Consequently, actual results may
PRESENTATION Q Oslo, 14 November 2012 John Binde, CEO Ola Loe, CFO
 PRESENTATION Q3 2012 Oslo, 14 November 2012 John Binde, CEO Ola Loe, CFO AGENDA: Highlights for the period Segment information Group financials Outlook 2 Highlights in Q3 2012: Strong consumption growth
Results Presentation 3Q17
 Multiexport Foods S.A. Results Presentation 3Q17 Santiago, November 2017 Agenda I. Highlights II. III. Financial Statements Supply, Demand and Prices IV. Farming Operation V. Perspectives 2 Highlights
FOURTH QUARTER / 2014
 SATISFACTORY RESULT DESPITE BIOLOGICAL CHALLENGES HIGHLIGHTS IN THE FOURTH QUARTER 2014 Good salmon prices and high harvested volume produced profit growth and record operating revenues. 50% of the harvested
EWOS Group / INTERIM FINANCIAL REPORT / JANUARY DECEMBER 2014 TABLE OF CONTENTS
 TABLE OF CONTENTS Disclaimer... 3 Presentation of the group... 4 Comments by the CEO... 5 Key financial figures... 6 Market conditions... 6 Operating and financial review... 7 Condensed interim financial
PRESENTATION Q Oslo, 19 February 2013 John Binde, CEO Ola Loe, CFO
 PRESENTATION Q4 2012 Oslo, 19 February 2013 John Binde, CEO Ola Loe, CFO AGENDA: Highlights for the period Segment information Group financials Outlook 2 Highlights in Q4 2012: Significant improvement
15,000 12, , , , ,158 13,004 12, , ,664
 15,000 12,000 13,004 10,934 12,940 13,158 10,664 350 307 300 9,000 335 255 254 30 26.34 21.58 22.26 23.22 16 Q2 16 Q3 16 24.33 20 200 6,000 10 100 3,000 0 400 16 Q2 16 Q3 16 Q4 16 17 0 16 Q2 16 Q3 16 Q4
Interim Report Q1-18
 Interim Report Q1-18 HIGHLIGHTS Operational EBIT of NOK 193 million o o Operational EBIT per kg of NOK 19.22 in Region North Operational EBIT per kg of NOK 15.64 in Region South The highest sold and harvested
Q BAKKAFROST GROUP Glyvrar 28 October 2014
 Q3 2014 BAKKAFROST GROUP Glyvrar 28 October 2014 DISCLAIMER This presentation includes statements regarding future results, which are subject to risks and uncertainties. Consequently, actual results may
Chilean volume reduction Impact on global markets. North Atlantic Seafood Forum Steven Rafferty CFO Cermaq ASA 5 March 2009
 Chilean volume reduction Impact on global markets North Atlantic Seafood Forum Steven Rafferty CFO Cermaq ASA 5 March 2009 Context Chilean Atlantic salmon supply will drop by 50% + in 2009 Further drop
From Copeinca to Mitsubishi and beyond. Jon Hindar CEO London, 31 October 2014
 From Copeinca to Mitsubishi and beyond Jon Hindar CEO London, 31 October 2014 A roller coaster with a happy ending for Cermaq and for the industry Page 2 A roller coaster with a happy ending for Cermaq
The answers to your questions.
 The answers to your questions. By / Ragnar Nystøyl CHRISTMAS SEMINAR Bergen, 19. November 2014 Agenda - Norwegian Production & Supply issues - Global Production & Supply issues - Market- & Price-related
Lerøy Seafood Group SEPTEMBER 2018
 Lerøy Seafood Group SEPTEMBER 2018 1. Lerøy Seafood Group 2. Key market trends supply and demand Our vision To be the leading and most profitable global supplier of sustainable high-quality seafood History
FOURTH QUARTER / 2016
 SATISFACTORY RESULT DESPITE BIOLOGICAL CHALLENGES HIGHLIGHTS IN THE FOURTH QUARTER 2016 Continued high salmon prices result in revenue and profit growth. High production costs for part of the volume harvested
Santiago, May 11 th, Results Presentation 1Q18
 Santiago, May 11 th, 2018 Results Presentation 1Q18 Agenda I. Highlights II. III. Financial Statements Supply, Demand and Prices IV. Farming Operation V. Prospects 2 Highlights EBIT 1Q18 USD 18.8 million
Lerøy Seafood Group. Preliminary financial figures February 25th Helge Singelstad. Alf-Helge Aarskog. Ivan Vindheim.
 Lerøy Seafood Group Preliminary financial figures 2009 February 25th 2010 Helge Singelstad Chairman Alf-Helge Aarskog CEO Ivan Vindheim CFO 1 Agenda 1. 1 Considerations 2. 2 Key financial figures Q4 2009
Chile, que pasa? -an update of the situation for salmon farming in Chile, - issues and potential solutions
 Chile, que pasa? -an update of the situation for salmon farming in Chile, - issues and potential solutions Intrafish / DNB investor conference London, 4 November, 2015 Jon Hindar CEO Cermaq Group The starting
Villa Organic AS fourth quarter 2012
 Notice to shareholders; Villa Organic AS fourth quarter 2012 Highlights fourth quarter 2012 The average prices were approximately at the same level as Q3, but improvement was observed towards the end of
Financial Report Q FINANCIAL REPORT Q1 2010
 Financial Report Q4 2010 FINANCIAL REPORT Q1 2010 Austevoll Seafood ASA 0 Interim Report Q4 2010 Fourth quarter also achieved record-high operating result Good market and good prices for salmon and trout
Sølvtrans Holding ASA Q Oslo, 7 November Roger Halsebakk, CEO Jon Kvalø, CFO
 Sølvtrans Holding ASA Q3 2012 Oslo, 7 November 2012 Roger Halsebakk, CEO Jon Kvalø, CFO 1 Highlights in the quarter 2 Financial review 3 Operational and market review 4 Summary and outlook 5 Appendix Highlights
Austevoll Seafood ASA
 Austevoll Seafood ASA Financial Report Q4 2016 and preliminary figures for 2016 INDEX Key figures for the group... 03 Q4 2016... 04 Operating segments... 04 Cash Flows Q4 2016... 06 Cash flows 2016...07
Presentatio. on Q3 2010
 Presentatio on Q3 2010 CEO Regin Jacobsen CFO Teitur Samuelsen Oslo November 9 th 2010 Disclaimer This presentation includes statements regarding future results, which are subject to risks and uncertainties.
Lerøy Seafood Group. Quarterly report First quarter May 12th Helge Singelstad. Henning Beltestad. Ivan Vindheim.
 Lerøy Seafood Group Quarterly report First quarter 2010 May 12th 2010 Helge Singelstad Chairman Henning Beltestad CEO Ivan Vindheim CFO 1 Agenda 1. 1 Considerations 2. 2 Key financial figures Q1 2010 3.
Interim Report Q4-17
 Interim Report Q4-17 HIGHLIGHTS Operational EBIT of NOK 95 million o o Operational EBIT per kg of NOK 15.84 in Region North Operational EBIT per kg of NOK 14.12 in Region South The highest sold volume
SalMar ASA. Presentation Q CEO Leif Inge Nordhammer CFO Trond Tuvstein
 SalMar ASA Presentation Q1 2015 CEO Leif Inge Nordhammer CFO Trond Tuvstein Agenda Highlights Financial update Operational update Outlook First quarter 2015 highlights Improved operations Challenging biological
Lerøy Seafood Group. Quarterly report Second quarter August 19th Helge Singelstad. Ivan Vindheim CEO CFO
 Lerøy Seafood Group Quarterly report Second quarter 2009 August 19th 2009 Helge Singelstad CEO Ivan Vindheim CFO 1 Agenda 1. 1 Considerations 2. 2 Key financial figures Q2 2009 3. 3 Lerøy at a glance 4.
Q Financial presentation. Arne Møgster CEO Britt Kathrine Drivenes CFO
 Q2 2015 Financial presentation Arne Møgster CEO Britt Kathrine Drivenes CFO Highlights All figures in NOK 1,000 Q2 2015 (restated) Q2 2014 H1 2015 (restated) H1 2014 2014 Revenue 4 107 801 3 606 154 7
SalMar ASA. Presentation Q CEO Olav-Andreas Ervik CFO Trond Tuvstein
 SalMar ASA Presentation Q1 2018 CEO Olav-Andreas Ervik CFO Trond Tuvstein Olav-Andreas Ervik new CEO of SalMar 41 years, from Frøya More than 20 years of experience from the aquaculture industry Worked
Interim Report Q2-17
 Interim Report Q2-17 HIGHLIGHTS Operational EBIT of NOK 136 million o o o Operational EBIT per kg of NOK 29.68 in Region North Operational EBIT per kg of NOK 31.30 in Region South Non-recurring item of
Grieg Seafood ASA Quarterly report Q4 2018
 bv Grieg Seafood ASA Quarterly report ABOUT GRIEG SEAFOOD Grieg Seafood ASA is one of the world's leading salmon farmers, specializing in Atlantic salmon. The Group has an annual production target of 100
Weekly Salmon Outlook Week
 Week 10-20 Page 1 of 8 Harvest of Atlantic salmon in Norway continued to grow in week 9. The harvest volume (23 000 tonnes wfe) was up 1000 tonnes from the previous week and 3% higher than in the corresponding
Q BAKKAFROST GROUP Glyvrar 20 May 2014
 Q1 014 BAKKAFROST GROUP Glyvrar 0 May 014 DISCLAIMER This presentation includes statements regarding future results, which are subject to risks and uncertainties. Consequently, actual results may differ
Sølvtrans Holding ASA Q Oslo, 15 May Roger Halsebakk, CEO Jon Kvalø, CFO
 Sølvtrans Holding ASA Q1 2012 Oslo, 15 May 2012 Roger Halsebakk, CEO Jon Kvalø, CFO 1 Highlights in the quarter 2 Financial review 3 Operational and market review 4 Summary and outlook 5 Appendix Highlights
Q Financial presentation. CEO - Arne Møgster CFO - Britt Kathrine Drivenes
 Q2 2018 Financial presentation CEO - Arne Møgster CFO - Britt Kathrine Drivenes Highlights All figures in NOK 1,000 Q2 2018 Q2 2017 H1 2018 H1 2017 2017 Revenue 6 001 380 5 019 195 11 754 529 11 094 149
Grieg Seafood ASA. griegseafood.com. Andreas Kvame CEO. Atle Harald Sandtorv CFO. 11 November 2016
 Grieg Seafood ASA Andreas Kvame CEO Atle Harald Sandtorv CFO 11 November 2016 1 Agenda Highlights Business Units (Regions) Financials Outlook 2 HIGHLIGHTS Q3 2016 3 Highlights Q3 2016 Good quarterly results
Annual Report April March 2017
 Annual Report 2016 1 April 2016-31 March 2017 THE BOARD OF DIRECTORS ANNUAL REPORT FOR FISCAL YEAR 2016 Cermaq Group AS has 18 wholly owned subsidiaries, of which Cermaq Norway AS, Alsvåg AS, Cermaq Canada
Contents Highlights 3 rd quarter Key figures... 3 A strong quarter despite weaker market conditions... 4 Financial review...
 Contents Highlights 3 rd quarter 2018... 3 Key figures... 3 A strong quarter despite weaker market conditions... 4 Financial review... 5 Group results... 5 Cash flow... 6 Financial position... 6 Segments...
GSF Quarterly report - English version
 GSF Quarterly report - English version Q1 2018 About Grieg Seafood Grieg Seafood ASA is one of the world s leading salmon farmers. The Group has an annual production capacity of more than 100,000 tons
Highlights Third Quarter 2017
 2 Highlights Third Quarter 2017 Improved results driven by higher volume Margins maintained by good prices with positive contribution from price contracts EBIT margin negatively affected by planned harvesting
Highlights Fourth Quarter 2016
 1 2 Highlights Fourth Quarter 2016 GSF s best quarter ever with EBIT of MNOK 456 (EBIT per kg: NOK 21.80). High harvest volume (20 917 tons) in a strong market. The Board proposes a dividend of NOK 3 per
Q THIRD QUARTER BAKKAFROST GROUP Glyvrar 5 November 2013
 Q3 2013 THIRD QUARTER BAKKAFROST GROUP Glyvrar 5 November 2013 DISCLAIMER This presentation includes statements regarding future results, which are subject to risks and uncertainties. Consequently, actual
Scenarios and drivers - for High & Low salmon prices 2018
 Scenarios and drivers - for High & Low salmon prices 2018 BRUSSELS SEMINAR Hotel Bloom 23rd Apr 2018 by Ragnar Nystøyl Atlantic Salmon Market Development All markets 2015 2016 16/15 2017 17/16 2018e 18/17
EBIT before fair value adjustment of biomass was MNOK 140 in Q4 (MNOK 87 in 2013).
.") 1 2 Highlights Fourth Quarter 2014 EBIT before fair value adjustment of biomass was MNOK 140 in Q4 (MNOK 87 in 2013). This includes a MNOK 60 gain from sale of GSF s shares in SalmoBreed AS in Q4. Production
1 2 Highlights Fourth Quarter 2014 EBIT before fair value adjustment of biomass was MNOK 140 in Q4 (MNOK 87 in 2013). This includes a MNOK 60 gain from sale of GSF s shares in SalmoBreed AS in Q4. Production
Q Financial presentation. Arne Møgster CEO Britt Kathrine Drivenes CFO
 Q2 2017 Financial presentation Arne Møgster CEO Britt Kathrine Drivenes CFO Highlights All figures in NOK 1,000 Q2 2017 Q2 2016 H1 2017 H1 2016 2016 Revenue 5 019 195 4 558 229 11 094 149 8 970 468 18
Summary published in connection to the admission to trading of shares in Marine Harvest ASA on NASDAQ OMX Stockholm
 Summary published in connection to the admission to trading of shares in Marine Harvest ASA on NASDAQ OMX Stockholm This summary is entirely based on information available in Marine Harvest ASA s (also
SECOND QUARTER 2013 REPORT
 Morpol ASA SECOND QUARTER 2013 REPORT Highlights for the quarter Group operating EBIT margin (1.4) percent Processing EBIT margin at (10.2) percent Sales prices increases continued to lag behind raw material
Q Financial presentation. CEO - Arne Møgster CFO - Britt Kathrine Drivenes
 Q3 2018 Financial presentation CEO - Arne Møgster CFO - Britt Kathrine Drivenes Highlights All figures in MNOK Q3 2018 Q3 2017 YTD Q3 2018 YTD Q3 2017 2017 Revenue 5 317 4 903 17 072 15 997 20 799 EBITDA*
Austevoll Seafood ASA
 Austevoll Seafood ASA Financial report Q2 and H1 2016 INDEX key figures for the group... 03 Q2 2016... 04 Operating segments... 04 Cash Flows, Q2 2016... 06 Financial information, H1 2016... 07 Cash Flow,
Q Financial presentation. Arne Møgster CEO Britt Kathrine Drivenes CFO
 Q1 2018 Financial presentation Arne Møgster CEO Britt Kathrine Drivenes CFO Highlights All figures in MNOK Q1 2018 Q1 2017 2017 Revenue 5 753 6 075 20 799 EBITDA* 1 445 1 555 4 747 EBIT* 1 217 1 331 3
Austevoll Seafood ASA
 Austevoll Seafood ASA Financial Report Q3 2017 Index Key figures for the Group...03 Q3 2017...04 Operating segments...04 Cash flow Q3 2017...07 Financial factors at 30 September 2017...07 Cash flows at
Fishpool Christmas Seminar 2017 Bearish signals going into 2018
 Photo: SB1 Markets SEAFOOD SALMON FARMING Fishpool Christmas Seminar 2017 Bearish signals going into 2018 Tore A. Tønseth Phone : (+47) 24 14 74 18 Mobile : (+47) 95 80 62 77 E-mail : tore.tonseth@sb1markets.no
Sølvtrans Holding ASA Q Oslo, 14 August Roger Halsebakk, CEO Jon Kvalø, CFO
 Sølvtrans Holding ASA Q2 2012 Oslo, 14 August 2012 Roger Halsebakk, CEO Jon Kvalø, CFO 1 Highlights in the quarter 2 Financial review 3 Operational and market review 5 Summary and outlook 6 Appendix Highlights