Interim Report Q2-18
|
|
|
- Ashlie Summers
- 5 years ago
- Views:
Transcription


1 Interim Report Q2-18
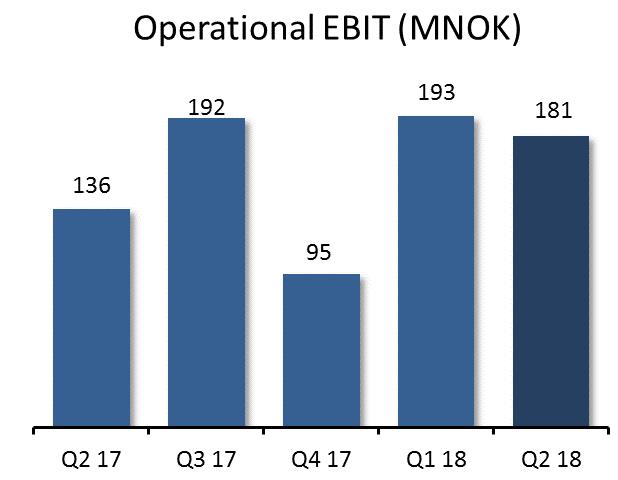
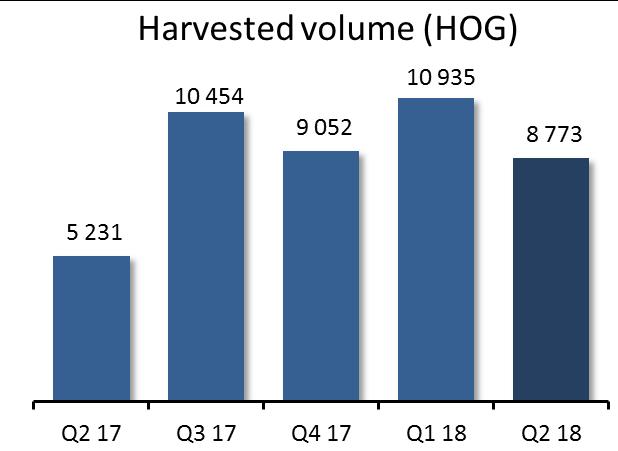
2 HIGHLIGHTS Operational EBIT of NOK 181 million o Operational EBIT per kg of NOK in Region North o Operational EBIT per kg of NOK in Region South o Non-recurring item of MNOK 22 ISA detected at a site in Region North High production cost on harvested fish Harvested volume 68 per cent higher than Q2 last year Sold volume at same level as Q2 last year Strong demand for salmon and high salmon prices in the quarter Purchased 800 tonnes MAB in Region North for NOK 132 million in the Ministry of Trade, Industry and Fisheries auction NORWAY ROYAL SALMON - KEY FIGURES Q2 Q2 YTD YTD FY (NOK '000) Operating revenues Operational EBITDA Operational EBIT Income from associates EBIT EBT EPS (NOK) before fair value adjustments 3,39 2,37 7,92 2,69 8,72 ROCE 1) 40,1 % 48,5 % 39,8 % Net cash flow from operating activities Investments in fixed assets/licenses Net interest-bearing debt Equity ratio 52,1 % 45,4 % 48,0 % Volume harvested (HOG) Operational EBIT per kg 2) 24,39 30,17 21,28 29,26 22,10 Volume sold - Sales )ROCE: Return on average capital employed based on 4-quarters rolling EBIT aligned for fair value adjustments / average (NIBD + Equity - Financial assets) 2) Operational EBIT for segments before non-recurring items incl margin from sales
3 FINANCIAL PERFORMANCE (Figures in brackets = 2017, unless otherwise specified) Revenues and results Norway Royal Salmon posted operating revenues of NOK million (NOK million) in the second quarter of 2018, a decrease of 1.9 per cent from the corresponding prior-year period. The decrease in revenues is due to slightly lower sold volume and slightly lower achieved prices. The Group achieved an operational EBIT of NOK million (NOK million), an increase of NOK 45.5 million. The increase in operational EBIT is due to higher harvested volume. A cost of NOK 22 million not related to harvested fish was recognised in the quarter and is treated as a non-recurring item. The cost is mainly due to the fish disease ISA (Infectious Salmon Anemia) being detected at a site in Region North. This led to the culling of the fish in 3 of 4 cages. The fish in the last cage is expected to be harvested with low average weight and the stock value of this fish is therefore written down to estimated fair value. The non-recurring cost has not been allocated to the segments. The sales operations had a weak result in the quarter. A loss on open fixed-price contracts compared to the level of spot prices contributed negatively with NOK 8.0 million (NOK 0.1 million) in the quarter. The Group recognised positive fair value adjustments of NOK 79.8 million (NOK million), a decrease of NOK 64.3 million. The farming business harvested tonnes (5 231 tonnes) gutted weight in the quarter, an increase of 67.7 per cent from the corresponding quarter last year. Including allocated margins from sales, Farming achieved an operational EBIT per kg of NOK (NOK 30.17). The reduction is due to lower achieved prices and higher cost on harvested fish. The Sales business sold tonnes ( tonnes), a decrease of 1.0 per cent. Financial items and share of profit from associates NRS had a negative result from associates of NOK million (positive of NOK 15.5 million) in the second quarter. The reason for the negative result is related to the cost of the fish disease ISA at a site where some of the fish have been culled and the stock value is written down to estimated fair value. NRS share of fair value adjustments of the biomass after tax amounted to NOK million (NOK 3.7 million). Associated Norwegian farming companies harvested tonnes, 614 tonnes more than in the corresponding period last year. NRS share of the above figure amounts to 583 tonnes, an increase of 228 tonnes. As a result of the increase of the NRS share price from NOK at the start of the quarter to NOK at the end of the quarter, a gain of NOK 38.7 million (loss of NOK 11.9 million) on TRS agreements on own shares was posted in the quarter. Net interest expenses for the period were NOK 4.1 million (NOK 4.7 million), a decrease of NOK 0.6 million because of lower interest-bearing debt. Balance sheet At the end of the reporting period, total assets amounted to NOK million, an increase of NOK million from the prior quarter end. The change in total assets is attributable to several factors. Intangible assets increased by NOK million after purchase of MAB equivalent to 800 tonnes in Region North. Fixed assets had a net increase of NOK 41.0 million, financial assets decreased with NOK 14.0 million and the Group s receivables decreased by NOK million. adjustments of the biomass increased by NOK 82.3 million, while inventories and biomass at cost decreased by NOK million. The net decrease in
4 inventories and biological assets was NOK 18.5 million. The Group s bank deposits increased by NOK The Group s net interest-bearing debt decreased by NOK 33.2 million, from NOK million at the end of the previous quarter to NOK at 30 June The decrease is mainly attributable to an operational EBITDA of NOK million, received dividends from associated companies of NOK 4.5 million and decreased working capital of NOK million. Payment of dividend of NOK 224.7, investments in fixed assets and other investments of NOK 75.3 million, paid taxes of NOK 23.7 million and increase in loans to associated companies of NOK 8.3 million had the opposite effect on the net interest-bearing debt. At the end of the quarter, the Group had an unused credit facility of NOK million and bank deposits of NOK As of 30 June, the Group s equity totalled NOK million, a decrease of NOK 18.3 million from the end of the previous quarter. The decrease is attributable to the paid dividend of NOK million. A positive total comprehensive income of NOK million increased the equity. The equity ratio at the end of the quarter was 52.1 per cent. Statement of cash flow The Group s operating activities generated a positive cash flow of NOK million during the quarter, which represents an increase of NOK million compared with the corresponding prior-year quarter. The positive cash flow is attributable to a positive operational EBITDA of NOK million, a realised gain on TRS-agreements of NOK 9.1 million, a decrease in inventories and biological assets at cost of NOK million and a decrease in accounts receivables of NOK million. Taxes paid of NOK 23.7 million, and a decrease in accounts payables of NOK 97.3 million had the opposite effect on the cash flow. Net cash outflows related to investing activities in the second quarter amounted to NOK 69.9 million (NOK 94.9 million), which is attributable to investments in fixed assets of NOK 62.9 million and development projects of NOK 12.5 million. Loans given to associated companies increased by NOK 8.2 million. Proceeds from realisation of TRS agreements of NOK 9.1 million and received dividends from associated companies of NOK 4.5 million had the opposite effect on the cash flow. The net cash outflows from financing activities totalled NOK million (NOK 92.8 million) in the second quarter. An increase of NOK million on the long-term credit facility and an increase in leasing liabilities NOK 23.5 million resulted in a total increase of NOK million in long term debt. Interests paid and instalments amounted to NOK 5.1 million and NOK 13.9 million respectively. Dividend of NOK million has been paid. The overdraft facility decreased by NOK 80.0 during the period.
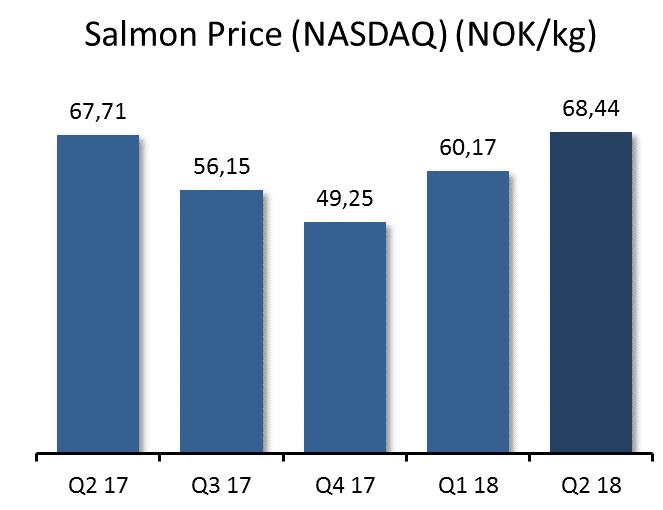
5 SEGMENT INFORMATION The Group is organised into two business areas; Farming and Sales. The performance of the two business areas is monitored with the overall objective of maximising Operational EBIT per kg and margins. The Farming business is divided into two geographical segments; Region North and Region South. Norway Royal Salmon monitors overall value creation from operations based on the salmon s source of origin. Consequently, external reporting focuses on measuring the overall profitability of the harvested volume based on source of origin (Operational EBIT/kg). For this reason, the contribution from the sales operations is allocated to Region North and Region South based on the volume harvested in the respective segments. The Group owns tonnes MAB to produce farmed salmon, divided between tonnes MAB in Region North, located in Troms and western Finnmark, and tonnes MAB in Region South, located in the area around Haugesund. The segments posted sales revenues of NOK million in the second quarter (NOK million), a decrease of 1.9 per cent from the corresponding period last year. The spot price (NASDAQ) for superior quality during the quarter was NOK per kg gutted weight, an increase of 14 per cent from the first quarter of 2018 and an increase of 1 per cent compared with the second quarter of The sales operations experienced a decrease in sales volumes of 1.0 per cent compared with the corresponding prior-year period tonnes ( tonnes) were sold in the second quarter. The Sales business achieved an operational EBIT before open fixed-price contracts of NOK 4.4 million (NOK 10.1 million), which equates to NOK 0.26 (NOK 0.59) per kg sold volume in the period. Loss on open fixedprice contracts compared to the level of spot prices was NOK 8.0 million (NOK 0.1 million) in the quarter. The Farming operations harvested tonnes (5 231 tonnes) gutted weight in the second quarter, an increase of 67.7 per cent from the corresponding period last year. The estimated harvest volume for 2018 is tonnes gutted weight. REGION NORTH Operational EBIT came in at NOK million (NOK million), an increase of NOK 49.6 million compared with the same quarter last year. Operational EBIT (ex. contracts) per kg amounted to NOK (NOK 29.70). Loss on fixed-price contracts of NOK 0.91 per kg (NOK 0.02) contributed to an operational EBIT per kg of NOK (NOK 29.68) tonnes (3 633 tonnes) were harvested in the region in the second quarter, an increase of 75.2 per cent. The achieved price for the Farming operations was NOK 1.60 lower per kg than in the corresponding period last year. The timing of the harvest and the quality of the harvested fish contributed negatively to the price achievement. Total production costs per kg for harvested fish was NOK 39.84, which is NOK 2.40 higher than in the first quarter of 2018 and NOK 1.04 higher than in the corresponding period last year. The reason for the high production cost is that fish were harvested from the site that received desmoltified fish in 2016 and from fish that was released to sea late in the autumn of The 2016-generation is almost fully harvested at the end of the quarter. A positive development in the production cost of the 2017-generation is expected. The estimated harvest volume for 2018 is tonnes gutted weight.
6 KEY FIGURES Q2 Q2 YTD YTD FY (NOK '000) Operating revenues Operational EBITDA Operational EBIT Investment in tangible assets/licenses Volume harvested (tonnes HOG) Operational EBIT per kg (ex contracts) 25,64 29,70 21,91 27,98 18,58 Gain (+)/Loss (-) on open fixed price contracts -0,91-0,02-0,50 0,25 2,85 Operational EBIT per kg 24,73 29,68 21,42 28,24 21,43 REGION SOUTH Operational EBIT came in at NOK 56.5 million (NOK 50.0 million), an increase of NOK 6.5 million. Operational EBIT (ex. contracts) per kg amounted to NOK (NOK 31.32). Loss on fixed-price contracts of NOK 0.91 per kg (NOK 0.02) contributed to an operational EBIT per kg of NOK (NOK 31.30) tonnes (1 598 tonnes) were harvested in the region in the second quarter, an increase of 50.6 per cent from the corresponding prior-year period. The Farming operations achieved a price which was NOK 2.79 per kg lower than in the corresponding prior-year period. The size of the harvested fish and the timing of harvest in the quarter contributed negatively to the price achievement. The production costs for harvested fish was NOK 38.79, which is NOK 0.62 per kg higher than in the first quarter and NOK 2.69 higher than in the corresponding period last year. The high production costs are due to increased mortality due to the fish disease CMS on the site where harvesting took place in the quarter. The harvest of the site was moved forward compared to when harvesting was planned and the site was almost empty at the end of the quarter. Estimated harvest volume for 2018 is tonnes gutted weight. KEY FIGURES Q2 Q2 YTD YTD FY (NOK '000) Operating revenues Operational EBITDA Operational EBIT Investment in tangible assets Volume harvested (tonnes HOG) Operational EBIT per kg (ex contracts) 24,40 31,32 21,35 31,93 21,94 Gain (+)/Loss (-) on open fixed price contracts -0,91-0,02-0,66 0,20 2,44 Operational EBIT per kg 23,49 31,30 20,69 32,13 24,38
7 SHARES As of 30 June 2018, Norway Royal Salmon ASA have shares, allocated among shareholders, a decrease of 335 from the end of the previous quarter. At the end of the quarter, the group had treasury shares. The share price increased from NOK at the end of March 2018 to NOK at the end of June shares were traded during the quarter. EVENTS IN OR SUBSEQUENT TO THE QUARTER Annual general meeting The annual general meeting was held in Trondheim on 31 May The general meeting granted the board of directors authority to acquire treasury shares by up to a total of 4,357,219 shares, each with a nominal value of NOK 1, which equals 10 per cent of the company s share capital. For acquisitions, the purchase price per share should be no lower than a nominal value of NOK 1, and no higher than NOK 300 per share. The authority remains in force until the ordinary general meeting in 2019, however no later than 30 June The general meeting granted the board of directors authority to increase the Company s share capital by up to NOK 4,357,219, which equals 10 per cent of the company s share capital. The authority remains in force until the ordinary general meeting in 2019, however no later than 30 June The general meeting resolved to distribute a dividend of NOK 5.20 per share. The dividend was distributed by a cash dividend of NOK 3.90 per share and distribution of shares in NRS from the company s treasury shares. Contractual rights and TRS agreements for own shares In the second quarter Norway Royal Salmon used its contractual right to purchase shares. After the transaction Norway Royal Salmon owns treasury shares and has through the TRS-agreement a contractual right to shares, which equates 3.41 per cent of the company s share capital. Sickness absence The positive development in sickness absence rate continued and decreased from 2.9 per cent in the last quarter to 1.6 per cent. Purchased 800 tonnes MAB In June 2018, Norway Royal Salmon purchased 800 tonnes of MAB in Region North for NOK million at the Ministry of Trade, Industry and Fisheries auction. This increase in MAB further increases NRS's growth opportunities in a production area with good conditions for salmon farming operations.
8 SUMMARY OF EVENTS YEAR TO DATE IN 2018 The Group posted sales of NOK million (NOK million) in the first half of 2018, an increase of 11.4 per cent against the corresponding prior-year period. During the same period, the Group posted an operational EBIT of NOK million (NOK million) tonnes were harvested in the first half of 2018, compared with tonnes in the corresponding prior-year period. The group had a positive operational cash-flow of NOK million (NOK million) in the first half of At the end of the second quarter the Group had an equity ratio of 52.1 per cent (45.4 per cent). The Group has decreased its net interest-bearing debt by NOK million in the first half of 2018 to NOK million. A dividend of NOK million was distributed in the first half of Region North harvested tonnes (9 133 tonnes) in the first half of 2018 and posted an EBIT per kg of NOK (NOK 28.24). Region South harvested tonnes (3 279 tonnes) in the first half of 2018 and posted an EBIT per kg of NOK (NOK 32.13). The Sales business sold tonnes ( tonnes) in the first half of Norway Royal Salmon has not identified any additional risk exposure beyond the risks described in the 2017 annual report. Norway Royal Salmon is exposed to the salmon price. Reference is made to the Outlook section of this report for other comments to NRS s risk exposure. Transaction with related parties are priced at market rates. Reference is made to the Note 6 of this report for further information regarding related parties MARKET CONDITIONS The total value of salmon exported from Norway in the second quarter was NOK 16.9 billion, an increase of 9.2 per cent from the second quarter of Exported volume from Norway was 9.4 per cent higher than the second quarter of 2017, which means that value increase is due to higher volumes. The spot price (NASDAQ) in the second quarter of 2018 was NOK per kg superior quality salmon (delivered Oslo). This is an increase of 1.1 per cent from the second quarter of 2017 and the highest price registered in NOK the last 20 years. In EUR, the prices of Norwegian salmon fell by 0.9 per cent to EUR 7.16 per kg. The export price was slightly lower (NOK 68,34) than the spot price and on the same level as the same period last year. Despite an increase in global supply, the prices were on the same level as the corresponding quarter last year. Harvested volumes from Norway increased by 8 per cent compared with the same quarter last year. From Chile the harvesting volumes increased by 19 per cent. A reduction in volume from other producing countries resulted in an increase in global harvesting volumes of 5 per cent. For Q Kontali Analyse expects a harvesting volume which is 4 per cent above Q Harvest volume (tonnes wfe) Q2/18 yr/yr Q3/18 E yr/yr Norway % % Chile % % Uk % % Canada % % Faroe Islands % % Australia % % USA % % Iceland % % Others % % % % Source: Kontali Analyse
9 Sold volumes increased by 8 per cent in the quarter compared with the same period last year. This is higher than the increase in global harvest volume and indicate slightly lower frozen inventory. Russia and USA are the most growing markets. Kontali Analyse expects that Eastern Europe and Asia will have the highest growth in the next quarter. Demand for salmon in the EU has been good in the quarter with 7 per cent higher global import volumes, 86 per cent of the volume comes from Norway. Norwegian export to the EU increased by 15 per cent both in import volume and value. Although prices have been high in the second quarter, all major markets have increased the volume of imports from Norway with more than the increase in global supply. The volume increase in France, Denmark, Netherland and the UK was substantial. Although the growth in import volumes is 1 per cent lower than the global growth, the development in the EU still signals continued good underlying demand development. Demand for salmon in Asia has developed well for a long time. Import volumes increased by 3 per cent in total but fell by 14 per cent from Norway. Norway had a market share of 51 per cent in the second quarter. Chile had a substantial growth in this region in this quarter as well. The trade problems with China continued in the second quarter, however there are indications of improvements. Sales to China increases steadily and the long-term potential in this region is very good. Export of salmon to Eastern Europe shows a strong global growth of 34 per cent in the second quarter of However, from Norway the volume declined by 2 per cent. With such high prices it is pleasing to see strong growth in these countries. The volumes to the region are, however, clearly lower than when Norway exported to Russia. Volumes to Russia from other producer nations showed an increase in the second quarter. Norway had a market share of 20 per cent in Eastern Europe. Demand for salmon in North America continues the positive trend. In total, import to North America has increased by 14 per cent, while volume from Norway increased by 8 per cent. Sold volumes (tonnes wfe) Q2/18 yr/yr Q3/18 E yr/yr EU % % USA % % Eastern Europe ex. Russia % % Russia % % Asia ex. Japan % % Japan % % Others % % % % Source: Kontali Analyse Q2/2018 Tonnes (wfe) yr/yr MNOK yr/yr Norway to EU: Poland % % France % % Denmark % % UK % % Spain % % Holland % % Others in EU % % Total Norway to EU % % Others to EU % EU total % Source: Norsk sjømatråd Q2/2018 Tonnes (wfe) yr/yr MNOK yr/yr Norway to Asia South East Asia % % Japan % % Middle East % % China (incl. Hong Kong) % % South-Korea % % Others in Asia % % Total Norway to Asia % % Others to Asia % Asia Total % Source: Norsk sjømatråd Q2/2018 Tonnes (wfe) yr/yr MNOK år/år Norway to Eastern Europe Ukraine % % Turkey % % Belarus % 67 5 % Kazakhstan % % Others in Eastern Europe % % Norway to Eastern Europe % % Other to Easten Europe % Eastern Europe Total % Source: Norsk sjømatråd Q2/2018 Tonnes (wfe) yr/yr MNOK yr/yr Norway to North America USA % % Canada % % Total Norway to North America % % Others to North America % North America Total % Source: Norsk sjømatråd
10 The second quarter was challenging for the NRS Sales operations, low margins contributed negatively to the profitability in the quarter. The sales volume was 1 per cent lower than in the same quarter last year. 90 per cent of the harvested fish were sold in the spot market in the second quarter, while 10 per cent were sold at fixed prices. The fixed price contracts resulted in a loss of NOK 8.0 million compared to the level of spot prices. The sales volumes to all regions, apart from Western Europe, increased in the quarter. The export volumes to Western Europe decreased with 2 per cent in the quarter, while the volumes sold in Norway increased by 4 per cent, volumes to Asia increased with 1 per cent and to Eastern Europe with 49 per cent. In the second quarter, Western Europe accounted for 77 per cent of the export volumes, Asia for 16 per cent and Eastern Europe for 6 per cent. Domestic volume amounts to 17 per cent of the total sold volume. OUTLOOK Harvested volume for the quarter was tonnes, which was tonnes higher than estimated in the last quarterly report. Estimated harvest volume for 2018 is adjusted down with tonnes to tonnes. This is an increase of 13 per cent from The reason for the downward adjustment is due to three issues. The fish disease ISA was detected at a site in Region North during the quarter with an estimated impact of tonnes. Norway Royal Salmon has purchased 800 tonnes of MAB in the Region North, which means that the group will increase the biomass in the sea with more than previously estimated and reduce the harvesting volume by 700 tonnes. Accelerated harvest, as well as increased mortality in the Region South in the quarter, will reduce the production in 2018 with an estimated tonnes. The farming operations hedged the price of 9.8 per cent of the harvested volume in the second quarter. For remaining quarters of 2018, tonnes are hedged at a Nasdaq equivalent price of around NOK per kg. In the second quarter, the global harvest volumes of salmon were 5 per cent higher than the year before. Harvest volumes from Norway were 8 per cent higher than last year, while the increase from Chile was 19 per cent. Sold volume to the markets increased by 8 per cent in the quarter. The demand is seen as good and the prices were high in the quarter. Looking ahead, we expect the growth in global harvest volumes to be on the same level as the second quarter of 2018 compared with the same period the year before. In the next two quarters, an average increase of 4 per cent is expected. Kontali Analyse expects a growth in global harvest volume for 2018 of 6 per cent, which is a moderate growth in a historical context. For 2019 Kontali Analyse expects a growth of 4 per cent. Together with good demand for salmon, this provide the basis for a continued positive market outlook for the industry.
11 RESPONSIBILITY STATEMENT FROM THE BOARD OF DIRECTORS AND CEO We confirm, to the best of our knowledge, that the financial report for the first half of 2018 has been prepared in accordance with IAS 34 Interim Financial Reporting, as adopted by EU, and gives a true and fair view of the Group s assets, liabilities, financial position and profits and loss for the period. We also confirm, to the best of our knowledge, that the interim management report includes a fair review of important events that have occurred during the first six months of the financial year and their impact on the condensed set of financial statements, a description of the principal risks and uncertainties for the remaining six months of the financial year, and major related parties transactions. Trondheim, 27 August 2018 Helge Gåsø Chair Kristine Landmark Vice Chair Marianne E. Johnsen John Hindar Lars Måsøval Trude Olafsen Charles Høstlund CEO
12 INTERIM REPORT INCOME STATEMENT Q2 Q2 YTD YTD FY (NOK '000) Operating revenues Cost of goods sold Salaries Depreciation Other operating costs Operational EBIT adjustments Income from associates EBIT Gain/loss on financial assets Other net financial items EBT Tax Net profit/loss Profit attributable to: Parent company shareholders Minority interests Earnings per share (NOK) 4,84 4,80 10,70 4,03 5,27 Earnings per share - diluted 4,84 4,80 10,70 4,03 5,27 EXTENDED INCOME STATEMENT Q2 Q2 YTD YTD FY (NOK '000) Net profit/loss Items to be reclassified to profit or loss: Translation differences and OCI posts from associated companies Cash Flow hedges (net) Items not to be reclassified to profit or loss: Actuarial gains on defined benefit plans (net) Total comprehensive income Total comprehensive income attributable to: Parent company shareholders Non-controlling interests
13 BALANCE SHEET (NOK '000) Intangible assets Property, plant and equipment Non-current financial assets Non-current assets Inventory and biological assets Receivables Bank deposits, cash Current assets TOTAL ASSETS Share capital Other equity Non-controlling interests Equity Pensions Deferred tax Provisions Long-term interest-bearing debt Short-term interest-bearing debt Trade payables Tax payable Other current liabilities Current liabilities TOTAL EQUITY AND LIABILITIES
14 STATEMENT OF EQUITY Equity allocated to parent company shareholders (NOK '000) Share capital Treasury shares Retained earnings Total Non-controlling interests Total equity Equity at Total comprehensive income Transactions with shareholders Dividend Share based payment Net purchase and sale of treasury shares Equity changes associated companies Total transactions w ith shareholders Equity at Equity allocated to parent company shareholders (NOK '000) Share capital Treasury shares Retained earnings Total Non-controlling interests Total equity Equity at Comprehensive income Transactions with shareholders Dividend Share based payment Net purchase and sale of treasury shares Equity changes associated companies Total transactions w ith shareholders Equity at Equity allocated to parent company shareholders (NOK '000) Share capital Treasury shares Retained earnings Total Non-controlling interests Total equity Equity at Total comprehensive income Transactions with shareholders Dividend Share based payment Net purchase and sale of treasury shares Equity changes associated companies Total transactions w ith shareholders Equity at
15 STATEMENT OF CASH FLOW Q2 Q2 YTD YTD FY (NOK '000) Operational EBIT Adjusted for: Tax paid Depreciation and w rite-dow ns Share based payment Pension costs w ith no cash effect Change in inventory / biomass Change in debtors and creditors Change in other current assets and other liabilities Net cash flow from operating activities Cash flow from investing activities Payments for purchase of PPE and licenses Payments other investments Payments(-)/proceeds(+) from realisation of non-current financial assets (TRS) Proceeds from investments in financial assets Change in loans to associates and others Net cash flow from investing activities Cash flow from financing activities Receipts from new long-term debt Long-term debt repayments Net change in overdraft Payment for acquisition of treasury shares Interest paid Dividend payment Net cash flow from financing activities Net increase (+)/ decrease (-) in cash & cash equivalents Cash and cash equivalents - opening balance Cash and cash equivalents - closing balance NOTES TO THE FINANCIAL STATEMENTS NOTE 1: Accounting principles These condensed, consolidated interim financial statements have been draw n up in accordance w ith International Financial Reporting Standards (IFRSs) and such interpretations as are determined by the EU and published by the International Accounting Standards Board, including the interim reporting standard (IAS 34). The interim financial statements do not include all the information required of an annual financial report and must therefore be read in conjunction w ith the consolidated financial statements for the 2017 financial year. The condensed consolidated interim financial statements have not been audited. As a result of rounding differences, numbers or percentages may not add up to the total. The consolidated financial statements for the Group for the year 2017 are available upon request from the company's head office at Ferjemannsveien 10, Trondheim or at w w w.norw ayroyalsalmon.com. The Group's accounting principles in this interim report are the same as described in the annual financial report for 2017.
16 NOTES TO THE FINANCIAL STATEMENTS NOTE 2: Segment information Operating segments are identified based on the reporting used by Group management to assess performance and profitability at a strategic level. The Group management is defined as the chief operating decision-makers. The Group s business areas are divided into the Sales and Fish farming. The Sales segment includes the purchase and sale of salmon. The fish farming business includes salmon farming and harvesting activities. The fish farming business is divided into two regions: Region North, which consists of the fish farming business in Troms and West Finnmark; and Region South, which consists of the fish farming business in the area around Haugesund. Transactions between the segments are made at market terms. Group management reviews monthly reports in connection with the segments. Performance is evaluated based on operating results (EBIT) per segment. Sales Farming Region North Region South Eliminations/other Total (NOK '000) Q Q Q Q Q Total sales revenues Internal sales revenues External sales revenues Operational EBIT adjustments Income from associates EBIT EBT Volume harvested (HOG) Operational EBIT per kg 25,14 27,76 23,90 29,38 24,80 28,26 Volume sold Operational EBIT per kg -0,21 0,58-0,21 0,58 - of w hich loss on open fixed-price contracts per kg. -0,47-0,01-0,47-0,01 Region North Region South Eliminations/other (NOK '000) YTD 2018 YTD 2017 YTD 2018 YTD 2017 YTD 2018 YTD 2017 YTD 2018 YTD 2017 YTD 2018 YTD 2017 Total Total sales revenues Internal sales revenues External sales revenues Operational EBIT adjustments Income from associates EBIT EBT Volume harvested (HOG) Operational EBIT per kg 21,78 25,95 21,07 29,89 21,65 26,99 Volume sold Operational EBIT per kg -0,18 0,85-0,18 0,85 - of w hich loss (-)/gain (+) on open fixed-price contracts per kg. -0,26 0,09-0,26 0,09
17 NOTES TO THE FINANCIAL STATEMENTS NOTE 3: Biomass In accordance w ith IAS 41, the biomass is recognised at fair value. The fair value is calculated in accordance w ith IFRS 13. Adjustments to the fair value of the biomass are presented on a separate line in the income statement. The technical model for calculating fair value is a present value model. Present value is calculated for the biomass on each site/project by estimating the future sales value less remaining production costs discounted to the present value at the balance sheet date. The fair value of fish in the sea is calculated in the present value model as a function of the expected biomass at the time of harvest multiplied by the expected sales price. For fish that are not harvestable, estimated remaining costs to breed the fish to its harvestable w eight are deducted. Cash flow s are discounted monthly using a discount factor. The discount factor consists of three main components: 1) risk for events that affect cash flow, 2) hypothetical license and site rent and 3) the time value of money. For this quarter a discount factor of 6.0 % has been used. Expected biomass (volume) is based on the estimated number of individuals in the sea, adjusted for expected mortality until harvesting and multiplied by the expected harvest w eight per individual at the time of harvest. The measuring unit is the individual fish, but for practical reasons the calculation is made on site level. Live w eight of fish in the sea is translated into gutted w eight to get the same measurement unit as the prices are set in. The price is calculated based on forw ard prices from Fish Pool. The forw ard price for the month in w hich the fish expected to be harvested is used in the calculation of expected cash flow. The price quoted by Fish Pool adjusted for the export cost is the reference price. This price is further adjusted for expected harvest costs (w ell boat, harvest and packing) and transport to Oslo. Adjustments for expected size differences and quality differences are also made. The adjustment in relation to the reference price is done at site level. The principle of highest and best use, according to IFRS 13 is the basis for the valuation and classification. In the fair value calculation, optimal harvest w eight is defined as harvest w eight according harvest plans. Book value of inventory: (NOK '000) Raw materials Biological assets Finished goods Total inventory Specification of the biological assets: (NOK '000) Biological assets at cost adjustments of the biomass Book value biological assets Specification of biological assets - tonnes Q Q FY 2017 Opening balance biological assets Increase due fish put in the sea Increase due to production in the period Reduction due to mortality in the period Reduction due to harvesting in the period Non-recurring items Closing balance biological assets Specification of changes in book value of biological assets: (NOK 000) Q Q FY 2017 Opening balance biological assets Increase due to production in the period Non-recurring event at cost Reduction due to harvesting in the period adjustments of the biological assets adj. of the biological assets due to non-recurring event Closing balance biological assets
18 NOTES TO THE FINANCIAL STATEMENTS NOTE 3: Biomass cont. Groups of biological assets, status as of Number of fish (1000) Biomass (tonnes) Acquisition costs adjustments Accounted value Smaller than 1 kg kg Larger than 4 kg Biological assets Groups of biological assets, status as of Number of fish (1000) Biomass (tonnes) Acquisition costs adjustments Accounted value Smaller than 1 kg kg Larger than 4 kg Biological assets Groups of biological assets, status pr Number of fish (1000) Biomass (tonnes) Acquisition costs adjustments Accounted value Smaller than 1 kg kg Larger than 4 kg Biological assets Groups of biological assets, status as of Number of fish (1000) Biomass (tonnes) Acquisition costs adjustments Accounted value Smaller than 1 kg kg Larger than 4 kg Biological assets Fish Pool forw ard prices used in the calculation of the fair value of the biomass NOK/kg NOK/kg NOK/kg NOK/kg Q ,87 Q ,55 Q ,73 Q ,85 Q ,33 Q ,25 Q ,27 Q ,05 Q ,50 Q ,12 Q ,83 Q ,05 Q ,70 Q1 + Q ,52 Q ,70 Q ,00 Q3 + Q ,70 Q3 + Q ,48 Q3 + Q ,50 Q1 + Q ,80 NOTE 4: Non-recurring events Non-recurring event 1) Destruction of desmoltified fish NRS Finnmark AS Extraordinary mortallity when delousing NRS Feøy AS The fish disease Infections Salmon Anemia (ISA) NOR Seafood AS Cost Q adjustments Cost adjustments Biological assets ) Non-recurring event not allocated to the segments. Non-recurring event 1) Destruction of desmoltified fish NRS Finnmark AS Extraordinary mortallity when delousing NRS Feøy AS The fish disease Infections Salmon Anemia (ISA) NOR Seafood AS Cost YTD 2018 YTD 2017 adjustments Cost adjustments Biological assets ) Non-recurring event not allocated to the segments. Non-recurring event 1) The fish disease Infections Salmon Anemia (ISA) NRS Finnmark AS Destruction of desmoltified fish NRS Finnmark AS Cost FY 2017 adjustments Biological assets ) Non-recurring event not allocated to the segments.
19 NOTES TO THE FINANCIAL STATEMENTS NOTE 5: adjustments adjustments which are a part of the Group s EBIT, is presented on a separate line in order to give a better understanding of the Group s operating profit from goods sold. The item consists of: (NOK '000) Q YTD 2018 YTD 2017 FY 2017 Change in fair value adjustments of the biomass Change in provision for onerous sales contracts Change in unrealised gains/losses on financial Fish Pool contracts Total fair value adjustments The fair value adjustments has the following effect in the balance sheet: (NOK '000) adjustments biomass (inventory and biological assets) Provision for onerous sales contracts (other current liabilities) of financial Fish Pool contracts (other receivables/other current liabilities) Net fair value adjustments in the balance sheet NOTE 6: Transactions with related parties The Group conducts transactions on normal terms with associates and suppliers who are also Norway Royal Salmon shareholders. This applies to the purchase of harvested fish and smolts. Purchase of smolt and fish are made at market price. The group purchase harvesting services from two of the Group s associates. Harvesting serrvices are purchased at market terms. Adminstrative services are also purchased from one of the Group's associated companies. Services and well boat services are purchased from companies controlled by the familiy of the company's Chair Helge Gåsø. The services from Gåsø Næringsutvikling AS and Frøy Akvaservice AS are purchased at market terms. Goods and services purchased: (NOK '000) Q YTD 2018 YTD 2017 Året 2017 Associates - products purchased Associates - services purchased Companies controlled by large shareholder - products purchased Companies controlled by large shareholder - services purchased Total goods and services purchased from related parties Share-based incentive schemes A bonus program based on synthetic options was introduced for the Group's management in The bonus program gives entitlement to a cash bonus based on the NRS average share price over a period prior to respectively 29 March 2014 and 24 June Bonuses are calculated 12, 24, 36, 45 and 57 months after these dates, and the bonus program includes an obligation to invest the net bonus after tax in Norway Royal Salmon ASA (NRS) shares at the market price on the relevant date. Shares purchased in accordance with the bonus program will be subject to a 12-month lock-up period. All bonus payments are conditional on full-time employment in the company. The bonus is calculated based on the increase in value of the share in NRS from 29 March 2014 and 24 June 2014, and in relation to price increases during the period on the number of shares covered by the program. The scheme covers shares allocated to the CEO. In the quarter a cost relating to the option scheme was recognised in the income statement in the amount of KNOK 541. A bonus program based on options was introduced for senior executives and key personnel in the Group on 1 April 2017.The scheme has been approved by the Board. The scheme comprises 24 employees and is divided into 4 different levels. The scheme was continued in Q The continued scheme comprises 24 employees.the option scheme has a 24 months' vesting period. The bonus program is a share-based scheme that entitles shareholders to receive shares in NRS based on the price development in Norway Royal Salmon ASA's average share price for a period prior to 20 March 2018 for the scheme introduced in 2017 and 20 March 2019 for the scheme introduced in Each employee can at most be granted rights to shares for a value in the interval between 25 per cent to 100 per cent of annual salary. The exercise price will be adjusted for dividends and changes in holdings of treasury shares. In the quarter, a cost of KNOK 735 related to the new option scheme was recognised in the accounts. Change in number of options Program introduced in 2014 Program introduced in 2017 Program introduced in 2018 All programs At 31 March Terminated Exercised in the quarter Allocated during the year (new program) Number of options at 30 June Exercise price 31,78 149,26 150,51 Number of employees in the program at the end of the quarter
Interim Report Q1-18
 Interim Report Q1-18 HIGHLIGHTS Operational EBIT of NOK 193 million o o Operational EBIT per kg of NOK 19.22 in Region North Operational EBIT per kg of NOK 15.64 in Region South The highest sold and harvested
Interim Report Q2-17
 Interim Report Q2-17 HIGHLIGHTS Operational EBIT of NOK 136 million o o o Operational EBIT per kg of NOK 29.68 in Region North Operational EBIT per kg of NOK 31.30 in Region South Non-recurring item of
Interim Report Q4-17
 Interim Report Q4-17 HIGHLIGHTS Operational EBIT of NOK 95 million o o Operational EBIT per kg of NOK 15.84 in Region North Operational EBIT per kg of NOK 14.12 in Region South The highest sold volume
NORWAY ROYA L S A L M ON PRESENTATION Q Oslo, 7 November 2017 Charles Høstlund, CEO Ola Loe, CFO 1
 PRESENTATION Q3 2017 Oslo, 7 November 2017 Charles Høstlund, CEO Ola Loe, CFO 1 AGENDA: Highlights for the period Segment information Group financials Markets Outlook 2 Highlights in Q3 2017 Operational
PRESENTATION Q Oslo, 15 August 2013 John Binde, CEO Ola Loe, CFO
 PRESENTATION Q2 2013 Oslo, 15 August 2013 John Binde, CEO Ola Loe, CFO AGENDA: Highlights for the period Segment information Group financials Outlook 2 Highlights in Q2 2013: Best quarterly operational
PRESENTATION Q Oslo, 19 February 2013 John Binde, CEO Ola Loe, CFO
 PRESENTATION Q4 2012 Oslo, 19 February 2013 John Binde, CEO Ola Loe, CFO AGENDA: Highlights for the period Segment information Group financials Outlook 2 Highlights in Q4 2012: Significant improvement
PRESENTATION Q Oslo, 14 November 2012 John Binde, CEO Ola Loe, CFO
 PRESENTATION Q3 2012 Oslo, 14 November 2012 John Binde, CEO Ola Loe, CFO AGENDA: Highlights for the period Segment information Group financials Outlook 2 Highlights in Q3 2012: Strong consumption growth
PRESENTATION Q Oslo, 26 February 2014 John Binde, CEO Ola Loe, CFO
 PRESENTATION Q4 2013 Oslo, 26 February 2014 John Binde, CEO Ola Loe, CFO AGENDA: Highlights for the period Segment information Group financials Outlook 2 Highlights in Q4 2013: The best quarterly and yearly
Presentation Q Oslo, 6 November Charles Høstlund, CEO Ola Loe, CFO
 Presentation Q3 2018 Oslo, 6 November 2018 Charles Høstlund, CEO Ola Loe, CFO Agenda 1. Highlights for the period 2. Segment information 3. Group financials 4. Markets 5. Projects for growth 6. Outlook
Presentation Q Oslo, 8 May Charles Høstlund, CEO Ola Loe, CFO
 Presentation Q1 2018 Oslo, 8 May 2018 Charles Høstlund, CEO Ola Loe, CFO Agenda 1. Highlights for the period 2. Segment information 3. Group financials 4. Markets 5. Projects for growth 6. Outlook 2 Highlights
Highlights for the quarter Q2 / EBIT NOK 60 million pre biomass write-down
 Half year report Highlights for the quarter EBIT NOK 60 million pre biomass write-down EBIT pre fair value and biomass write-down (NOK million) 318 348 300 101 60 Mainstream results negatively impacted
SalMar ASA First quarter
 SalMar ASA First quarter 2009 1 STRONG SALMON PRICES AND SATISFACTORY EARNINGS Strong salmon prices contributed to satisfactory earnings for the SalMar Group in the first quarter 2009. While Scottish Sea
Q BAKKAFROST GROUP Oslo 20 February 2018
 BAKKAFROST GROUP Oslo 20 February 2018 DISCLAIMER This presentation includes statements regarding future results, which are subject to risks and uncertainties. Consequently, actual results may differ significantly
Q May 12th Oslo
 Q1 2016 May 12th Oslo Lerøy Seafood Group ASA CEO Henning Beltestad CFO Sjur S. Malm Agenda Highlights Key financial figures Outlook Q1 2016 EBIT before FV adj. NOK 584.5 million EBIT/kg all inclusive
Q November 9th. Lerøy Seafood Group ASA. CEO Henning Beltestad CFO Sjur S. Malm
 Q3 2017 November 9th Lerøy Seafood Group ASA CEO Henning Beltestad CFO Sjur S. Malm Agenda Highlights Key financial figures Outlook Q3 2017 EBIT before FV adj. NOK 861 million Harvest volume 46 024 GWT
THIRD QUARTER / 2018
 REPORT FOR THE THIRD QUARTER 2018 HIGHLIGHTS Operationally strong quarter, with cost improvements and good price achievement. Record-high volume for sales & processing with positive contribution Total
SalMar ASA. Presentation Q CEO Yngve Myhre, CFO Trond Tuvstein Oslo, 14 November w w w. s a l m a r. n o
 Presentation Q3 2013 SalMar ASA CEO Yngve Myhre, CFO Trond Tuvstein Oslo, 14 November 2013 2 Agenda Highlights Financial update Operational update Market and outlook Third quarter highlights Another strong
Marine Harvest. Q Presentation 22 August 2018
 Marine Harvest Q2 2018 Presentation 22 August 2018 Forward looking statements This presentation may be deemed to include forward-looking statements, such as statements that relate to Marine Harvest s contracted
Q MAY 8TH 2018
 Q1 2018 MAY 8TH 2018 1. Highlights 2. Key Financial Figures 3. Outlook Highlights Klikke for å legge til annet bilde Q1 2018 - EBIT beforefv adj. NOK 960 million - Harvest volume 37576 GWT - EBIT/kg all
FOURTH QUARTER / 2014
 SATISFACTORY RESULT DESPITE BIOLOGICAL CHALLENGES HIGHLIGHTS IN THE FOURTH QUARTER 2014 Good salmon prices and high harvested volume produced profit growth and record operating revenues. 50% of the harvested
Third QUARTER / 2017
 STRONG OPERATIONS AND IMPROVING BIOLOGY HIGHLIGHTS IN THE THIRD QUARTER Strong operations and effective management of the improving biological situation Lower production costs and higher prices achieved
Marine Harvest. Q Presentation 24 August 2017
 Marine Harvest Q2 2017 Presentation 24 August 2017 1 Forward looking statements This presentation may be deemed to include forward-looking statements, such as statements that relate to Marine Harvest s
Q BAKKAFROST GROUP Oslo 19 February 2019
 BAKKAFROST GROUP Oslo 19 February 2019 DISCLAIMER This presentation includes statements regarding future results, which are subject to risks and uncertainties. Consequently, actual results may differ significantly
Marine Harvest. Q Presentation 1 November 2017
 Marine Harvest 1 Q3 2017 Presentation 1 November 2017 Forward looking statements This presentation may be deemed to include forward-looking statements, such as statements that relate to Marine Harvest
Marine Harvest. Q Presentation 10 May 2017
 Marine Harvest Q1 2017 Presentation 10 May 2017 1 Forward looking statements This presentation may be deemed to include forward-looking statements, such as statements that relate to Marine Harvest s contracted
Financial report Q3 2014
 Financial report Q3 2014 Austevoll Seafood ASA Financial report Q3 2014 Index Key figures for the Group... 03 Q3 2014... 04 Operating segments... 04 Cash flows... 05 Financial information as of 30 September
Marine Harvest. Q Presentation 14 February 2018
 Marine Harvest Q4 2017 Presentation 14 February 2018 1 Forward looking statements This presentation may be deemed to include forward-looking statements, such as statements that relate to Marine Harvest
Villa Organic AS fourth quarter 2012
 Notice to shareholders; Villa Organic AS fourth quarter 2012 Highlights fourth quarter 2012 The average prices were approximately at the same level as Q3, but improvement was observed towards the end of
Q NOVEMBER 8TH 2018
 Q3 2018 NOVEMBER 8TH 2018 1. Highlights 2. Key Financial Figures 3. Outlook Highlights Klikke for å legge til annet bilde Q3 2018 - EBIT before FV adj. NOK 660 million - Harvest volume 37 227 GWT - EBIT/kg
P/F Bakkafrost Condensed Consolidated Interim Report for Q and 9 months 2013
 P/F Bakkafrost Condensed Consolidated Interim Report for Q3 2013 and 9 months 2013 15000 10000 5000 0 Harvest volume - TGW Q3 12 Q4 12 Q1 13 Q2 13 Q3 13 Operational EBIT mdkk 200 150 100 50 0 Q3 12 Q4
Q August 24th. Lerøy Seafood Group ASA. CEO Henning Beltestad CFO Sjur S. Malm
 Q2 2017 August 24th Lerøy Seafood Group ASA CEO Henning Beltestad CFO Sjur S. Malm Agenda Highlights Key financial figures Outlook Q2 2017 EBIT before FV adj. NOK 801 million Harvest volume 26 156 GWT
Operating revenue NOK million Operational EBIT NOK million. Harvest volume (HOG) tonnes Q3 09 Q4 09 Q1 10 Q2 10 Q3 10
 tonnes Q3 09 Q4 09 Q1 10 Q2 10 Q3 10") Solid performance in a strong market Strong price achievement and solid results in Norway Return on Capital Employed of 18.9% in the quarter Favourable market balance expected to support a strong market
Solid performance in a strong market Strong price achievement and solid results in Norway Return on Capital Employed of 18.9% in the quarter Favourable market balance expected to support a strong market
BAKKAFROST INTRAFISH SEAFOOD INVESTOR FORUM London 13 September 2018
 BAKKAFROST INTRAFISH SEAFOOD INVESTOR FORUM London 13 September 2018 DISCLAIMER This presentation includes statements regarding future results, which are subject to risks and uncertainties. Consequently,
Q U A R T E R L Y R E P O R T 2 N D Q U A R T E R
 Q U A R T E R L Y R E P O R T 2 N D Q U A R T E R 2 0 0 7 1. Grieg Seafood develops as planned Grieg Seafood was listed in June, and has now 869 shareholders after 2 shares issues of MNOK 700 in total.
FOURTH QUARTER / 2016
 SATISFACTORY RESULT DESPITE BIOLOGICAL CHALLENGES HIGHLIGHTS IN THE FOURTH QUARTER 2016 Continued high salmon prices result in revenue and profit growth. High production costs for part of the volume harvested
Marine Harvest Q Presentation
 Marine Harvest Q2 2015 Presentation Forward looking statements This presentation may be deemed to include forward-looking statements, such as statements that relate to Marine Harvest s contracted volumes,
Q BAKKAFROST GROUP Oslo 21 August 2018
 BAKKAFROST GROUP Oslo 21 August DISCLAIMER This presentation includes statements regarding future results, which are subject to risks and uncertainties. Consequently, actual results may differ significantly
Presentation of Cermaq
 Presentation of Cermaq North Atlantic Seafood Seminar Oslo, 8 th March 2012 Agenda Introduction to Cermaq Key results 2011 Focus on Mainstream Chile Outlook 2012 Photograph: Alf Børjesson 2 This is Cermaq
Marine Harvest Q Presentation
 Marine Harvest Q2 2014 Presentation Forward looking statements This presentation may be deemed to include forward-looking statements, such as statements that relate to Marine Harvest s contracted volumes,
Lerøy Seafood Group. Preliminary financial figures February 25th Helge Singelstad. Alf-Helge Aarskog. Ivan Vindheim.
 Lerøy Seafood Group Preliminary financial figures 2009 February 25th 2010 Helge Singelstad Chairman Alf-Helge Aarskog CEO Ivan Vindheim CFO 1 Agenda 1. 1 Considerations 2. 2 Key financial figures Q4 2009
Marine Harvest Q Presentation
 Marine Harvest Q1 2015 Presentation Forward looking statements This presentation may be deemed to include forward-looking statements, such as statements that relate to Marine Harvest s contracted volumes,
SalMar ASA. Presentation Q CEO Leif Inge Nordhammer CFO Trond Tuvstein
 SalMar ASA Presentation Q1 2015 CEO Leif Inge Nordhammer CFO Trond Tuvstein Agenda Highlights Financial update Operational update Outlook First quarter 2015 highlights Improved operations Challenging biological
All figures in NOK 1,000 Q3 11 Q3 10 Sept. 30, 2011 Sept. 30,
 Austevoll Seafood ASA 0 INTERIM REPORT Q3 2011 Significant reduction in interest-bearing liabilities in the quarter Third quarter is low season for production of pelagic fish in Europe and South America
RS Platou Markets. Seafood conference. 10th June 2010
 RS Platou Markets Seafood conference 10th June 2010 Agenda Introduction to Cermaq Highlights Q1 2010 and outlook full year Chile Recovery 2 Overview of Cermaq One of the global leaders in the aquaculture
 - - - - - - - 20 000 15 000 10 000 5 000 0 2017 2014 2013 2012 2011 2010 2009 2008 2007 2006 2005 2004 2003 2002 2001 2000 1999 1995 1 400 30 1 200 25 1 000 800 600 400 777 20 15 10 16,5 200 5 0 0 Q4/17
Events after balance sheet date
 Austevoll Seafood ASA 0 Financial Report Q4 2011 Successful second fishing season for anchoveta in Peru A positive result recorded for fish farming, sale and distribution, in difficult conditions Seasonally,
15,000 12, , , , ,158 13,004 12, , ,664
 15,000 12,000 13,004 10,934 12,940 13,158 10,664 350 307 300 9,000 335 255 254 30 26.34 21.58 22.26 23.22 16 Q2 16 Q3 16 24.33 20 200 6,000 10 100 3,000 0 400 16 Q2 16 Q3 16 Q4 16 17 0 16 Q2 16 Q3 16 Q4
P/F Bakkafrost. Condensed Consolidated Interim Report for Q and 12 Months Operational EBIT mdkk
 P/F Bakkafrost Condensed Consolidated Interim Report for Q4 2015 and 12 Months 2015 Harvest volume TGW 15,000 12,000 9,000 6,000 3,000 Q4 14 Q1 15 Q2 15 Q3 15 Q4 15 Operational EBIT mdkk 300 250 200 150
Lerøy Seafood Group. Quarterly report Second quarter August 19th Helge Singelstad. Ivan Vindheim CEO CFO
 Lerøy Seafood Group Quarterly report Second quarter 2009 August 19th 2009 Helge Singelstad CEO Ivan Vindheim CFO 1 Agenda 1. 1 Considerations 2. 2 Key financial figures Q2 2009 3. 3 Lerøy at a glance 4.
Austevoll Seafood ASA
 Austevoll Seafood ASA Financial Report Q3 2017 Index Key figures for the Group...03 Q3 2017...04 Operating segments...04 Cash flow Q3 2017...07 Financial factors at 30 September 2017...07 Cash flows at
Harvest volume (HOG) tons. Operational EBIT NOK million. Operational revenue NOK million Q2 10 Q3 10 Q4 10 Q1 11 Q2 11 Q2 10 Q3 10 Q4 10 Q1 11 Q2 11
 tons. Operational EBIT NOK million. Operational revenue NOK million Q2 10 Q3 10 Q4 10 Q1 11 Q2 11 Q2 10 Q3 10 Q4 10 Q1 11 Q2 11") Improved price achievement in a falling market Operational EBIT increased 13% ROACE of 26% in the quarter NIBD NOK 5.8 billion after dividend of NOK 2.9 billion High contract share in the second half of
Improved price achievement in a falling market Operational EBIT increased 13% ROACE of 26% in the quarter NIBD NOK 5.8 billion after dividend of NOK 2.9 billion High contract share in the second half of
Marine Harvest Q Presentation
 Marine Harvest Q1 2014 Presentation Forward looking statements This presentation may be deemed to include forward-looking statements, such as statements that relate to Marine Harvest s contracted volumes,
Q BAKKAFROST GROUP Oslo 10 May 2016
 2016 BAKKAFROST GROUP Oslo 10 May 2016 DISCLAIMER This presentation includes statements regarding future results, which are subject to risks and uncertainties. Consequently, actual results may differ significantly
Grieg Seafood ASA. griegseafood.com. Andreas Kvame CEO. Atle Harald Sandtorv CFO. 8 November 2017
 Grieg Seafood ASA Andreas Kvame CEO Atle Harald Sandtorv CFO 8 November 2017 1 Agenda Highlights This is Grieg Seafood Business Units (Regions) Financials Outlook 2 Highlights Q3 2017 Improved results
Harvest volume (GW) tonnes. Operating revenue NOK million. Operational EBIT NOK million Q1 11 Q2 11 Q3 11 Q4 11 Q1 12 Q1 11 Q2 11 Q3 11 Q4 11 Q1 12
 tonnes. Operating revenue NOK million. Operational EBIT NOK million Q1 11 Q2 11 Q3 11 Q4 11 Q1 12 Q1 11 Q2 11 Q3 11 Q4 11 Q1 12") 33 % industry supply growth market prices down 33 % from Q1 2011 Strong demand increased prices from Q4 2011 Strong performance in Scotland Poor results in VAP Europe Operational EBIT of NOK 276 million
33 % industry supply growth market prices down 33 % from Q1 2011 Strong demand increased prices from Q4 2011 Strong performance in Scotland Poor results in VAP Europe Operational EBIT of NOK 276 million
Lerøy Seafood Group SEPTEMBER 2018
 Lerøy Seafood Group SEPTEMBER 2018 1. Lerøy Seafood Group 2. Key market trends supply and demand Our vision To be the leading and most profitable global supplier of sustainable high-quality seafood History
Q BAKKAFROST GROUP New York 19 May 2016
 2016 BAKKAFROST GROUP New York 19 May 2016 DISCLAIMER This presentation includes statements regarding future results, which are subject to risks and uncertainties. Consequently, actual results may differ
Aker Seafoods Second quarter 2009 Sales of fresh products up, but prices down
 Aker Seafoods Second quarter Sales of fresh products up, but prices down CEO Yngve Myhre CFO Gunnar Aasbø Interim presentation second quarter 1 Welcome Agenda Topic Operational Update Group Harvesting
Aker Seafoods Second quarter 2010 Profits improved in high season
 Aker Seafoods Second quarter 21 Profits improved in high season CEO Liv Monica B Stubholt CFO Gunnar Aasbø-Skinderhaug Welcome Agenda Topic Speaker Operational Update Liv Monica Stubholt, CEO Group Harvesting
Interim Report. January September 2013
 Interim Report January September 2013 Disclaimer Albain Bidco Norway AS is providing the following financial results for the third quarter of 2013 to holders of its EUR225,000,000 6.750% Senior Secured
Grieg Seafood ASA - Second Quarter 2012 & First Half 2012 Report. Highlights Second Quarter 2012 & First Half 2012 Report
 Grieg Seafood ASA - Second Quarter 2012 & First Half 2012 Report Highlights Second Quarter 2012 & First Half 2012 Report Further strong increase in global supply. Sound increase in demand in most markets.
Weekly Salmon Outlook Week
 Week 10-20 Page 1 of 8 Harvest of Atlantic salmon in Norway continued to grow in week 9. The harvest volume (23 000 tonnes wfe) was up 1000 tonnes from the previous week and 3% higher than in the corresponding
Lerøy Seafood Group. Quarterly report First quarter May 12th Helge Singelstad. Henning Beltestad. Ivan Vindheim.
 Lerøy Seafood Group Quarterly report First quarter 2010 May 12th 2010 Helge Singelstad Chairman Henning Beltestad CEO Ivan Vindheim CFO 1 Agenda 1. 1 Considerations 2. 2 Key financial figures Q1 2010 3.
Austevoll Seafood ASA
 Austevoll Seafood ASA Financial Report Q4 2016 and preliminary figures for 2016 INDEX Key figures for the group... 03 Q4 2016... 04 Operating segments... 04 Cash Flows Q4 2016... 06 Cash flows 2016...07
Austevoll Seafood ASA Financial report 4th quarter 2006
 Austevoll Seafood ASA Financial report 4th quarter 2006 Page 1 of 10 The group s pro forma income for 2006 was NOK 3 465,9 million and the pro forma operating profit/loss before depreciation and amortization
SalMar ASA. Presentation Q CEO Olav-Andreas Ervik CFO Trond Tuvstein
 SalMar ASA Presentation Q1 2018 CEO Olav-Andreas Ervik CFO Trond Tuvstein Olav-Andreas Ervik new CEO of SalMar 41 years, from Frøya More than 20 years of experience from the aquaculture industry Worked
Interim report Q4 2018
 Interim report Q4 2018 Interim report Q4 2018 Kid ASA Dear Shareholders The fourth quarter of 2018 was the best three month period ever for Kid. The early winter and Christmas season is extremely busy
Atlantic Sapphire AS. Interim Financial Statements. June, 2018
 Atlantic Sapphire AS Interim Financial Statements June, 2018 In accordance with International Financial Reporting Standards Statement by the Management and the Board of Directors on the June, 2018 Interim
Contents Highlights 3 rd quarter Key figures... 3 A strong quarter despite weaker market conditions... 4 Financial review...
 Contents Highlights 3 rd quarter 2018... 3 Key figures... 3 A strong quarter despite weaker market conditions... 4 Financial review... 5 Group results... 5 Cash flow... 6 Financial position... 6 Segments...
Q Nova Austral Financial Reporting May 2nd, 2018
 Q1-2018 Nova Austral Financial Reporting May 2nd, 2018 Agenda A. Nova Austral Pillars & Fundamentals B. Market and company updates C. Financial Report 1) Key Financial summary 2) LTM EBITDA, Revenue and
Austevoll Seafood ASA
 Austevoll Seafood ASA Financial report Q4 2017 and preliminary figures for 2017 Index Key figures for the Group...03 Q4 2017...04 Operating segments...04 Cashflows Q4 2017...07 Financial information 2017...
Austevoll Seafood ASA
 Austevoll Seafood ASA Financial report Q2 and H1 2016 INDEX key figures for the group... 03 Q2 2016... 04 Operating segments... 04 Cash Flows, Q2 2016... 06 Financial information, H1 2016... 07 Cash Flow,
INTERIM REPORT 2015 FIRST QUARTER (Q1)
") INTERIM REPORT 2015 FIRST QUARTER (Q1) Summary - Revenue in the first quarter came to 570 million kroner, 61 million kroner higher than the first quarter of 2014 - Higher revenue was mainly a result of
INTERIM REPORT 2015 FIRST QUARTER (Q1) Summary - Revenue in the first quarter came to 570 million kroner, 61 million kroner higher than the first quarter of 2014 - Higher revenue was mainly a result of
Significant growth outside Norway
 Significant growth outside Norway Second quarter 2018 HIGHLIGHTS Continued good activity across all regions and segments Growth in revenue (17%), in particular by Americas and EME (Europe and Middle East)
Highlights Fourth Quarter 2016
 1 2 Highlights Fourth Quarter 2016 GSF s best quarter ever with EBIT of MNOK 456 (EBIT per kg: NOK 21.80). High harvest volume (20 917 tons) in a strong market. The Board proposes a dividend of NOK 3 per
Presentatio. on Q3 2010
 Presentatio on Q3 2010 CEO Regin Jacobsen CFO Teitur Samuelsen Oslo November 9 th 2010 Disclaimer This presentation includes statements regarding future results, which are subject to risks and uncertainties.
Financial Report Q FINANCIAL REPORT Q1 2010
 Financial Report Q4 2010 FINANCIAL REPORT Q1 2010 Austevoll Seafood ASA 0 Interim Report Q4 2010 Fourth quarter also achieved record-high operating result Good market and good prices for salmon and trout
Salmon price, demand and market trends
 Salmon price, demand and market trends Kolbjørn Giskeødegård, Director 21 November 2018 Salmon supply growth dramaticly down after 2012 2 500 2013-17: CAGR 2% 2 000 1 500 2003-12: CAGR 8% 1 000 500 0 2003
Positive underlying development
 Positive underlying development Fourth quarter 2017 HIGHLIGHTS Growth in revenue (+24%) Continued high market activity across all regions and segments Order intake of 557 MNOK in the quarter, on the same
Third quarter report Quarterly report Nr
 Third quarter report 2011 Quarterly report Nr 3 2011 Highlights Operating revenues in Q3 was 226.7 MNOK compared to 212.3 in Q3 last year an increase of 6.8% EBITDA in Q3 was 22.0 MNOK compared to 10.2
Harvest volume (GW) tonnes. Operating revenue NOK million. Operational EBIT NOK million Q2 11 Q3 11 Q4 11 Q1 12 Q2 12 Q2 11 Q3 11 Q4 11 Q1 12 Q2 12
 tonnes. Operating revenue NOK million. Operational EBIT NOK million Q2 11 Q3 11 Q4 11 Q1 12 Q2 12 Q2 11 Q3 11 Q4 11 Q1 12 Q2 12") The market showed strong ability to absorb 30% industry growth Prices in line with Q1 - Down 24% in Europe and ~35% in the US compared to Q2 2011 Satisfactory performance in Norway - excellent result in
The market showed strong ability to absorb 30% industry growth Prices in line with Q1 - Down 24% in Europe and ~35% in the US compared to Q2 2011 Satisfactory performance in Norway - excellent result in
Alternative Performance Measures (APM)/ Non-IFRS Financial Measures. Definitions of Alternative Performance Measures/ Non-IFRS Financial Measures
/ Non-IFRS Financial Measures. Definitions of Alternative Performance Measures/ Non-IFRS Financial Measures") Alternative Performance Measures (APM)/ Non-IFRS Financial Measures Our Alternative Performance Measures (APMs) present useful information which supplements the financial statements. These measures are
Alternative Performance Measures (APM)/ Non-IFRS Financial Measures Our Alternative Performance Measures (APMs) present useful information which supplements the financial statements. These measures are
From Copeinca to Mitsubishi and beyond. Jon Hindar CEO London, 31 October 2014
 From Copeinca to Mitsubishi and beyond Jon Hindar CEO London, 31 October 2014 A roller coaster with a happy ending for Cermaq and for the industry Page 2 A roller coaster with a happy ending for Cermaq
Alternative Performance Measures (APM) / Non-IFRS Financial Measures. Definitions of Alternative Performance Measures, Non-IFRS Financial Measures
 / Non-IFRS Financial Measures. Definitions of Alternative Performance Measures, Non-IFRS Financial Measures") Alternative Performance Measures (APM) / Non-IFRS Financial Measures Our Alternative Performance Measures (APMs) present useful information which supplements the financial statements. These measures are
Alternative Performance Measures (APM) / Non-IFRS Financial Measures Our Alternative Performance Measures (APMs) present useful information which supplements the financial statements. These measures are
First quarter report 1
 report 1 2 FIRST QUARTER REPORT Contents Contents Financial review 3 Overview 3 Market developments and outlook 5 Additional factors impacting Hydro 7 Underlying EBIT 8 Finance 12 Tax 12 Items excluded
Q THIRD QUARTER BAKKAFROST GROUP Glyvrar 5 November 2013
 Q3 2013 THIRD QUARTER BAKKAFROST GROUP Glyvrar 5 November 2013 DISCLAIMER This presentation includes statements regarding future results, which are subject to risks and uncertainties. Consequently, actual
Chile, que pasa? -an update of the situation for salmon farming in Chile, - issues and potential solutions
 Chile, que pasa? -an update of the situation for salmon farming in Chile, - issues and potential solutions Intrafish / DNB investor conference London, 4 November, 2015 Jon Hindar CEO Cermaq Group The starting
For personal use only
 PRELIMINARY FULL YEAR REPORT ANNOUNCEMENT The a2 Milk Company Limited For the year ended 30 June 2016 Preliminary full year (12 month) report on consolidated results (including the results for the previous
Q BAKKAFROST GROUP Oslo February 24 th 2015
 Q4 2014 BAKKAFROST GROUP Oslo February 24 th 2015 DISCLAIMER This presentation includes statements regarding future results, which are subject to risks and uncertainties. Consequently, actual results may
Good market activity continues
 Good market activity continues First quarter 2017 HIGHLIGHTS Good market activity across all regions High quoting activity in the Land Based segment Strong growth in order intake and revenue (+34% / +30%)
Q Presentation. Oslo November 2 nd 2018 Hallvard Muri, CEO Simon Nyquist Martinsen, CFO
 Q3 218 Presentation Oslo November 2 nd 218 Hallvard Muri, CEO Simon Nyquist Martinsen, CFO Agenda Highlights Financial performance Outlook Q&A Highlights Q3 218 by CEO Hallvard Muri Order Intake development
Consolidated Financial Statements 2017
 Notes Table of to contents the consolidated financial statements Consolidated Financial Statements 2017 The consolidated financial statements consist of 97 Key figures 98 Income statement 99 Statement
INTERIM PRESENTATION Second quarter, 2006
 INTERIM PRESENTATION Second quarter, 6 CEO Yngve Myhre CFO Bent M. Skisaker Agenda Operational Update Group Harvesting Processing Norway and Denmark Strategic considerations and Outlook Financials Income
Grieg Seafood ASA Quarterly report Q4 2018
 bv Grieg Seafood ASA Quarterly report ABOUT GRIEG SEAFOOD Grieg Seafood ASA is one of the world's leading salmon farmers, specializing in Atlantic salmon. The Group has an annual production target of 100
Q BAKKAFROST GROUP Glyvrar 20 May 2014
 Q1 014 BAKKAFROST GROUP Glyvrar 0 May 014 DISCLAIMER This presentation includes statements regarding future results, which are subject to risks and uncertainties. Consequently, actual results may differ
Q Financial presentation. CEO - Arne Møgster CFO - Britt Kathrine Drivenes
 Q2 2018 Financial presentation CEO - Arne Møgster CFO - Britt Kathrine Drivenes Highlights All figures in NOK 1,000 Q2 2018 Q2 2017 H1 2018 H1 2017 2017 Revenue 6 001 380 5 019 195 11 754 529 11 094 149
Cermaq ASA Presentation for Pareto Securities Oslo, 14 th June 2012
 Cermaq ASA Presentation for Pareto Securities Oslo, 14 th June 2012 1 2020 2015 2010 2005 2000 1995 1990 1985 1980 1975 1970 1965 1960 1955 1950 Aquaculture: a sustainable growth industry Our growing population
Q Financial presentation. Arne Møgster CEO Britt Kathrine Drivenes CFO
 Q1 2018 Financial presentation Arne Møgster CEO Britt Kathrine Drivenes CFO Highlights All figures in MNOK Q1 2018 Q1 2017 2017 Revenue 5 753 6 075 20 799 EBITDA* 1 445 1 555 4 747 EBIT* 1 217 1 331 3
Interim report Q2 2018
 Interim report Q2 2018 Dear Shareholders Interim report Q2 2018 Kid ASA The second quarter is our most weather-dependent period of the year as we target the Norwegian consumer s outdoor home environment.
Interim report for the first half year 2016
 Interim report for the first half year 2016 1 CONTENTS Report 3 Financial highlights and ratios 4 Management report 6 Outlook 6 Events after the end of the period 6 Stock Exchange announcements in 2016