Marine Harvest Q Presentation
|
|
|
- Dale Watson
- 5 years ago
- Views:
Transcription

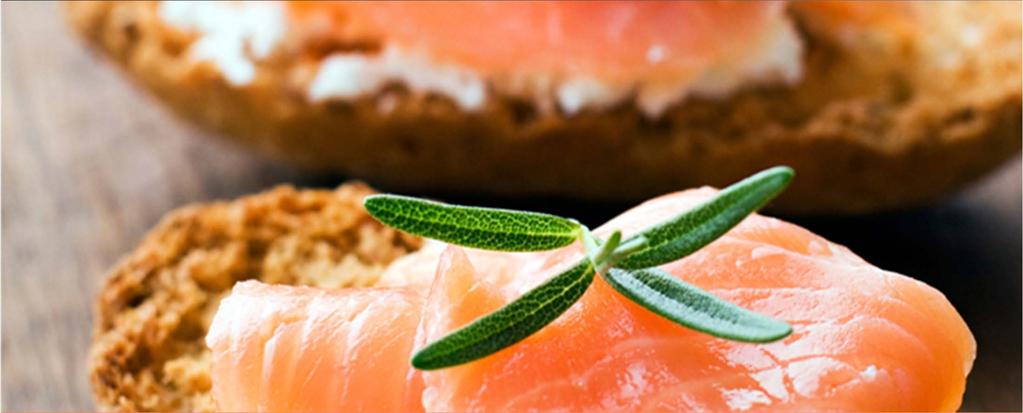
1 Marine Harvest Q Presentation
2 Forward looking statements This presentation may be deemed to include forward-looking statements, such as statements that relate to Marine Harvest s contracted volumes, goals and strategies, including strategic focus areas, salmon prices, ability to increase or vary harvest volume, the anticipated business combination between MH Chile and Aqua Chile, production capacity, expectations of the capacity of our fish feed plant, trends in the seafood industry, including industry supply outlook, exchange rate and interest rate hedging policies and fluctuations, dividend policy and guidance, asset base investments, capital expenditures and net working capital guidance, NIBD target, cash flow guidance and financing update, guidance on financial commitments and cost of debt and various other matters concerning Marine Harvest's business and results. These statements speak of Marine Harvest s plans, goals, targets, strategies, beliefs, and expectations, and refer to estimates or use similar terms. Actual results could differ materially from those indicated by these statements because the realization of those results is subject to many risks and uncertainties. Our registration statement on Form 20-F filed with the US Securities and Exchange Commission in 2014 contain information about specific factors that could cause actual results to differ, and you are urged to read them. Marine Harvest disclaims any continuing accuracy of the information provided in this presentation after today. 2
3 Highlights Satisfactory operational EBIT of NOK 932m - Strong contribution from Norway - Challenging market conditions in Americas Convertible bonds converted to share capital Quarterly dividend of NOK 1.30 per share - To be paid in the form of a repayment of paid in capital 3
4 Key financials Marine Harvest Group - main figures Q Q Unaudited NOK million Operational revenue and other income Reclassifed Operational EBIT 1) Cash flow from operations Net interest-bearing debt (NIBD) Underlying EPS (NOK) 2) Net cash flow per share (NOK) 3) ROCE 4) 17.6% 19.2% 18.7% Harvest volume (gutted weight tons, salmon) Operational EBIT - NOK per kg 5) - Total Norway Scotland Canada Notes in appendix 4
5 Market NOK per kg (Oslo) USD per kg (Miami and Seattle) Weekly reference prices 0 Reference price Norway (NASDAQ Oslo) Reference Price Chile (C trim fillet in Miami) Reference price North America (HOG Seattle) Prices in Europe at good levels despite weak Russian demand Weak prices in Americas North American supply growth Currency fluctuations impacting trade flows in several markets 5
6 Price achievement by origin 120% 111% 100% 100% 92% 93% 98% 98% 80% 60% 40% 20% 0% Norwegian Scottish Canadian Q Q Contract share 33% 68% 0% Superior share 92% 90% 86% Note: Q average price achievement is measured versus reference prices in all markets (Norway/Faroes (NASDAQ), Scotland (NASDAQ+ NOK 1.74), Canada (UB Seattle) 6
7 Operational EBIT comparison (reclassified) NOK million Op EBIT Q MH Feed Farming Markets Consumer Products Other Op EBIT Q
8 Norway SALMON OF NORWEGIAN ORIGIN Q Q NOK million Reclassifed Operational EBIT Harvest volume Operational EBIT per kg of which MH Markets of which MH Consumer Products Exceptional items incl in op. EBIT Exceptional items per kg Op EBIT Q Operational EBIT Salmon of Norwegian Origin Q reclassified vs Q Price Volume Feed Oth SW costs Non SW costs Op EBIT Q Price achievement/reference price 100% 92% Contract coverage 33% 40% Superior share 92% 91% Strong results in the quarter Lower spot price offset by a more favourable contract portfolio Increased treatment costs due to biological issues and higher sea temperatures - Sea lice mitigation costs of NOK 1.65 per kg in the quarter Note: Details on Nova Sea in appendix 8
9 Norway: Sales contract portfolio Contracted volumes (HOG tonnes) Q Q Q Q Q Q Realised contract volumes last quarters Contracted volumes next quarters Note: Marine Harvest Norway s fixed price/fixed volume contracts with third party customers and MH s processing entities. MH s processing entities cover a large proportion of their sales exposure through third party end product contracts. 9
10 Norway: Operational EBIT/kg per region NOK per kg South West Mid North Total 2014 Q Q1 Including contribution from Sales and Marketing 10
11 Scotland SALMON OF SCOTTISH ORIGIN Q Q NOK million Reclassifed Operational EBIT Harvest volume Operational EBIT Salmon of Scottish Origin Q reclassified vs Q Operational EBIT per kg of which MH Markets of which MH Consumer Products Exceptional items incl in op. EBIT Exceptional items per kg Op EBIT Q Price Volume Feed Oth SW costs Non SW costs Translation Op EBIT Q Price achievement/reference price 111% 93% Contract coverage 68% 64% Superior share 90% 95% Results impacted by biological issues as expected - Low volumes due to mortality in current generation - High biological costs on harvested fish (AGD and lice treatments) Prices in local market negatively affected by strengthening of GBP Cost improvements expected going forward 11
12 Canada SALMON OF CANADIAN ORIGIN Q Q NOK million Reclassifed 150 Operational EBIT Salmon of Canadian Origin Q reclassified vs Q Operational EBIT Harvest volume Operational EBIT per kg of which MH Markets of which MH Consumer Products Exceptional items incl in op. EBIT 0 0 Exceptional items per kg Op EBIT Q Price Volume Feed Oth SW costs Non SW costs Translation Op EBIT Q Price achievement/reference price 98% 98% Contract coverage 0% 0% Superior share 86% 76% Low prices due to high supply growth in Americas Strong biological performance 12
13 Ireland and Faroes SALMON OF IRISH ORIGIN Q Q NOK million Reclassifed Operational EBIT 0 4 Harvest volume Operational EBIT per kg of which MH Markets of which MH Consumer Products Exceptional items incl in op. EBIT 0 0 Exceptional items per kg Price achievement/reference price na na Contract coverage 95% 96% Superior share 92% 90% SALMON OF FAROESE ORIGIN Q Q NOK million Reclassifed Operational EBIT Harvest volume Operational EBIT per kg of which MH Markets of which MH Consumer Products Exceptional items incl in op. EBIT 0 0 Exceptional items per kg Price achievement/reference price 0% 101% Contract coverage 0% 0% Superior share 0% 97% No volumes in the Faroes until Q

 25 814 24 875 Exceptional items 0")


14 Consumer Products MH CONSUMER PRODUCTS NOK million Q Q Operating revenues Operational EBIT Operatonal EBIT % -0.1% -3.0% Volume sold (tons product weight) Exceptional items 0 0 Volume share salmon 69% 69% Revenue share salmon 74% 75% Improvements year over year, but still not satisfactory earnings - French smoked operations still challenging - Start-up costs in connection with new processing plant in Rosyth, Scotland Please note that Consumer Products is the combined operations of the former VAP Europe and Morpol 14

15 Feed FEED NOK million Q Q Operating revenues Operational EBIT Operational EBIT % 4.8% na Feed sold volume na Feed produced volume na Exceptional items 0 na MH Feed impacted by low season and third party commitments - Third party feed supply contracts will diminish during 2015 Notes: (1) Based on 2015 harvest volume estimate 15
16 Discontinued operations Chile and US operations SALMON OF CHILEAN ORIGIN - discontinued operation NOK million Q Q Operational EBIT Salmon of Chilean Origin Disontinued Operation Q vs Q Operational EBIT Harvest volume Operational EBIT per kg of which MH Markets of which MH Consumer Products Exceptional items incl in op. EBIT Exceptional items per kg Op EBIT Q Price Volume Feed Oth SW costs Non SW costs Translation Op EBIT Q Price achievement/reference price 110% 103% Contract coverage 12% 29% Superior share 87% 84% Continued weak prices and unfavorable currency movements Costs affected by challenging biology and exceptional mortality - Full cost in box USD 5.2 per kg (HOG), including exceptional items - Exceptional mortality of NOK 51m in Region XI Volcanic eruption expected to have limited financial impact Notes: CTA with AquaChile; MH Chile to own 42.8% in combined entity 16
17 First Quarter 2015 Financials, Harvest Volumes and Markets 17
18 Profit and Loss Marine Harvest Group Q Q NOK million Reclassifed Operational revenue and other income Operational EBIT 1) Unrealized salmon derivatives Change in unrealized internal profit feed Net fair value adjustment of biomass, onerous contracts Restucturing costs Other non-operational items Income from associated companies Impairment losses - fixed assets EBIT Net financial items Earnings before tax Profit or loss for the period EPS (NOK) Operational EBIT margin 16.5% 18.5% 17.2% Harvest volume, HOG tons (salmonids) Operational EBIT per kg incl margin from Sales and Marke ROCE 3 ) 17.6 % 19.2 % 18.7 % Notes in appendix 18
19 Financial Position Marine Harvest Group NOK million Non-current assets Current assets Assets held for sale Total assets Equity Non-current liabilities Current liabilities Liabilities held for sale Total equity and liabilities Net interest-bearing debt Equity ratio 50.9% 49.9% 39.8% 19
20 Cash Flow and Net Interest Bearing Debt Marine Harvest Group Q Q NOK million Reclassified NIBD beginning of period Operational EBITDA Change in working capital Taxes paid Other adjustments Cash flow from operations Net Capex Cash from disposal of assets held for sale Other investments Cash flow from investments Net interest and financial items paid Other items Bonds converted to equity Dividend distributed / return of paid capital Translation effect on interest-bearing debt Cash from discontinued operations NIBD end of period Debt distribution 1) : EUR 69% 64% 71% USD 13% 13% 14% GBP 4% 7% 4% Other currencies 14% 16% 11% 1) Debt distribution including effect of cross currency sw aps. 2) Currency effect on debt in Q1 is NOK 87 million. 20
21 2015 Cash Flow Guidance 2015 cash flow estimates - Working capital buildup NOK 900m Support further organic growth - Capital expenditures increased from NOK 1,700m to NOK 1,900m due to FX changes NOK 1,100m Maintenance NOK 550m - Smolt and cleaner fish NOK 250m - Other - Interest expenses NOK 270m - Tax payables NOK 650m Quarterly dividend in Q of NOK 1.30 per share (repayment of paid in capital) Due to seawater growth patterns, WC is highly seasonal Slow seawater growth in 1H leads to working capital release and high seawater growth in 2H leads to working capital build up 21
22 Dividend policy The quarterly dividend level shall reflect the present and expected future cash flow generation of the Company To this end, a target level for net interest bearing debt is determined, reviewed and updated on a regular basis When the target is met, at least 75% of the annual free cash flow after operational and financial commitments will be distributed as dividends NIBD target revised to EUR 950m - EUR 1.8 per kg harvest volume (equivalent to ca NOK 15 per kg) - Residual attributed to non-farming businesses 22
23 Overview of financing EUR 555m Facility Agreement - Maturity Q Covenants: 35% equity ratio - Accordion option for parties to agree increased size of facility by EUR 295m - Lenders: DNB, Nordea, Rabobank and ABN Amro EUR 375m issued in April Tenor 5 years, annual coupon 0.875% (1), conversion price EUR NOK 1,250m bond issued in February Tenor 5 years, NIBOR + 3.5% Note: (1) Paid semi annually in arrears 23
24 Supply development Estimated volumes Compared to Q Est. volumes Q Q Volume % Q Suppliers Norway % Chile % Scotland % North America % Faroe Islands % Australia % Ireland % Other % Sum % Europe % Americas % Source: Kontali Supply growth in the upper range of previous guidance - Driven by higher than normal sea water temperatures in Norway and temporary increase in MAB Substantial supply growth from North America Stable supply growth from Chile when adjusting for frozen inventory Note: (1) Atlantic Salmon (HOG tons) 24
25 Development in reference prices Reference prices Q Change vs Q Change vs NOK Q Market (4) Q Norway (1) NOK % EUR % Chile (2) NOK % USD % North America (3) NOK % USD % Notes: (1) Average superior HOG price per kg (NASDAQ) (2) Average C trim price per kg (Urner Barry Miami 2-3 lb), equivalent to NOK 42.1 and USD 5.4 HOG (3) Average superior HOG price per kg (Urner Barry Seattle lb) (4) Market price in local currency NOK per kg (Oslo) USD per kg (Miami and Seattle) Weekly reference prices Reference price Norway (NASDAQ Oslo) Reference Price Chile (C trim fillet in Miami) Reference price North America (HOG Seattle) 25
26 Global volume by market Estimated volumes Compared to Q Est. volumes 12 month comparison Q Q Volume % Q LTM PTM Markets EU % USA % Brazil % China / Hong Kong % Russia % South Korea/Taiwan % Japan % Ukraina % Sum main markets % Other markets % Total all markets % Inflow to US from Europe % Inflow to EU from Chile % Source: Kontali Strong demand response in EU and continued strong growth in Asia Russia/Ukraine significantly down due to trade sanctions and FX Brazil down in March due to FX 7% growth in the USA Note: Atlantic Salmon (HOG tons), LTM Last twelve months, PTM Previous twelve months 26
27 Industry supply outlook Estim ates 2015 HOG tonnes (thousands) Low Y/Y growth High Y/Y growth Norw ay % % Chile % 514-2% North America % % UK % 163 6% Other % 141 3% Total % % Q Q Q Q Q Q ESTIMATES Q HOG tonnes (thousands) Low Q/Q growth High Q/Q growth Norw ay % 279 5% Chile % 113-8% North America % 31 17% UK % 44 6% Other % 37 11% Total % 503 3% H H H H H H ESTIM ATES H HOG tonnes (thousands) Low H2/H2 growth High H2/H2 growth Norw ay % 616 7% Chile % 273 2% North America % 73 21% UK % 87 9% Other % 76 4% Total % % Actual harvest volumes will be affected by e.g. water temperatures, development in biological growth, biological challenges such as diseases, algae blooms etc. and market developments. 27
28 MHG 2015 volume guidance Salmon species 2013 Q Q Q Q Q Q H HOG tons (1000) Actual Actual Actual Actual Actual Actual Actual Estimate Estimate Estimate Norway Canada Scotland Other Units Total Chile (1) Total, adjusted (1) Note (1) Includes discontinued operations Q growth expected to be negative 6% (including Chile) 2015 growth expected to be 5% (including Chile) Actual harvest volumes will be affected by e.g. water temperatures, development in biological growth, biological challenges such as diseases, algae blooms etc. and market developments. 28
29 Outlook Favourable market and supply outlook in Europe - Futures prices (NASDAQ) next 12 months at ca NOK 40 per kg Monitoring the market conditions in the Americas closely MHG supportive of Norwegian White Paper - Responsible approach by the Norwegian government - Improved biological control a prerequisite for sustainable growth AquaChile merger in process Quarterly dividend of NOK 1.30 per share - To be paid in the form of repayment of paid in capital 29
30 Appendix 30
31 Conditional agreement to merge MH Chile with AquaChile Forming a leading player in the Chilean industry thousand tonnes of salmonids capacity of 260 thousand tonnes (HOG) - Infrastructure to support stand alone operations in region X and XI - 19 thousand tonnes of Tilapia capacity of 25 thousand tonnes (WFE) Major step towards a more sustainable biological framework in Chile Marine Harvest to own 42.8% post merger - AquaChile to remain listed on the Santiago Stock Exchange - Option to increase ownership to at least 55% (1) Tentative closing in Q Marine Harvest Chile reported as Discontinued Operations from Q (1) Option may be exercised from 15 June 2016 until 15 June
32 Consolidation required in Chilean farming industry 1250 concessions in total Fragmented industry structure Biological challenges Lack of coordination and logistics 32
33 Contract coverage and sales contract policy Q contract shares (% of guided volume): - Norway 32% - Scotland 40% - Canada 0% SALES CONTRACT POLICY Min hedging rate (1) Max hedging rate (1) Norway (2) (3) 15.0 % 50.0 % Canada 0.0 % 30.0 % Scotland 40.0 % 75.0 % Ireland 0.0 % 30.0 % Faroes 0.0 % 30.0 % Weighted average 17.6 % 50.8 % Note: (1) Hedging rates for the next quarter, limits dropping over time (2) External and internal contract (including financial futures) (3) Contract rate can be increased to 65% under special circumstances Contracts typically have a duration of 3-12 months - Contracts are entered into on a regular basis - Policy opens for contracts of up to 36 month duration 33
34 Development in reference prices PRICE AND GLOBAL VOLUME ALLOCATION TO THE EU MARKET PRICE & GLOBAL VOLUME ALLOCATION TO THE US MARKET 14.0 Tonnes (GW) EUR per kg (GW) Tonnes (GW) USD per kg Q Q Q Q Q Q Q Volume EU Q Q Q Q Q Q Q Reference price Norway, GW (Oslo) Q Q Q Q Q Q Q Q Q Q Q Q Q Q Q Q Q Q Q Q Volume USA Reference price North America, GW (Seattle) Reference price Chile, Fillets (Miami) 0.0 Reference prices Q Change vs Q Change vs NOK Q Market (4) Q Norway (1) NOK % EUR % Chile (2) NOK % USD % North America (3) NOK % USD % Notes: (1) Average superior HOG price per kg (NASDAQ) (2) Average C trim price per kg (Urner Barry Miami 2-3 lb), equivalent to NOK 42.1 and USD 5.4 HOG (3) Average superior HOG price per kg (Urner Barry Seattle lb) (4) Market price in local currency 34
35 Key performance indicators MH Consumer MH Markets Products Sales and Marketing Q Q Operational revenues and other income Operational EBIT EBIT margin % 2.7% 0.1% Q Q Reclassifed Group EBIT per kg (NOK) Contribution from Farming (NOK) Contribution from Markets (NOK) Contribution from Consumer Products (NOK) Group Harvest Volume (k tonnes) Operational EBIT from source of origin (NOK m) Operational EBIT from other units (NOK m) Group operational EBIT
36 Key financials Marine Harvest Group - main figures Q Q Unaudited NOK million Operational revenue and other income Reclassifed Operational EBIT 1) Cash flow from operations Net interest-bearing debt (NIBD) Underlying EPS (NOK) 2) Net cash flow per share (NOK) 3) ROCE 4) 17.6% 19.2% 18.7% Harvest volume (gutted weight tons, salmon) Operational EBIT - NOK per kg 5) - Total Norway Scotland Canada ) Excluding change in unrealised gain/losses from salmon derivatives, net fair value adjustment of biomass, onerous contracts provision, results from associated companies, restructuring cost, impairment losses of fixed assets/intangibles and other non-operating items 2) Underlying EPS: Operational EBIT adjusted for accrued payable interest, with estimated weighted tax rate - per share 3) Net cash flow per share: Cash flow from operations and investments, net financial items paid and realised currency effects 4) ROCE: Annualised return on average capital employed based on EBIT excluding fair value adjustments of biomass, onerous contracts provision and other non-operating items/ Average NIBD + Equity, excluding fair value adjustments of biomass, onerous contracts provision and net assets held for sale, unless there are material transactions in the period 5) Operational EBIT per kg including allocated margin from Sales and M arketing (from own salmon) 36
37 Quarterly segment overview SOURCES OF ORIGIN NOK million Norway Scotland Canada Ireland Faroes Other 1) MH Group OPERATIONAL EBIT MH FARMING MH SALES AND MARKETING MH Markets MH Consumer Products SUBTOTAL MH Feed Other entities 2) -1-1 TOTAL Harvest volume (gutted weight tons, salmon) Operational EBIT per kg (NOK) 3) of which MH Markets of which MH Consumer Products ANALYTICAL DATA Price achievement/reference price (%) 4) 100% 111% 98% 0% 101% Contract coverage (%) 33% 68% 0% 95% 0% 21% Quality - superior share (%) 92% 90% 86% 92% 0% 91% Exceptional items (NOK million) 5) Exceptional items per kg (NOK) 5) GUIDANCE Q harvest volume (gutted weight tons) harvest volume (gutted weight tons) Q contract share (%) 32% 40% 0% 0% 0% 28% 1) Operational EBIT arising from non salmon speices and 3rd party salmon not allocated to source of origin 2) Sterling White Halibut, Headquarter and Holding companies 3) Including Sterling White Halibut, MH Feed, Headquarter and Holding companies 4) MH Sales and Marketing Price achievement 5) Exceptional items impacting operational EBIT 37
38 Quarterly segment overview MH Operating Units Farming Farming Farming Farming Farming Farming MH Sales and Marketing Consumer Norway Scotland Canada Chile Ireland Faroes Markets Products MH Feed Other Elim MH Group* Revenues and other income Operating EBITDA Operating EBIT Fair Value adj on biomass, contracts/ unrealised derivatives Unrealized margin adjustment Restructuring cost Other non-operational items Income/loss from associated companies Write-down of fixed assets/intangibles EBIT Contribution to operational EBIT from S&M Operational EBIT incl contribution from S&M Harvest / sales volume Operational EBIT/kg incl contribution from S&M of which S&M *Volume = harvested volume salmon in tonnes gutted weight 38
39 Development in harvest volumes E Total Total Total Total Total Q1 Q2 Q3 Q4 Total Q1 Q2 Q3 Q4 Total Q1 Q2 Q3 Q4 Total Q1 Q2E H2-15E Total Norway Canada Scotland Other (1) Total GROWTH RELATIVE TO SAME PERIOD IN PREVIOUS YEAR E Total Total Total Total Total Q1 Q2 Q3 Q4 Total Q1 Q2 Q3 Q4 Total Q1 Q2 Q3 Q4 Total Q1 Q2E H2-15E Total Norway 19% 2% 18% 0% 7% 30% 18% 23% 4% 17% -25% -16% -9% -2% -13% 17% 28% 21% 2% 16% 18% -5% 1% 3% Canada 16% -9% 1% -8% 1% 12% 36% 4% 23% 19% 15% -16% -25% -47% -18% -48% -28% 14% 19% -19% 65% 86% 34% 54% Scotland 0% 4% 17% -12% 51% -11% -13% -8% -47% -20% 4% 17% 6% 74% 20% 9% 37% 0% -46% 1% -32% -29% 78% 15% Other (1) 21% 12% 28% 7% -4% 4% -8% 48% 0% 7% -39% 2% -45% -31% -29% -4% 20% 172% 67% 54% -76% -54% -23% -38% Total -21% 1% 16% -2% 11% 20% 14% 16% -1% 11% -17% -11% -10% -3% -10% 4% 23% 21% -1% 11% 12% -6% 103% 6% Notes: (1) Ireland and the Faroes 39

40 Net capital expenditure guidance Maintenance level 40
41 Net working capital guidance 41
42 Guidance on financial commitments and cost of debt Contractual repayments NOK million Interest expenses Please note the approximations are subject to changes 42

43 Nova Sea Harvest volume (HOG) EBIT(1) per kg NIBD Ownership % Q Q Q Q Nova Sea 48 % 34,910 38,739 6,542 6, Leading integrated salmon producer in Northern Norway wholly owned licenses - 4 partly owned licenses Marine Harvest has an ownership in Nova Sea of ~48% through direct and indirect shareholdings 2014 dividends of NOK 150m (Q2) - Marine Harvest s share NOK ~73m Proposed dividend for 2014 of NOK 150m to be paid in 2015 (MHG share NOK ~73m) Proportion of income after tax reported as income from associated companies in Marine Harvest Norway - NOK 15.9 million in Q IFRS adjustment of biomass NOK 20.8m 43
44 Debt distribution and interest rate hedging DEBT VOLUME HEDGED AND FIXED RATES OF INTEREST RATE HEDGES (MARCH-MARCH) (1) CURRENCY DEBT /03/2015 (2) Nominal value Fixed rate (3) Nominal value Fixed rate (3) Nominal value Fixed rate (3) Nominal value Fixed rate (3) Nominal value Fixed rate (3) Nominal value Fixed rate (3) Nominal value Fixed rate (3) Nominal value Fixed rate (3) EUR m % % % % % % % % USD m % % % % % % % % GBP m % % % % % % % % Other (NOK m) Market value of IRS contracts in MNOK (31/03/15): Mark to market valuation effect in Q1 (4) : Difference in fixed vs floating rate settled in cash in Q Notes: (1) MHG choses March as the starting month for all new interest hedging contracts (2) Debt at book value after taking cross currency swaps into account (3) Financing margin not included (4) Quarterly change in market value booked against P/L POLICY: External interest bearing debt is distributed as follows: EUR 71%, USD 13%, GBP 4%, other currencies 12%. Marine Harvest ASA shall hedge 70%-100% of the Group s long-term interest-bearing debt by currency with fixed interest or interest rate derivatives for the first 4 years and 0%-60% for the 5 following years. Interest-bearing debt includes external interest-bearing debt and leasing in the parent company or subsidiaries. The interest rate hedges shall be based on the targeted currency composition. Interest rate exposure in other currencies than EUR, USD and GBP shall not be hedged Please note that the current portfolio deviates from the policy due to inter alia the recent bond and convertible bond issuance. The policy will be reviewed. Policy last updated 7 February
45 Hedging and long term currency exposure POLICY EUR/NOK - Marine Harvest shall hedge between 0% and 30% of its assumed annual expenses in NOK against the EUR with a horizon of two years. The annual hedging shall be evenly distributed across the months of the year. USD/CAD - Marine Harvest shall not hedge the USD/CAD exposure. USD/CLP - Marine Harvest shall not hedge the USD/CLP exposure Internal transaction hedging relating to bilateral sales contracts - As of 1 April 2011, all bilateral sales contracts are subject to internal currency hedging of the exposure between the invoicing currency and NOK - The operating entities hedge this exposure towards the parent company. In accordance with the general hedging policy, this exposure is not hedged towards external counterparties - The purpose of the internal hedging is to allow for a more accurate comparison between the MH Farming entities (including contribution from Sales) and peers with respect to price achievement and operational EBIT Policy last updated 7 February
46 Strategic currency hedging EUR/NOK STRATEGIC CURRENCY HEDGING MEUR Rate P/L effect of contracts maturing in Q1-10 (MNOK) MNOK Market value 31/12/ Change (1) 100 Market value 31/03/ DESIGNATED MARKET CURRENCIES Norway Chile Canada Scotland Feed VAP Morpol Faroes Cold Water Species Asia EUR USD USD GBP EUR EUR EUR EUR NOK USD 46
47 Impact of currency/interest rate movements Average rates 1 CAD 1 EUR 1 GBP 1 USD Averge Q Average Q Average rates 1 CAD 1 EUR 1 GBP 1 USD Q vs Q % 4.6% 16.5% 27.3% End of quarter rates 1 CAD 1 EUR 1 GBP 1 USD 31/3/15 vs. 31/12/14-1.2% -3.7% 3.4% 8.8% Impact on Profit and Loss (versus Q1 2014) - Currency impact on net financial items Positive impact of NOK 436.6m (Positive NOK 18.9m) Impact from currency on Financial Position (versus 31/12/14) - Increase in interest-bearing debt due to currency NOK 87m 47
48 Fair value adjustment of biomass Under IFRS (IAS 41) the company is required to value biological assets at a fair market value. During the second half of 2011, the largest salmon farming companies in Norway, with support from audit firms, formed an industry working group where the objective was to reach a converged and improved common approach for estimating the fair value of the biomass in accordance with IAS 41. Following the working group s conclusions, Marine Harvest has with effect from the fourth quarter 2011, refined its calculation model. The model enhancements have been made to capture the fair value development during the lifetime of the fish in an improved manner. The revised model split the biomass into 3 groups based on size: - Fish below 1 kg live weight ( smolt ) is valued at accumulated cost - Fish between 1 kg and 4 kg live weight (immature fish) incorporates a proportionate share of the expected net profit at harvest - Fish above 4 kg (mature fish) is valued at the expected net value The main drivers in the valuation are: - Volume of biomass (and average weight per site) at every reporting date - Expected cost at harvest - Expected value at harvest (based on externally quoted forward prices where applicable and/or the most relevant price information available for the period in which the fish is expected to be harvested) Operationally, the value of biomass is reported at cost. In the Group accounts, fair value adjustments are added to costs of each operating unit and combined, the two elements constitute the fair value of biomass. The change in fair value adjustment is income or expense classified on a separate line in the Profit and Loss statement in each period. This item is not included in Operational EBIT. 48
49 Tax losses carried forward (YE 2014) Marine Harvest Group NOK million Recognised Unrecognised Total USA Poland France Germany Chile Italy Other Total * The NOL's will be used to offset taxavle profit in the countries going forward * The utilisation of the deferred tax asset on NOL's gives rise to a tax expense in the accounts which do not normally have any cash effect Most of the deferred tax assets have been recognised on the statement of financial position The NOL s will be used to offset taxable profit in the countries going forward The utilisation of the deferred tax asset on NOL s gives rise to a tax expense in the accounts which do not normally have any cash effect Details are available in the 2013 Annual Report 49
50 The Board s current authorisations The Board was given the following proxies at the AGM - General share capital increase (up to 10% of share capital) Proxy to set aside shareholders pre-emption right to subscribe - Purchase of own shares (up to 10% of share capital) Maximum price: NOK 120 per share Minimum price: NOK 7.5 per share - Issuance of new convertible bond Maximum amount: NOK 3,200m Maximum number of shares to be issued as settlement: 64m - Authorisation to issue quarterly dividends 50
51 Sensitivities ESTIMATED SENSITIVITIES ON ANNUAL RESULTS OP. EBIT EFFECT CASH FLOW EFFECT DRIVER NOK million Change in global average salmon price of NOK 1 (1) (2) Annual harvest volume Change in total harvest volume of 10,000 tonnes (2) (3) Marginal volume Change in global feed price of NOK 1 per kg (4) (5) Feed consumption Notes: (1) Assuming all sales at spot prices, Please see contract policy and estimated contract rates in the latest quarterly presentation (2) Normally 30 days credit on sale of salmon, effect assumes stable volume between years and across months (3) Assuming EBIT per kg of NOK 10 (4) Annual harvest volume converted to live weight (0.83) multiplied with feed conversion ratio (1.3) Assuming stable production and feed consumption between years and across months (5) 60 days credit time on feed 51
Marine Harvest Q Presentation
 Marine Harvest Q2 2015 Presentation Forward looking statements This presentation may be deemed to include forward-looking statements, such as statements that relate to Marine Harvest s contracted volumes,
Marine Harvest. Q Presentation 1 November 2017
 Marine Harvest 1 Q3 2017 Presentation 1 November 2017 Forward looking statements This presentation may be deemed to include forward-looking statements, such as statements that relate to Marine Harvest
Marine Harvest. Q Presentation 10 May 2017
 Marine Harvest Q1 2017 Presentation 10 May 2017 1 Forward looking statements This presentation may be deemed to include forward-looking statements, such as statements that relate to Marine Harvest s contracted
Marine Harvest. Q Presentation 24 August 2017
 Marine Harvest Q2 2017 Presentation 24 August 2017 1 Forward looking statements This presentation may be deemed to include forward-looking statements, such as statements that relate to Marine Harvest s
Marine Harvest Q Presentation
 Marine Harvest Q2 2014 Presentation Forward looking statements This presentation may be deemed to include forward-looking statements, such as statements that relate to Marine Harvest s contracted volumes,
Marine Harvest Q Presentation
 Marine Harvest Q1 2014 Presentation Forward looking statements This presentation may be deemed to include forward-looking statements, such as statements that relate to Marine Harvest s contracted volumes,
Marine Harvest. Q Presentation 14 February 2018
 Marine Harvest Q4 2017 Presentation 14 February 2018 1 Forward looking statements This presentation may be deemed to include forward-looking statements, such as statements that relate to Marine Harvest
Marine Harvest. Q Presentation 22 August 2018
 Marine Harvest Q2 2018 Presentation 22 August 2018 Forward looking statements This presentation may be deemed to include forward-looking statements, such as statements that relate to Marine Harvest s contracted
Harvest volume (GW) tonnes. Operating revenue NOK million. Operational EBIT NOK million Q1 11 Q2 11 Q3 11 Q4 11 Q1 12 Q1 11 Q2 11 Q3 11 Q4 11 Q1 12
 tonnes. Operating revenue NOK million. Operational EBIT NOK million Q1 11 Q2 11 Q3 11 Q4 11 Q1 12 Q1 11 Q2 11 Q3 11 Q4 11 Q1 12") 33 % industry supply growth market prices down 33 % from Q1 2011 Strong demand increased prices from Q4 2011 Strong performance in Scotland Poor results in VAP Europe Operational EBIT of NOK 276 million
33 % industry supply growth market prices down 33 % from Q1 2011 Strong demand increased prices from Q4 2011 Strong performance in Scotland Poor results in VAP Europe Operational EBIT of NOK 276 million
Operating revenue NOK million Operational EBIT NOK million. Harvest volume (HOG) tonnes Q3 09 Q4 09 Q1 10 Q2 10 Q3 10
 tonnes Q3 09 Q4 09 Q1 10 Q2 10 Q3 10") Solid performance in a strong market Strong price achievement and solid results in Norway Return on Capital Employed of 18.9% in the quarter Favourable market balance expected to support a strong market
Solid performance in a strong market Strong price achievement and solid results in Norway Return on Capital Employed of 18.9% in the quarter Favourable market balance expected to support a strong market
Q BAKKAFROST GROUP Oslo 20 February 2018
 BAKKAFROST GROUP Oslo 20 February 2018 DISCLAIMER This presentation includes statements regarding future results, which are subject to risks and uncertainties. Consequently, actual results may differ significantly
Harvest volume (GW) tonnes. Operating revenue NOK million. Operational EBIT NOK million Q2 11 Q3 11 Q4 11 Q1 12 Q2 12 Q2 11 Q3 11 Q4 11 Q1 12 Q2 12
 tonnes. Operating revenue NOK million. Operational EBIT NOK million Q2 11 Q3 11 Q4 11 Q1 12 Q2 12 Q2 11 Q3 11 Q4 11 Q1 12 Q2 12") The market showed strong ability to absorb 30% industry growth Prices in line with Q1 - Down 24% in Europe and ~35% in the US compared to Q2 2011 Satisfactory performance in Norway - excellent result in
The market showed strong ability to absorb 30% industry growth Prices in line with Q1 - Down 24% in Europe and ~35% in the US compared to Q2 2011 Satisfactory performance in Norway - excellent result in
Harvest volume (HOG) tons. Operational EBIT NOK million. Operational revenue NOK million Q2 10 Q3 10 Q4 10 Q1 11 Q2 11 Q2 10 Q3 10 Q4 10 Q1 11 Q2 11
 tons. Operational EBIT NOK million. Operational revenue NOK million Q2 10 Q3 10 Q4 10 Q1 11 Q2 11 Q2 10 Q3 10 Q4 10 Q1 11 Q2 11") Improved price achievement in a falling market Operational EBIT increased 13% ROACE of 26% in the quarter NIBD NOK 5.8 billion after dividend of NOK 2.9 billion High contract share in the second half of
Improved price achievement in a falling market Operational EBIT increased 13% ROACE of 26% in the quarter NIBD NOK 5.8 billion after dividend of NOK 2.9 billion High contract share in the second half of
Presentation of Cermaq
 Presentation of Cermaq North Atlantic Seafood Seminar Oslo, 8 th March 2012 Agenda Introduction to Cermaq Key results 2011 Focus on Mainstream Chile Outlook 2012 Photograph: Alf Børjesson 2 This is Cermaq
THIRD QUARTER MARINE HARVEST GROUP
 / / Q3 2014 THIRD QUARTER MARINE HARVEST GROUP Strong earnings Successful start up of the feed plant Agreement to buy 40 000 tons farming capacity from Acuinova in Chile Quarterly dividend of NOK 1.10
Highlights for the quarter Q2 / EBIT NOK 60 million pre biomass write-down
 Half year report Highlights for the quarter EBIT NOK 60 million pre biomass write-down EBIT pre fair value and biomass write-down (NOK million) 318 348 300 101 60 Mainstream results negatively impacted
Q BAKKAFROST GROUP Oslo 19 February 2019
 BAKKAFROST GROUP Oslo 19 February 2019 DISCLAIMER This presentation includes statements regarding future results, which are subject to risks and uncertainties. Consequently, actual results may differ significantly
Q BAKKAFROST GROUP Oslo 21 August 2018
 BAKKAFROST GROUP Oslo 21 August DISCLAIMER This presentation includes statements regarding future results, which are subject to risks and uncertainties. Consequently, actual results may differ significantly
Alternative Performance Measures (APM)/ Non-IFRS Financial Measures. Definitions of Alternative Performance Measures/ Non-IFRS Financial Measures
/ Non-IFRS Financial Measures. Definitions of Alternative Performance Measures/ Non-IFRS Financial Measures") Alternative Performance Measures (APM)/ Non-IFRS Financial Measures Our Alternative Performance Measures (APMs) present useful information which supplements the financial statements. These measures are
Alternative Performance Measures (APM)/ Non-IFRS Financial Measures Our Alternative Performance Measures (APMs) present useful information which supplements the financial statements. These measures are
Alternative Performance Measures (APM) / Non-IFRS Financial Measures. Definitions of Alternative Performance Measures, Non-IFRS Financial Measures
 / Non-IFRS Financial Measures. Definitions of Alternative Performance Measures, Non-IFRS Financial Measures") Alternative Performance Measures (APM) / Non-IFRS Financial Measures Our Alternative Performance Measures (APMs) present useful information which supplements the financial statements. These measures are
Alternative Performance Measures (APM) / Non-IFRS Financial Measures Our Alternative Performance Measures (APMs) present useful information which supplements the financial statements. These measures are
RS Platou Markets. Seafood conference. 10th June 2010
 RS Platou Markets Seafood conference 10th June 2010 Agenda Introduction to Cermaq Highlights Q1 2010 and outlook full year Chile Recovery 2 Overview of Cermaq One of the global leaders in the aquaculture
Financial report Q3 2014
 Financial report Q3 2014 Austevoll Seafood ASA Financial report Q3 2014 Index Key figures for the Group... 03 Q3 2014... 04 Operating segments... 04 Cash flows... 05 Financial information as of 30 September
PRESENTATION Q Oslo, 26 February 2014 John Binde, CEO Ola Loe, CFO
 PRESENTATION Q4 2013 Oslo, 26 February 2014 John Binde, CEO Ola Loe, CFO AGENDA: Highlights for the period Segment information Group financials Outlook 2 Highlights in Q4 2013: The best quarterly and yearly
Q November 9th. Lerøy Seafood Group ASA. CEO Henning Beltestad CFO Sjur S. Malm
 Q3 2017 November 9th Lerøy Seafood Group ASA CEO Henning Beltestad CFO Sjur S. Malm Agenda Highlights Key financial figures Outlook Q3 2017 EBIT before FV adj. NOK 861 million Harvest volume 46 024 GWT
P/F Bakkafrost Condensed Consolidated Interim Report for Q and 9 months 2013
 P/F Bakkafrost Condensed Consolidated Interim Report for Q3 2013 and 9 months 2013 15000 10000 5000 0 Harvest volume - TGW Q3 12 Q4 12 Q1 13 Q2 13 Q3 13 Operational EBIT mdkk 200 150 100 50 0 Q3 12 Q4
Interim Report Q2-18
 Interim Report Q2-18 HIGHLIGHTS Operational EBIT of NOK 181 million o Operational EBIT per kg of NOK 24.73 in Region North o Operational EBIT per kg of NOK 23.49 in Region South o Non-recurring item of
Q August 24th. Lerøy Seafood Group ASA. CEO Henning Beltestad CFO Sjur S. Malm
 Q2 2017 August 24th Lerøy Seafood Group ASA CEO Henning Beltestad CFO Sjur S. Malm Agenda Highlights Key financial figures Outlook Q2 2017 EBIT before FV adj. NOK 801 million Harvest volume 26 156 GWT
Q MAY 8TH 2018
 Q1 2018 MAY 8TH 2018 1. Highlights 2. Key Financial Figures 3. Outlook Highlights Klikke for å legge til annet bilde Q1 2018 - EBIT beforefv adj. NOK 960 million - Harvest volume 37576 GWT - EBIT/kg all
NORWAY ROYA L S A L M ON PRESENTATION Q Oslo, 7 November 2017 Charles Høstlund, CEO Ola Loe, CFO 1
 PRESENTATION Q3 2017 Oslo, 7 November 2017 Charles Høstlund, CEO Ola Loe, CFO 1 AGENDA: Highlights for the period Segment information Group financials Markets Outlook 2 Highlights in Q3 2017 Operational
Q NOVEMBER 8TH 2018
 Q3 2018 NOVEMBER 8TH 2018 1. Highlights 2. Key Financial Figures 3. Outlook Highlights Klikke for å legge til annet bilde Q3 2018 - EBIT before FV adj. NOK 660 million - Harvest volume 37 227 GWT - EBIT/kg
Q May 12th Oslo
 Q1 2016 May 12th Oslo Lerøy Seafood Group ASA CEO Henning Beltestad CFO Sjur S. Malm Agenda Highlights Key financial figures Outlook Q1 2016 EBIT before FV adj. NOK 584.5 million EBIT/kg all inclusive
SalMar ASA First quarter
 SalMar ASA First quarter 2009 1 STRONG SALMON PRICES AND SATISFACTORY EARNINGS Strong salmon prices contributed to satisfactory earnings for the SalMar Group in the first quarter 2009. While Scottish Sea
Results Presentation 3Q17
 Multiexport Foods S.A. Results Presentation 3Q17 Santiago, November 2017 Agenda I. Highlights II. III. Financial Statements Supply, Demand and Prices IV. Farming Operation V. Perspectives 2 Highlights
Q U A R T E R L Y R E P O R T 2 N D Q U A R T E R
 Q U A R T E R L Y R E P O R T 2 N D Q U A R T E R 2 0 0 7 1. Grieg Seafood develops as planned Grieg Seafood was listed in June, and has now 869 shareholders after 2 shares issues of MNOK 700 in total.
Events after balance sheet date
 Austevoll Seafood ASA 0 Financial Report Q4 2011 Successful second fishing season for anchoveta in Peru A positive result recorded for fish farming, sale and distribution, in difficult conditions Seasonally,
Interim Report. January September 2013
 Interim Report January September 2013 Disclaimer Albain Bidco Norway AS is providing the following financial results for the third quarter of 2013 to holders of its EUR225,000,000 6.750% Senior Secured
All figures in NOK 1,000 Q3 11 Q3 10 Sept. 30, 2011 Sept. 30,
 Austevoll Seafood ASA 0 INTERIM REPORT Q3 2011 Significant reduction in interest-bearing liabilities in the quarter Third quarter is low season for production of pelagic fish in Europe and South America
 - - - - - - - 20 000 15 000 10 000 5 000 0 2017 2014 2013 2012 2011 2010 2009 2008 2007 2006 2005 2004 2003 2002 2001 2000 1999 1995 1 400 30 1 200 25 1 000 800 600 400 777 20 15 10 16,5 200 5 0 0 Q4/17
SalMar ASA. Presentation Q CEO Yngve Myhre, CFO Trond Tuvstein Oslo, 14 November w w w. s a l m a r. n o
 Presentation Q3 2013 SalMar ASA CEO Yngve Myhre, CFO Trond Tuvstein Oslo, 14 November 2013 2 Agenda Highlights Financial update Operational update Market and outlook Third quarter highlights Another strong
Third QUARTER / 2017
 STRONG OPERATIONS AND IMPROVING BIOLOGY HIGHLIGHTS IN THE THIRD QUARTER Strong operations and effective management of the improving biological situation Lower production costs and higher prices achieved
Cermaq ASA Presentation for Pareto Securities Oslo, 14 th June 2012
 Cermaq ASA Presentation for Pareto Securities Oslo, 14 th June 2012 1 2020 2015 2010 2005 2000 1995 1990 1985 1980 1975 1970 1965 1960 1955 1950 Aquaculture: a sustainable growth industry Our growing population
Santiago, May 11 th, Results Presentation 1Q18
 Santiago, May 11 th, 2018 Results Presentation 1Q18 Agenda I. Highlights II. III. Financial Statements Supply, Demand and Prices IV. Farming Operation V. Prospects 2 Highlights EBIT 1Q18 USD 18.8 million
PRESENTATION Q Oslo, 15 August 2013 John Binde, CEO Ola Loe, CFO
 PRESENTATION Q2 2013 Oslo, 15 August 2013 John Binde, CEO Ola Loe, CFO AGENDA: Highlights for the period Segment information Group financials Outlook 2 Highlights in Q2 2013: Best quarterly operational
FOURTH QUARTER / 2014
 SATISFACTORY RESULT DESPITE BIOLOGICAL CHALLENGES HIGHLIGHTS IN THE FOURTH QUARTER 2014 Good salmon prices and high harvested volume produced profit growth and record operating revenues. 50% of the harvested
EMPRESAS AQUACHILE S.A. RESULTS FOR 1 TH QUARTER May 2015
 EMPRESAS AQUACHILE S.A. RESULTS FOR 1 TH QUARTER 2015 May 2015 1. About Empresas AquaChile S.A. 03 2. Quarterly Summary 04 3. Analysis of Results 06 4. Balance Sheet Analysis 13 5. Cash Flow Analysis 15
P/F Bakkafrost. Condensed Consolidated Interim Report for Q and 12 Months Operational EBIT mdkk
 P/F Bakkafrost Condensed Consolidated Interim Report for Q4 2015 and 12 Months 2015 Harvest volume TGW 15,000 12,000 9,000 6,000 3,000 Q4 14 Q1 15 Q2 15 Q3 15 Q4 15 Operational EBIT mdkk 300 250 200 150
THIRD QUARTER / 2018
 REPORT FOR THE THIRD QUARTER 2018 HIGHLIGHTS Operationally strong quarter, with cost improvements and good price achievement. Record-high volume for sales & processing with positive contribution Total
Interim Report Q1-18
 Interim Report Q1-18 HIGHLIGHTS Operational EBIT of NOK 193 million o o Operational EBIT per kg of NOK 19.22 in Region North Operational EBIT per kg of NOK 15.64 in Region South The highest sold and harvested
The answers to your questions.
 The answers to your questions. By / Ragnar Nystøyl CHRISTMAS SEMINAR Bergen, 19. November 2014 Agenda - Norwegian Production & Supply issues - Global Production & Supply issues - Market- & Price-related
PRESENTATION Q Oslo, 14 November 2012 John Binde, CEO Ola Loe, CFO
 PRESENTATION Q3 2012 Oslo, 14 November 2012 John Binde, CEO Ola Loe, CFO AGENDA: Highlights for the period Segment information Group financials Outlook 2 Highlights in Q3 2012: Strong consumption growth
SalMar ASA. Presentation Q CEO Leif Inge Nordhammer CFO Trond Tuvstein
 SalMar ASA Presentation Q1 2015 CEO Leif Inge Nordhammer CFO Trond Tuvstein Agenda Highlights Financial update Operational update Outlook First quarter 2015 highlights Improved operations Challenging biological
Q BAKKAFROST GROUP Oslo 10 May 2016
 2016 BAKKAFROST GROUP Oslo 10 May 2016 DISCLAIMER This presentation includes statements regarding future results, which are subject to risks and uncertainties. Consequently, actual results may differ significantly
Q BAKKAFROST GROUP New York 19 May 2016
 2016 BAKKAFROST GROUP New York 19 May 2016 DISCLAIMER This presentation includes statements regarding future results, which are subject to risks and uncertainties. Consequently, actual results may differ
Chilean volume reduction Impact on global markets. North Atlantic Seafood Forum Steven Rafferty CFO Cermaq ASA 5 March 2009
 Chilean volume reduction Impact on global markets North Atlantic Seafood Forum Steven Rafferty CFO Cermaq ASA 5 March 2009 Context Chilean Atlantic salmon supply will drop by 50% + in 2009 Further drop
Lerøy Seafood Group SEPTEMBER 2018
 Lerøy Seafood Group SEPTEMBER 2018 1. Lerøy Seafood Group 2. Key market trends supply and demand Our vision To be the leading and most profitable global supplier of sustainable high-quality seafood History
PRESENTATION Q Oslo, 19 February 2013 John Binde, CEO Ola Loe, CFO
 PRESENTATION Q4 2012 Oslo, 19 February 2013 John Binde, CEO Ola Loe, CFO AGENDA: Highlights for the period Segment information Group financials Outlook 2 Highlights in Q4 2012: Significant improvement
Chile, que pasa? -an update of the situation for salmon farming in Chile, - issues and potential solutions
 Chile, que pasa? -an update of the situation for salmon farming in Chile, - issues and potential solutions Intrafish / DNB investor conference London, 4 November, 2015 Jon Hindar CEO Cermaq Group The starting
FOURTH QUARTER / 2016
 SATISFACTORY RESULT DESPITE BIOLOGICAL CHALLENGES HIGHLIGHTS IN THE FOURTH QUARTER 2016 Continued high salmon prices result in revenue and profit growth. High production costs for part of the volume harvested
15,000 12, , , , ,158 13,004 12, , ,664
 15,000 12,000 13,004 10,934 12,940 13,158 10,664 350 307 300 9,000 335 255 254 30 26.34 21.58 22.26 23.22 16 Q2 16 Q3 16 24.33 20 200 6,000 10 100 3,000 0 400 16 Q2 16 Q3 16 Q4 16 17 0 16 Q2 16 Q3 16 Q4
Grieg Seafood ASA. griegseafood.com. Andreas Kvame CEO. Atle Harald Sandtorv CFO. 8 November 2017
 Grieg Seafood ASA Andreas Kvame CEO Atle Harald Sandtorv CFO 8 November 2017 1 Agenda Highlights This is Grieg Seafood Business Units (Regions) Financials Outlook 2 Highlights Q3 2017 Improved results
BAKKAFROST INTRAFISH SEAFOOD INVESTOR FORUM London 13 September 2018
 BAKKAFROST INTRAFISH SEAFOOD INVESTOR FORUM London 13 September 2018 DISCLAIMER This presentation includes statements regarding future results, which are subject to risks and uncertainties. Consequently,
NOTE 3 FINANCIAL RISK MANAGEMENT
 NOTE 3 FINANCIAL RISK MANAGEMENT CAPITAL MANAGEMENT The Group aims to ensure that it has access to capital to enable the business to develop in accordance with adopted strategies. By so doing, the Group
Financial Report Q FINANCIAL REPORT Q1 2010
 Financial Report Q4 2010 FINANCIAL REPORT Q1 2010 Austevoll Seafood ASA 0 Interim Report Q4 2010 Fourth quarter also achieved record-high operating result Good market and good prices for salmon and trout
Interim Report Q4-17
 Interim Report Q4-17 HIGHLIGHTS Operational EBIT of NOK 95 million o o Operational EBIT per kg of NOK 15.84 in Region North Operational EBIT per kg of NOK 14.12 in Region South The highest sold volume
Villa Organic AS fourth quarter 2012
 Notice to shareholders; Villa Organic AS fourth quarter 2012 Highlights fourth quarter 2012 The average prices were approximately at the same level as Q3, but improvement was observed towards the end of
Weekly Salmon Outlook Week
 Week 10-20 Page 1 of 8 Harvest of Atlantic salmon in Norway continued to grow in week 9. The harvest volume (23 000 tonnes wfe) was up 1000 tonnes from the previous week and 3% higher than in the corresponding
Lerøy Seafood Group. Quarterly report Second quarter August 19th Helge Singelstad. Ivan Vindheim CEO CFO
 Lerøy Seafood Group Quarterly report Second quarter 2009 August 19th 2009 Helge Singelstad CEO Ivan Vindheim CFO 1 Agenda 1. 1 Considerations 2. 2 Key financial figures Q2 2009 3. 3 Lerøy at a glance 4.
SalMar ASA. Presentation Q CEO Olav-Andreas Ervik CFO Trond Tuvstein
 SalMar ASA Presentation Q1 2018 CEO Olav-Andreas Ervik CFO Trond Tuvstein Olav-Andreas Ervik new CEO of SalMar 41 years, from Frøya More than 20 years of experience from the aquaculture industry Worked
Lerøy Seafood Group. Preliminary financial figures February 25th Helge Singelstad. Alf-Helge Aarskog. Ivan Vindheim.
 Lerøy Seafood Group Preliminary financial figures 2009 February 25th 2010 Helge Singelstad Chairman Alf-Helge Aarskog CEO Ivan Vindheim CFO 1 Agenda 1. 1 Considerations 2. 2 Key financial figures Q4 2009
EWOS Group / INTERIM FINANCIAL REPORT / JANUARY DECEMBER 2014 TABLE OF CONTENTS
 TABLE OF CONTENTS Disclaimer... 3 Presentation of the group... 4 Comments by the CEO... 5 Key financial figures... 6 Market conditions... 6 Operating and financial review... 7 Condensed interim financial
Q BAKKAFROST GROUP Oslo February 24 th 2015
 Q4 2014 BAKKAFROST GROUP Oslo February 24 th 2015 DISCLAIMER This presentation includes statements regarding future results, which are subject to risks and uncertainties. Consequently, actual results may
Interim Report Q2-17
 Interim Report Q2-17 HIGHLIGHTS Operational EBIT of NOK 136 million o o o Operational EBIT per kg of NOK 29.68 in Region North Operational EBIT per kg of NOK 31.30 in Region South Non-recurring item of
Lerøy Seafood Group. Quarterly report First quarter May 12th Helge Singelstad. Henning Beltestad. Ivan Vindheim.
 Lerøy Seafood Group Quarterly report First quarter 2010 May 12th 2010 Helge Singelstad Chairman Henning Beltestad CEO Ivan Vindheim CFO 1 Agenda 1. 1 Considerations 2. 2 Key financial figures Q1 2010 3.
EMPRESAS AQUACHILE S.A. RESULTS FOR 2ND QUARTER September 2015
 EMPRESAS AQUACHILE S.A. RESULTS FOR 2ND QUARTER 2015 September 2015 1. About AquaChile 03 2. Quarterly Summary 04 3. Analysis of Results 06 4. Balance Sheet Analysis 14 5. Cash Flow Analysis 15 6. Financial
Austevoll Seafood ASA
 Austevoll Seafood ASA Financial Report Q4 2016 and preliminary figures for 2016 INDEX Key figures for the group... 03 Q4 2016... 04 Operating segments... 04 Cash Flows Q4 2016... 06 Cash flows 2016...07
Q Nova Austral Financial Reporting May 2nd, 2018
 Q1-2018 Nova Austral Financial Reporting May 2nd, 2018 Agenda A. Nova Austral Pillars & Fundamentals B. Market and company updates C. Financial Report 1) Key Financial summary 2) LTM EBITDA, Revenue and
Scenarios and drivers - for High & Low salmon prices 2018
 Scenarios and drivers - for High & Low salmon prices 2018 BRUSSELS SEMINAR Hotel Bloom 23rd Apr 2018 by Ragnar Nystøyl Atlantic Salmon Market Development All markets 2015 2016 16/15 2017 17/16 2018e 18/17
From Copeinca to Mitsubishi and beyond. Jon Hindar CEO London, 31 October 2014
 From Copeinca to Mitsubishi and beyond Jon Hindar CEO London, 31 October 2014 A roller coaster with a happy ending for Cermaq and for the industry Page 2 A roller coaster with a happy ending for Cermaq
Q BAKKAFROST GROUP Glyvrar 28 October 2014
 Q3 2014 BAKKAFROST GROUP Glyvrar 28 October 2014 DISCLAIMER This presentation includes statements regarding future results, which are subject to risks and uncertainties. Consequently, actual results may
Grieg Seafood ASA Quarterly report Q4 2018
 bv Grieg Seafood ASA Quarterly report ABOUT GRIEG SEAFOOD Grieg Seafood ASA is one of the world's leading salmon farmers, specializing in Atlantic salmon. The Group has an annual production target of 100
Fishpool Christmas Seminar 2017 Bearish signals going into 2018
 Photo: SB1 Markets SEAFOOD SALMON FARMING Fishpool Christmas Seminar 2017 Bearish signals going into 2018 Tore A. Tønseth Phone : (+47) 24 14 74 18 Mobile : (+47) 95 80 62 77 E-mail : tore.tonseth@sb1markets.no
Summary published in connection to the admission to trading of shares in Marine Harvest ASA on NASDAQ OMX Stockholm
 Summary published in connection to the admission to trading of shares in Marine Harvest ASA on NASDAQ OMX Stockholm This summary is entirely based on information available in Marine Harvest ASA s (also
Q Financial presentation. Arne Møgster CEO Britt Kathrine Drivenes CFO
 Q2 2015 Financial presentation Arne Møgster CEO Britt Kathrine Drivenes CFO Highlights All figures in NOK 1,000 Q2 2015 (restated) Q2 2014 H1 2015 (restated) H1 2014 2014 Revenue 4 107 801 3 606 154 7
Annual Report April March 2017
 Annual Report 2016 1 April 2016-31 March 2017 THE BOARD OF DIRECTORS ANNUAL REPORT FOR FISCAL YEAR 2016 Cermaq Group AS has 18 wholly owned subsidiaries, of which Cermaq Norway AS, Alsvåg AS, Cermaq Canada
Contents Highlights 3 rd quarter Key figures... 3 A strong quarter despite weaker market conditions... 4 Financial review...
 Contents Highlights 3 rd quarter 2018... 3 Key figures... 3 A strong quarter despite weaker market conditions... 4 Financial review... 5 Group results... 5 Cash flow... 6 Financial position... 6 Segments...
Presentatio. on Q3 2010
 Presentatio on Q3 2010 CEO Regin Jacobsen CFO Teitur Samuelsen Oslo November 9 th 2010 Disclaimer This presentation includes statements regarding future results, which are subject to risks and uncertainties.
Grieg Seafood ASA. griegseafood.com. Andreas Kvame CEO. Atle Harald Sandtorv CFO. 11 November 2016
 Grieg Seafood ASA Andreas Kvame CEO Atle Harald Sandtorv CFO 11 November 2016 1 Agenda Highlights Business Units (Regions) Financials Outlook 2 HIGHLIGHTS Q3 2016 3 Highlights Q3 2016 Good quarterly results
Austevoll Seafood ASA
 Austevoll Seafood ASA Financial Report Q3 2017 Index Key figures for the Group...03 Q3 2017...04 Operating segments...04 Cash flow Q3 2017...07 Financial factors at 30 September 2017...07 Cash flows at
Q Financial presentation. CEO - Arne Møgster CFO - Britt Kathrine Drivenes
 Q2 2018 Financial presentation CEO - Arne Møgster CFO - Britt Kathrine Drivenes Highlights All figures in NOK 1,000 Q2 2018 Q2 2017 H1 2018 H1 2017 2017 Revenue 6 001 380 5 019 195 11 754 529 11 094 149
Q Presentation Oslo, October 28, Trond Williksen, CEO
 Q3 2011 Presentation Oslo, October 28, 2011 Trond Williksen, CEO 1 Agenda Highlights Q3 2011 Financials Q3 2011 Outlooks Q & A 2 Highlights 3 Increased profitability Operating revenues in Q3 was 226.7
EBIT before fair value adjustment of biomass was MNOK 140 in Q4 (MNOK 87 in 2013).
.") 1 2 Highlights Fourth Quarter 2014 EBIT before fair value adjustment of biomass was MNOK 140 in Q4 (MNOK 87 in 2013). This includes a MNOK 60 gain from sale of GSF s shares in SalmoBreed AS in Q4. Production
1 2 Highlights Fourth Quarter 2014 EBIT before fair value adjustment of biomass was MNOK 140 in Q4 (MNOK 87 in 2013). This includes a MNOK 60 gain from sale of GSF s shares in SalmoBreed AS in Q4. Production
Sølvtrans Holding ASA Q Oslo, 7 November Roger Halsebakk, CEO Jon Kvalø, CFO
 Sølvtrans Holding ASA Q3 2012 Oslo, 7 November 2012 Roger Halsebakk, CEO Jon Kvalø, CFO 1 Highlights in the quarter 2 Financial review 3 Operational and market review 4 Summary and outlook 5 Appendix Highlights
Grieg Seafood ASA Transcript Q presentation
 Grieg Seafood ASA Transcript Q3 2018 presentation Introduction and Segment review Andreas Kvame (CEO) Introduction: Welcome everyone. Atle Harald and I will be giving his presentation as usual. We will
Highlights Fourth Quarter 2016
 1 2 Highlights Fourth Quarter 2016 GSF s best quarter ever with EBIT of MNOK 456 (EBIT per kg: NOK 21.80). High harvest volume (20 917 tons) in a strong market. The Board proposes a dividend of NOK 3 per
Austevoll Seafood ASA
 Austevoll Seafood ASA Financial report Q2 and H1 2016 INDEX key figures for the group... 03 Q2 2016... 04 Operating segments... 04 Cash Flows, Q2 2016... 06 Financial information, H1 2016... 07 Cash Flow,
Q THIRD QUARTER BAKKAFROST GROUP Glyvrar 5 November 2013
 Q3 2013 THIRD QUARTER BAKKAFROST GROUP Glyvrar 5 November 2013 DISCLAIMER This presentation includes statements regarding future results, which are subject to risks and uncertainties. Consequently, actual
Q BAKKAFROST GROUP Glyvrar 20 May 2014
 Q1 014 BAKKAFROST GROUP Glyvrar 0 May 014 DISCLAIMER This presentation includes statements regarding future results, which are subject to risks and uncertainties. Consequently, actual results may differ
Annual Report April March 2018
 Annual Report 2017 1 April 2017-31 March 2018 Photo: Kenneth Soløy The BOARD OF DIRECTORS ANNUAL REPORT for fiscal year 2017 Cermaq Group AS has 18 wholly owned subsidiaries, of which Cermaq Norway AS,
Highlights Third Quarter 2017
 2 Highlights Third Quarter 2017 Improved results driven by higher volume Margins maintained by good prices with positive contribution from price contracts EBIT margin negatively affected by planned harvesting
Q Financial presentation. Arne Møgster CEO Britt Kathrine Drivenes CFO
 Q1 2018 Financial presentation Arne Møgster CEO Britt Kathrine Drivenes CFO Highlights All figures in MNOK Q1 2018 Q1 2017 2017 Revenue 5 753 6 075 20 799 EBITDA* 1 445 1 555 4 747 EBIT* 1 217 1 331 3