BAKKAFROST INTRAFISH SEAFOOD INVESTOR FORUM London 13 September 2018
|
|
|
- Daniel Cobb
- 5 years ago
- Views:
Transcription


1 BAKKAFROST INTRAFISH SEAFOOD INVESTOR FORUM London 13 September 2018
2 DISCLAIMER This presentation includes statements regarding future results, which are subject to risks and uncertainties. Consequently, actual results may differ significantly from the results indicated or implied in these statements. No representation or warranty (expressed or implied) is made as to, and no reliance should be placed on, the fairness, accuracy or completeness of the information contained herein. Accordingly, none of the Company, or any of its principal shareholders or subsidiary undertakings or any of such person s officers or employees or advisors accept any liability whatsoever arising directly or indirectly from the use of this document. Page 2

3 BAKKAFROST VALUE CHAIN AND STRATEGY MARKETS AND SALES SUMMARY Q2 AND H INVESTMENT PLAN
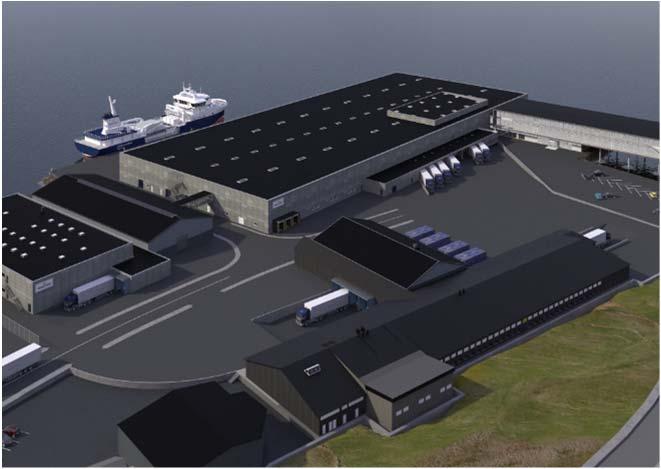
4 VALUE CHAIN Longest value chain in the industry From raw materials for salmon feed to finished products 50 years of experience High quality Competitive setup Local values Page 4


5 BUSINESS MODEL VALUE CREATION Catches Fishmeal & -oil production Feed plant Hatcheries Salmon Salmon plant Page 5


6 VALUE CREATION AT LOW COST 3,100 tonnes fish 5 mdkk 750 tonnes fishmeal and -oil 8 mdkk 2,500 tonnes feed 23 mdkk Egg and smolt 2,300 tonnes salmon 120 mdkk 2,100 tonnes salmon products 155 mdkk Page 6
7 BRAND PREMIUM Brand premium on Salmon from Faroe Island Premium of approx. 1 EUR/kg Based on: Larger fish Good reputation Market strategy Product strategy Market price by origin (EUR/kg) 8,00 7,00 6,00 Sales Price 5,00 4,00 3,00 2,00 1,00 1,60 1,40 1,20 1,00 0,80 0,60 0,40 0,20 Premium 0, Faroe Islands Norway diff 0,00 Source: Kontali Page 7
8 COMPETITIVE POSITION LISTED FARMING COMPANIES ON OSLO STOCK EXCHANGE Competitive position changed from 2012 EBIT / KG Since 2012 significant improved competitive position compared to other listed companies Margin per kg is crucial in order to be competitive Page 8
9 FINANCIAL DEVELOPMENT Revenues increased nearly 5 times Revenue for Bakkafrost increased from 820 mdkk in 2010 to 3.8 bdkk in Operational EBIT increased nearly 6 times Operational EBIT increased from 247 mdkk in 2010 to 1.4 bdkk in Revenue (mdkk) Operational EBIT (mdkk) Page 9


10 BAKKAFROST VALUE CHAIN AND STRATEGY MARKETS AND SALES SUMMARY Q2 AND H INVESTMENT PLAN


11 MARKET DIVERSIFICATION Bakkafrost salmon is a global product sold worldwide 86% of sales came from Continental Europe in % of sales came from Continental Europe in. Strong development in sales to USA, Asia and Eastern Europe USA UK 3% Asia 4% 5% USA 8% Asia 8% Eastern Europe 10% Cont.EU 47% Eastern Europe 29% Cont.EU 15% UK 10% Cont.EU 86% UK 27% Asia 23% USA 23% Source: Bakkafrost Page 11

12 MARKETS & SALES Same trend in Q as in previous quarter. Sales to Eastern Europe and Asia increased, and sales to EU decreased. Sales to USA was nearly flat in Q2 2018, compared to Q2. VAP on contract was on a low level at 16% EU market decreased from 46% in Q2 to 27% in Q USA was nearly flat at 15%, compared to 16% Asia increased from 16% to 25% Eastern Europe increased from 22% to 33% Harvest volumes used in VAP was 15% in Q2 2018, compared to 29% in Q2 Total sales of salmon by markets Fresh salmon only by markets Q Q Q2 Q2 H H H1 EU 27% 46% 29% 46% USA 15% 16% 16% 17% Asia 25% 16% 23% 15% Eastern Europe 33% 22% 32% 22% H1 EU 20% 28% 21% 28% USA 15% 21% 16% 23% Asia 28% 22% 26% 20% Eastern Europe 37% 29% 37% 29% Contract share, VAP products [% of qty] 100% 80% 60% 85% 71% 84% 72% 40% 20% 0% 15% 29% 16% 28% Q Q2 H H1 VAP on contract HOG, spot Page 12


13 ACQUISITION OF US SALMON IMPORTER NORTH LANDING Bakkafrost signed an agreement in Q to acquire the business and assets in North Landing. The acquisition has been closed in Q North Landing Sales office, handling and processing facilities in Clifton, New Jersey Market access Serve Bakkafrost s customers in the US market Page 13


14 BAKKAFROST VALUE CHAIN AND STRATEGY MARKETS AND SALES SUMMARY Q2 AND H INVESTMENT PLAN Bakkafrost HQ Glyvrar
15 HIGHLIGHTS Harvested 12,902 tgw in Q (18,402 tgw in Q2 ) Operation Feed sales of 15,673 tonnes in Q2 2018* (17,032 tonnes in Q2 *) Raw material purchase of 118,387 tonnes in Q (163,100 tonnes in Q2 ) Revenues and Operational EBIT Revenues of DKK 954 million in Q (DKK 1,206 million in Q2 ) Operational EBIT** of DKK 408 million in Q (DKK 459 million in Q2 ) Cash Flow Cash flow from operations of DKK 279 million in Q (DKK 498 million in Q2 ) Segments Farming and FOF segments had positive results, while VAP segment had a loss Dividend Dividend of DKK per share (NOK 13.52) paid out in April 2018 *) Including internal sales of 14,656 tonnes in Q (16,012 tonnes in Q2 ) **) EBIT before fair value adjustments of biomass, onerous contracts provisions, income from associates and revenue tax Page 15
16 SUMMARY OF THE QUARTER The result for the Farming segment decreased due to lower volumes. The VAP result was negative again, but the FOF segment had a good result. Farming/VAP margin increased from NOK/kg in Q2 to NOK/kg in Q VAP segment had a margin of NOK/kg in Q2 2018, compared to NOK/kg in Q2 Farming margin was NOK/kg in Q2 2018, compared to NOK/kg in Q2 FOF delivered a strong EBITDA margin of 20.2% in Q2 2018, compared to 15.1% in Q2 (DKK million) Q Q2 H H1 Operating revenues 954 1,206 1,805 2,060 Operational EBITDA Operational EBIT Profit for the period Operational EBITDA margin 47.8% 41.8% 42.7% 42.8% Operational EBIT margin 42.7% 38.1% 37.4% 38.6% Operational EBIT/Kg (Farming) (NOK) Operational EBIT/Kg (Farming and VAP) (NOK) Operational EBIT/Kg (VAP) (NOK) EBITDA margin (Fishmeal, -Oil and Feed) 20.2% 15.1% 24.3% 15.6% Group Operational EBIT was DKK 408 million in Q2 2018, compared to DKK 459 million in Q2 Page 16
17 GROUP PROFIT AND LOSS Revenues on lower level in Q due to lower harvest. Revenues in Q amounted to DKK 954 million, compared to DKK 1,206 million in Q Operational EBIT in Q decreased to DKK 408 million, compared to DKK 459 million in Q2 Fair value of biomass increased due to higher salmon prices, compared to the end of last quarter and provisions for onerous contracts increased Revenue tax, recognized as cost, amounted to DKK -31 million in Q2 2018, compared to DKK -45 million in Q2 Financial items amounted to DKK 9 million and taxes amounted to DKK -74 million in Q Profit after tax for Q was DKK 339 million, compared to DKK 398 million in Q2 (DKK million) Q Q2 H H1 Operating revenues 954 1,206 1,805 2,060 Operational EBITDA* Operational EBIT* Fair value adjustment of biological assets Onerous contracts Income from associates Revenue tax EBIT Net Financial items EBT Taxes Profit for the period Operational EBITDA margin 47.8% 41.8% 42.7% 42.8% Operational EBIT margin 42.7% 38.1% 37.4% 38.6% Operational EBIT/kg (Farming and VAP) (NOK) EBITDA margin (fishmeal, -oil and feed) 20.2% 15.1% 24.3% 15.6% * Operational EBITDA and EBIT aligned for fair value adjustment of biomass, onerous contracts provisions, income from associates and revenue tax. Page 17
18 OPERATIONAL EBIT* AND EARNINGS PER SHARE Operational EBIT* (DKK million) YTD ,001 1,165 1, ,44 Earnings per share (DKK) , ,56 4,39 4,61 7,13 1,63 8,19 1,16 5,60 6, YTD ,45 *) Operational EBIT is EBIT before fair value adjustments of biomass, onerous contracts provisions, income from associates and revenue tax Page 18
19 BALANCE SHEET Intangible assets at the end of Q are unchanged from year end Investments in PPE of DKK 131 million in Q and PPE amounts to DKK 2.7 billion Financial assets amount to DKK 79 million The carrying amount of biological assets amounts to DKK 1,107 million, whereof fair value adjustment amounts to DKK 329 million Inventory amounts to DKK 479 million at the end of Q2 2018, compared to DKK 306 million at the end of Changes in equity consist primarily of the positive results and paid-out dividend in Q Equity ratio is 68% at the end Q NIBD at DKK 443 million up from DKK 258 million at end (DKK million) End H End H1 End Intangible assets Property, plant and equipment 2,715 2,380 2,570 Financial assets Long-term receivables Biological assets 1,107 1,544 1,097 Inventory Receivables Other receivables Cash and cash equivalents Total Assets 5,470 5,633 5,156 Equity 3,725 3,599 3,626 Deferred tax and other taxes Long-term interest-bearing debt Financial derivatives Short-term interest-bearing debt Accounts and other payables Total Equity and Liabilities 5,470 5,633 5,156 Page 19
20 NET INTEREST-BEARING DEBT (NIBD) Net Interest-Bearing Debt Cash flow from operating activities decreased the NIBD with DKK 421 million in Q Development in NIBD in DKK millions Dividend payment increased the NIBD with DKK 511 million in Q Net investments, change in working capital and other in Q increased the NIBD with DKK 252 million Financing end Q Bank facilities of EUR 200 million NIBD Q Net investments Dividend Other Change in working capital NIBD and available funding Cash from operating activities NIBD Q NIBD: DKK 443 million Undrawn loan facilities: DKK 1,039 million NIDB Available funding Page 20

21 BAKKAFROST VALUE CHAIN AND STRATEGY MARKETS AND SALES SUMMARY Q2 AND H INVESTMENT PLAN Hatchery Strond, Klaksvík under construction First batch of eggs came into the hatchery 19 June At full operation in 2019/2020, the hatchery is expected to produce 7 million smolts at 500 gram each.
22 INVESTMENT PROGRAMME Same aim as in previous investment programs: Biological risk Efficiency Sustainable growth And investments will be made step by step in the relevant parts of the value chain Page 22
23 ~55% SUSTAINABLE GROWTH IN HARVEST EXPECTED BY 2023 (CAGR 9.2%) Sustainable Growth part of Investment Program New portfolio of sites in Suðuroy 10,000 tonnes expected by 2023 Full infrastructure to be upgraded Roll-out of large smolt strategy 15,000 tonnes expected by by 2022 (1) R&D projects Aimed at identifying growth beyond current horizon Note: (1) Full harvest effect from large smolt strategy deferred from 2021 to 2022, compared to previous communication, due delay in construction and start up of the Strond smolt plant Page 23
 Support product differentiation and adaptability to local biology Completion of existing smolt projects and")

24 PREPARING FOR THE FUTURE UPDATED INVESTMENT PLAN (DKK 3 BILLION) Fishmeal, oil and feed (DKK ~ 425 million) Increased fish oil capacity to support marine index Increased feed capacity and advanced feed line capabilities Development of unique Faroese breeding program (DKK ~ 200 million) Support product differentiation and adaptability to local biology Completion of existing smolt projects and new development (DKK ~ 1,000 million) Investment program Support growth and reduce biological risk Farming investments to allow sustainable growth (DKK ~ 1,300 million) Broodstock Smolt Farming VAP FOF Farming equipment, fish transportation and biogas plant Selected R&D investments to cater for growth beyond current horizon Market driven investments within processing (DKK ~ 85 million) Note: Total aggregate spend for increased by DKK 970 million, compared to previous investment plan Page 24

25 SUÐUROY SOLE OPERATOR IN REORGANIZED PRODUCTION CLUSTER To be operated with separate infrastructure Suðuroy - Reorganized production cluster Harvest capacity of 15,000 tonnes annually Of which 5,000 tonnes from large smolt Separate hatchery for large smolt Four farming sites Only operator in area secures biological control 112 km Separate harvest facility in place Existing farming site New farming site Harvesting facility Location of hatchery to be determined Page 25

26 IN-HOUSE BROODSTOCK OPERATION Breeding program based on gene pool of local wild salmon strain Sandoy eastside remote and good location for broodstock site Adaptability to local biology Product differentiation Support branding strategy Independence of external suppliers Veterinary control Location in remote area with no farming operation New broodstock plant Page 26


27 SUSTAINABILITY UPDATE BIOGAS PLANT INVESTMENT Faroe Islands Biogas Plant Investment (2019-) Sustainability commitment Part of Bakkafrost s 2020 Healthy Living Plan Waste management 40-50,000 tonnes from salmon and dairy farms to be processed, annually Heat and electricity production Enough heat for 400 homes and electricity for 1,900 homes Contribution to national renewable target 100% electricity from renewable sources by 2030 Reducing carbon emissions Projected to save 11,000 tonnes of CO 2 emissions annually Reducing fertilizer imports 40-45,000 tonnes of liquid fertilizer to be distributed annually Page 27
 Completes upgrading of entire infrastructure in value chain Total investments of DKK 5.3 billion (2013-2022) Average cash conversion ratio 1 2016- > 50% Note 1: (Adj.")
28 UPDATED INVESTMENT PROGRAM TO SUPPORT SUSTAINABLE GROWTH Total investments of DKK 3 billion ( ) Front loaded average investment level of DKK 10/kg Incremental investments of DKK 120/kg growth (25k tgw) Completes upgrading of entire infrastructure in value chain Total investments of DKK 5.3 billion ( ) Average cash conversion ratio > 50% Note 1: (Adj. EBITDA capex delta WC) / Adj. EBITDA Page 28
29 SUPERIOR BIOLOGY COMBINED WITH STATE OF THE ART INFRASTRUCTURE FISHMEAL, OIL AND FEED BROODSTOCK SMOLT SEA WATER PROCESSING SALES/MARKETING CURRENT CAPACITY Equivalent to 100k (tgw) None grams 21 farming sites/17 fjords 130k primary (tgw) Central sales Faroes annual 55k smolt/ 40k secondary (tgw) UK sales office marine index of 44% 65k smolt 80k packaging material (tgw) US sales office 4 well boats Branding 2 service vessels ONGOING/ PLANNED INVESTMENTS Additional 65k (tgw) Own breeding programme grams Upgraded infrastructure Selected upgrading, Marketing/sales initiatives annual Full self sufficiency Fish transportation efficiency and functionality Market penetration marine index of 44% R&D PURPOSE Sustainable Growth Adaptability to local biology Sustainable growth >76k 500g smolt Product quality Premium price achievement Flexibility Product differentiation Reduced exposure in sea Product presentation Reduced spot price sensitivity Efficiency/streamlining Support branding strategy (immaterial property) Product differentiation Maintain low exposure to Innovation Independence of external Fresh premium product single markets Environmental improvement suppliers capability Food safety Veterinary control Entire infrastructure wholly owned and on balance sheet Page 29
30 Page 30
Q BAKKAFROST GROUP Oslo 21 August 2018
 BAKKAFROST GROUP Oslo 21 August DISCLAIMER This presentation includes statements regarding future results, which are subject to risks and uncertainties. Consequently, actual results may differ significantly
Q BAKKAFROST GROUP Oslo 20 February 2018
 BAKKAFROST GROUP Oslo 20 February 2018 DISCLAIMER This presentation includes statements regarding future results, which are subject to risks and uncertainties. Consequently, actual results may differ significantly
Q BAKKAFROST GROUP Oslo 19 February 2019
 BAKKAFROST GROUP Oslo 19 February 2019 DISCLAIMER This presentation includes statements regarding future results, which are subject to risks and uncertainties. Consequently, actual results may differ significantly
Q BAKKAFROST GROUP Oslo 10 May 2016
 2016 BAKKAFROST GROUP Oslo 10 May 2016 DISCLAIMER This presentation includes statements regarding future results, which are subject to risks and uncertainties. Consequently, actual results may differ significantly
Q BAKKAFROST GROUP New York 19 May 2016
 2016 BAKKAFROST GROUP New York 19 May 2016 DISCLAIMER This presentation includes statements regarding future results, which are subject to risks and uncertainties. Consequently, actual results may differ
Q BAKKAFROST GROUP Oslo February 24 th 2015
 Q4 2014 BAKKAFROST GROUP Oslo February 24 th 2015 DISCLAIMER This presentation includes statements regarding future results, which are subject to risks and uncertainties. Consequently, actual results may
P/F Bakkafrost Condensed Consolidated Interim Report for Q and 9 months 2013
 P/F Bakkafrost Condensed Consolidated Interim Report for Q3 2013 and 9 months 2013 15000 10000 5000 0 Harvest volume - TGW Q3 12 Q4 12 Q1 13 Q2 13 Q3 13 Operational EBIT mdkk 200 150 100 50 0 Q3 12 Q4
Q THIRD QUARTER BAKKAFROST GROUP Glyvrar 5 November 2013
 Q3 2013 THIRD QUARTER BAKKAFROST GROUP Glyvrar 5 November 2013 DISCLAIMER This presentation includes statements regarding future results, which are subject to risks and uncertainties. Consequently, actual
Q BAKKAFROST GROUP Glyvrar 28 October 2014
 Q3 2014 BAKKAFROST GROUP Glyvrar 28 October 2014 DISCLAIMER This presentation includes statements regarding future results, which are subject to risks and uncertainties. Consequently, actual results may
P/F Bakkafrost. Condensed Consolidated Interim Report for Q and 12 Months Operational EBIT mdkk
 P/F Bakkafrost Condensed Consolidated Interim Report for Q4 2015 and 12 Months 2015 Harvest volume TGW 15,000 12,000 9,000 6,000 3,000 Q4 14 Q1 15 Q2 15 Q3 15 Q4 15 Operational EBIT mdkk 300 250 200 150
Q BAKKAFROST GROUP Glyvrar 20 May 2014
 Q1 014 BAKKAFROST GROUP Glyvrar 0 May 014 DISCLAIMER This presentation includes statements regarding future results, which are subject to risks and uncertainties. Consequently, actual results may differ
15,000 12, , , , ,158 13,004 12, , ,664
 15,000 12,000 13,004 10,934 12,940 13,158 10,664 350 307 300 9,000 335 255 254 30 26.34 21.58 22.26 23.22 16 Q2 16 Q3 16 24.33 20 200 6,000 10 100 3,000 0 400 16 Q2 16 Q3 16 Q4 16 17 0 16 Q2 16 Q3 16 Q4
Presentatio. on Q3 2010
 Presentatio on Q3 2010 CEO Regin Jacobsen CFO Teitur Samuelsen Oslo November 9 th 2010 Disclaimer This presentation includes statements regarding future results, which are subject to risks and uncertainties.
Dette billede kan ikke vises i øjeblikket. Q FOURTH QUARTER BAKKAFROST GROUP Glyvrar 25 February 2014
 Dette billede kan ikke vises i øjeblikket. Q4 2013 FOURTH QUARTER BAKKAFROST GROUP Glyvrar 25 February 2014 DISCLAIMER This presentation includes statements regarding future results, which are subject
PRESENTATION Q CEO Regin Jacobsen / CFO Teitur Samuelsen Oslo November 6 th 2012
 PRESENTATION Q3 2012 CEO Regin Jacobsen / CFO Teitur Samuelsen Oslo November 6 th 2012 DISCLAIMER This presentation includes statements regarding future results, which are subject to risks and uncertainties.
Q NOVEMBER 8TH 2018
 Q3 2018 NOVEMBER 8TH 2018 1. Highlights 2. Key Financial Figures 3. Outlook Highlights Klikke for å legge til annet bilde Q3 2018 - EBIT before FV adj. NOK 660 million - Harvest volume 37 227 GWT - EBIT/kg
Q MAY 8TH 2018
 Q1 2018 MAY 8TH 2018 1. Highlights 2. Key Financial Figures 3. Outlook Highlights Klikke for å legge til annet bilde Q1 2018 - EBIT beforefv adj. NOK 960 million - Harvest volume 37576 GWT - EBIT/kg all
Q November 9th. Lerøy Seafood Group ASA. CEO Henning Beltestad CFO Sjur S. Malm
 Q3 2017 November 9th Lerøy Seafood Group ASA CEO Henning Beltestad CFO Sjur S. Malm Agenda Highlights Key financial figures Outlook Q3 2017 EBIT before FV adj. NOK 861 million Harvest volume 46 024 GWT
ANNUAL REPORT Faroese Company Registration No. 1724
 ANNUAL REPORT 2017 www.bakkafrost.com Faroese Company Registration No. 1724 2 Contents Chairman s Statement 4 Statement by the Management and the Board of Directors 6 Outlook 8 Bakkafrost at a Glance 10
ANNUAL REPORT. Faroese Company Registration No BAKKAFROST 1 ANNUAL REPORT 2016
 ANNUAL REPORT 2016 www.bakkafrost.com Faroese Company Registration No. 1724 BAKKAFROST 1 ANNUAL REPORT 2016 Table of Contents Chairman s Statement 4 Statement by the Management and the Board of Directors
Q August 24th. Lerøy Seafood Group ASA. CEO Henning Beltestad CFO Sjur S. Malm
 Q2 2017 August 24th Lerøy Seafood Group ASA CEO Henning Beltestad CFO Sjur S. Malm Agenda Highlights Key financial figures Outlook Q2 2017 EBIT before FV adj. NOK 801 million Harvest volume 26 156 GWT
Marine Harvest. Q Presentation 10 May 2017
 Marine Harvest Q1 2017 Presentation 10 May 2017 1 Forward looking statements This presentation may be deemed to include forward-looking statements, such as statements that relate to Marine Harvest s contracted
Q May 12th Oslo
 Q1 2016 May 12th Oslo Lerøy Seafood Group ASA CEO Henning Beltestad CFO Sjur S. Malm Agenda Highlights Key financial figures Outlook Q1 2016 EBIT before FV adj. NOK 584.5 million EBIT/kg all inclusive
Marine Harvest. Q Presentation 14 February 2018
 Marine Harvest Q4 2017 Presentation 14 February 2018 1 Forward looking statements This presentation may be deemed to include forward-looking statements, such as statements that relate to Marine Harvest
Interim Report Q2-18
 Interim Report Q2-18 HIGHLIGHTS Operational EBIT of NOK 181 million o Operational EBIT per kg of NOK 24.73 in Region North o Operational EBIT per kg of NOK 23.49 in Region South o Non-recurring item of
SalMar ASA. Presentation Q CEO Yngve Myhre, CFO Trond Tuvstein Oslo, 14 November w w w. s a l m a r. n o
 Presentation Q3 2013 SalMar ASA CEO Yngve Myhre, CFO Trond Tuvstein Oslo, 14 November 2013 2 Agenda Highlights Financial update Operational update Market and outlook Third quarter highlights Another strong
Marine Harvest. Q Presentation 24 August 2017
 Marine Harvest Q2 2017 Presentation 24 August 2017 1 Forward looking statements This presentation may be deemed to include forward-looking statements, such as statements that relate to Marine Harvest s
Marine Harvest. Q Presentation 1 November 2017
 Marine Harvest 1 Q3 2017 Presentation 1 November 2017 Forward looking statements This presentation may be deemed to include forward-looking statements, such as statements that relate to Marine Harvest
SalMar ASA. Presentation Q CEO Olav-Andreas Ervik CFO Trond Tuvstein
 SalMar ASA Presentation Q1 2018 CEO Olav-Andreas Ervik CFO Trond Tuvstein Olav-Andreas Ervik new CEO of SalMar 41 years, from Frøya More than 20 years of experience from the aquaculture industry Worked
Marine Harvest. Q Presentation 22 August 2018
 Marine Harvest Q2 2018 Presentation 22 August 2018 Forward looking statements This presentation may be deemed to include forward-looking statements, such as statements that relate to Marine Harvest s contracted
Presentation of Cermaq
 Presentation of Cermaq North Atlantic Seafood Seminar Oslo, 8 th March 2012 Agenda Introduction to Cermaq Key results 2011 Focus on Mainstream Chile Outlook 2012 Photograph: Alf Børjesson 2 This is Cermaq
THIRD QUARTER / 2018
 REPORT FOR THE THIRD QUARTER 2018 HIGHLIGHTS Operationally strong quarter, with cost improvements and good price achievement. Record-high volume for sales & processing with positive contribution Total
Lerøy Seafood Group SEPTEMBER 2018
 Lerøy Seafood Group SEPTEMBER 2018 1. Lerøy Seafood Group 2. Key market trends supply and demand Our vision To be the leading and most profitable global supplier of sustainable high-quality seafood History
NORWAY ROYA L S A L M ON PRESENTATION Q Oslo, 7 November 2017 Charles Høstlund, CEO Ola Loe, CFO 1
 PRESENTATION Q3 2017 Oslo, 7 November 2017 Charles Høstlund, CEO Ola Loe, CFO 1 AGENDA: Highlights for the period Segment information Group financials Markets Outlook 2 Highlights in Q3 2017 Operational
Q Nova Austral Financial Reporting May 2nd, 2018
 Q1-2018 Nova Austral Financial Reporting May 2nd, 2018 Agenda A. Nova Austral Pillars & Fundamentals B. Market and company updates C. Financial Report 1) Key Financial summary 2) LTM EBITDA, Revenue and
SalMar ASA. Presentation Q CEO Leif Inge Nordhammer CFO Trond Tuvstein
 SalMar ASA Presentation Q1 2015 CEO Leif Inge Nordhammer CFO Trond Tuvstein Agenda Highlights Financial update Operational update Outlook First quarter 2015 highlights Improved operations Challenging biological
RS Platou Markets. Seafood conference. 10th June 2010
 RS Platou Markets Seafood conference 10th June 2010 Agenda Introduction to Cermaq Highlights Q1 2010 and outlook full year Chile Recovery 2 Overview of Cermaq One of the global leaders in the aquaculture
PRESENTATION Q Oslo, 19 February 2013 John Binde, CEO Ola Loe, CFO
 PRESENTATION Q4 2012 Oslo, 19 February 2013 John Binde, CEO Ola Loe, CFO AGENDA: Highlights for the period Segment information Group financials Outlook 2 Highlights in Q4 2012: Significant improvement
The Norwegian Aquaculture Analysis - Summary of key findings
 The Norwegian Aquaculture Analysis - Summary of key findings Nordområdekonferansen Bodø - November 9 th 217 Eirik Moe Managing Partner EY Seafood The EY Aquaculture Analysis Background EY has since 26
P/F BAKKAFROST.
 P/F BAKKAFROST ANNUAL AND CONSOLIDATED REPORT AND ACCOUNTS YEAR TO 31 DECEMBER 2011 www.bakkafrost.com KEY FIGURES (DKK 1,000) IFRS IFRS IFRS IFRS FO-GAAP Profit and loss 2011 2010 2009 2008 2007 Operating
Financial report Q3 2014
 Financial report Q3 2014 Austevoll Seafood ASA Financial report Q3 2014 Index Key figures for the Group... 03 Q3 2014... 04 Operating segments... 04 Cash flows... 05 Financial information as of 30 September
All figures in NOK 1,000 Q3 11 Q3 10 Sept. 30, 2011 Sept. 30,
 Austevoll Seafood ASA 0 INTERIM REPORT Q3 2011 Significant reduction in interest-bearing liabilities in the quarter Third quarter is low season for production of pelagic fish in Europe and South America
P/F BAKKAFROST.
 P/F BAKKAFROST ANNUAL AND CONSOLIDATED REPORT AND ACCOUNTS YEAR TO 31 DECEMBER 2010 www.bakkafrost.com KEY FIGURES (DKK 1,000) IFRS IFRS IFRS FO-GAAP Profit and loss 2010 2009 2008 2007 Operating revenues
Marine Harvest Q Presentation
 Marine Harvest Q1 2014 Presentation Forward looking statements This presentation may be deemed to include forward-looking statements, such as statements that relate to Marine Harvest s contracted volumes,
SalMar ASA First quarter
 SalMar ASA First quarter 2009 1 STRONG SALMON PRICES AND SATISFACTORY EARNINGS Strong salmon prices contributed to satisfactory earnings for the SalMar Group in the first quarter 2009. While Scottish Sea
Marine Harvest Q Presentation
 Marine Harvest Q2 2015 Presentation Forward looking statements This presentation may be deemed to include forward-looking statements, such as statements that relate to Marine Harvest s contracted volumes,
Operating revenue NOK million Operational EBIT NOK million. Harvest volume (HOG) tonnes Q3 09 Q4 09 Q1 10 Q2 10 Q3 10
 tonnes Q3 09 Q4 09 Q1 10 Q2 10 Q3 10") Solid performance in a strong market Strong price achievement and solid results in Norway Return on Capital Employed of 18.9% in the quarter Favourable market balance expected to support a strong market
Solid performance in a strong market Strong price achievement and solid results in Norway Return on Capital Employed of 18.9% in the quarter Favourable market balance expected to support a strong market
Villa Organic AS fourth quarter 2012
 Notice to shareholders; Villa Organic AS fourth quarter 2012 Highlights fourth quarter 2012 The average prices were approximately at the same level as Q3, but improvement was observed towards the end of
Marine Harvest Q Presentation
 Marine Harvest Q2 2014 Presentation Forward looking statements This presentation may be deemed to include forward-looking statements, such as statements that relate to Marine Harvest s contracted volumes,
Harvest volume (HOG) tons. Operational EBIT NOK million. Operational revenue NOK million Q2 10 Q3 10 Q4 10 Q1 11 Q2 11 Q2 10 Q3 10 Q4 10 Q1 11 Q2 11
 tons. Operational EBIT NOK million. Operational revenue NOK million Q2 10 Q3 10 Q4 10 Q1 11 Q2 11 Q2 10 Q3 10 Q4 10 Q1 11 Q2 11") Improved price achievement in a falling market Operational EBIT increased 13% ROACE of 26% in the quarter NIBD NOK 5.8 billion after dividend of NOK 2.9 billion High contract share in the second half of
Improved price achievement in a falling market Operational EBIT increased 13% ROACE of 26% in the quarter NIBD NOK 5.8 billion after dividend of NOK 2.9 billion High contract share in the second half of
 - - - - - - - 20 000 15 000 10 000 5 000 0 2017 2014 2013 2012 2011 2010 2009 2008 2007 2006 2005 2004 2003 2002 2001 2000 1999 1995 1 400 30 1 200 25 1 000 800 600 400 777 20 15 10 16,5 200 5 0 0 Q4/17
PRESENTATION Q Oslo, 14 November 2012 John Binde, CEO Ola Loe, CFO
 PRESENTATION Q3 2012 Oslo, 14 November 2012 John Binde, CEO Ola Loe, CFO AGENDA: Highlights for the period Segment information Group financials Outlook 2 Highlights in Q3 2012: Strong consumption growth
PRESENTATION Q Oslo, 15 August 2013 John Binde, CEO Ola Loe, CFO
 PRESENTATION Q2 2013 Oslo, 15 August 2013 John Binde, CEO Ola Loe, CFO AGENDA: Highlights for the period Segment information Group financials Outlook 2 Highlights in Q2 2013: Best quarterly operational
YEAR TO 31 DECEMBER 2012
 P/F Bakkafrost Annual and Consolidated Report and Accounts YEAR TO 31 DECEMBER 2012 www.bakkafrost.com 1/112 > Bakkafrost > Annual and Consolidated Report and Accounts 2012 2012 1,855,544 2011 KEY FIGURES
Best Ideas 2018, Hosted by MOI Global Bakkafrost (Oslo:BAKKA) Robert Leitz.
 Robert Leitz.") Best Ideas 2018, Hosted by MOI Global Bakkafrost (Oslo:BAKKA) Robert Leitz www.iolitepartners.com TRADE IDEA: LONG EQUITY BAKKAFROST AT NOK320/SHARE Source: Bakkafrost Best in class, vertically integrated
Best Ideas 2018, Hosted by MOI Global Bakkafrost (Oslo:BAKKA) Robert Leitz www.iolitepartners.com TRADE IDEA: LONG EQUITY BAKKAFROST AT NOK320/SHARE Source: Bakkafrost Best in class, vertically integrated
Third QUARTER / 2017
 STRONG OPERATIONS AND IMPROVING BIOLOGY HIGHLIGHTS IN THE THIRD QUARTER Strong operations and effective management of the improving biological situation Lower production costs and higher prices achieved
Events after balance sheet date
 Austevoll Seafood ASA 0 Financial Report Q4 2011 Successful second fishing season for anchoveta in Peru A positive result recorded for fish farming, sale and distribution, in difficult conditions Seasonally,
Interim Report Q2-17
 Interim Report Q2-17 HIGHLIGHTS Operational EBIT of NOK 136 million o o o Operational EBIT per kg of NOK 29.68 in Region North Operational EBIT per kg of NOK 31.30 in Region South Non-recurring item of
FOURTH QUARTER / 2014
 SATISFACTORY RESULT DESPITE BIOLOGICAL CHALLENGES HIGHLIGHTS IN THE FOURTH QUARTER 2014 Good salmon prices and high harvested volume produced profit growth and record operating revenues. 50% of the harvested
Q Financial presentation. CEO - Arne Møgster CFO - Britt Kathrine Drivenes
 Q2 2018 Financial presentation CEO - Arne Møgster CFO - Britt Kathrine Drivenes Highlights All figures in NOK 1,000 Q2 2018 Q2 2017 H1 2018 H1 2017 2017 Revenue 6 001 380 5 019 195 11 754 529 11 094 149
Interim Report Q1-18
 Interim Report Q1-18 HIGHLIGHTS Operational EBIT of NOK 193 million o o Operational EBIT per kg of NOK 19.22 in Region North Operational EBIT per kg of NOK 15.64 in Region South The highest sold and harvested
Harvest volume (GW) tonnes. Operating revenue NOK million. Operational EBIT NOK million Q1 11 Q2 11 Q3 11 Q4 11 Q1 12 Q1 11 Q2 11 Q3 11 Q4 11 Q1 12
 tonnes. Operating revenue NOK million. Operational EBIT NOK million Q1 11 Q2 11 Q3 11 Q4 11 Q1 12 Q1 11 Q2 11 Q3 11 Q4 11 Q1 12") 33 % industry supply growth market prices down 33 % from Q1 2011 Strong demand increased prices from Q4 2011 Strong performance in Scotland Poor results in VAP Europe Operational EBIT of NOK 276 million
33 % industry supply growth market prices down 33 % from Q1 2011 Strong demand increased prices from Q4 2011 Strong performance in Scotland Poor results in VAP Europe Operational EBIT of NOK 276 million
Harvest volume (GW) tonnes. Operating revenue NOK million. Operational EBIT NOK million Q2 11 Q3 11 Q4 11 Q1 12 Q2 12 Q2 11 Q3 11 Q4 11 Q1 12 Q2 12
 tonnes. Operating revenue NOK million. Operational EBIT NOK million Q2 11 Q3 11 Q4 11 Q1 12 Q2 12 Q2 11 Q3 11 Q4 11 Q1 12 Q2 12") The market showed strong ability to absorb 30% industry growth Prices in line with Q1 - Down 24% in Europe and ~35% in the US compared to Q2 2011 Satisfactory performance in Norway - excellent result in
The market showed strong ability to absorb 30% industry growth Prices in line with Q1 - Down 24% in Europe and ~35% in the US compared to Q2 2011 Satisfactory performance in Norway - excellent result in
Salmon price, demand and market trends
 Salmon price, demand and market trends Kolbjørn Giskeødegård, Director 21 November 2018 Salmon supply growth dramaticly down after 2012 2 500 2013-17: CAGR 2% 2 000 1 500 2003-12: CAGR 8% 1 000 500 0 2003
PRESENTATION Q Oslo, 26 February 2014 John Binde, CEO Ola Loe, CFO
 PRESENTATION Q4 2013 Oslo, 26 February 2014 John Binde, CEO Ola Loe, CFO AGENDA: Highlights for the period Segment information Group financials Outlook 2 Highlights in Q4 2013: The best quarterly and yearly
Financial Report Q FINANCIAL REPORT Q1 2010
 Financial Report Q4 2010 FINANCIAL REPORT Q1 2010 Austevoll Seafood ASA 0 Interim Report Q4 2010 Fourth quarter also achieved record-high operating result Good market and good prices for salmon and trout
Cermaq ASA Presentation for Pareto Securities Oslo, 14 th June 2012
 Cermaq ASA Presentation for Pareto Securities Oslo, 14 th June 2012 1 2020 2015 2010 2005 2000 1995 1990 1985 1980 1975 1970 1965 1960 1955 1950 Aquaculture: a sustainable growth industry Our growing population
Fishpool Christmas Seminar 2017 Bearish signals going into 2018
 Photo: SB1 Markets SEAFOOD SALMON FARMING Fishpool Christmas Seminar 2017 Bearish signals going into 2018 Tore A. Tønseth Phone : (+47) 24 14 74 18 Mobile : (+47) 95 80 62 77 E-mail : tore.tonseth@sb1markets.no
Highlights for the quarter Q2 / EBIT NOK 60 million pre biomass write-down
 Half year report Highlights for the quarter EBIT NOK 60 million pre biomass write-down EBIT pre fair value and biomass write-down (NOK million) 318 348 300 101 60 Mainstream results negatively impacted
FOURTH QUARTER / 2016
 SATISFACTORY RESULT DESPITE BIOLOGICAL CHALLENGES HIGHLIGHTS IN THE FOURTH QUARTER 2016 Continued high salmon prices result in revenue and profit growth. High production costs for part of the volume harvested
Marine Harvest Q Presentation
 Marine Harvest Q1 2015 Presentation Forward looking statements This presentation may be deemed to include forward-looking statements, such as statements that relate to Marine Harvest s contracted volumes,
Grieg Seafood ASA. griegseafood.com. Andreas Kvame CEO. Atle Harald Sandtorv CFO. 8 November 2017
 Grieg Seafood ASA Andreas Kvame CEO Atle Harald Sandtorv CFO 8 November 2017 1 Agenda Highlights This is Grieg Seafood Business Units (Regions) Financials Outlook 2 Highlights Q3 2017 Improved results
Lerøy Seafood Group. Preliminary financial figures February 25th Helge Singelstad. Alf-Helge Aarskog. Ivan Vindheim.
 Lerøy Seafood Group Preliminary financial figures 2009 February 25th 2010 Helge Singelstad Chairman Alf-Helge Aarskog CEO Ivan Vindheim CFO 1 Agenda 1. 1 Considerations 2. 2 Key financial figures Q4 2009
Interim Report Q4-17
 Interim Report Q4-17 HIGHLIGHTS Operational EBIT of NOK 95 million o o Operational EBIT per kg of NOK 15.84 in Region North Operational EBIT per kg of NOK 14.12 in Region South The highest sold volume
Aker Seafoods Second quarter 2009 Sales of fresh products up, but prices down
 Aker Seafoods Second quarter Sales of fresh products up, but prices down CEO Yngve Myhre CFO Gunnar Aasbø Interim presentation second quarter 1 Welcome Agenda Topic Operational Update Group Harvesting
Q Financial presentation. CEO - Arne Møgster CFO - Britt Kathrine Drivenes
 Q3 2018 Financial presentation CEO - Arne Møgster CFO - Britt Kathrine Drivenes Highlights All figures in MNOK Q3 2018 Q3 2017 YTD Q3 2018 YTD Q3 2017 2017 Revenue 5 317 4 903 17 072 15 997 20 799 EBITDA*
Q Financial presentation. Arne Møgster CEO Britt Kathrine Drivenes CFO
 Q1 2018 Financial presentation Arne Møgster CEO Britt Kathrine Drivenes CFO Highlights All figures in MNOK Q1 2018 Q1 2017 2017 Revenue 5 753 6 075 20 799 EBITDA* 1 445 1 555 4 747 EBIT* 1 217 1 331 3
Alternative Performance Measures (APM)/ Non-IFRS Financial Measures. Definitions of Alternative Performance Measures/ Non-IFRS Financial Measures
/ Non-IFRS Financial Measures. Definitions of Alternative Performance Measures/ Non-IFRS Financial Measures") Alternative Performance Measures (APM)/ Non-IFRS Financial Measures Our Alternative Performance Measures (APMs) present useful information which supplements the financial statements. These measures are
Alternative Performance Measures (APM)/ Non-IFRS Financial Measures Our Alternative Performance Measures (APMs) present useful information which supplements the financial statements. These measures are
Q Financial presentation. Arne Møgster CEO Britt Kathrine Drivenes CFO
 Q2 2017 Financial presentation Arne Møgster CEO Britt Kathrine Drivenes CFO Highlights All figures in NOK 1,000 Q2 2017 Q2 2016 H1 2017 H1 2016 2016 Revenue 5 019 195 4 558 229 11 094 149 8 970 468 18
Q U A R T E R L Y R E P O R T 2 N D Q U A R T E R
 Q U A R T E R L Y R E P O R T 2 N D Q U A R T E R 2 0 0 7 1. Grieg Seafood develops as planned Grieg Seafood was listed in June, and has now 869 shareholders after 2 shares issues of MNOK 700 in total.
Alternative Performance Measures (APM) / Non-IFRS Financial Measures. Definitions of Alternative Performance Measures, Non-IFRS Financial Measures
 / Non-IFRS Financial Measures. Definitions of Alternative Performance Measures, Non-IFRS Financial Measures") Alternative Performance Measures (APM) / Non-IFRS Financial Measures Our Alternative Performance Measures (APMs) present useful information which supplements the financial statements. These measures are
Alternative Performance Measures (APM) / Non-IFRS Financial Measures Our Alternative Performance Measures (APMs) present useful information which supplements the financial statements. These measures are
Financial targets and investments in sustainable growth. Atle Harald Sandtorv, CFO
 Financial targets and investments in sustainable growth Atle Harald Sandtorv, CFO 79 Financial targets Growth Target 100 000 tonnes in 2020 2017 62 598 tonnes Cost At or below industry average NOK 37.9/kg
Interim Report. January September 2013
 Interim Report January September 2013 Disclaimer Albain Bidco Norway AS is providing the following financial results for the third quarter of 2013 to holders of its EUR225,000,000 6.750% Senior Secured
Grieg Seafood ASA Quarterly report Q4 2018
 bv Grieg Seafood ASA Quarterly report ABOUT GRIEG SEAFOOD Grieg Seafood ASA is one of the world's leading salmon farmers, specializing in Atlantic salmon. The Group has an annual production target of 100
Presentation Q Oslo, 8 May Charles Høstlund, CEO Ola Loe, CFO
 Presentation Q1 2018 Oslo, 8 May 2018 Charles Høstlund, CEO Ola Loe, CFO Agenda 1. Highlights for the period 2. Segment information 3. Group financials 4. Markets 5. Projects for growth 6. Outlook 2 Highlights
Presentation Q Oslo, 6 November Charles Høstlund, CEO Ola Loe, CFO
 Presentation Q3 2018 Oslo, 6 November 2018 Charles Høstlund, CEO Ola Loe, CFO Agenda 1. Highlights for the period 2. Segment information 3. Group financials 4. Markets 5. Projects for growth 6. Outlook
Chile, que pasa? -an update of the situation for salmon farming in Chile, - issues and potential solutions
 Chile, que pasa? -an update of the situation for salmon farming in Chile, - issues and potential solutions Intrafish / DNB investor conference London, 4 November, 2015 Jon Hindar CEO Cermaq Group The starting
Austevoll Seafood ASA Q1 2009
 Q1 2009 Ole Rasmus Møgster Chairman Britt Kathrine Drivenes CFO Disclaimer This Presentation has been produced by (the Company or Austevoll ) solely for use at the presentation to the market held in connection
Your Aquaculture Technology and Service Partner. Company presentation November 2014
 Company presentation November 2014 Important Information About this Company Presentation This Company Presentation has been prepared by AKVA group ASA ("AKVA group" or the "Company") for information purposes
Lerøy Seafood Group. Quarterly report Second quarter August 19th Helge Singelstad. Ivan Vindheim CEO CFO
 Lerøy Seafood Group Quarterly report Second quarter 2009 August 19th 2009 Helge Singelstad CEO Ivan Vindheim CFO 1 Agenda 1. 1 Considerations 2. 2 Key financial figures Q2 2009 3. 3 Lerøy at a glance 4.
Sølvtrans Holding ASA Q Oslo, 7 November Roger Halsebakk, CEO Jon Kvalø, CFO
 Sølvtrans Holding ASA Q3 2012 Oslo, 7 November 2012 Roger Halsebakk, CEO Jon Kvalø, CFO 1 Highlights in the quarter 2 Financial review 3 Operational and market review 4 Summary and outlook 5 Appendix Highlights
Lerøy Seafood Group. Quarterly report First quarter May 12th Helge Singelstad. Henning Beltestad. Ivan Vindheim.
 Lerøy Seafood Group Quarterly report First quarter 2010 May 12th 2010 Helge Singelstad Chairman Henning Beltestad CEO Ivan Vindheim CFO 1 Agenda 1. 1 Considerations 2. 2 Key financial figures Q1 2010 3.
Q Financial presentation. Arne Møgster CEO Britt Kathrine Drivenes CFO
 Q2 2015 Financial presentation Arne Møgster CEO Britt Kathrine Drivenes CFO Highlights All figures in NOK 1,000 Q2 2015 (restated) Q2 2014 H1 2015 (restated) H1 2014 2014 Revenue 4 107 801 3 606 154 7
INTERIM PRESENTATION Second quarter, 2006
 INTERIM PRESENTATION Second quarter, 6 CEO Yngve Myhre CFO Bent M. Skisaker Agenda Operational Update Group Harvesting Processing Norway and Denmark Strategic considerations and Outlook Financials Income
Q Financial presentation. Arne Møgster CEO Britt Kathrine Drivenes CFO
 Q4 2014 Financial presentation Arne Møgster CEO Britt Kathrine Drivenes CFO Highlights All figures in NOK 1,000 Q4 2014 Q4 2013 (restated) 2014 2013 (restated) Revenue 3 704 689 3 725 710 14 344 177 12
Athens Greece 31 March Annual 2017 Results Presentation NIREUS AQUACULTURE S.A.
 Athens Greece 31 March 2018 Annual 2017 Results Presentation NIREUS AQUACULTURE S.A. Table of Contents Pages I. Our Vision... 3 II. Profile..4-15 III. Sales by Business Sector....16 IV. Sales evolution...
Aker Seafoods Second quarter 2010 Profits improved in high season
 Aker Seafoods Second quarter 21 Profits improved in high season CEO Liv Monica B Stubholt CFO Gunnar Aasbø-Skinderhaug Welcome Agenda Topic Speaker Operational Update Liv Monica Stubholt, CEO Group Harvesting
Austevoll Seafood ASA
 Austevoll Seafood ASA Financial Report Q3 2017 Index Key figures for the Group...03 Q3 2017...04 Operating segments...04 Cash flow Q3 2017...07 Financial factors at 30 September 2017...07 Cash flows at
Strategic pricing challenges from a buyer s perspective
 Strategic pricing challenges from a buyer s perspective A Cluster Partner Fish Pool / DNB Brussels Seminar, 24. April 2017 Dag Sletmo, dag.sletmo@dnb.no, tel +47 95286134 DNB Bank is a global seafood player
THIRD QUARTER MARINE HARVEST GROUP
 / / Q3 2014 THIRD QUARTER MARINE HARVEST GROUP Strong earnings Successful start up of the feed plant Agreement to buy 40 000 tons farming capacity from Acuinova in Chile Quarterly dividend of NOK 1.10