Q Presentation Oslo, October 28, Trond Williksen, CEO
|
|
|
- Oswin Hart
- 5 years ago
- Views:
Transcription


1 Q Presentation Oslo, October 28, 2011 Trond Williksen, CEO 1

2 Agenda Highlights Q Financials Q Outlooks Q & A 2

3 Highlights 3

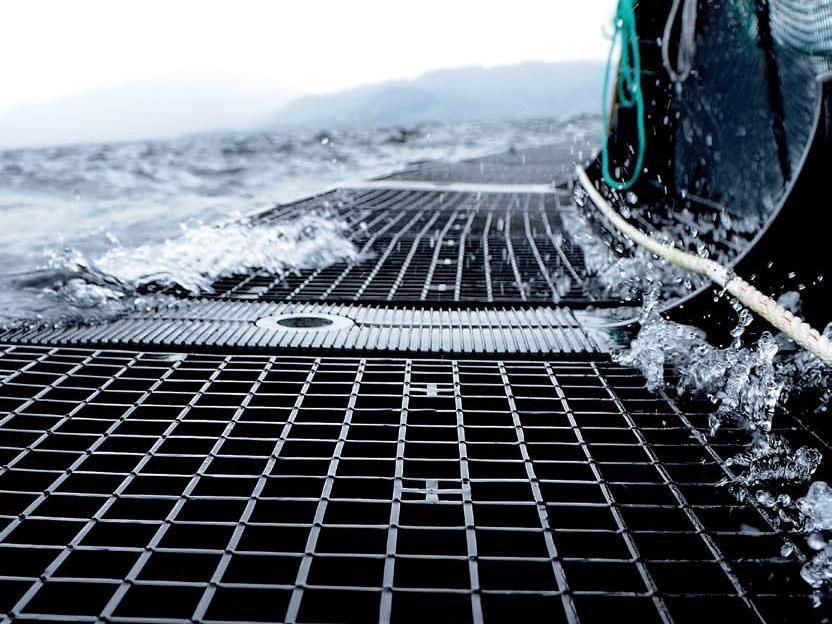
4 Increased profitability Operating revenues in Q3 was MNOK compared to in Q3 last year an increase of 6.8% EBITDA in Q3 was 22.0 MNOK compared to 10.2 MNOK in Q3 last year - up 11.8 MNOK EBIT in Q3 was 13.8 MNOK versus 2.1 in Q3 last year - up 11.7 MNOK Order backlog at the end of 3Q was 260 MNOK versus 270 MNOK at the end of 3Q last year Uncertainty in regards to effect of low salmon prices especially in Norway, but activity level in Chile expected to stay high into 2012 Still strong focus on operational improvements and costs Successful Aqua Nor introduction of new barge design and EcoNet 4

5 Q Financials 5
6 Q3 Financials P&L group P&L (MNOK) Q3 Q3 YTD YTD Total OPERATING REVENUES 226,7 212,3 702,6 546,6 742,5 Operating costs excluding depreciations 204,8 202,1 643,8 547,8 752,4 EBITDA 22,0 10,2 58,8-1,2-9,9 Depreciation 8,2 8,1 23,9 23,2 31,0 EBIT 13,8 2,1 34,8-24,4-40,9 Net interest expense -2,9-3,2-9,2-8,4-12,0 Other financial items 0,3-0,5 1,0 1,1 2,0 Net financial items -2,6-3,7-8,2-7,3-9,9 EBT 11,2-1,7 26,6-31,7-50,9 Taxes 3,1-0,1 6,2-8,6-13,3 NET PROFIT 8,1-1,5 20,5-23,1-37,6 Operating revenues in Q MNOK vs MNOK last year Growth in Chile of over 300% compared to Q EBITDA in Q MNOK vs 10.2 MNOK last year, an increase of 11.8 MNOK EBIT in Q MNOK vs 2.1 MNOK last year, an increase of 11.7 MNOK Revenue growth 6,8 % 7,3 % 28,5 % 5,6 % 23,9 % EBITDA margin 9,7 % 4,8 % 8,4 % -0,2 % -1,3 % EPS (NOK) 0,31-0,09 1,02-1,34-2,19 Net profit in Q3 8.1 MNOK compared to negative -1.5 MNOK in Q3 YTD EBIT 34.8 MNOK compared to negative 23.1 MNOK at the end of Q an improvement of 57.9 MNOK 6

7 Q3 P&L segments - Hardware P&L (MNOK) Q3 Q3 YTD YTD Total HARDWARE OPERATING REVENUES 190,6 173,8 573,9 428,5 574,5 Operating costs excluding 167,7 163,3 515,4 414,4 557,6 depreciations EBITDA 22,9 10,5 58,6 14,1 16,8 Depreciation 6,2 5,3 17,8 14,5 19,7 EBIT 16,7 5,2 40,8-0,4-2,9 Steady revenue stream in HW segment, supported by growing volume in Chile Still significant cage volume in Norway throughout Q3 despite normal seasonality in this market EBITDA of 22.9 MNOK compared to 10.5 MNOK in Q EBIT of 16.7 MNOK compared to 5.2 MNOK in Q

8 3 Q P&L segments - Software P&L (MNOK) Q3 Q3 YTD YTD Total SOFTWARE OPERATING REVENUES 25,1 24,7 82,4 76,3 106,1 Operating costs excluding 21,5 21,1 72,6 69,7 97,1 depreciations EBITDA 3,6 3,6 9,8 6,6 9,0 Depreciation 1,7 2,4 5,2 7,7 10,0 EBIT 2,0 1,2 4,7-1,1-1,0 Steady revenue stream in SW with healthy earnings in the quarter Revenue and earnings slightly improved compared with Q3 last year Icelandic operation profitable, but still slow due to economic downturn in the aftermath of financial crisis 8

9 Q3 P&L segments - RAS P&L (MNOK) Q3 Q3 YTD YTD Total RAS OPERATING REVENUES 11,0 13,8 46,2 41,8 62,0 Operating costs excluding 15,6 17,7 55,9 63,7 97,7 depreciations EBITDA -4,6-3,9-9,7-21,8-35,8 Depreciation 0,3 0,5 1,0 1,0 1,3 EBIT -4,9-4,4-10,6-22,8-37,0 RAS business area tuned for long term development and growth with adjusted cost base Operating revenues in Q3 at 11.0 MNOK compared to 13.8 MNOK in Q EBIT in Q3 minus 4.9 MNOK compared to minus 4.4 MNOK last year. 1.0 MNOK in special items related to old projects Prospect list subject to investment decisions inside and outside salmon industry 9


10 Market segments Geographic segments Q Iceland 4 % Other 8 % Relative stable between regions from Q2 to Q3 Medit. Canada 7 % 3 % UK 8 % Norway 46 % Chile growing importance at the expense of the other regions Chile 24 % YTD Q Chile represented 9% Product Group Segments Q RAS SW6 % 12 % HW 82 % HW= Hardware deliveries and services Cages, barges, Feed Systems and other operational systems SW = Software and software systems RAS = Recirculation systems 10


11 Order backlog and inflow Order backlog (MNOK) MNOK The order backlog was 260 MNOK at the end of 3Q. A slight reduction from Q Q11 2Q11 1Q11 4Q10 3Q10 2Q10 1Q10 4Q09 3Q09 2Q09 1Q09 4Q08 3Q08 2Q08 Order inflow (MNOK) MNOK Order inflow effected by the holiday season in the northern hemisphere Total order inflow in Q was 146 MNOK vs. 167 MNOK in Uncertainty in regards to effect of low salmon prices going forward 3Q11 2Q11 1Q11 4Q10 3Q10 2Q10 1Q10 4Q09 3Q09 2Q09 1Q09 4Q08 3Q08 2Q08 11

12 MNOK New markets AKVA group revenues within other species CAGR ~43% * * Sales and order backlog for delivery in 2011 per Q
13 Balance Sheet BALANCE SHEET (MNOK) Intangible fixed assets 205,4 210,6 215,9 Fixed assets 39,6 37,9 41,6 Long-term financial assets 23,8 29,8 39,4 FIXED ASSETS 268,8 278,3 297,0 Stock 178,8 139,1 157,7 Trade receivables 216,3 175,0 177,8 Other receivables 39,9 26,5 19,6 Cash and cash equivalents 41,1 50,1 43,2 CURRENT ASSETS 476,1 390,7 398,2 TOTAL ASSETS 744,9 669,1 695,2 Paid in capital 355,5 267,1 267,1 Retained equity -28,9-34,1-39,5 TOTAL EQUITY 326,6 233,0 227,6 Other long term debt 1,8 3,6 2,4 Long-term interest bearing debt 116,7 141,9 134,5 LONG-TERM DEBT 118,5 145,6 136,9 Short-term interest bearing debt 50,5 64,5 77,3 Other current liabilities 249,3 226,0 253,5 SHORT-TERM DEBT 299,8 290,5 330,8 TOTAL EQUITY AND DEBT 744,9 669,1 695,2 Equity ratio 43,8 % 34,8 % 32,7 % Net interest bearing debt 126,0 156,4 168,6 Net working capital 185,6 114,6 101,6


14 Financial position Equity (%) 60 % 50 % 40 % 30 % 45 % 45 % 46 % 42 % 39 % 34 % 35 % 33 % 33 % 41,3 % 43,8 % Equity: Equity of 43,8% end Q3 20 % 10 % 0 % 1Q09 2Q09 3Q09 4Q09 1Q10 2Q10 3Q10 4Q10 1Q11 2Q11 3Q11 Cash balance (MNOK) MNOK Cash Position: Total available cash was 85 MNOK end of Q3 Growth in working capital due to volume increase in Chile. Expected to be reduced in Q4 0 1Q09 2Q09 3Q09 4Q09 1Q10 2Q10 3Q10 4Q10 1Q11 2Q11 3Q11 14
15 Cash flow statement CASH FLOW STATEMENT (NOK 1 000) Q3 Q3 YTD YTD Total Net cash flow from operational activities Net cash flow from investment activities Net cash flow from financial activities Net cash flow Cash and cash equivalents at the beginning of the period Cash and cash equivalents at the end of the period Investments in Q3 were 5.0 MNOK whereof 2.0 MNOK is capitalized R&D expenses in accordance with IFRS. 15


16 Outlooks 16

17 Outlooks Uncertainty in regards to effects of low salmon prices especially in the Norwegian market going forward Q4 normally has lower activity due to seasonality, especially in the Norwegian cage segment The Chilean market developed strongly also in 3Q and business volume in 2011 will be well over Expected to sustain into Scotland and Canada shows stabile development into 2012 Focus on growth in service and aftermarket to increase recurring business Focus on operational improvements and costs 17

18 New barge design and EcoNet presented at Aqua NOR
19 Q & A 19
20 20
Q Presentation Oslo, August 09, 2011
 Q2 2011 Presentation Oslo, August 09, 2011 Trond Williksen, CEO Morten Nærland, CFO 1 Agenda Highlights Q2 2011 Financials Q2 2011 Way forward Q & A 2 1 Highlights 3 Recovery continues Growth in operating
Q Presentation Oslo, May 10 th, 2012 Trond Williksen, CEO Eirik Børve Monsen, CFO
 Q1 2012 Presentation Oslo, May 10 th, 2012 Trond Williksen, CEO Eirik Børve Monsen, CFO 1 Agenda Highlights Q1 2012 Trond Williksen, CEO Financial performance Q1 2012 Eirik Børve Monsen, CFO Outlooks Trond
Third quarter report Quarterly report Nr
 Third quarter report 2011 Quarterly report Nr 3 2011 Highlights Operating revenues in Q3 was 226.7 MNOK compared to 212.3 in Q3 last year an increase of 6.8% EBITDA in Q3 was 22.0 MNOK compared to 10.2
Oslo, February 27 th, 2012 Trond Williksen, CEO Eirik Børve Monsen, CFO
 Q4 2012 Presentation ti Oslo, February 27 th, 2012 Trond Williksen, CEO Eirik Børve Monsen, CFO 1 Agenda Highlights Q4 2012 Trond Williksen, CEO Financial performance Q4 20122 Eirik Børve Monsen, CFO Statement
The global leader in aquaculture technology
 The global leader in aquaculture technology 2Q 2010 presentation 19 August 2010 Morten Nærland, CFO & Acting CEO Agenda Background & highlights 2Q 2010 Financial review Outlook Q & A 2 3 AKVA group in
Your Aquaculture Technology and Service Partner. Q Presentation Oslo - August 20 th, 2015 Trond Williksen, CEO Eirik Børve Monsen, CFO
 Q2 2015 Presentation Oslo - August 20 th, 2015 Trond Williksen, CEO Eirik Børve Monsen, CFO Agenda 1 Highlights 2 Financial performance 3 Outlook 4 Q&A Highlights Q2 2015 - by CEO Trond Williksen 3 Best
Your Aquaculture Technology and Service Partner. Q Presentation Oslo - May 8 th, 2015 Trond Williksen, CEO Eirik Børve Monsen, CFO
 Q1 2015 Presentation Oslo - May 8 th, 2015 Trond Williksen, CEO Eirik Børve Monsen, CFO Agenda 1 Highlights 2 Financial performance 3 Outlook 4 Q&A Highlights Q1 2015 - by CEO Trond Williksen 3 On track
3Q 2009 presentation 11 November 2009
 The global leader in aquaculture technology 3Q 2009 presentation 11 November 2009 Knut Molaug, CEO Rolf Andersen, CFO Agenda Background & highlights 3Q 2009 Financial review Outlook Q & A 2 1 3 AKVA group
The global leader in aquaculture technology
 The global leader in aquaculture technology 1Q 2010 presentation 29 April 2010 Knut Molaug, CEO Morten Nærland, CFO Agenda Background & highlights 1Q 2010 Financial review Outlook Q & A 2 3 AKVA group
Quarterly report Nr Third quarter report 2010
 Quarterly report Nr 3 2010 Third quarter report 2010 Highlights Operating revenues in 3Q were 212.3 MNOK versus 139.8 MNOK last year. Year to date operating revenues were 546.6 MNOK versus 456.5 MNOK last
3Q 2007 presentation 7 November 2007
 The global leader in aquaculture technology 3Q 2007 presentation 7 November 2007 Knut Molaug, CEO Rolf Andersen, CFO Pro-forma Please note that unless otherwise stated all comments in this presentation
Your Aquaculture Technology and Service Partner. Q Presentation Oslo - February 19 th, 2016 Trond Williksen, CEO Eirik Børve Monsen, CFO
 Q4 2015 Presentation Oslo - February 19 th, 2016 Trond Williksen, CEO Eirik Børve Monsen, CFO Agenda 1 Highlights 2 Financial performance 3 Outlook 4 Q&A Highlights Q4 2015 - by CEO Trond Williksen 3 MNOK
Your Aquaculture Technology and Service Partner. Q Presentation Oslo - May 11 th, 2016 Trond Williksen, CEO Eirik Børve Monsen, CFO
 Q1 2016 Presentation Oslo - May 11 th, 2016 Trond Williksen, CEO Eirik Børve Monsen, CFO Agenda 1 Highlights 2 Financial performance 3 Outlook 4 Q&A Highlights Q1 2016 - by CEO Trond Williksen 3 MNOK On
Your Aquaculture Technology and Service Partner. Q Presentation Oslo - August 17 th, 2016 Trond Williksen, CEO Eirik Børve Monsen, CFO
 Q2 2016 Presentation Oslo - August 17 th, 2016 Trond Williksen, CEO Eirik Børve Monsen, CFO Agenda 1 Highlights 2 Financial performance 3 Outlook 4 Q&A Highlights Q2 2016 - by CEO Trond Williksen 3 Improved
Best Q1 ever all time high order backlog
 Best Q1 ever all time high order backlog First quarter 2014 HIGHLIGHTS Best Q1 ever Revenue of 310 MNOK (222 MNOK) EBITDA of 32 MNOK (10 MNOK) YoY increase in revenues of 40% and a YoY increase in EBITDA
4Q 2006 presentation 27. February 2007
 The global leader in aquaculture technology presentation 27. February 2007 Steven A. Morrell, Chairman of the Board Knut Molaug, CEO Rolf Andersen, CFO Agenda Background & highlights Financial review Status
Q Presentation. Oslo November 2 nd 2018 Hallvard Muri, CEO Simon Nyquist Martinsen, CFO
 Q3 218 Presentation Oslo November 2 nd 218 Hallvard Muri, CEO Simon Nyquist Martinsen, CFO Agenda Highlights Financial performance Outlook Q&A Highlights Q3 218 by CEO Hallvard Muri Order Intake development
On track with a good start of the year
 On track with a good start of the year First Quarter 2016 HIGHLIGHTS All business segments are performing well best Q1 ever A broad mix of products and services contribute financially becoming a stronger
High market activity growth strategy continued
 High market activity growth strategy continued Fourth quarter 2016 HIGHLIGHTS Record high sales and order intake (+60%) Order backlog end of year approximately 1.0 BNOK EBITDA in the quarter hampered by
Improved performance and growth continues
 Improved performance and growth continues Second quarter 2016 HIGHLIGHTS Overall good performance - 10.4% EBITDA margin Land based strengthen P&L and high order backlog becoming a significant part of AKVA
Significant growth outside Norway
 Significant growth outside Norway Second quarter 2018 HIGHLIGHTS Continued good activity across all regions and segments Growth in revenue (17%), in particular by Americas and EME (Europe and Middle East)
Good market activity continues
 Good market activity continues First quarter 2017 HIGHLIGHTS Good market activity across all regions High quoting activity in the Land Based segment Strong growth in order intake and revenue (+34% / +30%)
Positive underlying development
 Positive underlying development Fourth quarter 2017 HIGHLIGHTS Growth in revenue (+24%) Continued high market activity across all regions and segments Order intake of 557 MNOK in the quarter, on the same
Q Presentation. Oslo May 16 th 2018 Hallvard Muri, CEO Simon Nyquist Martinsen, CFO
 Q1 218 Presentation Oslo May 16 th 218 Hallvard Muri, CEO Simon Nyquist Martinsen, CFO Agenda Highlights Financial performance Outlook Q&A Highlights Q1 218 by CEO Hallvard Muri Continued growth in order
Your Aquaculture Technology and Service Partner. Company presentation November 2014
 Company presentation November 2014 Important Information About this Company Presentation This Company Presentation has been prepared by AKVA group ASA ("AKVA group" or the "Company") for information purposes
Q presentation. 5 February 2015
 Q4 2014 presentation 5 February 2015 Agenda Highlights Financial overview Market outlook Q4 Highlights Strong finish to a record year Revenue of NOK 7 549 million, up 10.3% EBITDA* of NOK 396 million,
High market activity growth strategy continued
 High market activity growth strategy continued Third quarter 2016 HIGHLIGHTS Overall good financial performance - 10.8% EBITDA margin P&L growth softened by Americas and restructuring of AKVA group Denmark
Third quarter report Quarterly report. Nr
 Third quarter report 2008 Quarterly report Nr 3 2008 Highlights Operating revenue in 3Q was 207 MNOK which is lower than same period last year. The period s EBITDA was 18.1 MNOK Operating revenue year
Marine Harvest Q Presentation
 Marine Harvest Q2 2015 Presentation Forward looking statements This presentation may be deemed to include forward-looking statements, such as statements that relate to Marine Harvest s contracted volumes,
3Q 2018 Fornebu, October 24, 2018 Luis Araujo and Svein Stoknes
 3Q 2018 Fornebu, October 24, 2018 Luis Araujo and Svein Stoknes Agenda 3Q 2018 Answers Questions Introduction Luis Araujo Chief Executive Officer Financials Svein Stoknes Chief Financial Officer Q&A Session
SalMar ASA. Presentation Q CEO Leif Inge Nordhammer CFO Trond Tuvstein
 SalMar ASA Presentation Q1 2015 CEO Leif Inge Nordhammer CFO Trond Tuvstein Agenda Highlights Financial update Operational update Outlook First quarter 2015 highlights Improved operations Challenging biological
Contents. 4 Highlights Financial key figures. 8 CEO s report. 9 Corporate management. 11 Board of Directors report. 16 Board of Directors
 Annual Report 2010 AKVA group in brief AKVA group is a global provider of land-based and cage farming aquaculture technology; from single components to sustainable turn-key installations worldwide With
First half year and Q2 results Peter Nilsson, CEO Cathrin Nylander, CFO
 First half year and Q2 results 2018 Peter Nilsson, CEO Cathrin Nylander, CFO 12 July, 2018 Financial highlights Q2: Continued growth and solid profitability Continued revenue growth Highest Q2 revenue
Presentation of Cermaq
 Presentation of Cermaq North Atlantic Seafood Seminar Oslo, 8 th March 2012 Agenda Introduction to Cermaq Key results 2011 Focus on Mainstream Chile Outlook 2012 Photograph: Alf Børjesson 2 This is Cermaq
Marine Harvest. Q Presentation 22 August 2018
 Marine Harvest Q2 2018 Presentation 22 August 2018 Forward looking statements This presentation may be deemed to include forward-looking statements, such as statements that relate to Marine Harvest s contracted
Marine Harvest. Q Presentation 24 August 2017
 Marine Harvest Q2 2017 Presentation 24 August 2017 1 Forward looking statements This presentation may be deemed to include forward-looking statements, such as statements that relate to Marine Harvest s
Q1 results Peter Nilsson, CEO Cathrin Nylander, CFO
 Q1 results 2018 Peter Nilsson, CEO Cathrin Nylander, CFO 20 April, 2018 Financial highlights Q1: Solid growth and improved profitability Strong revenue growth Underlying growth 8.9% EBIT margin 6.0% (5.3%)
Marine Harvest. Q Presentation 10 May 2017
 Marine Harvest Q1 2017 Presentation 10 May 2017 1 Forward looking statements This presentation may be deemed to include forward-looking statements, such as statements that relate to Marine Harvest s contracted
Your Aquaculture Technology and Service Partner. Company presentation August 2016
 Company presentation August 2016 Important Information About this Company Presentation This Company Presentation has been prepared by AKVA group ASA ("AKVA group" or the "Company") for information purposes
First three quarters and Q3 results 2018
 First three quarters and Q3 results 2018 Peter Nilsson, CEO Cathrin Nylander, CFO 19 October, 2018 Financial highlights Q3: Strong order growth, including oil and gas Orders Received 25% growth MNOK 669
4 TH QUARTER RESULTS Kenneth Ragnvaldsen, CEO February 1, 2013, Oslo
 Q4 4 TH QUARTER RESULTS 2012 Kenneth Ragnvaldsen, CEO February 1, 2013, Oslo AGENDA Financial status Business update Outlook Q&A HIGHLIGHTS Profitability continues to improve High activity. Strong order
Revenue 1,716 million (7% y/y) EBITA 150 million (11% y/y) EBITA margin 8,8 %
 EBITA 150 million (11% y/y) EBITA margin 8,8 %") Q3 HIGHLIGHTS GROUP Revenue 1,716 million (7% y/y) EBITA 150 million (11% y/y) EBITA margin 8,8 % Gaining share in Bank & Finance; +6% y/y Change in pension scheme implemented Significant restructuring
Q3 HIGHLIGHTS GROUP Revenue 1,716 million (7% y/y) EBITA 150 million (11% y/y) EBITA margin 8,8 % Gaining share in Bank & Finance; +6% y/y Change in pension scheme implemented Significant restructuring
Marine Harvest. Q Presentation 1 November 2017
 Marine Harvest 1 Q3 2017 Presentation 1 November 2017 Forward looking statements This presentation may be deemed to include forward-looking statements, such as statements that relate to Marine Harvest
Aker Seafoods Second quarter 2010 Profits improved in high season
 Aker Seafoods Second quarter 21 Profits improved in high season CEO Liv Monica B Stubholt CFO Gunnar Aasbø-Skinderhaug Welcome Agenda Topic Speaker Operational Update Liv Monica Stubholt, CEO Group Harvesting
SECOND QUARTER and FIRST HALF 2012
 SECOND QUARTER and FIRST HALF 2012 Highlights from second quarter 2012 include: Revenues of 948 MNOK (952 MNOK in second quarter 2011) Unchanged in local currencies +4% in Sorting Solutions - 2% in Collection
Blom ASA. 1 st Quarter 2012 Results. Presentation by CEO Dirk Blaauw. May 31 st 2012 Thon Hotel Vika Atrium, Oslo
 Blom ASA 1 st Quarter 2012 Results Presentation by CEO Dirk Blaauw May 31 st 2012 Thon Hotel Vika Atrium, Oslo Disclaimer Forward Looking Statements This presentation contains forward-looking statements
Interim Report. January September 2013
 Interim Report January September 2013 Disclaimer Albain Bidco Norway AS is providing the following financial results for the third quarter of 2013 to holders of its EUR225,000,000 6.750% Senior Secured
4Q 2018 Fornebu, February 8, 2019 Luis Araujo and Svein Stoknes
 4Q 2018 Fornebu, February 8, 2019 Luis Araujo and Svein Stoknes Agenda 4Q 2018 Answers Questions Introduction Luis Araujo Chief Executive Officer Financials Svein Stoknes Chief Financial Officer Q&A Session
Marine Harvest. Q Presentation 14 February 2018
 Marine Harvest Q4 2017 Presentation 14 February 2018 1 Forward looking statements This presentation may be deemed to include forward-looking statements, such as statements that relate to Marine Harvest
Marine Harvest Q Presentation
 Marine Harvest Q1 2015 Presentation Forward looking statements This presentation may be deemed to include forward-looking statements, such as statements that relate to Marine Harvest s contracted volumes,
NORWAY ROYA L S A L M ON PRESENTATION Q Oslo, 7 November 2017 Charles Høstlund, CEO Ola Loe, CFO 1
 PRESENTATION Q3 2017 Oslo, 7 November 2017 Charles Høstlund, CEO Ola Loe, CFO 1 AGENDA: Highlights for the period Segment information Group financials Markets Outlook 2 Highlights in Q3 2017 Operational
CEO Terje Mjøs. Oslo, 8 February Q Presentation
 CEO Terje Mjøs Oslo, 8 February 213 2 Presentation Part I ` Report o Group o Segments Part II Cost improvements o Revenue and margin analysis o Future proof Part III Outlook o Market o Company Summary
NORWEGIAN AIR SHUTTLE ASA QUARTERLY REPORT FOURTH QUARTER 2007
 NORWEGIAN AIR SHUTTLE ASA QUARTERLY REPORT FOURTH QUARTER 2007 FOURTH QUARTER IN BRIEF The Group earnings before tax (EBT) was MNOK -34.0 (-35.6) in the fourth quarter. The fourth quarter operating revenue
1Q 2018 Fornebu, April 27, 2018 Luis Araujo and Svein Stoknes
 1Q 2018 Fornebu, April 27, 2018 Luis Araujo and Svein Stoknes Agenda 1Q 2018 Answers Questions Introduction Luis Araujo Chief Executive Officer Financials Svein Stoknes Chief Financial Officer Q&A Session
Pareto Investor & Finance Seminar «Key value drivers in whitefish harvesting» Webjørn Barstad, CEO HAVFISK ASA
 Pareto Investor & Finance Seminar «Key value drivers in whitefish harvesting» Webjørn Barstad, CEO HAVFISK ASA HAVFISK ASA Agenda HAVFISK in brief Key financial deliveries Value-drivers Outlook Company
Q August 24th. Lerøy Seafood Group ASA. CEO Henning Beltestad CFO Sjur S. Malm
 Q2 2017 August 24th Lerøy Seafood Group ASA CEO Henning Beltestad CFO Sjur S. Malm Agenda Highlights Key financial figures Outlook Q2 2017 EBIT before FV adj. NOK 801 million Harvest volume 26 156 GWT
Highlights for the quarter Q2 / EBIT NOK 60 million pre biomass write-down
 Half year report Highlights for the quarter EBIT NOK 60 million pre biomass write-down EBIT pre fair value and biomass write-down (NOK million) 318 348 300 101 60 Mainstream results negatively impacted
PRESENTATION Q Oslo, 19 February 2013 John Binde, CEO Ola Loe, CFO
 PRESENTATION Q4 2012 Oslo, 19 February 2013 John Binde, CEO Ola Loe, CFO AGENDA: Highlights for the period Segment information Group financials Outlook 2 Highlights in Q4 2012: Significant improvement
SalMar ASA. Presentation Q CEO Yngve Myhre, CFO Trond Tuvstein Oslo, 14 November w w w. s a l m a r. n o
 Presentation Q3 2013 SalMar ASA CEO Yngve Myhre, CFO Trond Tuvstein Oslo, 14 November 2013 2 Agenda Highlights Financial update Operational update Market and outlook Third quarter highlights Another strong
Interim Report. 1st quarter 2009
 Interim Report 1st quarter 2009 Nordic Semiconductor ASA 1st quarter 2008 Revenue in the first quarter was 71.5, an increase of 12% over Q1 2008. EBITDA was 8.3 MNOK in the first quarter compared to 0.7
2 nd QUARTER 2004 RESULTS
 2 nd QUARTER 2004 RESULTS 2 nd QUARTER FINANCIAL HIGHLIGHTS Consolidated Net Revenues were USD 41.0 million, an increase of 45% compared to Q2 2003. Operating Profit (EBIT) was USD 12.9 million (32% of
Villa Organic AS fourth quarter 2012
 Notice to shareholders; Villa Organic AS fourth quarter 2012 Highlights fourth quarter 2012 The average prices were approximately at the same level as Q3, but improvement was observed towards the end of
PRESENTATION Q Oslo, 14 November 2012 John Binde, CEO Ola Loe, CFO
 PRESENTATION Q3 2012 Oslo, 14 November 2012 John Binde, CEO Ola Loe, CFO AGENDA: Highlights for the period Segment information Group financials Outlook 2 Highlights in Q3 2012: Strong consumption growth
AGR PETROLEUM SERVICES. Interim Report
 AGR PETROLEUM SERVICES Interim Report 2 nd quarter and first half year 2014 SECOND QUARTER 2014 FINANCIAL HIGHLIGHTS EBITDA: Earnings before interest, tax, depreciation and amortisation On 19 July 2014
PRESENTATION Q Oslo, 15 August 2013 John Binde, CEO Ola Loe, CFO
 PRESENTATION Q2 2013 Oslo, 15 August 2013 John Binde, CEO Ola Loe, CFO AGENDA: Highlights for the period Segment information Group financials Outlook 2 Highlights in Q2 2013: Best quarterly operational
Interim Report Q2-18
 Interim Report Q2-18 HIGHLIGHTS Operational EBIT of NOK 181 million o Operational EBIT per kg of NOK 24.73 in Region North o Operational EBIT per kg of NOK 23.49 in Region South o Non-recurring item of
Presentation of Annual Report Klaus Holse, CEO, SimCorp A/S Thomas Johansen, CFO, SimCorp A/S
 Presentation of Annual Report 2014 Klaus Holse, CEO, SimCorp A/S Thomas Johansen, CFO, SimCorp A/S Disclaimer This presentation contains certain forward-looking statements and expectations in respect of
2008 Results and Outlook
 VZ Group VZ Holding Ltd Beethovenstrasse 24 CH-8002 Zurich Telephone: +41 44 207 27 27 Fax: +41 44 207 27 28 vermoegenszentrum.ch vzonline.ch 2008 Results and Outlook Aarau Basle Berne Frankfurt Geneva
Q presentation. 15 July 2015
 Q2 2015 presentation 15 July 2015 Q2 Highlights Revenue of NOK 6 842 million, up 14.4% EBITDA* of NOK 157 million, down 11.2% Large variance in performance across countries, with strong results in Sweden,
Marine Harvest Q Presentation
 Marine Harvest Q2 2014 Presentation Forward looking statements This presentation may be deemed to include forward-looking statements, such as statements that relate to Marine Harvest s contracted volumes,
Grieg Seafood ASA. griegseafood.com. Andreas Kvame CEO. Atle Harald Sandtorv CFO. 8 November 2017
 Grieg Seafood ASA Andreas Kvame CEO Atle Harald Sandtorv CFO 8 November 2017 1 Agenda Highlights This is Grieg Seafood Business Units (Regions) Financials Outlook 2 Highlights Q3 2017 Improved results
North Energy Q High investment activity and a strong financial position. CEO Knut Sæberg. 9 November 2017
 North Energy Q3 2017 High investment activity and a strong financial position 9 November 2017 CEO Knut Sæberg Important information This presentation and its appendices (together the Presentation ) have
Sølvtrans Holding ASA Q Oslo, 7 November Roger Halsebakk, CEO Jon Kvalø, CFO
 Sølvtrans Holding ASA Q3 2012 Oslo, 7 November 2012 Roger Halsebakk, CEO Jon Kvalø, CFO 1 Highlights in the quarter 2 Financial review 3 Operational and market review 4 Summary and outlook 5 Appendix Highlights
Full year and Q4 results 2018
 Full year and Q4 results 2018 Cathrin Nylander, Acting CEO and CFO 14 February, 2019 Financial highlights Q4: Strong revenue growth Strong orders received MNOK 918 (940) EBIT margin 5.7% (6.5%) Excluding
THIRD QUARTER Strong performance in Collection Technology Deposit. Improved performance and outlook in Industrial Processing Technology
 THIRD QUARTER 2009 Highlights from third quarter 2009 include: Strong performance in Collection Technology Deposit Improved performance and outlook in Industrial Processing Technology California negatively
HIGHLIGHTS INTERIM REPORT Q XXL ASA. YTD Growth. Q4 Growth
 INTERIM REPORT Q4 2017 XXL ASA HIGHLIGHTS Total revenues of NOK 2 525 million (NOK 2 151 million), up 17 per cent Like-for-like growth of 7 per cent EBITDA of NOK 332 million (NOK 286 million) Strong cash
EVRY ASA Q PRESENTATION CEO BJÖRN IVROTH CFO HENRIK SCHIBLER
 1 EVRY ASA Q3 2018 PRESENTATION CEO BJÖRN IVROTH CFO HENRIK SCHIBLER Agenda Group highlights Business update Financial highlights Business area performance Concluding remarks Q&A 2 Group highlights Q3
Viking Redningstjeneste Topco AS. Interim financial statements 1Q 2018
 Viking Redningstjeneste Topco AS Interim financial statements 1Q 2018 Quarterly report January - March 2018 Viking Redningstjeneste Topco AS Org no. 998 858 690 First quarter 2018 Quarterly report FIRST
Q Earnings Conference Call Thursday, August 4, We create communities. We are Stantec.
 Q2 2016 Earnings Conference Call Thursday, August 4, 2016 We create communities. We are Stantec. Cautionary Statement Our public communications will contain non-ifrs measures and written or verbal forward-looking
Lerøy Seafood Group SEPTEMBER 2018
 Lerøy Seafood Group SEPTEMBER 2018 1. Lerøy Seafood Group 2. Key market trends supply and demand Our vision To be the leading and most profitable global supplier of sustainable high-quality seafood History
1 st QUARTER 2005 RESULTS
 May 4, 2005 1 st QUARTER 2005 RESULTS 1 st QUARTER FINANCIAL HIGHLIGHTS Consolidated net revenues were USD 38.7 million, an increase of 35% compared to Q1 2004. Operating profit (EBIT) was USD 14.2 million
FOURTH QUARTER Highlights from fourth quarter 2008 include:
 FOURTH QUARTER 2008 Highlights from fourth quarter 2008 include: Revenues of 1076 MNOK (947 MNOK in fourth quarter 2007). Positive currency impact by 18% Operating profit of 136 MNOK (131 MNOK in fourth
Alternative Performance Measures (APM)/ Non-IFRS Financial Measures. Definitions of Alternative Performance Measures/ Non-IFRS Financial Measures
/ Non-IFRS Financial Measures. Definitions of Alternative Performance Measures/ Non-IFRS Financial Measures") Alternative Performance Measures (APM)/ Non-IFRS Financial Measures Our Alternative Performance Measures (APMs) present useful information which supplements the financial statements. These measures are
Alternative Performance Measures (APM)/ Non-IFRS Financial Measures Our Alternative Performance Measures (APMs) present useful information which supplements the financial statements. These measures are
Q U A R T E R L Y R E P O R T 2 N D Q U A R T E R
 Q U A R T E R L Y R E P O R T 2 N D Q U A R T E R 2 0 0 7 1. Grieg Seafood develops as planned Grieg Seafood was listed in June, and has now 869 shareholders after 2 shares issues of MNOK 700 in total.
Sølvtrans Holding ASA Q Oslo, 15 May Roger Halsebakk, CEO Jon Kvalø, CFO
 Sølvtrans Holding ASA Q1 2012 Oslo, 15 May 2012 Roger Halsebakk, CEO Jon Kvalø, CFO 1 Highlights in the quarter 2 Financial review 3 Operational and market review 4 Summary and outlook 5 Appendix Highlights
Alternative Performance Measures (APM) / Non-IFRS Financial Measures. Definitions of Alternative Performance Measures, Non-IFRS Financial Measures
 / Non-IFRS Financial Measures. Definitions of Alternative Performance Measures, Non-IFRS Financial Measures") Alternative Performance Measures (APM) / Non-IFRS Financial Measures Our Alternative Performance Measures (APMs) present useful information which supplements the financial statements. These measures are
Alternative Performance Measures (APM) / Non-IFRS Financial Measures Our Alternative Performance Measures (APMs) present useful information which supplements the financial statements. These measures are
Operating revenue NOK million Operational EBIT NOK million. Harvest volume (HOG) tonnes Q3 09 Q4 09 Q1 10 Q2 10 Q3 10
 tonnes Q3 09 Q4 09 Q1 10 Q2 10 Q3 10") Solid performance in a strong market Strong price achievement and solid results in Norway Return on Capital Employed of 18.9% in the quarter Favourable market balance expected to support a strong market
Solid performance in a strong market Strong price achievement and solid results in Norway Return on Capital Employed of 18.9% in the quarter Favourable market balance expected to support a strong market
Q November 9th. Lerøy Seafood Group ASA. CEO Henning Beltestad CFO Sjur S. Malm
 Q3 2017 November 9th Lerøy Seafood Group ASA CEO Henning Beltestad CFO Sjur S. Malm Agenda Highlights Key financial figures Outlook Q3 2017 EBIT before FV adj. NOK 861 million Harvest volume 46 024 GWT
Q Quarterly Report
 Q3 2009 Quarterly Report Positive net results for 3Q09 24SevenOffice ASA had a positive operating profit before depreciation (EBITDA) of MNOK 1.5 compared to MNOK 0.1 for 2Q09, and a positive net result.
Cembrit Group Q Unaudited interim report
 Cembrit Group Q4 2017 Unaudited interim report 2017 main events COMMENTARY Strong demand across both markets and product categories resulted in revenue growth of 7.9% YoY 2017 EBITDA showed solid underlying
FULL-YEAR RESULTS 2016
 FULL-YEAR RESULTS 2016 INVESTOR PRESENTATION RESULTS FROM JANUARY TO DECEMBER 2016 ZURICH 02 MARCH 2017 Achievements and key figures Operating and financial review Outlook and priorities 2017 Appendix
15,000 12, , , , ,158 13,004 12, , ,664
 15,000 12,000 13,004 10,934 12,940 13,158 10,664 350 307 300 9,000 335 255 254 30 26.34 21.58 22.26 23.22 16 Q2 16 Q3 16 24.33 20 200 6,000 10 100 3,000 0 400 16 Q2 16 Q3 16 Q4 16 17 0 16 Q2 16 Q3 16 Q4
Acta Holding ASA 3rd quarter presentation 2008
 Acta Holding ASA 3rd quarter presentation 28 CEO Simen Mørdre CFO Christian Tunge 29th October 28 Agenda Highlights third quarter 28 Alternative investments Interim financial statements Segment information
Posten Norge. Results as of 3 rd quarter 2015
 Posten Norge Results as of 3 rd quarter 2015 1 3 rd quarter 2015 PART 1: Highlights and development PART 2: Results and Segment Review 2 3 rd quarter 2015 PART 1: Highlights and development 3 Highlights
CEO Terje Mjøs. Oslo, 17 July Q Presentation
 CEO Terje Mjøs Oslo, 17 July 1 Q 1 Presentation Q 1 Highlights Profitable and strong organic growth in Sweden +1% YoY o Flat in Norway, +3% in total EBITA NOK 15 million (+9% YoY*) o Including synergy
KONE Q APRIL 25, 2018 HENRIK EHRNROOTH, PRESIDENT & CEO ILKKA HARA, CFO
 KONE 2018 APRIL 25, 2018 HENRIK EHRNROOTH, PRESIDENT & CEO ILKKA HARA, CFO 2018 Highlights Solid growth in orders received with stabilizing margins Profitability continued to be burdened Good progress
4 TH QUARTER 2018 RESULTS ANNOUNCEMENT. TOMRA SYSTEMS ASA 4 th Quarter Results
 4 TH QUARTER 2018 RESULTS ANNOUNCEMENT TOMRA SYSTEMS ASA 4 th Quarter Results 21.02.2019 HIGHLIGHTS FROM 2018 Revenues Gross margin Operating expenses EBITA Cashflow Revenues of 8,596 MNOK (7,432 MNOK
Finning Reports Q Results
 Q2 2015 EARNINGS RELEASE August 6, 2015 Finning Reports Q2 2015 Results Vancouver, B.C. Finning International Inc. (TSX: FTT) reported second quarter 2015 results today (all monetary amounts are in Canadian
NORWEGIAN AIR SHUTTLE ASA QUARTERLY REPORT THIRD QUARTER 2007
 NORWEGIAN AIR SHUTTLE ASA QUARTERLY REPORT THIRD QUARTER 2007 THIRD QUARTER IN BRIEF The group had earnings before tax (EBT) of MNOK 105.8 (38.5) in the third quarter. The third quarter operating revenue
Fourth quarter of 2010
 Fourth quarter of 2010 Main features of the fourth quarter of 2010 Operating revenue NOK 3,363 million, 2% organic growth EBITA before synergy costs NOK 171 million (NOK 283 million) Revenue growth and