The global leader in aquaculture technology
|
|
|
- Shonda Nash
- 5 years ago
- Views:
Transcription
1 The global leader in aquaculture technology 2Q 2010 presentation 19 August 2010 Morten Nærland, CFO & Acting CEO


2 Agenda Background & highlights 2Q 2010 Financial review Outlook Q & A 2
3 3


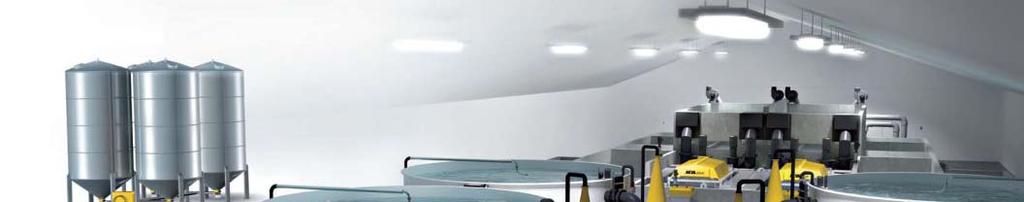
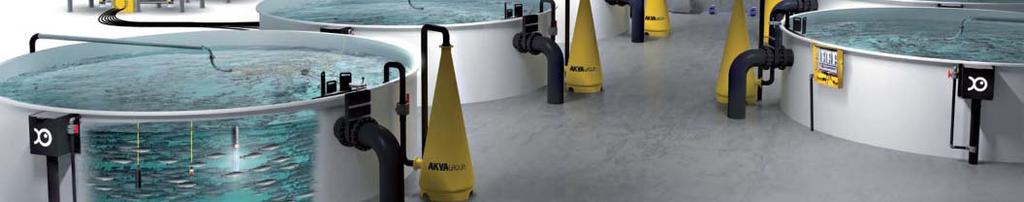
4 AKVA group in brief Cage systems Facts about AKVA group & services The leading supplier of aquaculture technology. Strong market position for all main products The only supplier with global presence. Leading supplier in a global growth industry. Software systems Feed barges Recirculation systems Feed systems Sensors & operational 4 AKVA s main product brands:
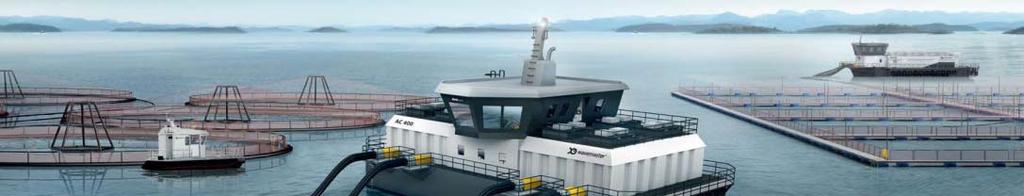
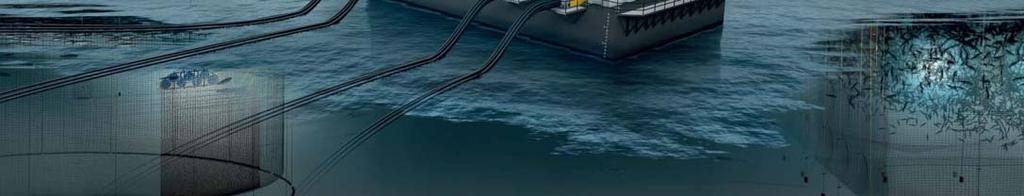
5 One-stop-shop in aquaculture technology Value auechain Software Land Based Farms Cage Based Farms 5
6 2Q highlights Operating revenues in 2Q were MNOK versus MNOK last year. The EBITDA in 2Q was MNOK versus 0.4 MNOK last year. Restructuring charges of 6.3 MNOK Cost overrun in land based projects Order backlog at the end of 2Q2010 was 316 MNOK which is 133 MNOK higher than last year. 6 The order inflow in 2Q was 232 MNOK vs 147 MNOK last year.


7 Events subsequent to Knut Molaug stepped down from the position as CEO Morten Nærland, the CFO, appointed to Acting CEO Smaller group management team Latin America and North America organized into Americas Scotland organized into Export PRU Hardware and PRU Recirculation organized under one management 7
8 New Management Structure Morten Nærland Acting CEO Morten Nærland CFO Odd Martin Solem Director SW Per A. Hjetland COO Stig M Bø Nordic Sales Trond Severinsen CMO / Export Andrew Campbell Director Americas Per A Hjetland HW Bryne Jens Hernes Helgeland Plast Jørgen Scheel RAS DK 8
9 Agenda Background & highlights 2Q 2010 Financial review Outlook Q & A 9
10 2Q Financials P&L P&L (MNOK) 2Q 2Q YTD YTD Total OPERATING REVENUES 176,3 164,3 334,3 316,7 599,3 Operating costs ex depreciations 188,2 163,9 345,7 319,6 610,9 EBITDA -11,9 0,4-11,4-2,9-11,5 Depreciation 75 7,5 78 7,8 15,0 15,6 30,9 EBIT -19,5-7,4-26,4-18,5-42,4 Net interest expense -2,9-2,4-5,2-4,3-8,8 Other financial items 1,4-0,6 1,6-0,2-0,8 Net financial items -1,4-3,0-3,6-4,4-9,6 EBT -20,9-10,4-30,0-23,0-52,0 Taxes -4,6-1,2-8,4-5,0-12,9 NET PROFIT -16,3-9,2-21,6-18,0-39,1 Revenue growth 73 7,3 % 56 5,6 % -30.8% EBITDA margin -6,8 % 0,2 % -3,4 % -0,9 % -1,9 % EPS -0,95-0,53-1,25-1,04-2,27 10


11 2Q Financials P&L comments Operating revenue in 2Q10 was MNOK. The quarterly revenue was slightly up compared to 2Q Continued low revenues due to slow investment programs with the customers The EBITDA result was MNOK Low volume compared to cost base Cost overrun on land based projects Restructuring charges of 6.3 MNOK 11


 12 SW 16 % HW= Hardware")

12 Market segments Geographic segments (YTD) UK and Ireland 11 % Other 16 % Latin America 9 % North America 6 % Norway 58 % Norway is the dominating segment e The UK and other markets are showing a positive development Chilean market has reduced d it s importance compared to the past. Product Group Segments (YTD) 12 SW 16 % HW= Hardware deliveries and 8% services REC HW 76 % Cages, barges, Feed Systems and other operational systems SW = Software and software systems REC = Recirculation systems

13 Market segments MNOK AKVA group revenues within other species CAGR ~50% * * Sales and order backlog for delivery in 2010 per 2Q. The positive development within other species than salmon continue. Major contract for delivery of 3 complete cage farms to Cromaris in Croatia was signed signed in 2Q (54 MNOK). 13


14 Balance sheet BALANCE SHEET (MNOK) Intangible fixed assets 242,5 256,2 243,9 Fixed assets 38,3 47,8 39,1 Long-term financial assets 1,0 1,1 1,1 FIXED ASSETS 281,8 305,1 284,1 Stock 138,3 121,9 116,2 Trade receivables 162,1 149,8 125,4 Other receivables 44,6 25,1 27,5 Cash and cash equivalents 54,4 51,2 58,2 CURRENT ASSETS 399,4 348,0 327,33 TOTAL ASSETS 681,2 653,1 611,3 Paid in capital 267,1 267,1 267,1 Retained equity -33,2 26,5-10,4 TOTAL EQUITY 233,9 293,6 256,6 Other long term debt 4,1 10,1 5,6 Long-term interest bearing debt 148,3 107,6 150,7 LONG-TERM DEBT 152,4 117,7 156,2 Short-term interest bearing debt 62,5 86,3 49,4 Other current liabilities 232,4 155,5 149,1 SHORT-TERM DEBT 294,9 241,8 198,5 TOTAL EQUITY AND DEBT 681,2 653,1 611,3 14 Equity ratio 34,3 % 45,0 % 42,0 % Net interest bearing debt 156,3 142,7 141,9 Net working capital 112,6 141,3 120,0

: A waiver extending through 4Q 2010 relating to the financial covenants was agreed with the company s main")
15 Balance sheet items Working Capital (MNOK) Working Capital: Seasonal increase in working capital in 2Q The company continue to focus on maintaining a low working capital Q08 3Q08 4Q08 1Q09 2Q09 3Q09 4Q09 1Q10 2Q NIBD (MNOK) Net interest bearing debt (NIBD): A waiver extending through 4Q 2010 relating to the financial covenants was agreed with the company s main bank in 2Q Q08 3Q08 4Q08 1Q09 2Q09 3Q09 4Q09 1Q10 2Q10
 Cash Position: Available cash 62 MNOK 75 50 63 57 48 40 51 52 56 44 54 25 16 0 2Q08 3Q08 4Q08 1Q09 2Q09 3Q09 4Q09 1Q10")
16 Financial position 55 % 50 % 45 % 40 % 35 % 30 % 25 % Equity (%) 47 % 46 % 46 % 45 % 45 % 46 % 42 % 39 % 34 % 2Q08 3Q08 4Q08 1Q09 2Q09 3Q09 4Q09 1Q10 2Q10 Equity: Equity position affected by the negative results Cash balance (MNOK) Cash Position: Available cash 62 MNOK Q08 3Q08 4Q08 1Q09 2Q09 3Q09 4Q09 1Q10 2Q10
 2Q 2Q YTD YTD Total Net cash flow from operational activities -16,4")


17 Cash flow statement CASH FLOW STATEMENT (NOK 1 000) 2Q 2Q YTD YTD Total Net cash flow from operational activities -16,4 26,0-4,7 19,7 32,7 Net cash flow from investment activities -4,7-10,9-8,9-15,9-24,1 Net cash flow from financial activities 32,0-3,7 9,8-0,4 1,7 Net cash flow 10,9 11,5-3, ,4 10,3 Cash and cash equivalents at the 43,6 39,8 58,2 47,9 47,9 beginning of the period Cash and cash equivalents at the end of the period 54,4 51,2 54,4 51,2 58,2 Investments in 1H amounted to 9.2 MNOK whereof 3.8 MNOK is capitalized R&D expenses in accordance with IFRS. 17
18 Agenda Background & highlights 2Q 2010 Financial review Outlook Q & A 18
 MNOK")


 19 MNOK")


19 Order backlog and inflow Od Order backlog (MNOK) MNOK Q08 3Q08 4Q08 1Q09 2Q09 3Q09 4Q09 1Q10 2Q10 The order backlog was 316 MNOK at the end of 2Q. Up 73% compared to same period last year. Order inflow (MNOK) 19 MNOK Q08 3Q08 4Q08 1Q09 2Q09 3Q09 4Q09 1Q10 2Q10 Order inflow was 232 MNOK in2q. YTD order inflow 445 MNOK vs 236 MNOK 1H last year. The increase related to Norway, Chile and other markets


20 Outlook Market development The market fundamentals for AKVA s main customers remain relative unchanged from 1Q. Customers are experience healthy earnings. The balance between supply and demand for Atlantic salmon expected to be favourable through 2010 and This indicating healthy prices. Order inflow in 1H higher than last year driven by Norway, Chile and other markets The global financial has added uncertainty also to these markets, but there are signs that the uncertainty is now easing of. 20 The market for recirculation systems in Norway is developing well and is a product area expected to show a positive development over the next year.
21 Agenda Background & highlights 2Q 2010 Financial review Outlook Q & A 21
22 AKVA group global presence Norway Canada AKVA office AKVA representation Canada Iceland Scotland Denmark Turkey China Thailand Vietnam Malaysia Chile 22 All major industry players as customers

 2004: Fishtalk fist aquaculture integrated software system 2005: Wavemaster introduction of 40 x40 steel cages")
23 23 Prod duct Innova ations: Busines ss lopment and M&A devel AKVA group brief historic summary 1974: World s fist plastic cages (Polarcirkel) today more than units delivered 1978: First Seafood industry software solution 1980: World s first automatic feed systems 1984: Maritech: first seafood industry PC based ERP software system 1985: First Wavemaster steel cages 1992: World s first software system for fish farm planning 1995: First fish pellet sensing system 1997: First Steel barges 2000: Polarcirkel large cage designs introduced 2001: Introduction of AkvaMaster feed barges 2002: Akvasmart integrated control system (CCS) 2004: Fishtalk fist aquaculture integrated software system 2005: Wavemaster introduction of 40 x40 steel cages 2006: Akvasmart integrated sensor system 2007: 10 new products launched at Aquanor show 2008: UNI recirculation all in all out concept : First AKVA deliveries 1982: AKVA incorporated as company 1990s: International ti expansion through h distributors ib t and agents 1995: First International investment (Canada) 1998: Open subsidiaries in Chile and Scotland 2001: Aquasmart International AS (No) 2001: Superior Systems AS (No) 2002: Vicass (Ca) 2003: Feeding Systems AS (No,Ch) 2004: Cameratech AS (No) 2006: Akva kompetanse AS (No) 2006: Wavemaster Group (UK, Ca, Ch) 2006: Helgeland Plast (No, Ch) 2006: IPO company listed at Oslo Stock Exchange 2007: Maritech International AS (No, Is, US, Ca, Ch) 2007: UNI Aqua AS (Dk) 2008: Danaq Amba (Dk) 2008: Open office in South East Asia (Thai) 2008: Idema Aqua AS (No, UK, Ch)
The global leader in aquaculture technology
 The global leader in aquaculture technology 1Q 2010 presentation 29 April 2010 Knut Molaug, CEO Morten Nærland, CFO Agenda Background & highlights 1Q 2010 Financial review Outlook Q & A 2 3 AKVA group
3Q 2009 presentation 11 November 2009
 The global leader in aquaculture technology 3Q 2009 presentation 11 November 2009 Knut Molaug, CEO Rolf Andersen, CFO Agenda Background & highlights 3Q 2009 Financial review Outlook Q & A 2 1 3 AKVA group
Q Presentation Oslo, August 09, 2011
 Q2 2011 Presentation Oslo, August 09, 2011 Trond Williksen, CEO Morten Nærland, CFO 1 Agenda Highlights Q2 2011 Financials Q2 2011 Way forward Q & A 2 1 Highlights 3 Recovery continues Growth in operating
Q Presentation Oslo, May 10 th, 2012 Trond Williksen, CEO Eirik Børve Monsen, CFO
 Q1 2012 Presentation Oslo, May 10 th, 2012 Trond Williksen, CEO Eirik Børve Monsen, CFO 1 Agenda Highlights Q1 2012 Trond Williksen, CEO Financial performance Q1 2012 Eirik Børve Monsen, CFO Outlooks Trond
Q Presentation Oslo, October 28, Trond Williksen, CEO
 Q3 2011 Presentation Oslo, October 28, 2011 Trond Williksen, CEO 1 Agenda Highlights Q3 2011 Financials Q3 2011 Outlooks Q & A 2 Highlights 3 Increased profitability Operating revenues in Q3 was 226.7
Oslo, February 27 th, 2012 Trond Williksen, CEO Eirik Børve Monsen, CFO
 Q4 2012 Presentation ti Oslo, February 27 th, 2012 Trond Williksen, CEO Eirik Børve Monsen, CFO 1 Agenda Highlights Q4 2012 Trond Williksen, CEO Financial performance Q4 20122 Eirik Børve Monsen, CFO Statement
3Q 2007 presentation 7 November 2007
 The global leader in aquaculture technology 3Q 2007 presentation 7 November 2007 Knut Molaug, CEO Rolf Andersen, CFO Pro-forma Please note that unless otherwise stated all comments in this presentation
4Q 2006 presentation 27. February 2007
 The global leader in aquaculture technology presentation 27. February 2007 Steven A. Morrell, Chairman of the Board Knut Molaug, CEO Rolf Andersen, CFO Agenda Background & highlights Financial review Status
Your Aquaculture Technology and Service Partner. Q Presentation Oslo - August 20 th, 2015 Trond Williksen, CEO Eirik Børve Monsen, CFO
 Q2 2015 Presentation Oslo - August 20 th, 2015 Trond Williksen, CEO Eirik Børve Monsen, CFO Agenda 1 Highlights 2 Financial performance 3 Outlook 4 Q&A Highlights Q2 2015 - by CEO Trond Williksen 3 Best
Quarterly report Nr Third quarter report 2010
 Quarterly report Nr 3 2010 Third quarter report 2010 Highlights Operating revenues in 3Q were 212.3 MNOK versus 139.8 MNOK last year. Year to date operating revenues were 546.6 MNOK versus 456.5 MNOK last
Your Aquaculture Technology and Service Partner. Q Presentation Oslo - May 8 th, 2015 Trond Williksen, CEO Eirik Børve Monsen, CFO
 Q1 2015 Presentation Oslo - May 8 th, 2015 Trond Williksen, CEO Eirik Børve Monsen, CFO Agenda 1 Highlights 2 Financial performance 3 Outlook 4 Q&A Highlights Q1 2015 - by CEO Trond Williksen 3 On track
Third quarter report Quarterly report Nr
 Third quarter report 2011 Quarterly report Nr 3 2011 Highlights Operating revenues in Q3 was 226.7 MNOK compared to 212.3 in Q3 last year an increase of 6.8% EBITDA in Q3 was 22.0 MNOK compared to 10.2
Best Q1 ever all time high order backlog
 Best Q1 ever all time high order backlog First quarter 2014 HIGHLIGHTS Best Q1 ever Revenue of 310 MNOK (222 MNOK) EBITDA of 32 MNOK (10 MNOK) YoY increase in revenues of 40% and a YoY increase in EBITDA
Your Aquaculture Technology and Service Partner. Q Presentation Oslo - May 11 th, 2016 Trond Williksen, CEO Eirik Børve Monsen, CFO
 Q1 2016 Presentation Oslo - May 11 th, 2016 Trond Williksen, CEO Eirik Børve Monsen, CFO Agenda 1 Highlights 2 Financial performance 3 Outlook 4 Q&A Highlights Q1 2016 - by CEO Trond Williksen 3 MNOK On
Your Aquaculture Technology and Service Partner. Q Presentation Oslo - August 17 th, 2016 Trond Williksen, CEO Eirik Børve Monsen, CFO
 Q2 2016 Presentation Oslo - August 17 th, 2016 Trond Williksen, CEO Eirik Børve Monsen, CFO Agenda 1 Highlights 2 Financial performance 3 Outlook 4 Q&A Highlights Q2 2016 - by CEO Trond Williksen 3 Improved
Contents. 4 Highlights Financial key figures. 8 CEO s report. 9 Corporate management. 11 Board of Directors report. 16 Board of Directors
 Annual Report 2010 AKVA group in brief AKVA group is a global provider of land-based and cage farming aquaculture technology; from single components to sustainable turn-key installations worldwide With
On track with a good start of the year
 On track with a good start of the year First Quarter 2016 HIGHLIGHTS All business segments are performing well best Q1 ever A broad mix of products and services contribute financially becoming a stronger
Improved performance and growth continues
 Improved performance and growth continues Second quarter 2016 HIGHLIGHTS Overall good performance - 10.4% EBITDA margin Land based strengthen P&L and high order backlog becoming a significant part of AKVA
Your Aquaculture Technology and Service Partner. Q Presentation Oslo - February 19 th, 2016 Trond Williksen, CEO Eirik Børve Monsen, CFO
 Q4 2015 Presentation Oslo - February 19 th, 2016 Trond Williksen, CEO Eirik Børve Monsen, CFO Agenda 1 Highlights 2 Financial performance 3 Outlook 4 Q&A Highlights Q4 2015 - by CEO Trond Williksen 3 MNOK
Q Presentation. Oslo November 2 nd 2018 Hallvard Muri, CEO Simon Nyquist Martinsen, CFO
 Q3 218 Presentation Oslo November 2 nd 218 Hallvard Muri, CEO Simon Nyquist Martinsen, CFO Agenda Highlights Financial performance Outlook Q&A Highlights Q3 218 by CEO Hallvard Muri Order Intake development
Good market activity continues
 Good market activity continues First quarter 2017 HIGHLIGHTS Good market activity across all regions High quoting activity in the Land Based segment Strong growth in order intake and revenue (+34% / +30%)
High market activity growth strategy continued
 High market activity growth strategy continued Fourth quarter 2016 HIGHLIGHTS Record high sales and order intake (+60%) Order backlog end of year approximately 1.0 BNOK EBITDA in the quarter hampered by
Your Aquaculture Technology and Service Partner. Company presentation November 2014
 Company presentation November 2014 Important Information About this Company Presentation This Company Presentation has been prepared by AKVA group ASA ("AKVA group" or the "Company") for information purposes
Positive underlying development
 Positive underlying development Fourth quarter 2017 HIGHLIGHTS Growth in revenue (+24%) Continued high market activity across all regions and segments Order intake of 557 MNOK in the quarter, on the same
Significant growth outside Norway
 Significant growth outside Norway Second quarter 2018 HIGHLIGHTS Continued good activity across all regions and segments Growth in revenue (17%), in particular by Americas and EME (Europe and Middle East)
High market activity growth strategy continued
 High market activity growth strategy continued Third quarter 2016 HIGHLIGHTS Overall good financial performance - 10.8% EBITDA margin P&L growth softened by Americas and restructuring of AKVA group Denmark
Q Presentation. Oslo May 16 th 2018 Hallvard Muri, CEO Simon Nyquist Martinsen, CFO
 Q1 218 Presentation Oslo May 16 th 218 Hallvard Muri, CEO Simon Nyquist Martinsen, CFO Agenda Highlights Financial performance Outlook Q&A Highlights Q1 218 by CEO Hallvard Muri Continued growth in order
Your Aquaculture Technology and Service Partner. Company presentation August 2016
 Company presentation August 2016 Important Information About this Company Presentation This Company Presentation has been prepared by AKVA group ASA ("AKVA group" or the "Company") for information purposes
Presentation of Cermaq
 Presentation of Cermaq North Atlantic Seafood Seminar Oslo, 8 th March 2012 Agenda Introduction to Cermaq Key results 2011 Focus on Mainstream Chile Outlook 2012 Photograph: Alf Børjesson 2 This is Cermaq
Third quarter report Quarterly report. Nr
 Third quarter report 2008 Quarterly report Nr 3 2008 Highlights Operating revenue in 3Q was 207 MNOK which is lower than same period last year. The period s EBITDA was 18.1 MNOK Operating revenue year
Marine Harvest. Q Presentation 10 May 2017
 Marine Harvest Q1 2017 Presentation 10 May 2017 1 Forward looking statements This presentation may be deemed to include forward-looking statements, such as statements that relate to Marine Harvest s contracted
Marine Harvest. Q Presentation 22 August 2018
 Marine Harvest Q2 2018 Presentation 22 August 2018 Forward looking statements This presentation may be deemed to include forward-looking statements, such as statements that relate to Marine Harvest s contracted
Marine Harvest. Q Presentation 24 August 2017
 Marine Harvest Q2 2017 Presentation 24 August 2017 1 Forward looking statements This presentation may be deemed to include forward-looking statements, such as statements that relate to Marine Harvest s
Marine Harvest. Q Presentation 1 November 2017
 Marine Harvest 1 Q3 2017 Presentation 1 November 2017 Forward looking statements This presentation may be deemed to include forward-looking statements, such as statements that relate to Marine Harvest
Q May 12th Oslo
 Q1 2016 May 12th Oslo Lerøy Seafood Group ASA CEO Henning Beltestad CFO Sjur S. Malm Agenda Highlights Key financial figures Outlook Q1 2016 EBIT before FV adj. NOK 584.5 million EBIT/kg all inclusive
Marine Harvest. Q Presentation 14 February 2018
 Marine Harvest Q4 2017 Presentation 14 February 2018 1 Forward looking statements This presentation may be deemed to include forward-looking statements, such as statements that relate to Marine Harvest
Marine Harvest Q Presentation
 Marine Harvest Q2 2015 Presentation Forward looking statements This presentation may be deemed to include forward-looking statements, such as statements that relate to Marine Harvest s contracted volumes,
4 TH QUARTER RESULTS Kenneth Ragnvaldsen, CEO February 1, 2013, Oslo
 Q4 4 TH QUARTER RESULTS 2012 Kenneth Ragnvaldsen, CEO February 1, 2013, Oslo AGENDA Financial status Business update Outlook Q&A HIGHLIGHTS Profitability continues to improve High activity. Strong order
Sølvtrans Holding ASA Q Oslo, 15 May Roger Halsebakk, CEO Jon Kvalø, CFO
 Sølvtrans Holding ASA Q1 2012 Oslo, 15 May 2012 Roger Halsebakk, CEO Jon Kvalø, CFO 1 Highlights in the quarter 2 Financial review 3 Operational and market review 4 Summary and outlook 5 Appendix Highlights
Sølvtrans Holding ASA Q Oslo, 7 November Roger Halsebakk, CEO Jon Kvalø, CFO
 Sølvtrans Holding ASA Q3 2012 Oslo, 7 November 2012 Roger Halsebakk, CEO Jon Kvalø, CFO 1 Highlights in the quarter 2 Financial review 3 Operational and market review 4 Summary and outlook 5 Appendix Highlights
Q August 24th. Lerøy Seafood Group ASA. CEO Henning Beltestad CFO Sjur S. Malm
 Q2 2017 August 24th Lerøy Seafood Group ASA CEO Henning Beltestad CFO Sjur S. Malm Agenda Highlights Key financial figures Outlook Q2 2017 EBIT before FV adj. NOK 801 million Harvest volume 26 156 GWT
Q presentation. 5 February 2015
 Q4 2014 presentation 5 February 2015 Agenda Highlights Financial overview Market outlook Q4 Highlights Strong finish to a record year Revenue of NOK 7 549 million, up 10.3% EBITDA* of NOK 396 million,
Q November 9th. Lerøy Seafood Group ASA. CEO Henning Beltestad CFO Sjur S. Malm
 Q3 2017 November 9th Lerøy Seafood Group ASA CEO Henning Beltestad CFO Sjur S. Malm Agenda Highlights Key financial figures Outlook Q3 2017 EBIT before FV adj. NOK 861 million Harvest volume 46 024 GWT
Q BAKKAFROST GROUP Oslo 20 February 2018
 BAKKAFROST GROUP Oslo 20 February 2018 DISCLAIMER This presentation includes statements regarding future results, which are subject to risks and uncertainties. Consequently, actual results may differ significantly
Sølvtrans Holding ASA Q Oslo, 14 August Roger Halsebakk, CEO Jon Kvalø, CFO
 Sølvtrans Holding ASA Q2 2012 Oslo, 14 August 2012 Roger Halsebakk, CEO Jon Kvalø, CFO 1 Highlights in the quarter 2 Financial review 3 Operational and market review 5 Summary and outlook 6 Appendix Highlights
Lerøy Seafood Group. Preliminary financial figures February 25th Helge Singelstad. Alf-Helge Aarskog. Ivan Vindheim.
 Lerøy Seafood Group Preliminary financial figures 2009 February 25th 2010 Helge Singelstad Chairman Alf-Helge Aarskog CEO Ivan Vindheim CFO 1 Agenda 1. 1 Considerations 2. 2 Key financial figures Q4 2009
Lerøy Seafood Group. Quarterly report Second quarter August 19th Helge Singelstad. Ivan Vindheim CEO CFO
 Lerøy Seafood Group Quarterly report Second quarter 2009 August 19th 2009 Helge Singelstad CEO Ivan Vindheim CFO 1 Agenda 1. 1 Considerations 2. 2 Key financial figures Q2 2009 3. 3 Lerøy at a glance 4.
From Copeinca to Mitsubishi and beyond. Jon Hindar CEO London, 31 October 2014
 From Copeinca to Mitsubishi and beyond Jon Hindar CEO London, 31 October 2014 A roller coaster with a happy ending for Cermaq and for the industry Page 2 A roller coaster with a happy ending for Cermaq
PRESENTATION Q Oslo, 15 August 2013 John Binde, CEO Ola Loe, CFO
 PRESENTATION Q2 2013 Oslo, 15 August 2013 John Binde, CEO Ola Loe, CFO AGENDA: Highlights for the period Segment information Group financials Outlook 2 Highlights in Q2 2013: Best quarterly operational
PRESENTATION Q Oslo, 26 February 2014 John Binde, CEO Ola Loe, CFO
 PRESENTATION Q4 2013 Oslo, 26 February 2014 John Binde, CEO Ola Loe, CFO AGENDA: Highlights for the period Segment information Group financials Outlook 2 Highlights in Q4 2013: The best quarterly and yearly
Q BAKKAFROST GROUP Oslo 21 August 2018
 BAKKAFROST GROUP Oslo 21 August DISCLAIMER This presentation includes statements regarding future results, which are subject to risks and uncertainties. Consequently, actual results may differ significantly
Interim Report. January September 2013
 Interim Report January September 2013 Disclaimer Albain Bidco Norway AS is providing the following financial results for the third quarter of 2013 to holders of its EUR225,000,000 6.750% Senior Secured
PRESENTATION Q Oslo, 19 February 2013 John Binde, CEO Ola Loe, CFO
 PRESENTATION Q4 2012 Oslo, 19 February 2013 John Binde, CEO Ola Loe, CFO AGENDA: Highlights for the period Segment information Group financials Outlook 2 Highlights in Q4 2012: Significant improvement
Marine Harvest Q Presentation
 Marine Harvest Q1 2015 Presentation Forward looking statements This presentation may be deemed to include forward-looking statements, such as statements that relate to Marine Harvest s contracted volumes,
Q BAKKAFROST GROUP Oslo 19 February 2019
 BAKKAFROST GROUP Oslo 19 February 2019 DISCLAIMER This presentation includes statements regarding future results, which are subject to risks and uncertainties. Consequently, actual results may differ significantly
Q1 results Peter Nilsson, CEO Cathrin Nylander, CFO
 Q1 results 2018 Peter Nilsson, CEO Cathrin Nylander, CFO 20 April, 2018 Financial highlights Q1: Solid growth and improved profitability Strong revenue growth Underlying growth 8.9% EBIT margin 6.0% (5.3%)
ELKEM THIRD QUARTER RESULTS October 2018
 ELKEM THIRD QUARTER RESULTS 2018 24 October 2018 Agenda Helge Aasen, CEO - Highlights - Business update - Outlook Morten Viga, CFO - Financial performance and market update 2 A strong quarter despite weaker
1 ST QUARTER RESULTS Kenneth Ragnvaldsen, CEO April 19, 2013, Oslo
 Q1 1 ST QUARTER RESULTS 2013 Kenneth Ragnvaldsen, CEO April 19, 2013, Oslo AGENDA Financial status Business update Outlook Q&A HIGHLIGHTS Profitability continues to improve. Positive development in Services.
First half year and Q2 results Peter Nilsson, CEO Cathrin Nylander, CFO
 First half year and Q2 results 2018 Peter Nilsson, CEO Cathrin Nylander, CFO 12 July, 2018 Financial highlights Q2: Continued growth and solid profitability Continued revenue growth Highest Q2 revenue
First three quarters and Q3 results 2018
 First three quarters and Q3 results 2018 Peter Nilsson, CEO Cathrin Nylander, CFO 19 October, 2018 Financial highlights Q3: Strong order growth, including oil and gas Orders Received 25% growth MNOK 669
RS Platou Markets. Seafood conference. 10th June 2010
 RS Platou Markets Seafood conference 10th June 2010 Agenda Introduction to Cermaq Highlights Q1 2010 and outlook full year Chile Recovery 2 Overview of Cermaq One of the global leaders in the aquaculture
Increasing uncertainty and reduced profitability within core repair business
 Interim Report 1 January - 30 June COMPANY ANNOUNCEMENT NO. 03/ 30 August Increasing uncertainty and reduced profitability within core repair business Mobylife has in Q2 experienced a continued negative
3Q 2018 Fornebu, October 24, 2018 Luis Araujo and Svein Stoknes
 3Q 2018 Fornebu, October 24, 2018 Luis Araujo and Svein Stoknes Agenda 3Q 2018 Answers Questions Introduction Luis Araujo Chief Executive Officer Financials Svein Stoknes Chief Financial Officer Q&A Session
Aker Seafoods Second quarter 2010 Profits improved in high season
 Aker Seafoods Second quarter 21 Profits improved in high season CEO Liv Monica B Stubholt CFO Gunnar Aasbø-Skinderhaug Welcome Agenda Topic Speaker Operational Update Liv Monica Stubholt, CEO Group Harvesting
Interim Report Q2-18
 Interim Report Q2-18 HIGHLIGHTS Operational EBIT of NOK 181 million o Operational EBIT per kg of NOK 24.73 in Region North o Operational EBIT per kg of NOK 23.49 in Region South o Non-recurring item of
Chile, que pasa? -an update of the situation for salmon farming in Chile, - issues and potential solutions
 Chile, que pasa? -an update of the situation for salmon farming in Chile, - issues and potential solutions Intrafish / DNB investor conference London, 4 November, 2015 Jon Hindar CEO Cermaq Group The starting
Results of the first quarter of 2014 May 6, 2014
 Results of the first quarter of 2014 May 6, 2014 Low order-related sales generation in several business areas Groupʼs sales (MEUR) Sales by business area Q1 2014 vs. Q1 2013 thereof Schuler: 109 thereof
Grieg Seafood ASA. griegseafood.com. Andreas Kvame CEO. Atle Harald Sandtorv CFO. 8 November 2017
 Grieg Seafood ASA Andreas Kvame CEO Atle Harald Sandtorv CFO 8 November 2017 1 Agenda Highlights This is Grieg Seafood Business Units (Regions) Financials Outlook 2 Highlights Q3 2017 Improved results
PRESENTATION Q Oslo, 14 November 2012 John Binde, CEO Ola Loe, CFO
 PRESENTATION Q3 2012 Oslo, 14 November 2012 John Binde, CEO Ola Loe, CFO AGENDA: Highlights for the period Segment information Group financials Outlook 2 Highlights in Q3 2012: Strong consumption growth
 - - - - - - - 20 000 15 000 10 000 5 000 0 2017 2014 2013 2012 2011 2010 2009 2008 2007 2006 2005 2004 2003 2002 2001 2000 1999 1995 1 400 30 1 200 25 1 000 800 600 400 777 20 15 10 16,5 200 5 0 0 Q4/17
Lerøy Seafood Group SEPTEMBER 2018
 Lerøy Seafood Group SEPTEMBER 2018 1. Lerøy Seafood Group 2. Key market trends supply and demand Our vision To be the leading and most profitable global supplier of sustainable high-quality seafood History
Marine Harvest Q Presentation
 Marine Harvest Q1 2014 Presentation Forward looking statements This presentation may be deemed to include forward-looking statements, such as statements that relate to Marine Harvest s contracted volumes,
Operating revenue NOK million Operational EBIT NOK million. Harvest volume (HOG) tonnes Q3 09 Q4 09 Q1 10 Q2 10 Q3 10
 tonnes Q3 09 Q4 09 Q1 10 Q2 10 Q3 10") Solid performance in a strong market Strong price achievement and solid results in Norway Return on Capital Employed of 18.9% in the quarter Favourable market balance expected to support a strong market
Solid performance in a strong market Strong price achievement and solid results in Norway Return on Capital Employed of 18.9% in the quarter Favourable market balance expected to support a strong market
PSI Group ASA. 1 st Quarter 2013 Presentation, April 26 th :15am. Jørgen Waaler, CEO
 PSI Group ASA 1 st Quarter 2013 Presentation, April 26 th 2013 8:15am Jørgen Waaler, CEO Business Vision The leading global provider of closed and secure cash handling solutions where ever money moves
Marine Harvest Q Presentation
 Marine Harvest Q2 2014 Presentation Forward looking statements This presentation may be deemed to include forward-looking statements, such as statements that relate to Marine Harvest s contracted volumes,
Q U A R T E R L Y R E P O R T 2 N D Q U A R T E R
 Q U A R T E R L Y R E P O R T 2 N D Q U A R T E R 2 0 0 7 1. Grieg Seafood develops as planned Grieg Seafood was listed in June, and has now 869 shareholders after 2 shares issues of MNOK 700 in total.
Lerøy Seafood Group. Quarterly report First quarter May 12th Helge Singelstad. Henning Beltestad. Ivan Vindheim.
 Lerøy Seafood Group Quarterly report First quarter 2010 May 12th 2010 Helge Singelstad Chairman Henning Beltestad CEO Ivan Vindheim CFO 1 Agenda 1. 1 Considerations 2. 2 Key financial figures Q1 2010 3.
Q MAY 8TH 2018
 Q1 2018 MAY 8TH 2018 1. Highlights 2. Key Financial Figures 3. Outlook Highlights Klikke for å legge til annet bilde Q1 2018 - EBIT beforefv adj. NOK 960 million - Harvest volume 37576 GWT - EBIT/kg all
INVESTOR PRESENTATION Henry Demone, CEO; Paul Jewer, CFO Heather Keeler-Hurshman, Investor Relations. November 2014
 INVESTOR PRESENTATION Henry Demone, CEO; Paul Jewer, CFO Heather Keeler-Hurshman, Investor Relations November 2014 Disclaimer Certain statements made in this presentation are forward-looking and are subject
NORWAY ROYA L S A L M ON PRESENTATION Q Oslo, 7 November 2017 Charles Høstlund, CEO Ola Loe, CFO 1
 PRESENTATION Q3 2017 Oslo, 7 November 2017 Charles Høstlund, CEO Ola Loe, CFO 1 AGENDA: Highlights for the period Segment information Group financials Markets Outlook 2 Highlights in Q3 2017 Operational
EVRY ASA Q PRESENTATION CEO BJÖRN IVROTH CFO HENRIK SCHIBLER
 1 EVRY ASA Q3 2018 PRESENTATION CEO BJÖRN IVROTH CFO HENRIK SCHIBLER Agenda Group highlights Business update Financial highlights Business area performance Concluding remarks Q&A 2 Group highlights Q3
Charoen Pokphand Foods Plc.
 Charoen Pokphand Foods Plc. DR Kurobuta Premium Pork W RLD 9M12: Results Briefing November 13, 2012 Content CPF in Brief 9M12 Results September 30, 2012 Financial Status Appendix A: Highlights: Q312 Results
Q NOVEMBER 8TH 2018
 Q3 2018 NOVEMBER 8TH 2018 1. Highlights 2. Key Financial Figures 3. Outlook Highlights Klikke for å legge til annet bilde Q3 2018 - EBIT before FV adj. NOK 660 million - Harvest volume 37 227 GWT - EBIT/kg
Austevoll Seafood ASA Q2 2009
 Q2 2009 Arne MøgsterM CEO Britt Kathrine Drivenes CFO Disclaimer This Presentation has been produced by (the Company or Austevoll ) solely for use at the presentation to the market held in connection with
Blom ASA. 1 st Quarter 2012 Results. Presentation by CEO Dirk Blaauw. May 31 st 2012 Thon Hotel Vika Atrium, Oslo
 Blom ASA 1 st Quarter 2012 Results Presentation by CEO Dirk Blaauw May 31 st 2012 Thon Hotel Vika Atrium, Oslo Disclaimer Forward Looking Statements This presentation contains forward-looking statements
HAVYARD GROUP ASA Presentation Q Geir Johan Bakke, CEO
 HAVYARD GROUP ASA Presentation Q1 2016-24.05.16 Geir Johan Bakke, CEO Agenda Headlines/ milestones Q1 Outlook Main figures Detailed figures HES/ QA Questions Headlines/Milestones Q1 EBIT of NOK 18.7million
Interim Jan June/ 2005 results briefing
 Interim Jan June/ 2005 results briefing Helsinki, 4 August 2005 Market and business review Financial results Outlook Jan Lång, President and CEO Jyri Luomakoski, CFO and Deputy CEO Jan Lång Questions Interim
Cermaq ASA Presentation for Pareto Securities Oslo, 14 th June 2012
 Cermaq ASA Presentation for Pareto Securities Oslo, 14 th June 2012 1 2020 2015 2010 2005 2000 1995 1990 1985 1980 1975 1970 1965 1960 1955 1950 Aquaculture: a sustainable growth industry Our growing population
Cembrit Group Q Unaudited interim report
 Cembrit Group Q4 2017 Unaudited interim report 2017 main events COMMENTARY Strong demand across both markets and product categories resulted in revenue growth of 7.9% YoY 2017 EBITDA showed solid underlying
SalMar ASA. Presentation Q CEO Leif Inge Nordhammer CFO Trond Tuvstein
 SalMar ASA Presentation Q1 2015 CEO Leif Inge Nordhammer CFO Trond Tuvstein Agenda Highlights Financial update Operational update Outlook First quarter 2015 highlights Improved operations Challenging biological
Aker Seafoods Second quarter 2009 Sales of fresh products up, but prices down
 Aker Seafoods Second quarter Sales of fresh products up, but prices down CEO Yngve Myhre CFO Gunnar Aasbø Interim presentation second quarter 1 Welcome Agenda Topic Operational Update Group Harvesting
ELKEM FIRST QUARTER RESULTS May 2018
 ELKEM FIRST QUARTER RESULTS 2018 8 May 2018 Agenda Helge Aasen, CEO - Highlights - Strategic update - Outlook Morten Viga, CFO - Financial performance and market update 2 Highlights 1Q 2018 Elkem successfully
Growth continues. First quarter results May Peter A. Ruzicka, President & CEO
 1 Growth continues First quarter results 2017 9 May 2017 Peter A. Ruzicka, President & CEO Highlights Q1-17: Continued progress from working as One Orkla Branded Consumer Goods continues to grow Associates
4Q 2018 Fornebu, February 8, 2019 Luis Araujo and Svein Stoknes
 4Q 2018 Fornebu, February 8, 2019 Luis Araujo and Svein Stoknes Agenda 4Q 2018 Answers Questions Introduction Luis Araujo Chief Executive Officer Financials Svein Stoknes Chief Financial Officer Q&A Session
Chilean volume reduction Impact on global markets. North Atlantic Seafood Forum Steven Rafferty CFO Cermaq ASA 5 March 2009
 Chilean volume reduction Impact on global markets North Atlantic Seafood Forum Steven Rafferty CFO Cermaq ASA 5 March 2009 Context Chilean Atlantic salmon supply will drop by 50% + in 2009 Further drop
SalMar ASA. Presentation Q CEO Yngve Myhre, CFO Trond Tuvstein Oslo, 14 November w w w. s a l m a r. n o
 Presentation Q3 2013 SalMar ASA CEO Yngve Myhre, CFO Trond Tuvstein Oslo, 14 November 2013 2 Agenda Highlights Financial update Operational update Market and outlook Third quarter highlights Another strong
Q RESULTS BRUSSELS, 23 JULY 2015 WOLFGANG M. NEUMANN, PRESIDENT & CEO KNUT KLEIVEN, DEPUTY PRESIDENT & CFO
 Q2 2015 RESULTS BRUSSELS, 23 JULY 2015 WOLFGANG M. NEUMANN, PRESIDENT & CEO KNUT KLEIVEN, DEPUTY PRESIDENT & CFO Park Inn by Radisson Istanbul Ataturk Airport 1 I Q2-2015 Results Strengthening our position
Full year and Q4 results 2018
 Full year and Q4 results 2018 Cathrin Nylander, Acting CEO and CFO 14 February, 2019 Financial highlights Q4: Strong revenue growth Strong orders received MNOK 918 (940) EBIT margin 5.7% (6.5%) Excluding
Presentation of Annual Report Klaus Holse, CEO, SimCorp A/S Thomas Johansen, CFO, SimCorp A/S
 Presentation of Annual Report 2014 Klaus Holse, CEO, SimCorp A/S Thomas Johansen, CFO, SimCorp A/S Disclaimer This presentation contains certain forward-looking statements and expectations in respect of
Highlights for the quarter Q2 / EBIT NOK 60 million pre biomass write-down
 Half year report Highlights for the quarter EBIT NOK 60 million pre biomass write-down EBIT pre fair value and biomass write-down (NOK million) 318 348 300 101 60 Mainstream results negatively impacted