Q Presentation Oslo, May 10 th, 2012 Trond Williksen, CEO Eirik Børve Monsen, CFO
|
|
|
- Jason McCarthy
- 5 years ago
- Views:
Transcription


1 Q Presentation Oslo, May 10 th, 2012 Trond Williksen, CEO Eirik Børve Monsen, CFO 1

2 Agenda Highlights Q Trond Williksen, CEO Financial performance Q Eirik Børve Monsen, CFO Outlooks Trond Williksen, CEO Q & A 2

3 Highlights Q

4 Gaining momentum Increased activity through the quarter Slow pace into the year but activity increased throughout the quarter Total revenues in Q1 of MNOK including sale of Maritech Norway Operational revenues in Q of MNOK vs MNOK in Q Total earnings higher due to gain from sale of Maritech Norway Total EBIT Q of 31.1 MNOK, including gain from Maritech Norway transaction of 29 MNOK Operational EBITDA of 10.7 MNOK vs 22.8 MNOK in Q Operational EBIT of 2.1 MNOK vs 15.0 MNOK in Q MNOK cost allowance made on projects in RAS area 4

5 Gaining momentum, continued Nordic and Chile main drivers of group revenues Growth in revenues in Chile continues Nordic reduced revenues compared to Q Scotland and Canada slow first months due to lower activity in these markets Exports pose an opportunity good performance in Q1 Software with good momentum Divestment of Maritech Norway Fishtalk and Maritech Iceland positive development Strengthening balance sheet Equity strengthened and Net interest bearing debt significantly reduced Increase in sales and order backlog Order inflow of 235 MNOK in Q1 vs 185 MNOK in Q Order backlog 275 MNOK vs 265 MNOK in end Q


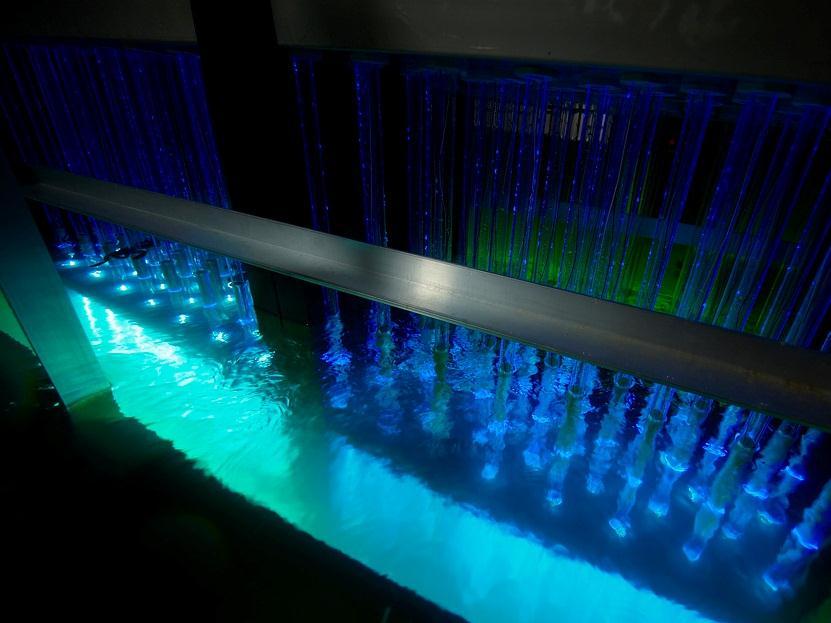
6 AKVA group uniquely positioned for future growth Cage based farming Technology AKVA group in brief The most recognized brand in aquaculture technology Leading technology solutions and service partner to global aquaculture industry Global presence - subsidiaries in 8 countries 2011 Revenue of 894 MNOK and 2011 EBITDA of 62 MNOK Land based farming Technology 700 employees Site infrastructure Feed systems Sensors & operational Software systems & services
7 Focused operational structure Technologies Nordic Americas Exports Hardware (HW) Akvasmart Feeding systems Akvasmart Lights Akvasmart Cameras & Sensors Akvasmart Net cleaners Polarcirkel Cages Polarcircel boats Technology sales Production and projects Service and aftersale Technology sales Production and projects Service and aftersale Technology sales Projects Service and aftersale Wavemaster Feed Barges Wawemaster Steel Cages Software (SW) Fishtalk Nordic countires North and South America, New Zealand Australia in all other regions, including UK, Mediteranian, Russia Asia Wisefish Recirculation (RAS) Landbased recirkulation technology 7

8 Global presence divided in to three regions


9 Market segments - Revenue Product by segments Q Geographic segments by region Q HW still dominant segment SW excluding gain from sale of Maritech Norway HW= Hardware deliveries and services Cages, barges, Feed Systems and other operational systems SW = Software and software systems RAS = Recirculation systems New focus on regions Operational revenue, where gain after the sale of the Maritech business is excluded from Nordic 9

10 Financial performance Q


11 Financial highlights MNOK Quarterly revenues Increased activity through out Q Q09 3Q09 1Q10 3Q10 1Q11 3Q11 1Q12 Gain related to the sale of the Norwegian Maritech business gives extraordinary strong margins and cash flow in Q1 MNOK Quarterly EBITDA Focus on strengthening the balance sheet starting to show results Q09 3Q09 1Q10 3Q10 1Q11 3Q11 1Q12 11
 0,79 0,59 0,53 Total revenues in Q1 of 243.")
12 Q1 P&L total P&L (MNOK) 1Q 1Q Total OPERATING REVENUES 243,7 253,4 893,6 Operating costs ex depreciations 204,0 230,5 831,6 EBITDA 39,7 22,8 62,0 Depreciation 8,5 7,8 32,7 EBIT 31,1 15,0 29,3 Revenue growth -3,8 % 37,1 % 23,9 % EBITDA margin 16,3 % 9,0 % 6,9 % EPS (NOK) 0,79 0,59 0,53 Total revenues in Q1 of MNOK including sale of Maritech Norway Operational revenues in Q of MNOK vs. 253,4 MNOK in Q Operational EBITDA of 10.7 MNOK vs 22.8 MNOK in Q Operational EBIT of 2.1 MNOK vs 15.0 MNOK in Q MNOK allowance made on project in RAS area 12

13 Q1 P&L segments - Hardware P&L (MNOK) 1Q 1Q Total HARDWARE Nordic operating revenues 55,0 128,6 342,3 Americas operating revenues 83,8 50,9 255,9 Export operating revenues 38,8 19,5 122,0 OPERATING REVENUES 177,6 199,1 720,3 Operating costs ex depreciations 166,7 180,7 657,7 EBITDA 10,9 18,4 62,5 Depreciation 6,7 5,7 24,3 EBIT 4,2 12,6 38,2 EBITDA % 6,2 % 9,2 % 8,7 % EBIT % 2,4 % 6,4 % 5,3 % Slow pace into 2012 in the Norwegian market due to late order inflow, compared to Activity level increased throughout the quarter sense of normalization in the market High activity level in Chile in 2011 continues throughout Q Slower pace in Canada mainly due to timing of activities Scotland and Turkey slow first months due to lower activity in these markets. Good development in Export outside Scotland and Turkey 13

14 Q1 P&L segments - Software P&L (MNOK) 1Q 1Q Total SOFTWARE Nordic operating revenues 51,3 26,9 98,6 Americas operating revenues 3,6 2,8 12,1 Export operating revenues 0,4 0,5 1,6 OPERATING REVENUES 55,3 30,1 112,4 Operating costs ex depreciations 22,9 25,3 101,1 EBITDA 32,4 4,8 11,3 Depreciation 1,6 1,8 7,1 EBIT 30,8 3,0 4,1 EBITDA % 58,6 % 15,9 % 10,0 % EBIT % 55,7 % 10,1 % 3,7 % Software with good momentum Maritech Norway divested Fishtalk and Maritech Iceland with positive develoment Sale of Maritech Norway resulted in a gain of 29 MNOK in Q1 EBITDA and EBIT margin from operational software activities were 3.4 MNOK (12.9%) and 1.8 MNOK (6.8%) respectively (excluding sale of Maritech Norway) Focus on developing remaining business after the sale of the Maritech Norway operation 14

15 Q1 P&L segments - RAS P&L (MNOK) 1Q 1Q Total RAS Nordic operating revenues 10,2 15,2 42,8 Americas operating revenues 0,7 9,0 18,1 Export operating revenues OPERATING REVENUES 10,8 24,2 60,9 Operating costs ex depreciations 14,5 24,5 72,8 EBITDA -3,6-0,3-11,8 Depreciation 0,3 0,3 1,3 EBIT -3,9-0,6-13,1 EBITDA % -33,3 % -1,4 % -19,4 % EBIT % -35,9 % -2,7 % -21,5 % 3.1 MNOK cost allowance made on project in RAS area. Adjusting for this cost allowance RAS is on its way of becoming profitable. However volumes are too low in Q1 to create a positive margin. With the recent cost reduction measures and tuning, the RAS segment is positioned for future profitable growth. 15
16 Q1 Financials Detailed P&L group P&L (MNOK) 1Q 1Q Total OPERATING REVENUES 243,7 253,4 893,6 Operating costs ex depreciations 204,0 230,5 831,6 EBITDA 39,7 22,8 62,0 Depreciation 8,5 7,8 32,7 EBIT 31,1 15,0 29,3 Net interest expense -2,2-3,1-11,4 Other financial items -1,0-0,1-3,6 Net financial items -3,2-3,3-15,0 EBT 27,9 11,8 14,3 Taxes 7,5 1,7 2,8 NET PROFIT 20,5 10,1 11,5 On expected level Reduced interest expence due to reduced total interest bearing debt. Mainly currency expense. Controlled exposure within acceptable internal limits. Revenue growth -3,8 % 37,1 % 23,9 % EBITDA margin 16,3 % 9,0 % 6,9 % EPS (NOK) 0,79 0,59 0,53 16


17 Focus on strengthening the balance sheet in 2012 Cash balance (MNOK) MNOK Total available cash was 79 MNOK end of Q Q09 3Q09 1Q10 3Q10 1Q11 3Q11 1Q12 Working capital * Black line is Working capital in percentage of 12 m rolling revenue Growth in the Chile operation caused increased WC in 2011 Reduction in WC of 20 MNOK in Q through focused effort Reduction of working capital in percentage of 12 m rolling revenue of 2.1 percentage points in in Q1 down to 18.3 per cent 17


 60% 50% 40% 45 %45")

18 Group financial profile Debt level (NIBD MNOK) MNOK Substantial reduction in net interest bearing debt in Q1 due to down payment of loan related to the Maritech Norway business and increased cash Q09 3Q09 1Q10 3Q10 1Q11 3Q11 1Q12 Equity ratio (%) 60% 50% 40% 45 %45 % 46 % 42 % 39 % 34 % 35 % 33 %33 % % 44 %45 %46 41 % Equity increased to 46.4% 30% 20% 10% 0% 1Q09 3Q09 1Q10 3Q10 1Q11 3Q11 1Q12 18


19 Interest bearing debt maturity profile Used credit facility Sandnes Sparebank Serial loan Innovasjon Norge Serial loan Sandnes Sparebank - Q Q Yearly down payment on serial loans of 18.9 MNOK Serial loans reduced to zero within 5.3 years
20 Balance Sheet BALANCE SHEET (MNOK) Intangible fixed assets 203,1 210,9 209,6 Fixed assets 41,7 38,5 41,9 Long-term financial assets 30,3 37,7 38,0 FIXED ASSETS 275,1 287,1 289,5 Stock 188,7 171,2 174,9 Trade receivables 184,3 221,4 177,6 Other receivables 34,4-4,4 42,4 Cash and cash equivalents 53,9 28,1 37,2 CURRENT ASSETS 461,3 416,3 432,2 TOTAL ASSETS 736,5 703,4 721,7 Paid in capital 355,5 267,1 355,5 Retained equity -14,0-35,7-31,8 TOTAL EQUITY 341,5 231,3 323,8 Other long term debt 4,0 1,7 2,0 Long-term interest bearing debt 77,0 128,3 110,2 LONG-TERM DEBT 81,0 130,0 112,2 Short-term interest bearing debt 68,2 64,1 72,7 Other current liabilities 245,8 278,0 213,0 SHORT-TERM DEBT 313,9 342,1 285,7 TOTAL EQUITY AND DEBT 736,5 703,4 721,7 Equity ratio 46,4 % 32,9 % 44,9 % Net interest bearing debt 91,3 164,2 145,7 Net working capital 161,7 110,2 182,0
21 Cash flow statement CASH FLOW STATEMENT (NOK 1 000) 1Q 1Q Total Net cash flow from operations Net cash flow from change in working capital Net cash flow from operating activities Net cash flow from investment activities Net cash flow from financial activities Net cash flow Cash and cash equivalents at the beginning of the period Cash and cash equivalents at the end of the period Investments in Q1 were 8.5 MNOK whereof 2.4 MNOK is capitalized R&D expenses in accordance with IFRS. Total investments in 2011 were 30.0 MNOK whereof 12.5 MNOK is capitalized R&D expenses in accordance with IFRS. 21

22 Outlooks 22
 Activity increased throughout the quarter Total order inflow in Q1 of 235 MNOK vs 185 MNOK in Q1 2011")
23 Order backlog and inflow Order backlog (MNOK) Order backlog 275 MNOK vs 265 MNOK in end Q Order inflow (MNOK) Activity increased throughout the quarter Total order inflow in Q1 of 235 MNOK vs 185 MNOK in Q

24 Outlooks Gaining momentum into second quarter Still expect effects of uncertain salmon prices in 2012 Nordic and Chile expected to be main drivers Export pose an opportunity Continues to be hands on adjusting operations according to market development going forward, with focus on long term performance, margins and customer relations Continued effort to build service and aftersales as key business element Continued focus on working capital and strengthening our balance sheet 24

25 Q&A 25
26 26
Oslo, February 27 th, 2012 Trond Williksen, CEO Eirik Børve Monsen, CFO
 Q4 2012 Presentation ti Oslo, February 27 th, 2012 Trond Williksen, CEO Eirik Børve Monsen, CFO 1 Agenda Highlights Q4 2012 Trond Williksen, CEO Financial performance Q4 20122 Eirik Børve Monsen, CFO Statement
Q Presentation Oslo, October 28, Trond Williksen, CEO
 Q3 2011 Presentation Oslo, October 28, 2011 Trond Williksen, CEO 1 Agenda Highlights Q3 2011 Financials Q3 2011 Outlooks Q & A 2 Highlights 3 Increased profitability Operating revenues in Q3 was 226.7
Q Presentation Oslo, August 09, 2011
 Q2 2011 Presentation Oslo, August 09, 2011 Trond Williksen, CEO Morten Nærland, CFO 1 Agenda Highlights Q2 2011 Financials Q2 2011 Way forward Q & A 2 1 Highlights 3 Recovery continues Growth in operating
Your Aquaculture Technology and Service Partner. Q Presentation Oslo - May 8 th, 2015 Trond Williksen, CEO Eirik Børve Monsen, CFO
 Q1 2015 Presentation Oslo - May 8 th, 2015 Trond Williksen, CEO Eirik Børve Monsen, CFO Agenda 1 Highlights 2 Financial performance 3 Outlook 4 Q&A Highlights Q1 2015 - by CEO Trond Williksen 3 On track
The global leader in aquaculture technology
 The global leader in aquaculture technology 2Q 2010 presentation 19 August 2010 Morten Nærland, CFO & Acting CEO Agenda Background & highlights 2Q 2010 Financial review Outlook Q & A 2 3 AKVA group in
The global leader in aquaculture technology
 The global leader in aquaculture technology 1Q 2010 presentation 29 April 2010 Knut Molaug, CEO Morten Nærland, CFO Agenda Background & highlights 1Q 2010 Financial review Outlook Q & A 2 3 AKVA group
Your Aquaculture Technology and Service Partner. Q Presentation Oslo - August 20 th, 2015 Trond Williksen, CEO Eirik Børve Monsen, CFO
 Q2 2015 Presentation Oslo - August 20 th, 2015 Trond Williksen, CEO Eirik Børve Monsen, CFO Agenda 1 Highlights 2 Financial performance 3 Outlook 4 Q&A Highlights Q2 2015 - by CEO Trond Williksen 3 Best
3Q 2009 presentation 11 November 2009
 The global leader in aquaculture technology 3Q 2009 presentation 11 November 2009 Knut Molaug, CEO Rolf Andersen, CFO Agenda Background & highlights 3Q 2009 Financial review Outlook Q & A 2 1 3 AKVA group
Your Aquaculture Technology and Service Partner. Q Presentation Oslo - August 17 th, 2016 Trond Williksen, CEO Eirik Børve Monsen, CFO
 Q2 2016 Presentation Oslo - August 17 th, 2016 Trond Williksen, CEO Eirik Børve Monsen, CFO Agenda 1 Highlights 2 Financial performance 3 Outlook 4 Q&A Highlights Q2 2016 - by CEO Trond Williksen 3 Improved
Your Aquaculture Technology and Service Partner. Q Presentation Oslo - February 19 th, 2016 Trond Williksen, CEO Eirik Børve Monsen, CFO
 Q4 2015 Presentation Oslo - February 19 th, 2016 Trond Williksen, CEO Eirik Børve Monsen, CFO Agenda 1 Highlights 2 Financial performance 3 Outlook 4 Q&A Highlights Q4 2015 - by CEO Trond Williksen 3 MNOK
4Q 2006 presentation 27. February 2007
 The global leader in aquaculture technology presentation 27. February 2007 Steven A. Morrell, Chairman of the Board Knut Molaug, CEO Rolf Andersen, CFO Agenda Background & highlights Financial review Status
Your Aquaculture Technology and Service Partner. Q Presentation Oslo - May 11 th, 2016 Trond Williksen, CEO Eirik Børve Monsen, CFO
 Q1 2016 Presentation Oslo - May 11 th, 2016 Trond Williksen, CEO Eirik Børve Monsen, CFO Agenda 1 Highlights 2 Financial performance 3 Outlook 4 Q&A Highlights Q1 2016 - by CEO Trond Williksen 3 MNOK On
Third quarter report Quarterly report Nr
 Third quarter report 2011 Quarterly report Nr 3 2011 Highlights Operating revenues in Q3 was 226.7 MNOK compared to 212.3 in Q3 last year an increase of 6.8% EBITDA in Q3 was 22.0 MNOK compared to 10.2
3Q 2007 presentation 7 November 2007
 The global leader in aquaculture technology 3Q 2007 presentation 7 November 2007 Knut Molaug, CEO Rolf Andersen, CFO Pro-forma Please note that unless otherwise stated all comments in this presentation
Q Presentation. Oslo November 2 nd 2018 Hallvard Muri, CEO Simon Nyquist Martinsen, CFO
 Q3 218 Presentation Oslo November 2 nd 218 Hallvard Muri, CEO Simon Nyquist Martinsen, CFO Agenda Highlights Financial performance Outlook Q&A Highlights Q3 218 by CEO Hallvard Muri Order Intake development
Best Q1 ever all time high order backlog
 Best Q1 ever all time high order backlog First quarter 2014 HIGHLIGHTS Best Q1 ever Revenue of 310 MNOK (222 MNOK) EBITDA of 32 MNOK (10 MNOK) YoY increase in revenues of 40% and a YoY increase in EBITDA
Quarterly report Nr Third quarter report 2010
 Quarterly report Nr 3 2010 Third quarter report 2010 Highlights Operating revenues in 3Q were 212.3 MNOK versus 139.8 MNOK last year. Year to date operating revenues were 546.6 MNOK versus 456.5 MNOK last
Improved performance and growth continues
 Improved performance and growth continues Second quarter 2016 HIGHLIGHTS Overall good performance - 10.4% EBITDA margin Land based strengthen P&L and high order backlog becoming a significant part of AKVA
On track with a good start of the year
 On track with a good start of the year First Quarter 2016 HIGHLIGHTS All business segments are performing well best Q1 ever A broad mix of products and services contribute financially becoming a stronger
Q Presentation. Oslo May 16 th 2018 Hallvard Muri, CEO Simon Nyquist Martinsen, CFO
 Q1 218 Presentation Oslo May 16 th 218 Hallvard Muri, CEO Simon Nyquist Martinsen, CFO Agenda Highlights Financial performance Outlook Q&A Highlights Q1 218 by CEO Hallvard Muri Continued growth in order
High market activity growth strategy continued
 High market activity growth strategy continued Fourth quarter 2016 HIGHLIGHTS Record high sales and order intake (+60%) Order backlog end of year approximately 1.0 BNOK EBITDA in the quarter hampered by
Your Aquaculture Technology and Service Partner. Company presentation November 2014
 Company presentation November 2014 Important Information About this Company Presentation This Company Presentation has been prepared by AKVA group ASA ("AKVA group" or the "Company") for information purposes
Good market activity continues
 Good market activity continues First quarter 2017 HIGHLIGHTS Good market activity across all regions High quoting activity in the Land Based segment Strong growth in order intake and revenue (+34% / +30%)
Significant growth outside Norway
 Significant growth outside Norway Second quarter 2018 HIGHLIGHTS Continued good activity across all regions and segments Growth in revenue (17%), in particular by Americas and EME (Europe and Middle East)
Positive underlying development
 Positive underlying development Fourth quarter 2017 HIGHLIGHTS Growth in revenue (+24%) Continued high market activity across all regions and segments Order intake of 557 MNOK in the quarter, on the same
High market activity growth strategy continued
 High market activity growth strategy continued Third quarter 2016 HIGHLIGHTS Overall good financial performance - 10.8% EBITDA margin P&L growth softened by Americas and restructuring of AKVA group Denmark
Contents. 4 Highlights Financial key figures. 8 CEO s report. 9 Corporate management. 11 Board of Directors report. 16 Board of Directors
 Annual Report 2010 AKVA group in brief AKVA group is a global provider of land-based and cage farming aquaculture technology; from single components to sustainable turn-key installations worldwide With
PRESENTATION Q Oslo, 14 November 2012 John Binde, CEO Ola Loe, CFO
 PRESENTATION Q3 2012 Oslo, 14 November 2012 John Binde, CEO Ola Loe, CFO AGENDA: Highlights for the period Segment information Group financials Outlook 2 Highlights in Q3 2012: Strong consumption growth
Your Aquaculture Technology and Service Partner. Company presentation August 2016
 Company presentation August 2016 Important Information About this Company Presentation This Company Presentation has been prepared by AKVA group ASA ("AKVA group" or the "Company") for information purposes
Q1 results Peter Nilsson, CEO Cathrin Nylander, CFO
 Q1 results 2018 Peter Nilsson, CEO Cathrin Nylander, CFO 20 April, 2018 Financial highlights Q1: Solid growth and improved profitability Strong revenue growth Underlying growth 8.9% EBIT margin 6.0% (5.3%)
Presentation of Cermaq
 Presentation of Cermaq North Atlantic Seafood Seminar Oslo, 8 th March 2012 Agenda Introduction to Cermaq Key results 2011 Focus on Mainstream Chile Outlook 2012 Photograph: Alf Børjesson 2 This is Cermaq
First half year and Q2 results Peter Nilsson, CEO Cathrin Nylander, CFO
 First half year and Q2 results 2018 Peter Nilsson, CEO Cathrin Nylander, CFO 12 July, 2018 Financial highlights Q2: Continued growth and solid profitability Continued revenue growth Highest Q2 revenue
PRESENTATION Q Oslo, 19 February 2013 John Binde, CEO Ola Loe, CFO
 PRESENTATION Q4 2012 Oslo, 19 February 2013 John Binde, CEO Ola Loe, CFO AGENDA: Highlights for the period Segment information Group financials Outlook 2 Highlights in Q4 2012: Significant improvement
4 TH QUARTER RESULTS Kenneth Ragnvaldsen, CEO February 1, 2013, Oslo
 Q4 4 TH QUARTER RESULTS 2012 Kenneth Ragnvaldsen, CEO February 1, 2013, Oslo AGENDA Financial status Business update Outlook Q&A HIGHLIGHTS Profitability continues to improve High activity. Strong order
NORWAY ROYA L S A L M ON PRESENTATION Q Oslo, 7 November 2017 Charles Høstlund, CEO Ola Loe, CFO 1
 PRESENTATION Q3 2017 Oslo, 7 November 2017 Charles Høstlund, CEO Ola Loe, CFO 1 AGENDA: Highlights for the period Segment information Group financials Markets Outlook 2 Highlights in Q3 2017 Operational
Q May 12th Oslo
 Q1 2016 May 12th Oslo Lerøy Seafood Group ASA CEO Henning Beltestad CFO Sjur S. Malm Agenda Highlights Key financial figures Outlook Q1 2016 EBIT before FV adj. NOK 584.5 million EBIT/kg all inclusive
Third quarter report Quarterly report. Nr
 Third quarter report 2008 Quarterly report Nr 3 2008 Highlights Operating revenue in 3Q was 207 MNOK which is lower than same period last year. The period s EBITDA was 18.1 MNOK Operating revenue year
First three quarters and Q3 results 2018
 First three quarters and Q3 results 2018 Peter Nilsson, CEO Cathrin Nylander, CFO 19 October, 2018 Financial highlights Q3: Strong order growth, including oil and gas Orders Received 25% growth MNOK 669
PRESENTATION Q Oslo, 15 August 2013 John Binde, CEO Ola Loe, CFO
 PRESENTATION Q2 2013 Oslo, 15 August 2013 John Binde, CEO Ola Loe, CFO AGENDA: Highlights for the period Segment information Group financials Outlook 2 Highlights in Q2 2013: Best quarterly operational
Interim Report Q2-18
 Interim Report Q2-18 HIGHLIGHTS Operational EBIT of NOK 181 million o Operational EBIT per kg of NOK 24.73 in Region North o Operational EBIT per kg of NOK 23.49 in Region South o Non-recurring item of
Sølvtrans Holding ASA Q Oslo, 15 May Roger Halsebakk, CEO Jon Kvalø, CFO
 Sølvtrans Holding ASA Q1 2012 Oslo, 15 May 2012 Roger Halsebakk, CEO Jon Kvalø, CFO 1 Highlights in the quarter 2 Financial review 3 Operational and market review 4 Summary and outlook 5 Appendix Highlights
EVRY ASA Q PRESENTATION CEO BJÖRN IVROTH CFO HENRIK SCHIBLER
 1 EVRY ASA Q3 2018 PRESENTATION CEO BJÖRN IVROTH CFO HENRIK SCHIBLER Agenda Group highlights Business update Financial highlights Business area performance Concluding remarks Q&A 2 Group highlights Q3
Q3 Report 2006 Johan Molin President & CEO
 Q3 Report 2006 Johan Molin President & CEO Financial Highlights Q3 Continued high growth pace High stable demand in Europe and North America Fargo developing very well Sales SEK 7 736 M +10% +8% organic,
Sølvtrans Holding ASA Q Oslo, 7 November Roger Halsebakk, CEO Jon Kvalø, CFO
 Sølvtrans Holding ASA Q3 2012 Oslo, 7 November 2012 Roger Halsebakk, CEO Jon Kvalø, CFO 1 Highlights in the quarter 2 Financial review 3 Operational and market review 4 Summary and outlook 5 Appendix Highlights
Presentation of Annual Report Klaus Holse, CEO, SimCorp A/S Thomas Johansen, CFO, SimCorp A/S
 Presentation of Annual Report 2014 Klaus Holse, CEO, SimCorp A/S Thomas Johansen, CFO, SimCorp A/S Disclaimer This presentation contains certain forward-looking statements and expectations in respect of
Marine Harvest Q Presentation
 Marine Harvest Q2 2015 Presentation Forward looking statements This presentation may be deemed to include forward-looking statements, such as statements that relate to Marine Harvest s contracted volumes,
SalMar ASA. Presentation Q CEO Leif Inge Nordhammer CFO Trond Tuvstein
 SalMar ASA Presentation Q1 2015 CEO Leif Inge Nordhammer CFO Trond Tuvstein Agenda Highlights Financial update Operational update Outlook First quarter 2015 highlights Improved operations Challenging biological
Scanship Holding ASA. 1H 2018 Presentation. 28.August 2018 Henrik Badin, CEO Erik Magelssen, CFO
 Scanship Holding ASA 1H 2018 Presentation 28.August 2018 Henrik Badin, CEO Erik Magelssen, CFO About us we are improving our clients sustainability impact with technology for cleaner oceans headquartered
Q presentation. 5 February 2015
 Q4 2014 presentation 5 February 2015 Agenda Highlights Financial overview Market outlook Q4 Highlights Strong finish to a record year Revenue of NOK 7 549 million, up 10.3% EBITDA* of NOK 396 million,
Full year and Q4 results 2018
 Full year and Q4 results 2018 Cathrin Nylander, Acting CEO and CFO 14 February, 2019 Financial highlights Q4: Strong revenue growth Strong orders received MNOK 918 (940) EBIT margin 5.7% (6.5%) Excluding
SECOND QUARTER and FIRST HALF 2012
 SECOND QUARTER and FIRST HALF 2012 Highlights from second quarter 2012 include: Revenues of 948 MNOK (952 MNOK in second quarter 2011) Unchanged in local currencies +4% in Sorting Solutions - 2% in Collection
PRESENTATION Q Oslo, 26 February 2014 John Binde, CEO Ola Loe, CFO
 PRESENTATION Q4 2013 Oslo, 26 February 2014 John Binde, CEO Ola Loe, CFO AGENDA: Highlights for the period Segment information Group financials Outlook 2 Highlights in Q4 2013: The best quarterly and yearly
1Q 2018 Fornebu, April 27, 2018 Luis Araujo and Svein Stoknes
 1Q 2018 Fornebu, April 27, 2018 Luis Araujo and Svein Stoknes Agenda 1Q 2018 Answers Questions Introduction Luis Araujo Chief Executive Officer Financials Svein Stoknes Chief Financial Officer Q&A Session
Blom ASA. 1 st Quarter 2012 Results. Presentation by CEO Dirk Blaauw. May 31 st 2012 Thon Hotel Vika Atrium, Oslo
 Blom ASA 1 st Quarter 2012 Results Presentation by CEO Dirk Blaauw May 31 st 2012 Thon Hotel Vika Atrium, Oslo Disclaimer Forward Looking Statements This presentation contains forward-looking statements
Sølvtrans Holding ASA Q Oslo, 14 August Roger Halsebakk, CEO Jon Kvalø, CFO
 Sølvtrans Holding ASA Q2 2012 Oslo, 14 August 2012 Roger Halsebakk, CEO Jon Kvalø, CFO 1 Highlights in the quarter 2 Financial review 3 Operational and market review 5 Summary and outlook 6 Appendix Highlights
1 ST QUARTER RESULTS Kenneth Ragnvaldsen, CEO April 19, 2013, Oslo
 Q1 1 ST QUARTER RESULTS 2013 Kenneth Ragnvaldsen, CEO April 19, 2013, Oslo AGENDA Financial status Business update Outlook Q&A HIGHLIGHTS Profitability continues to improve. Positive development in Services.
2Q & 1H2018 Results Briefing CSE Global Limited. Fullerton Hotel 14 August 2018
 2Q & 1H2018 Results Briefing CSE Global Limited Fullerton Hotel 14 August 2018 2 Agenda 1. Address by CEO 2. Financial Performance by CFO 3. Q & A Address by CEO 3 4 Business Overview 2Q & 1H2018 overall
Q BAKKAFROST GROUP Oslo 19 February 2019
 BAKKAFROST GROUP Oslo 19 February 2019 DISCLAIMER This presentation includes statements regarding future results, which are subject to risks and uncertainties. Consequently, actual results may differ significantly
Q and Fiscal 2016 results Outlook. March 1, 2017
 Q4 2016 and Fiscal 2016 results 2017 Outlook March 1, 2017 Q4 HIGHLIGHTS 2 Strong global performance Key financial targets provided in fiscal 2016 guidance achieved Positive view for 2017 and beyond Q4
Report Third quarter evry.com
 Report Third quarter 2012 evry.com About EVRY EVRY is one of the leading IT companies in the Nordic countries, with a strong local and regional presence in 50 Nordic towns and cities. Through its knowledge,
4 TH QUARTER 2018 RESULTS ANNOUNCEMENT. TOMRA SYSTEMS ASA 4 th Quarter Results
 4 TH QUARTER 2018 RESULTS ANNOUNCEMENT TOMRA SYSTEMS ASA 4 th Quarter Results 21.02.2019 HIGHLIGHTS FROM 2018 Revenues Gross margin Operating expenses EBITA Cashflow Revenues of 8,596 MNOK (7,432 MNOK
SCANSHIP HOLDING ASA Financial Report First Half Year 2018 (1H 2018)
") SCANSHIP HOLDING ASA Financial Report First Half Year 2018 (1H 2018) SCANSHIP HOLDING ASA Financial report 1H 2018 1. Key Financial Information 1H 2018 Growth trajectory continues into best half year ever
SCANSHIP HOLDING ASA Financial Report First Half Year 2018 (1H 2018) SCANSHIP HOLDING ASA Financial report 1H 2018 1. Key Financial Information 1H 2018 Growth trajectory continues into best half year ever
lindab we simplify construction Lindab Group Q Ola Ringdahl President and CEO Malin Samuelsson CFO
 lindab we simplify construction Lindab Group Q3 2018 Ola Ringdahl President and CEO Malin Samuelsson CFO Agenda Summary and overview Financials Highlights Outlook Summary and Q&A Summary and overview Key
Q August 24th. Lerøy Seafood Group ASA. CEO Henning Beltestad CFO Sjur S. Malm
 Q2 2017 August 24th Lerøy Seafood Group ASA CEO Henning Beltestad CFO Sjur S. Malm Agenda Highlights Key financial figures Outlook Q2 2017 EBIT before FV adj. NOK 801 million Harvest volume 26 156 GWT
PRESENTED BY CEO ØYVIND ISAKSEN AND CFO ROAR ØSTBØ (1)
") 139 PRESENTED BY CEO ØYVIND ISAKSEN AND CFO ROAR ØSTBØ (1) 08-02-2011 AGENDA Q4-10 Highlights Key Figures Regional market update Financial review Outlook Q&A (2) 08-02-2011 Q4-10 HIGHLIGHTS 550 MNOK orders
139 PRESENTED BY CEO ØYVIND ISAKSEN AND CFO ROAR ØSTBØ (1) 08-02-2011 AGENDA Q4-10 Highlights Key Figures Regional market update Financial review Outlook Q&A (2) 08-02-2011 Q4-10 HIGHLIGHTS 550 MNOK orders
Marine Harvest. Q Presentation 24 August 2017
 Marine Harvest Q2 2017 Presentation 24 August 2017 1 Forward looking statements This presentation may be deemed to include forward-looking statements, such as statements that relate to Marine Harvest s
Marine Harvest. Q Presentation 22 August 2018
 Marine Harvest Q2 2018 Presentation 22 August 2018 Forward looking statements This presentation may be deemed to include forward-looking statements, such as statements that relate to Marine Harvest s contracted
Presentation Q Oslo, 8 May Charles Høstlund, CEO Ola Loe, CFO
 Presentation Q1 2018 Oslo, 8 May 2018 Charles Høstlund, CEO Ola Loe, CFO Agenda 1. Highlights for the period 2. Segment information 3. Group financials 4. Markets 5. Projects for growth 6. Outlook 2 Highlights
2 ND QUARTER 2017 RESULTS ANNOUNCEMENT
 2 ND QUARTER 2017 RESULTS ANNOUNCEMENT TOMRA SYSTEMS ASA 2 nd Quarter Results 19.07.2017 HIGHLIGHTS FROM THE QUARTER Revenues Gross margin Operating expenses EBITA Cashflow TOMRA Collection TOMRA Sorting
PRESENTED BY CEO ØYVIND ISAKSEN AND CFO ROAR ØSTBØ (1)
") 68 PRESENTED BY CEO ØYVIND ISAKSEN AND CFO ROAR ØSTBØ (1) 21-10-10 AGENDA Q3-10 Highlights Key Figures Regional market update Financial review Outlook Q&A (2) 21-10-10 Q3-10 HIGHLIGHTS Changes in the Slovakia
68 PRESENTED BY CEO ØYVIND ISAKSEN AND CFO ROAR ØSTBØ (1) 21-10-10 AGENDA Q3-10 Highlights Key Figures Regional market update Financial review Outlook Q&A (2) 21-10-10 Q3-10 HIGHLIGHTS Changes in the Slovakia
Revenue 1,716 million (7% y/y) EBITA 150 million (11% y/y) EBITA margin 8,8 %
 EBITA 150 million (11% y/y) EBITA margin 8,8 %") Q3 HIGHLIGHTS GROUP Revenue 1,716 million (7% y/y) EBITA 150 million (11% y/y) EBITA margin 8,8 % Gaining share in Bank & Finance; +6% y/y Change in pension scheme implemented Significant restructuring
Q3 HIGHLIGHTS GROUP Revenue 1,716 million (7% y/y) EBITA 150 million (11% y/y) EBITA margin 8,8 % Gaining share in Bank & Finance; +6% y/y Change in pension scheme implemented Significant restructuring
Operating revenue NOK million Operational EBIT NOK million. Harvest volume (HOG) tonnes Q3 09 Q4 09 Q1 10 Q2 10 Q3 10
 tonnes Q3 09 Q4 09 Q1 10 Q2 10 Q3 10") Solid performance in a strong market Strong price achievement and solid results in Norway Return on Capital Employed of 18.9% in the quarter Favourable market balance expected to support a strong market
Solid performance in a strong market Strong price achievement and solid results in Norway Return on Capital Employed of 18.9% in the quarter Favourable market balance expected to support a strong market
EVRY ASA Q PRESENTATION CEO BJÖRN IVROTH CFO HENRIK SCHIBLER
 1 EVRY ASA Q1 2018 PRESENTATION CEO BJÖRN IVROTH CFO HENRIK SCHIBLER Agenda Group highlights Business update Financial highlights Business area performance Targets and Concluding remarks Q&A 2 Group highlights
Grieg Seafood ASA. griegseafood.com. Andreas Kvame CEO. Atle Harald Sandtorv CFO. 8 November 2017
 Grieg Seafood ASA Andreas Kvame CEO Atle Harald Sandtorv CFO 8 November 2017 1 Agenda Highlights This is Grieg Seafood Business Units (Regions) Financials Outlook 2 Highlights Q3 2017 Improved results
Q November 9th. Lerøy Seafood Group ASA. CEO Henning Beltestad CFO Sjur S. Malm
 Q3 2017 November 9th Lerøy Seafood Group ASA CEO Henning Beltestad CFO Sjur S. Malm Agenda Highlights Key financial figures Outlook Q3 2017 EBIT before FV adj. NOK 861 million Harvest volume 46 024 GWT
lindab we simplify construction Lindab Group Q Ola Ringdahl President and CEO Kristian Ackeby CFO
 lindab we simplify construction Lindab Group Q2 2018 Ola Ringdahl President and CEO Kristian Ackeby CFO Agenda Summary and overview Financials Highlights Outlook Summary and Q&A Summary and overview Key
Q presentation. Oslo / 26 April 2018 Eirik Lunde, CEO Gaute W. Krekling, CFO
 Q1 218 presentation Oslo / 26 April 218 Eirik Lunde, CEO Gaute W. Krekling, CFO Q1 218 financials in brief CUSTOMERS at 31 Mar 27,6 RGUs Revenue generating units REVENUES Q1 18 378(298*) NOK MILLION 11
Q Nova Austral Financial Reporting May 2nd, 2018
 Q1-2018 Nova Austral Financial Reporting May 2nd, 2018 Agenda A. Nova Austral Pillars & Fundamentals B. Market and company updates C. Financial Report 1) Key Financial summary 2) LTM EBITDA, Revenue and
3Q 2018 Fornebu, October 24, 2018 Luis Araujo and Svein Stoknes
 3Q 2018 Fornebu, October 24, 2018 Luis Araujo and Svein Stoknes Agenda 3Q 2018 Answers Questions Introduction Luis Araujo Chief Executive Officer Financials Svein Stoknes Chief Financial Officer Q&A Session
From Copeinca to Mitsubishi and beyond. Jon Hindar CEO London, 31 October 2014
 From Copeinca to Mitsubishi and beyond Jon Hindar CEO London, 31 October 2014 A roller coaster with a happy ending for Cermaq and for the industry Page 2 A roller coaster with a happy ending for Cermaq
Marine Harvest. Q Presentation 1 November 2017
 Marine Harvest 1 Q3 2017 Presentation 1 November 2017 Forward looking statements This presentation may be deemed to include forward-looking statements, such as statements that relate to Marine Harvest
Interim Report Q4-17
 Interim Report Q4-17 HIGHLIGHTS Operational EBIT of NOK 95 million o o Operational EBIT per kg of NOK 15.84 in Region North Operational EBIT per kg of NOK 14.12 in Region South The highest sold volume
 - - - - - - - 20 000 15 000 10 000 5 000 0 2017 2014 2013 2012 2011 2010 2009 2008 2007 2006 2005 2004 2003 2002 2001 2000 1999 1995 1 400 30 1 200 25 1 000 800 600 400 777 20 15 10 16,5 200 5 0 0 Q4/17
Marine Harvest. Q Presentation 14 February 2018
 Marine Harvest Q4 2017 Presentation 14 February 2018 1 Forward looking statements This presentation may be deemed to include forward-looking statements, such as statements that relate to Marine Harvest
4Q 2018 Fornebu, February 8, 2019 Luis Araujo and Svein Stoknes
 4Q 2018 Fornebu, February 8, 2019 Luis Araujo and Svein Stoknes Agenda 4Q 2018 Answers Questions Introduction Luis Araujo Chief Executive Officer Financials Svein Stoknes Chief Financial Officer Q&A Session
EVRY ASA Q PRESENTATION CEO BJÖRN IVROTH CFO HENRIK SCHIBLER
 1 EVRY ASA Q2 2018 PRESENTATION CEO BJÖRN IVROTH CFO HENRIK SCHIBLER Agenda Group highlights Business update focus on consulting in EVRY Financial highlights Business area performance Concluding remarks
Cermaq ASA Presentation for Pareto Securities Oslo, 14 th June 2012
 Cermaq ASA Presentation for Pareto Securities Oslo, 14 th June 2012 1 2020 2015 2010 2005 2000 1995 1990 1985 1980 1975 1970 1965 1960 1955 1950 Aquaculture: a sustainable growth industry Our growing population
Blom ASA. 4th Quarter 2012 Result Presentation. Presentation by CEO Dirk Blaauw. February 8 th 2013 WEBCAST
 Blom ASA 4th Quarter 2012 Result Presentation Presentation by CEO Dirk Blaauw February 8 th 2013 WEBCAST Disclaimer Forward Looking Statements This presentation contains forward-looking statements that
CEO Terje Mjøs. Oslo, 17 July Q Presentation
 CEO Terje Mjøs Oslo, 17 July 1 Q 1 Presentation Q 1 Highlights Profitable and strong organic growth in Sweden +1% YoY o Flat in Norway, +3% in total EBITA NOK 15 million (+9% YoY*) o Including synergy
Third quarter of 2010
 Third quarter of 2010 Main features of the third quarter of 2010 Merger with ErgoGroup completed with effect from 30 September 2010 Operating revenue NOK 1,679 million (NOK 1,716 million) EBITA NOK 70
Paul Maguire Philip Bennett Paul Witheridge Managing Director Chief Financial Officer Chief Financial Officer
 McPherson s Limited Results for the year to 30 June 2011 Paul Maguire Philip Bennett Paul Witheridge Managing Director Chief Financial Officer Chief Financial Officer McPherson s Limited McPherson s Limited
Marine Harvest Q Presentation
 Marine Harvest Q1 2014 Presentation Forward looking statements This presentation may be deemed to include forward-looking statements, such as statements that relate to Marine Harvest s contracted volumes,
EDB Business Partner ASA REPORT FOR THE THIRD QUARTER OF 2007
 - 1 - EDB Business Partner ASA REPORT FOR THE THIRD QUARTER OF 2007 Revenues of NOK 1,465 million, 7% y/y growth Improved EBITA margin to 9.3% compared to 8.9% in 2006 Solutions and Application Services
Aker Seafoods Second quarter 2010 Profits improved in high season
 Aker Seafoods Second quarter 21 Profits improved in high season CEO Liv Monica B Stubholt CFO Gunnar Aasbø-Skinderhaug Welcome Agenda Topic Speaker Operational Update Liv Monica Stubholt, CEO Group Harvesting
HAVYARD GROUP ASA Presentation Q Geir Johan Bakke, CEO
 HAVYARD GROUP ASA Presentation Q1 2016-24.05.16 Geir Johan Bakke, CEO Agenda Headlines/ milestones Q1 Outlook Main figures Detailed figures HES/ QA Questions Headlines/Milestones Q1 EBIT of NOK 18.7million
NORWEGIAN AIR SHUTTLE ASA QUARTERLY REPORT FOURTH QUARTER 2007
 NORWEGIAN AIR SHUTTLE ASA QUARTERLY REPORT FOURTH QUARTER 2007 FOURTH QUARTER IN BRIEF The Group earnings before tax (EBT) was MNOK -34.0 (-35.6) in the fourth quarter. The fourth quarter operating revenue
Interim Report Q1-18
 Interim Report Q1-18 HIGHLIGHTS Operational EBIT of NOK 193 million o o Operational EBIT per kg of NOK 19.22 in Region North Operational EBIT per kg of NOK 15.64 in Region South The highest sold and harvested
Viking Redningstjeneste Topco AS. Interim financial statements 4Q 2018
 Viking Redningstjeneste Topco AS Interim financial statements 4Q 2018 Quarterly report October December 2018 Viking Redningstjeneste Topco AS Fourth quarter 2018 Org no. 998 858 690 Quarterly report FOURTH
Scenarios and drivers - for High & Low salmon prices 2018
 Scenarios and drivers - for High & Low salmon prices 2018 BRUSSELS SEMINAR Hotel Bloom 23rd Apr 2018 by Ragnar Nystøyl Atlantic Salmon Market Development All markets 2015 2016 16/15 2017 17/16 2018e 18/17
Marine Harvest. Q Presentation 10 May 2017
 Marine Harvest Q1 2017 Presentation 10 May 2017 1 Forward looking statements This presentation may be deemed to include forward-looking statements, such as statements that relate to Marine Harvest s contracted