Presentatio. on Q3 2010
|
|
|
- Rodger Small
- 5 years ago
- Views:
Transcription


1 Presentatio on Q CEO Regin Jacobsen CFO Teitur Samuelsen Oslo November 9 th 2010
2 Disclaimer This presentation includes statements regarding future results, which are subject to risks and uncertainties. Consequently, actual results may differ significantly from the results indicated or implied in these statements. No representation or warranty (expressed or implied) is made as to, and no reliance should be placed on, the fairness, accuracy or completeness of the information contained herein. Accordingly, none of the Company, or any of its principal shareholders or subsidiary undertakings or any of such person s officers or employees or advisors accept any liability whatsoever arising directly or indirectly from the use of this document 2

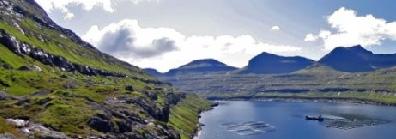
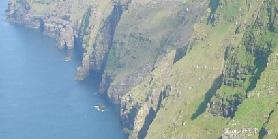
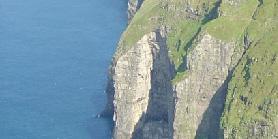
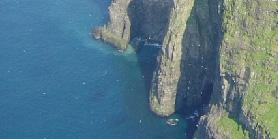
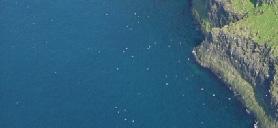
3 Faroe Islands 18 islands - 1,400 km2 48,600 inhabitants Self-governing part of the Kingdom of Denmark Part of the Danish monetary union Key sectors (% of wage earners, 2008) Service/public admin.: 35% Private service: 33% Fishing industry: 18% GDP: DKK 12.4 bn (2008) GDP/capita: DKK 255,000 (EU: 187,000) (2008) Corporate Tax: 18% Source: Hagstova Føroya 3


 ~110km Revenues DKK 178 million")
 Fish farms Hatcheries Slaughteries HQ/VAP *")
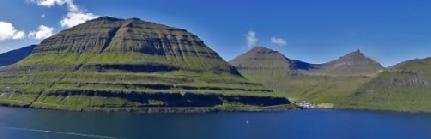
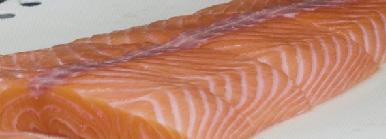
4 Bakkafrost The largest fish farm ming company in the Faroe Islands ~75km Largest salmon farming company in the Faroe Islands ~44 % of harvest volumes (Q3 2010) ~36 % of existing licenses ( ) Vestlax was merged into Bakkafrost 1 January 2010 Produced a total of 4,048 gwt in Q (6,815 tonnes gwt in 2009) ~110km Revenues DKK 178 million in Q (Q DKK 228 million) Operational EBIT* DKK 47 million in Q (Q of DKK 51 million) Fish farms Hatcheries Slaughteries HQ/VAP * Aligned for fair value adjustment of biomass, onerous contracts provisions and costs related to the listingofthe company on Oslo Børs. 4
5 Faroe Islands: Excellent conditions for cost effective farming Geography Faroese fjords provide separation between locations Improves biological control and area management Average water temperatures ºC Faroe Islands Norway (Trøndelag) Water Stable water temperatures throughout the year between 6-12 degrees Celsius Excellent water quality and circulation conditions Location Efficient distribution to both the European- and US markets Jan Feb Mar Apr May Jun Jul Aug Sep Oct Nov Dec Biomass Biological sustainability setting the biomass target per license Source: Company material, Havforskningsinstituttet 5


6 Summary Q
7 Summary Q Market Strong demand and high market prices Favourable spot prices st tart t to be passed on into VAP contracts t Strategy Planned operational changes on track Trout phased out Financial Strong financial position and good outlook Strong performance More investor friendly dividend policy declared Biology Biological and operational performance to be further improved due to better capacity utilisation Estimated smolt releases in 2010 increased from 7 million to 7.9 million Outlook Volume in 2010 expected to 23,000 tonnes gutted weight and 35,000 tonnes in Harvest to be ramped up in Q We expect the market to be strong with a high price level both on spot and VAP. 7
8 Dividend Policy Dividend policy Bakkafrost aims to give its shareholders a competitive return on their investment, both through payment of dividends from the Company and by securing an increase in the value of the equity through positive operations. Generally, the company should pay dividends to its shareholders, but it is the responsibility of the Board of Directors to make an overall assessment in order to secure the company a healthy capital base, both for daily operations and for a healthy future growth of the company. Clarification on dividend The Board of Directors has decided to propose to the Annual General Meeting that if no M&As have taken place before the next Annual General Meeting, a high share of the earnings per share (EPS) from 2010 will be paid out as dividend. It is the Board of Directors view that 30 50% of EPS shall be paid out as dividend when the Group s equity ratio is above 60%. At the end of 3Q 2010, the equity ratio was 73%. 8

9 Largest Shareholders 10 Largest shareholders SalMar ASA 21.76% Havsbrún P/F 16.71% Jacobsen, Hans 9.40% Jacobsen, Jóhan Regin 9.19% Danske Bank a/s 5.51% JPMorgan Chase Bank 4.60% JPMPLSA, Nordea Lux 2.14% Royndin p/f 1.90% Morgan Stanley 1.55% Pareto Securities 1.53% Total share 10 largest shareholders 74.29% Total share 20 largest shareholders 84.61% As per November 4 th
 Farming: Q3 2010 Q3 2009 Proforma North West North")
10 Financial Highlights Group Strong profit based on good performance Strong market drives prices and margins up to record high levels Very strong performance in West Optimalization of biology, production and markets hampered by low volumes will be improved from Q Good margins in farming despite low harvested quantity in Q (NOK) Farming: Q Q Proforma North West North West EBIT* NOK/kg gwt Harvested volumes 1000 [gwt] 3, ,069 2,745 Spare capacity VAP 62% of whole fish and 61% of sales to be reduced from Q Spare capacity Harvest 2010 Spare capacity to be better utilized from 2011 * Aligned for fair value adjustment of biomass, onerous contracts provisions and costs related to the listing of the company on Oslo Børs. 10
11 Key Financials, Group Cash flow in Q used to finance increase in biomass Seasonable Increased production Low interest bearing debt High equity ratio (DKKm) Q Proforma Cash flow from operations Total assets 1,080 1,004 NI IBD Equity ratio 73% 57% 11
12 SEGMENT INFORMATION 12
13 Segments Farming Strong operating results High prices on salmon and trout Good biological and operating performance Revenues down 25% in Q compared with Q but at significantly improved operational margin Harvested volumes reduced by 41%, but higher prices compensate (DKKm) Q Q Proforma Operating revenues Operational EBIT* Operational EBIT margin 37.3% 28.3% * EBIT aligned for fair value adjustment of biomass and costs related to the listing of the company on Oslo Børs. 13
 share West obtained record high")

14 Farming - Operational Performance Operational EBIT* /kg and margin on high level Hampered due to limited flexibility caused by high contract (VAP) share West obtained record high margin in Q Good biological performance * Aligned for fair value adjustment of biomass, onerous contracts provisions and costs related to the listing of the company on Oslo Børs. 14
15 Farming - Harvest Volume [1,000 tonnes gwt] [tonnes gwt] Q3 Q3 YTD YTD Harvested volume 41% reduction in Q compared with Q West 915 2,745 4,278 7,653 North 3,133 4,069 10,855 14,061 Harvested volumes will increase from Q Estimated quantity for ,000 tonnes gwt Forecast for ,000 tonnes gwt 15
16 Segments VAP Operating revenue increase by 32% (DKKm) Q Q Proforma Volume decreased by 9% in Q compared with Q3 2009, but offset at 45% higher price level Focus on efficient VAP production Operating revenues Operationel EBIT* Price index VAP challenged by high raw material prices Time lag between spot prices and contract prices Favourable spot prices start to be passed on into VAP contracts * EBIT aligned for onerous contracts provision 16
17 GROUP FINANCIALS e 17
18 Group Profit and Loss Revenues decreased by 22% but volumes decreased by 41% - strong market Operating EBIT close to same level despite decrease in volumes Reduced interest costs (DKKm) Operating revenues Purchase of goods Change in inventory and biological assets (at cost) Salary and personn el exp Other op. revenue a a ue adj EPS DKK 1.35 in Q Other op. expensess Income from associ ates Depreciation Operating EBIT Fair value adj. Onerous contr. Listing costs EBIT Financial items EBT Taxes Q Q M M Proforma Proforma Proforma Profit for the period
19 Balance Sheet as per 30 September 2010 (DKKm) 30 Sept. End Proforma Invesments in PPE to carry out the organic growth Building up biomass as planned Reduced NIBD significantly Strong balance sheet - NIBD/Equity 10% Intangible assets Property, plant and equipment Financial assets Long term receivables Biological assets Inventory Receivables Cash and cash equivalents Total Assets 1, ,003.9 Equity Deferred and other taxes Long term interest bearing debt Short term interest bearing debt Account payables Total Equity and liabilities 1, ,
20 Cash Flow for Q (DKKm) Q M Proforma Cash flow used to build up biomass to new level and to investments Operating profit Cash flow from operations Cash flow from investments Strong liquidity DKK 330M of undrawn facilities Cash flow from financing Net change in cash Cash at the end of the period
21 Outlook A strong market with reduced supply leads to high price level Higher contract prices will materialize in 4Q 2010 Harvested volumes will increase from Q Expect to harvest 23,000 tonnes gwt in 2010 and 35,000 tonnes gwt in Continue to pursue opportunities - organic and M&A - in the coming years Maintain focus on a healthy biological environment Building up biomass 21
22 Strong expected volume growth in existing licenses Smolt release (million) Increased guidance of smolt release in 2010 from 7.0 million to 7.9 million Expects to release 49% more smolt in 2010 than , , % No absolute biomass restrictions Today trout has been phased out PF 2010E 2011E West /trout West /salmon North /salmon 22
23 23
PRESENTATION Q CEO Regin Jacobsen / CFO Teitur Samuelsen Oslo November 6 th 2012
 PRESENTATION Q3 2012 CEO Regin Jacobsen / CFO Teitur Samuelsen Oslo November 6 th 2012 DISCLAIMER This presentation includes statements regarding future results, which are subject to risks and uncertainties.
Q THIRD QUARTER BAKKAFROST GROUP Glyvrar 5 November 2013
 Q3 2013 THIRD QUARTER BAKKAFROST GROUP Glyvrar 5 November 2013 DISCLAIMER This presentation includes statements regarding future results, which are subject to risks and uncertainties. Consequently, actual
Q BAKKAFROST GROUP Oslo 20 February 2018
 BAKKAFROST GROUP Oslo 20 February 2018 DISCLAIMER This presentation includes statements regarding future results, which are subject to risks and uncertainties. Consequently, actual results may differ significantly
Q BAKKAFROST GROUP Oslo 21 August 2018
 BAKKAFROST GROUP Oslo 21 August DISCLAIMER This presentation includes statements regarding future results, which are subject to risks and uncertainties. Consequently, actual results may differ significantly
Q BAKKAFROST GROUP Glyvrar 20 May 2014
 Q1 014 BAKKAFROST GROUP Glyvrar 0 May 014 DISCLAIMER This presentation includes statements regarding future results, which are subject to risks and uncertainties. Consequently, actual results may differ
Q BAKKAFROST GROUP Oslo 19 February 2019
 BAKKAFROST GROUP Oslo 19 February 2019 DISCLAIMER This presentation includes statements regarding future results, which are subject to risks and uncertainties. Consequently, actual results may differ significantly
Q BAKKAFROST GROUP Glyvrar 28 October 2014
 Q3 2014 BAKKAFROST GROUP Glyvrar 28 October 2014 DISCLAIMER This presentation includes statements regarding future results, which are subject to risks and uncertainties. Consequently, actual results may
Q BAKKAFROST GROUP Oslo February 24 th 2015
 Q4 2014 BAKKAFROST GROUP Oslo February 24 th 2015 DISCLAIMER This presentation includes statements regarding future results, which are subject to risks and uncertainties. Consequently, actual results may
Q BAKKAFROST GROUP Oslo 10 May 2016
 2016 BAKKAFROST GROUP Oslo 10 May 2016 DISCLAIMER This presentation includes statements regarding future results, which are subject to risks and uncertainties. Consequently, actual results may differ significantly
Q BAKKAFROST GROUP New York 19 May 2016
 2016 BAKKAFROST GROUP New York 19 May 2016 DISCLAIMER This presentation includes statements regarding future results, which are subject to risks and uncertainties. Consequently, actual results may differ
BAKKAFROST INTRAFISH SEAFOOD INVESTOR FORUM London 13 September 2018
 BAKKAFROST INTRAFISH SEAFOOD INVESTOR FORUM London 13 September 2018 DISCLAIMER This presentation includes statements regarding future results, which are subject to risks and uncertainties. Consequently,
Dette billede kan ikke vises i øjeblikket. Q FOURTH QUARTER BAKKAFROST GROUP Glyvrar 25 February 2014
 Dette billede kan ikke vises i øjeblikket. Q4 2013 FOURTH QUARTER BAKKAFROST GROUP Glyvrar 25 February 2014 DISCLAIMER This presentation includes statements regarding future results, which are subject
PRESENTATION Q Oslo, 19 February 2013 John Binde, CEO Ola Loe, CFO
 PRESENTATION Q4 2012 Oslo, 19 February 2013 John Binde, CEO Ola Loe, CFO AGENDA: Highlights for the period Segment information Group financials Outlook 2 Highlights in Q4 2012: Significant improvement
P/F Bakkafrost. Condensed Consolidated Interim Report for Q and 12 Months Operational EBIT mdkk
 P/F Bakkafrost Condensed Consolidated Interim Report for Q4 2015 and 12 Months 2015 Harvest volume TGW 15,000 12,000 9,000 6,000 3,000 Q4 14 Q1 15 Q2 15 Q3 15 Q4 15 Operational EBIT mdkk 300 250 200 150
15,000 12, , , , ,158 13,004 12, , ,664
 15,000 12,000 13,004 10,934 12,940 13,158 10,664 350 307 300 9,000 335 255 254 30 26.34 21.58 22.26 23.22 16 Q2 16 Q3 16 24.33 20 200 6,000 10 100 3,000 0 400 16 Q2 16 Q3 16 Q4 16 17 0 16 Q2 16 Q3 16 Q4
PRESENTATION Q Oslo, 14 November 2012 John Binde, CEO Ola Loe, CFO
 PRESENTATION Q3 2012 Oslo, 14 November 2012 John Binde, CEO Ola Loe, CFO AGENDA: Highlights for the period Segment information Group financials Outlook 2 Highlights in Q3 2012: Strong consumption growth
Q November 9th. Lerøy Seafood Group ASA. CEO Henning Beltestad CFO Sjur S. Malm
 Q3 2017 November 9th Lerøy Seafood Group ASA CEO Henning Beltestad CFO Sjur S. Malm Agenda Highlights Key financial figures Outlook Q3 2017 EBIT before FV adj. NOK 861 million Harvest volume 46 024 GWT
P/F Bakkafrost Condensed Consolidated Interim Report for Q and 9 months 2013
 P/F Bakkafrost Condensed Consolidated Interim Report for Q3 2013 and 9 months 2013 15000 10000 5000 0 Harvest volume - TGW Q3 12 Q4 12 Q1 13 Q2 13 Q3 13 Operational EBIT mdkk 200 150 100 50 0 Q3 12 Q4
Q NOVEMBER 8TH 2018
 Q3 2018 NOVEMBER 8TH 2018 1. Highlights 2. Key Financial Figures 3. Outlook Highlights Klikke for å legge til annet bilde Q3 2018 - EBIT before FV adj. NOK 660 million - Harvest volume 37 227 GWT - EBIT/kg
Q August 24th. Lerøy Seafood Group ASA. CEO Henning Beltestad CFO Sjur S. Malm
 Q2 2017 August 24th Lerøy Seafood Group ASA CEO Henning Beltestad CFO Sjur S. Malm Agenda Highlights Key financial figures Outlook Q2 2017 EBIT before FV adj. NOK 801 million Harvest volume 26 156 GWT
P/F BAKKAFROST.
 P/F BAKKAFROST ANNUAL AND CONSOLIDATED REPORT AND ACCOUNTS YEAR TO 31 DECEMBER 2010 www.bakkafrost.com KEY FIGURES (DKK 1,000) IFRS IFRS IFRS FO-GAAP Profit and loss 2010 2009 2008 2007 Operating revenues
Q MAY 8TH 2018
 Q1 2018 MAY 8TH 2018 1. Highlights 2. Key Financial Figures 3. Outlook Highlights Klikke for å legge til annet bilde Q1 2018 - EBIT beforefv adj. NOK 960 million - Harvest volume 37576 GWT - EBIT/kg all
Q May 12th Oslo
 Q1 2016 May 12th Oslo Lerøy Seafood Group ASA CEO Henning Beltestad CFO Sjur S. Malm Agenda Highlights Key financial figures Outlook Q1 2016 EBIT before FV adj. NOK 584.5 million EBIT/kg all inclusive
PRESENTATION Q Oslo, 15 August 2013 John Binde, CEO Ola Loe, CFO
 PRESENTATION Q2 2013 Oslo, 15 August 2013 John Binde, CEO Ola Loe, CFO AGENDA: Highlights for the period Segment information Group financials Outlook 2 Highlights in Q2 2013: Best quarterly operational
PRESENTATION Q Oslo, 26 February 2014 John Binde, CEO Ola Loe, CFO
 PRESENTATION Q4 2013 Oslo, 26 February 2014 John Binde, CEO Ola Loe, CFO AGENDA: Highlights for the period Segment information Group financials Outlook 2 Highlights in Q4 2013: The best quarterly and yearly
THIRD QUARTER / 2018
 REPORT FOR THE THIRD QUARTER 2018 HIGHLIGHTS Operationally strong quarter, with cost improvements and good price achievement. Record-high volume for sales & processing with positive contribution Total
Grieg Seafood ASA. griegseafood.com. Andreas Kvame CEO. Atle Harald Sandtorv CFO. 8 November 2017
 Grieg Seafood ASA Andreas Kvame CEO Atle Harald Sandtorv CFO 8 November 2017 1 Agenda Highlights This is Grieg Seafood Business Units (Regions) Financials Outlook 2 Highlights Q3 2017 Improved results
P/F BAKKAFROST.
 P/F BAKKAFROST ANNUAL AND CONSOLIDATED REPORT AND ACCOUNTS YEAR TO 31 DECEMBER 2011 www.bakkafrost.com KEY FIGURES (DKK 1,000) IFRS IFRS IFRS IFRS FO-GAAP Profit and loss 2011 2010 2009 2008 2007 Operating
Marine Harvest. Q Presentation 1 November 2017
 Marine Harvest 1 Q3 2017 Presentation 1 November 2017 Forward looking statements This presentation may be deemed to include forward-looking statements, such as statements that relate to Marine Harvest
Fishpool Christmas Seminar 2017 Bearish signals going into 2018
 Photo: SB1 Markets SEAFOOD SALMON FARMING Fishpool Christmas Seminar 2017 Bearish signals going into 2018 Tore A. Tønseth Phone : (+47) 24 14 74 18 Mobile : (+47) 95 80 62 77 E-mail : tore.tonseth@sb1markets.no
Marine Harvest. Q Presentation 10 May 2017
 Marine Harvest Q1 2017 Presentation 10 May 2017 1 Forward looking statements This presentation may be deemed to include forward-looking statements, such as statements that relate to Marine Harvest s contracted
YEAR TO 31 DECEMBER 2012
 P/F Bakkafrost Annual and Consolidated Report and Accounts YEAR TO 31 DECEMBER 2012 www.bakkafrost.com 1/112 > Bakkafrost > Annual and Consolidated Report and Accounts 2012 2012 1,855,544 2011 KEY FIGURES
Marine Harvest. Q Presentation 22 August 2018
 Marine Harvest Q2 2018 Presentation 22 August 2018 Forward looking statements This presentation may be deemed to include forward-looking statements, such as statements that relate to Marine Harvest s contracted
Aker Seafoods Second quarter 2009 Sales of fresh products up, but prices down
 Aker Seafoods Second quarter Sales of fresh products up, but prices down CEO Yngve Myhre CFO Gunnar Aasbø Interim presentation second quarter 1 Welcome Agenda Topic Operational Update Group Harvesting
Marine Harvest. Q Presentation 14 February 2018
 Marine Harvest Q4 2017 Presentation 14 February 2018 1 Forward looking statements This presentation may be deemed to include forward-looking statements, such as statements that relate to Marine Harvest
ANNUAL REPORT. Faroese Company Registration No BAKKAFROST 1 ANNUAL REPORT 2016
 ANNUAL REPORT 2016 www.bakkafrost.com Faroese Company Registration No. 1724 BAKKAFROST 1 ANNUAL REPORT 2016 Table of Contents Chairman s Statement 4 Statement by the Management and the Board of Directors
Marine Harvest. Q Presentation 24 August 2017
 Marine Harvest Q2 2017 Presentation 24 August 2017 1 Forward looking statements This presentation may be deemed to include forward-looking statements, such as statements that relate to Marine Harvest s
Aker Seafoods Second quarter 2010 Profits improved in high season
 Aker Seafoods Second quarter 21 Profits improved in high season CEO Liv Monica B Stubholt CFO Gunnar Aasbø-Skinderhaug Welcome Agenda Topic Speaker Operational Update Liv Monica Stubholt, CEO Group Harvesting
Weekly Salmon Outlook Week
 Week 10-20 Page 1 of 8 Harvest of Atlantic salmon in Norway continued to grow in week 9. The harvest volume (23 000 tonnes wfe) was up 1000 tonnes from the previous week and 3% higher than in the corresponding
Lerøy Seafood Group SEPTEMBER 2018
 Lerøy Seafood Group SEPTEMBER 2018 1. Lerøy Seafood Group 2. Key market trends supply and demand Our vision To be the leading and most profitable global supplier of sustainable high-quality seafood History
NORWAY ROYA L S A L M ON PRESENTATION Q Oslo, 7 November 2017 Charles Høstlund, CEO Ola Loe, CFO 1
 PRESENTATION Q3 2017 Oslo, 7 November 2017 Charles Høstlund, CEO Ola Loe, CFO 1 AGENDA: Highlights for the period Segment information Group financials Markets Outlook 2 Highlights in Q3 2017 Operational
SalMar ASA. Presentation Q CEO Leif Inge Nordhammer CFO Trond Tuvstein
 SalMar ASA Presentation Q1 2015 CEO Leif Inge Nordhammer CFO Trond Tuvstein Agenda Highlights Financial update Operational update Outlook First quarter 2015 highlights Improved operations Challenging biological
Santiago, May 11 th, Results Presentation 1Q18
 Santiago, May 11 th, 2018 Results Presentation 1Q18 Agenda I. Highlights II. III. Financial Statements Supply, Demand and Prices IV. Farming Operation V. Prospects 2 Highlights EBIT 1Q18 USD 18.8 million
ANNUAL REPORT Faroese Company Registration No. 1724
 ANNUAL REPORT 2017 www.bakkafrost.com Faroese Company Registration No. 1724 2 Contents Chairman s Statement 4 Statement by the Management and the Board of Directors 6 Outlook 8 Bakkafrost at a Glance 10
SalMar ASA. Presentation Q CEO Olav-Andreas Ervik CFO Trond Tuvstein
 SalMar ASA Presentation Q1 2018 CEO Olav-Andreas Ervik CFO Trond Tuvstein Olav-Andreas Ervik new CEO of SalMar 41 years, from Frøya More than 20 years of experience from the aquaculture industry Worked
All figures in NOK 1,000 Q3 11 Q3 10 Sept. 30, 2011 Sept. 30,
 Austevoll Seafood ASA 0 INTERIM REPORT Q3 2011 Significant reduction in interest-bearing liabilities in the quarter Third quarter is low season for production of pelagic fish in Europe and South America
Highlights for the quarter Q2 / EBIT NOK 60 million pre biomass write-down
 Half year report Highlights for the quarter EBIT NOK 60 million pre biomass write-down EBIT pre fair value and biomass write-down (NOK million) 318 348 300 101 60 Mainstream results negatively impacted
SalMar ASA. Presentation Q CEO Yngve Myhre, CFO Trond Tuvstein Oslo, 14 November w w w. s a l m a r. n o
 Presentation Q3 2013 SalMar ASA CEO Yngve Myhre, CFO Trond Tuvstein Oslo, 14 November 2013 2 Agenda Highlights Financial update Operational update Market and outlook Third quarter highlights Another strong
Financial report Q3 2014
 Financial report Q3 2014 Austevoll Seafood ASA Financial report Q3 2014 Index Key figures for the Group... 03 Q3 2014... 04 Operating segments... 04 Cash flows... 05 Financial information as of 30 September
XML Publisher Balance Sheet Vision Operations (USA) Feb-02
 Feb-02") Page:1 Apr-01 May-01 Jun-01 Jul-01 ASSETS Current Assets Cash and Short Term Investments 15,862,304 51,998,607 9,198,226 Accounts Receivable - Net of Allowance 2,560,786
Page:1 Apr-01 May-01 Jun-01 Jul-01 ASSETS Current Assets Cash and Short Term Investments 15,862,304 51,998,607 9,198,226 Accounts Receivable - Net of Allowance 2,560,786
Marine Harvest Q Presentation
 Marine Harvest Q1 2014 Presentation Forward looking statements This presentation may be deemed to include forward-looking statements, such as statements that relate to Marine Harvest s contracted volumes,
Events after balance sheet date
 Austevoll Seafood ASA 0 Financial Report Q4 2011 Successful second fishing season for anchoveta in Peru A positive result recorded for fish farming, sale and distribution, in difficult conditions Seasonally,
RS Platou Markets. Seafood conference. 10th June 2010
 RS Platou Markets Seafood conference 10th June 2010 Agenda Introduction to Cermaq Highlights Q1 2010 and outlook full year Chile Recovery 2 Overview of Cermaq One of the global leaders in the aquaculture
Q U A R T E R L Y R E P O R T 2 N D Q U A R T E R
 Q U A R T E R L Y R E P O R T 2 N D Q U A R T E R 2 0 0 7 1. Grieg Seafood develops as planned Grieg Seafood was listed in June, and has now 869 shareholders after 2 shares issues of MNOK 700 in total.
Marine Harvest Q Presentation
 Marine Harvest Q2 2014 Presentation Forward looking statements This presentation may be deemed to include forward-looking statements, such as statements that relate to Marine Harvest s contracted volumes,
Marine Harvest Q Presentation
 Marine Harvest Q2 2015 Presentation Forward looking statements This presentation may be deemed to include forward-looking statements, such as statements that relate to Marine Harvest s contracted volumes,
 - - - - - - - 20 000 15 000 10 000 5 000 0 2017 2014 2013 2012 2011 2010 2009 2008 2007 2006 2005 2004 2003 2002 2001 2000 1999 1995 1 400 30 1 200 25 1 000 800 600 400 777 20 15 10 16,5 200 5 0 0 Q4/17
SalMar ASA First quarter
 SalMar ASA First quarter 2009 1 STRONG SALMON PRICES AND SATISFACTORY EARNINGS Strong salmon prices contributed to satisfactory earnings for the SalMar Group in the first quarter 2009. While Scottish Sea
Interim Report Q2-18
 Interim Report Q2-18 HIGHLIGHTS Operational EBIT of NOK 181 million o Operational EBIT per kg of NOK 24.73 in Region North o Operational EBIT per kg of NOK 23.49 in Region South o Non-recurring item of
Lerøy Seafood Group. Quarterly report First quarter May 12th Helge Singelstad. Henning Beltestad. Ivan Vindheim.
 Lerøy Seafood Group Quarterly report First quarter 2010 May 12th 2010 Helge Singelstad Chairman Henning Beltestad CEO Ivan Vindheim CFO 1 Agenda 1. 1 Considerations 2. 2 Key financial figures Q1 2010 3.
Q Financial presentation. CEO - Arne Møgster CFO - Britt Kathrine Drivenes
 Q2 2018 Financial presentation CEO - Arne Møgster CFO - Britt Kathrine Drivenes Highlights All figures in NOK 1,000 Q2 2018 Q2 2017 H1 2018 H1 2017 2017 Revenue 6 001 380 5 019 195 11 754 529 11 094 149
Operating revenue NOK million Operational EBIT NOK million. Harvest volume (HOG) tonnes Q3 09 Q4 09 Q1 10 Q2 10 Q3 10
 tonnes Q3 09 Q4 09 Q1 10 Q2 10 Q3 10") Solid performance in a strong market Strong price achievement and solid results in Norway Return on Capital Employed of 18.9% in the quarter Favourable market balance expected to support a strong market
Solid performance in a strong market Strong price achievement and solid results in Norway Return on Capital Employed of 18.9% in the quarter Favourable market balance expected to support a strong market
Sølvtrans Holding ASA Q Oslo, 7 November Roger Halsebakk, CEO Jon Kvalø, CFO
 Sølvtrans Holding ASA Q3 2012 Oslo, 7 November 2012 Roger Halsebakk, CEO Jon Kvalø, CFO 1 Highlights in the quarter 2 Financial review 3 Operational and market review 4 Summary and outlook 5 Appendix Highlights
Presentation of Cermaq
 Presentation of Cermaq North Atlantic Seafood Seminar Oslo, 8 th March 2012 Agenda Introduction to Cermaq Key results 2011 Focus on Mainstream Chile Outlook 2012 Photograph: Alf Børjesson 2 This is Cermaq
Best Ideas 2018, Hosted by MOI Global Bakkafrost (Oslo:BAKKA) Robert Leitz.
 Robert Leitz.") Best Ideas 2018, Hosted by MOI Global Bakkafrost (Oslo:BAKKA) Robert Leitz www.iolitepartners.com TRADE IDEA: LONG EQUITY BAKKAFROST AT NOK320/SHARE Source: Bakkafrost Best in class, vertically integrated
Best Ideas 2018, Hosted by MOI Global Bakkafrost (Oslo:BAKKA) Robert Leitz www.iolitepartners.com TRADE IDEA: LONG EQUITY BAKKAFROST AT NOK320/SHARE Source: Bakkafrost Best in class, vertically integrated
Lerøy Seafood Group. Preliminary financial figures February 25th Helge Singelstad. Alf-Helge Aarskog. Ivan Vindheim.
 Lerøy Seafood Group Preliminary financial figures 2009 February 25th 2010 Helge Singelstad Chairman Alf-Helge Aarskog CEO Ivan Vindheim CFO 1 Agenda 1. 1 Considerations 2. 2 Key financial figures Q4 2009
INTERIM PRESENTATION Second quarter, 2006
 INTERIM PRESENTATION Second quarter, 6 CEO Yngve Myhre CFO Bent M. Skisaker Agenda Operational Update Group Harvesting Processing Norway and Denmark Strategic considerations and Outlook Financials Income
Lindab Group presentation Q3 2010
 lindab group presentation Lindab Group presentation Q3 2010 David Brodetsky, CEO Nils-Johan Andersson, CFO Agenda Highlights Group Business Areas Strategy Trends and outlook Q & A 2 Lindab Group Highlights
Hafslund ASA 10 July 2014 Finn Bjørn Ruyter, CEO
 Hafslund ASA 1 July 214 Finn Bjørn Ruyter, CEO Second-quarter highlights 214 EBITDA of NOK 624 million up 1 percent on the previous year due to improvements in results within network and power sales. Customer
Third QUARTER / 2017
 STRONG OPERATIONS AND IMPROVING BIOLOGY HIGHLIGHTS IN THE THIRD QUARTER Strong operations and effective management of the improving biological situation Lower production costs and higher prices achieved
Questions - Fishpool seminar Bergen
 Questions - Fishpool seminar Bergen Paul Aandahl, Seafood Analyst, Norwegian Seafood Council 22.11.2018 Global supply Global Trade Estimates Atlantic Salmon Volume wfe Value 2 000 000 1 800 000 1 600 000
Your Aquaculture Technology and Service Partner. Q Presentation Oslo - August 17 th, 2016 Trond Williksen, CEO Eirik Børve Monsen, CFO
 Q2 2016 Presentation Oslo - August 17 th, 2016 Trond Williksen, CEO Eirik Børve Monsen, CFO Agenda 1 Highlights 2 Financial performance 3 Outlook 4 Q&A Highlights Q2 2016 - by CEO Trond Williksen 3 Improved
NIREUS AQUACULTURE S.A.
 Athens Greece 30 May 2013 3 Months 2013 Results Presentation NIREUS AQUACULTURE S.A. Main events 3M 2013 Total Group sales up +1% to 44.6 mi. Exports up +2% to 35.7 mi - 80% of total sales. Cash generation
Financial Data Report LUX ISLAND RESORTS LIMITED (THE GROUP) for the period ending 30.Jun.2015
 for the period ending 30.Jun.2015") Financial Data Report LUX ISLAND RESORTS LIMITED (THE GROUP) for the period ending 30.Jun.2015 Equity Statistics Particulars Units 15-Sep-15 Current Market Price MUR 62.50 52 week H/L* MUR 63.50 / 51.00
Financial Data Report LUX ISLAND RESORTS LIMITED (THE GROUP) for the period ending 30.Jun.2015 Equity Statistics Particulars Units 15-Sep-15 Current Market Price MUR 62.50 52 week H/L* MUR 63.50 / 51.00
Marine Harvest Q Presentation
 Marine Harvest Q1 2015 Presentation Forward looking statements This presentation may be deemed to include forward-looking statements, such as statements that relate to Marine Harvest s contracted volumes,
Results Presentation 3Q17
 Multiexport Foods S.A. Results Presentation 3Q17 Santiago, November 2017 Agenda I. Highlights II. III. Financial Statements Supply, Demand and Prices IV. Farming Operation V. Perspectives 2 Highlights
Cembrit Group Q Unaudited interim report
 Cembrit Group Q4 2017 Unaudited interim report 2017 main events COMMENTARY Strong demand across both markets and product categories resulted in revenue growth of 7.9% YoY 2017 EBITDA showed solid underlying
SMART STEEL. Q Results. Detlef Borghardt, CEO Dr. Matthias Heiden, CFO. August 14, 2018
 SMART STEEL Q2 218 Results Detlef Borghardt, CEO Dr. Matthias Heiden, CFO August 14, 218 Agenda Business Summary Guidance adjustment FY 218 Market update Regional trends: Status and profitability trend
Sølvtrans Holding ASA Q Oslo, 15 May Roger Halsebakk, CEO Jon Kvalø, CFO
 Sølvtrans Holding ASA Q1 2012 Oslo, 15 May 2012 Roger Halsebakk, CEO Jon Kvalø, CFO 1 Highlights in the quarter 2 Financial review 3 Operational and market review 4 Summary and outlook 5 Appendix Highlights
Q Financial presentation. Arne Møgster CEO Britt Kathrine Drivenes CFO
 Q1 2018 Financial presentation Arne Møgster CEO Britt Kathrine Drivenes CFO Highlights All figures in MNOK Q1 2018 Q1 2017 2017 Revenue 5 753 6 075 20 799 EBITDA* 1 445 1 555 4 747 EBIT* 1 217 1 331 3
FOURTH QUARTER / 2014
 SATISFACTORY RESULT DESPITE BIOLOGICAL CHALLENGES HIGHLIGHTS IN THE FOURTH QUARTER 2014 Good salmon prices and high harvested volume produced profit growth and record operating revenues. 50% of the harvested
Shareholder information
 SHAREHOLDER INFORMATION Index 107 07: Shareholder information Share price development in 2010 NOK 65 60 55 50 45 40 35 30 25 Jan. Feb. Mar. Apr. May Jun. Jul. Aug. Sept. Oct. Nov. Dec. Hydro Oslo Børs
Q Financial presentation. CEO - Arne Møgster CFO - Britt Kathrine Drivenes
 Q3 2018 Financial presentation CEO - Arne Møgster CFO - Britt Kathrine Drivenes Highlights All figures in MNOK Q3 2018 Q3 2017 YTD Q3 2018 YTD Q3 2017 2017 Revenue 5 317 4 903 17 072 15 997 20 799 EBITDA*
Villa Organic AS fourth quarter 2012
 Notice to shareholders; Villa Organic AS fourth quarter 2012 Highlights fourth quarter 2012 The average prices were approximately at the same level as Q3, but improvement was observed towards the end of
Harvest volume (GW) tonnes. Operating revenue NOK million. Operational EBIT NOK million Q2 11 Q3 11 Q4 11 Q1 12 Q2 12 Q2 11 Q3 11 Q4 11 Q1 12 Q2 12
 tonnes. Operating revenue NOK million. Operational EBIT NOK million Q2 11 Q3 11 Q4 11 Q1 12 Q2 12 Q2 11 Q3 11 Q4 11 Q1 12 Q2 12") The market showed strong ability to absorb 30% industry growth Prices in line with Q1 - Down 24% in Europe and ~35% in the US compared to Q2 2011 Satisfactory performance in Norway - excellent result in
The market showed strong ability to absorb 30% industry growth Prices in line with Q1 - Down 24% in Europe and ~35% in the US compared to Q2 2011 Satisfactory performance in Norway - excellent result in
NIREUS AQUACULTURE S.A.
 Athens Greece 29 March 2013 12 Months 2012 Results Presentation NIREUS AQUACULTURE S.A. Main events 12M 2012 Total sales up +2.7% to 202.2 mi. Fish sales value up +5.5% to 163 mi., volume up +8.3% to 31.6
Q Presentation. Oslo November 2 nd 2018 Hallvard Muri, CEO Simon Nyquist Martinsen, CFO
 Q3 218 Presentation Oslo November 2 nd 218 Hallvard Muri, CEO Simon Nyquist Martinsen, CFO Agenda Highlights Financial performance Outlook Q&A Highlights Q3 218 by CEO Hallvard Muri Order Intake development
Austevoll Seafood ASA
 Austevoll Seafood ASA Financial report Q2 and H1 2016 INDEX key figures for the group... 03 Q2 2016... 04 Operating segments... 04 Cash Flows, Q2 2016... 06 Financial information, H1 2016... 07 Cash Flow,
Financial Data Report ROGERS AND COMPANY LIMITED (THE GROUP) for the period ending 31.Dec.2017
 for the period ending 31.Dec.2017") Financial Data Report ROGERS AND COMPANY LIMITED (THE GROUP) for the period ending 31.Dec.2017 Equity Statistics Particulars Units 29-Dec-17 Current Market Price MUR 31.30 52 week H/L* MUR 33.00 / 27.00
Financial Data Report ROGERS AND COMPANY LIMITED (THE GROUP) for the period ending 31.Dec.2017 Equity Statistics Particulars Units 29-Dec-17 Current Market Price MUR 31.30 52 week H/L* MUR 33.00 / 27.00
Six good reasons for choosing DNB in the new banking environment
 Six good reasons for choosing DNB in the new banking environment Bank of America Merrill Lynch, 18th Annual Banking & Insurance CEO Conference 2013 24 September, London Rune Bjerke, CEO of DNB 1 Reason
Alternative Performance Measures (APM)/ Non-IFRS Financial Measures. Definitions of Alternative Performance Measures/ Non-IFRS Financial Measures
/ Non-IFRS Financial Measures. Definitions of Alternative Performance Measures/ Non-IFRS Financial Measures") Alternative Performance Measures (APM)/ Non-IFRS Financial Measures Our Alternative Performance Measures (APMs) present useful information which supplements the financial statements. These measures are
Alternative Performance Measures (APM)/ Non-IFRS Financial Measures Our Alternative Performance Measures (APMs) present useful information which supplements the financial statements. These measures are
Executive Board meeting. 14 December 2011
 Executive Board meeting December EU measures ECB Key policy rate has been reduced to. percent Measures: Liquidity operation with a maturity of months Reserve requirements reduced from to per cent Reduced
Alternative Performance Measures (APM) / Non-IFRS Financial Measures. Definitions of Alternative Performance Measures, Non-IFRS Financial Measures
 / Non-IFRS Financial Measures. Definitions of Alternative Performance Measures, Non-IFRS Financial Measures") Alternative Performance Measures (APM) / Non-IFRS Financial Measures Our Alternative Performance Measures (APMs) present useful information which supplements the financial statements. These measures are
Alternative Performance Measures (APM) / Non-IFRS Financial Measures Our Alternative Performance Measures (APMs) present useful information which supplements the financial statements. These measures are
Financial Data Report IBL Limited (THE GROUP) for the period ending 31.Mar.2017
 for the period ending 31.Mar.2017") Financial Data Report IBL Limited (THE GROUP) for the period ending 31.Mar.2017 Equity Statistics Particulars Units 31-Mar-17 Current Market Price MUR 39.65 52 week H/L* MUR 125.00 / 27.20 Market Capitalisation
Financial Data Report IBL Limited (THE GROUP) for the period ending 31.Mar.2017 Equity Statistics Particulars Units 31-Mar-17 Current Market Price MUR 39.65 52 week H/L* MUR 125.00 / 27.20 Market Capitalisation
Harvest volume (GW) tonnes. Operating revenue NOK million. Operational EBIT NOK million Q1 11 Q2 11 Q3 11 Q4 11 Q1 12 Q1 11 Q2 11 Q3 11 Q4 11 Q1 12
 tonnes. Operating revenue NOK million. Operational EBIT NOK million Q1 11 Q2 11 Q3 11 Q4 11 Q1 12 Q1 11 Q2 11 Q3 11 Q4 11 Q1 12") 33 % industry supply growth market prices down 33 % from Q1 2011 Strong demand increased prices from Q4 2011 Strong performance in Scotland Poor results in VAP Europe Operational EBIT of NOK 276 million
33 % industry supply growth market prices down 33 % from Q1 2011 Strong demand increased prices from Q4 2011 Strong performance in Scotland Poor results in VAP Europe Operational EBIT of NOK 276 million
Harvest volume (HOG) tons. Operational EBIT NOK million. Operational revenue NOK million Q2 10 Q3 10 Q4 10 Q1 11 Q2 11 Q2 10 Q3 10 Q4 10 Q1 11 Q2 11
 tons. Operational EBIT NOK million. Operational revenue NOK million Q2 10 Q3 10 Q4 10 Q1 11 Q2 11 Q2 10 Q3 10 Q4 10 Q1 11 Q2 11") Improved price achievement in a falling market Operational EBIT increased 13% ROACE of 26% in the quarter NIBD NOK 5.8 billion after dividend of NOK 2.9 billion High contract share in the second half of
Improved price achievement in a falling market Operational EBIT increased 13% ROACE of 26% in the quarter NIBD NOK 5.8 billion after dividend of NOK 2.9 billion High contract share in the second half of
Financial Data Report ROGERS AND COMPANY LIMITED (THE GROUP) for the period ending 31.Dec.2015
 for the period ending 31.Dec.2015") Financial Data Report (THE GROUP) for the period ending 31.Dec.2015 INVESTMENT Equity Statistics Particulars Units 31-Mar-16 Current Market Price MUR 27.75 52 week H/L* MUR 32.50 / 26.90 Market Capitalisation
Financial Data Report (THE GROUP) for the period ending 31.Dec.2015 INVESTMENT Equity Statistics Particulars Units 31-Mar-16 Current Market Price MUR 27.75 52 week H/L* MUR 32.50 / 26.90 Market Capitalisation
3Q Financial Results Presentation. Manuel Fernandez de Sousa-Faro, Chairman Joaquín Viña Tamargo, CAO & IR
 3Q 211- Financial Results Presentation Manuel Fernandez de Sousa-Faro, Chairman Joaquín Viña Tamargo, CAO & IR Disclaimer This document is purely informative and does not intend to be comprehensive. Financial
A milestone year for BankNordik
 Investor Presentation A milestone year for BankNordik 27 February 2017 Árni Ellefsen, CEO Disclaimer This presentation contains statements regarding future results, which are subject to risks and uncertainties.
Financial Data Report CIEL LTD (THE GROUP) for the period ending 31.Dec.2017
 for the period ending 31.Dec.2017") Financial Data Report CIEL LTD (THE GROUP) for the period ending 31.Dec.2017 Equity Statistics Particulars Units 29-Dec-17 Current Market Price MUR 7.14 52 week H/L* MUR 7.94 / 6.26 Market Capitalisation
Financial Data Report CIEL LTD (THE GROUP) for the period ending 31.Dec.2017 Equity Statistics Particulars Units 29-Dec-17 Current Market Price MUR 7.14 52 week H/L* MUR 7.94 / 6.26 Market Capitalisation