Q BAKKAFROST GROUP Glyvrar 20 May 2014
|
|
|
- Rosamund Blair
- 5 years ago
- Views:
Transcription


1 Q1 014 BAKKAFROST GROUP Glyvrar 0 May 014
2 DISCLAIMER This presentation includes statements regarding future results, which are subject to risks and uncertainties. Consequently, actual results may differ significantly from the results indicated or implied in these statements. No representation or warranty (expressed or implied) is made as to, and no reliance should be placed on, the fairness, accuracy or completeness of the information contained herein. Accordingly, none of the Company, or any of its principal shareholders or subsidiary undertakings or any of such person s officers or employees or advisors accept any liability whatsoever arising directly or indirectly from the use of this document. BAKKAFROST / Q1 PRESENTATION 014 Page


3 SUMMARY OF Q1 014 MARKETS AND SALES SEGMENT INFORMATION GROUP FINANCIALS OUTLOOK

 Revenues of DKK 631 million in")
 Positive results from Farming and Feed, loss on VAP")
 paid out in Q 014 *) Including internal sale of 10,598 tonnes in Q1 014 (10,991")
4 BAKKAFROST THE LARGEST FISH FARMING COMPANY IN THE FAROE ISLANDS Largest salmon farming company in the Faroe Islands ~63% of harvest volumes in Q % of farming licenses Harvested 9,69 tgw in Q1 014 (8,96 tgw in Q1 013) Feed sale of 13,956 tonnes in Q1 014* (14,906 tonnes in Q1 013*) Revenues of DKK 631 million in Q1 014 (DKK 473 million in Q1 013) ~110km Operational EBIT of DKK 186 million in Q1 014 (DKK 105 million in Q1 013) Positive results from Farming and Feed, loss on VAP Dividend of DKK 4.50 per share (NOK 4.98) paid out in Q 014 *) Including internal sale of 10,598 tonnes in Q1 014 (10,991 tonnes in Q1 013) BAKKAFROST / Q1 PRESENTATION 014 Page 4
5 SUMMARY OF THE QUARTER Highest margin ever Farming division increased margin from to.51 NOK/kg Strong salmon prices and higher volumes main reason for higher operational EBIT Operational EBIT increased by 77%, while volumes increased by 1% only Decreased EBITDA in FOF compared to Q1 013 due to optimal timing of purchase of raw material for feed production in Q1 013 (DKK million) Q1 014 Q Operating revenues , ,855.5 Operational EBITDA Operational EBIT Profit for the period Operational EBITDA margin 33.0% 6.6% 7.0% 1.7% Operational EBIT margin 9.4%.% 3.6% 17.4% Operational EBIT/Kg (Farming) (NOK) Operational EBIT/Kg (Farming and VAP) (NOK) Operational EBIT/Kg (VAP) (NOK) EBITDA margin (Fishmeal, oil and feed) 1.45% 15.75% 11.61% 9.50% BAKKAFROST / Q1 PRESENTATION 014 Page 5


6 SUMMARY OF THE QUARTER Market Tight market and high prices Strong demand d despite high h prices Operation Harvested volumes higher in Q1 014 compared to Q1 013 Transferred 3.0 million smolts in Q1 014 No further ISA virus detected and no suspicion of ISA Biology good and stable BAKKAFROST / Q1 PRESENTATION 014 Page 6


7 SUMMARY OF Q1 014 MARKETS AND SALES SEGMENT INFORMATION GROUP FINANCIALS OUTLOOK
8 GLOBAL MARKETS Spot prices on fresh salmon 4-5 [NOK/kg HOG] The global supply of salmon increased 4% in Q1 014 compared with Q1 013 The salmon prices have increased to the highest level for the past 10 years - due to high demand and low supply growth The NASDAQ salmon price increased in Q1 014 by ~9% compared with Q from 36.4 to NOK/kg The increase was 13% from Q4 013 to Q1 014, from to NOK/kg 531NOK 5.31 up per kg 55,000 50,000 45,000 40,000 35,000 30,000 5,000 0, ,000 10, Change in global market supply and market price 80% 60% 40% 0% 0% -0% -40% Change in global market supply of farmed Atlantic salmon from the previous year Change in European spot prices - fresh Atlantic salmon (FishPool index) from the previous year -60% Source: Kontali Analyse BAKKAFROST / Q1 PRESENTATION 014 Page 8
9 MARKETS & SALES Overseas High-End markets also dominated Q1 014 Strong demand from the US market The Eastern European market is suffering during periods with high salmon prices EU market most important market for VAP products, but not for fresh whole salmon Sales Q1 Q1 by markets EU 47% 4% 47% 50% USA 6% % 19% 16% Asia 1% 34% 7% 19% Eastern Europe 6% % 6% 15% Contract share, VAP products [% of qty] VAP/contract share 55% of total volume in Q1 014 due to seasonal low harvest in the quarter Estimate for the year 40-45% VAP of total harvest. 100% 80% 60% 45% 49% 56% 64% 40% 0% 55% 51% 44% 36% 0% Q1 014 Q VAP on contract HOG, spot BAKKAFROST / Q1 PRESENTATION 014 Page 9
10 A MARKET IN BALANCE IN 014, AND NO G ROWTH EXPECTED IN 015 We expect a back-end loaded total global supply growth of 8% in 014 and 0% in 015 Norway is expected to increase volumes by 7% in 014 due to mild weather Chile is expected to increase production by 13% in 014 Growth in supply of 7% has historically led to unchanged prices. Average NOS price in 013 was NOK Global supply of Atlantic Salmon (head on gutted - HOG) E 014E 015E Norway UK Ireland Faroes Total Europe Chile Canada USA Total Americas Other Total (Sold Quantity) Supply growth - Global Supply growth - Europe Supply growth - Americas % 16% 43% % 3% 18% % 7% 10% % 1% 4% Source: Kontali & Bakkafrost BAKKAFROST / Q1 PRESENTATION 014 Page 10
11 DEMAND DEVELOPMENT SPLIT BY MARKE TS Growth in supply of 4% in Q1 014 Strong demand from : USA, Japan, Greater China, ASEAN and Latin America Weakening demand from: Russia and Ukraine EU largest salmon market Salmon markets, sold quantity (head on gutted - HOG) Estimated volumes Q1 comparison Markets Q1 014 E Q1 013 Volume % EU % USA % Russia % Japan % Greater China % ASEAN % Latin America % Ukraine % Other markets % Total all markets % Salmon markets, sold quantity (head on gutted - HOG) Estimated volumes FY comparison Markets FY 013 FY 01 Volume % EU % USA % Russia % Japan % Greater China % ASEAN % Latin America % Ukraine % Other markets % Greater China = China / Hong Kong / Taiwan ASEAN = Association of Southeast Asian Nations Latin America (including both Mexico and Caribbean + domestic consumption in Chile) Total all markets % All figures above are in tonnes hog, and are rounded to the nearest 100 tonnes. Note that not all countries have published export/import statistics i for December and dq4fi figures may be adjusted d Source: Kontali BAKKAFROST / Q1 PRESENTATION 014 Page 11


12 SUMMARY OF Q1 014 MARKETS AND SALES SEGMENT INFORMATION GROUP FINANCIALS OUTLOOK
13 FARMING HARVEST VOLUME Harvested volumes Harvested volumes increased by 1% Harvest primarily from the West region in the quarter Smolt transfer Smolt transfer 3.0 million pieces (Q ) million Smolt release all months during the year due to favourable seawater temperatures Seawater temperature in the Faroe Islands In the same range as last year Harvest Volume Q1 Q1 tonnes [HOG] West 8,948 3,939 1,065 0,847 North 31 4,357 9,03 3,494 Total 9,69 8,96 41,68 44,341 Faroe Farming* 0 0 0,557 Gross harvested 9,69 8,96 41,68 46,898 1,0 11,0 10,0 9,0 Seawater Temperatures in the Faroe Islands [ C] Volumes in Faroe Farming for 01 included as Faroe Farming was discontinuing operation 8,0 7,0 6,0 5,0 Jan Feb Mar Apr May Jun Jul Aug Sep Oct Nov Dec Min Max BAKKAFROST / Q1 PRESENTATION 014 Page 13
14 FARMING OPERATIONAL PERFORMANCEE Revenues and margin Revenues increased % and volumes increased 1% Q1 Q1 (DKK million) Operating revenues Operational EBIT , ,37 74 Operational EBIT margin increased from 9% to 36% in Q1 014 Operational EBIT margin 36% 9% 3% 0% High salmon prices Good biological situation and satisfying costs on harvested fish (NOK/kg) Q1 014 Farming Farming North Farming West Farming Operational EBIT/kg gwt BAKKAFROST / Q1 PRESENTATION 014 Page 14
15 FARMING OPERATIONAL PERFORMANCEE Margin - EBIT per kg total harvested quantity [NOK/kg] Operation EBIT/kg increase by NOK 7.56 equivalent to 51% in the quarter Harvested fish from the sites in Sundalagið with good biological and financial performance No signs of Neoparamoeba perurans and no signs of ISA routine surveillance continues according to the Faroese farming model Q1 014 Q BAKKAFROST / Q1 PRESENTATION 014 Page 15
16 SEGMENT VAP Revenues and margin Revenues increased 56%, while volume increased 37% Loss in VAP due to high raw material prices in the spot market 40-45% of total harvested volumes in 014 is expected to be sold as VAP on contracts Q1 Q1 (DKK million) Operating revenues Operational EBIT Operational EBIT margin -4% -16% -14% 7% VAP produced 5,831 4,5 18,333 16,054 volumes (tgw) Margin - EBIT per kg total harvested quantity [NOK/kg] 3,00,00 1,00 0,00-1,00 -, Q1 014 Q ,00-4,00-5,00-6,00 BAKKAFROST / Q1 PRESENTATION 014 Page 16


17 SEGMENT VAP Strategy Bakkafrost s strategy is to sell around 50% of our products as VAP products directly to end markets in Europe and US Contracts are normally between 6 and 1 months Margin - EBIT per kg total harvested quantity [NOK/kg] Losses during periods with high increase in spot prices and gains during periods with drop in spot prices VAP EBIT FARMING EBIT Contract prices increased significantly in Q1 014 to highest level ever for the past 18 years VAP Products, sales prices and volumes 75-80% of the VAP capacity for 014 contracted BAKKAFROST / Q1 PRESENTATION 014 Page 17

 Q1 014 Q1 013 013 01 Operating revenues 178 157 1,083 889 EBITDA 5 16 85 EBITDA Margin 1.45% 15.75% 11.61% 9.")
18 SEGMENT FISHMEAL, OIL AND FEED (FOF) Improved raw material situation. Intake of 44 thousand tonnes in Q1 014, compared with 31 thousand tonnes in Q1 013 EBITDA margin decreased from 15.75% to 1.45% due to favourable timing in Q1 013 on sourcing of raw material Sale in 014 in line with expectations, but lower than in Q1 013 due to increased competition Fishmeal, Oil and Feed (DKK million) Q1 014 Q Operating revenues , EBITDA EBITDA Margin 1.45% 15.75% 11.61% 9.50% Sale of feed (tonnes)* 13,956 14,906 85,333 91,398 * Including sale to Bakkafrost corresponding to ~76% of feed volumes in Q1 014 (Q1 013: 74%) BAKKAFROST / Q1 PRESENTATION 014 Page 18


19 OWNERSHIP IN FF SKAGEN Two step transaction Purchased majority of Hanstholm Fiskemelsfabrik Sold Hanstholm Fiskemelsfabrik to FF Skagen Ownership now 17% in FF Skagen Why sell Hanstholm to FF Skagen Hanstholm Fiskemelsfabrik unprofitable Necessary for consolidation in the region Access to important raw materials BAKKAFROST / Q1 PRESENTATION 014 Page 19
20 OWNERSHIP IN PELAGOS Pelagos a new processing plant next to Havsbrún 30% ownership together with two pelagic fishing companies Access to off cuts and downgraded fish Reduced transportation costs of raw material Pelagos Commence production in July 014 Capacity to process 650 tonnes per day A total investment of DKK 0 million for the plant BAKKAFROST / Q1 PRESENTATION 014 Page 0
21 SUMMARY OF Q1 014 MARKETS AND SALES SEGMENT INFORMATION GROUP FINANCIALS OUTLOOK
22 GROUP PROFIT AND LOSS Revenue up 33% corresponding to DKK 158 million) due to: Improved market prices for salmon (spot and VAP) Harvest volumes up 1% Operating EBIT increased by 76% from DKK 105 million to DKK 185 million in Q1 014 Decrease in fair value of biomass due to lower salmon prices Reversal of provision for onerous contracts due to lower spot prices than at year end 013 Profit after tax increased from DKK 67 million to DKK 87 million in Q1 014 (DKK million) Operating revenues ,491 1,855 Operational Operational EBIT* Fair value adjustment on biological assets Onerous contracts Income from associates Loss from sale of subsidiary EBIT Net Financial items EBT Taxes Q1 014 Q EBITDA* Profit for the period continuing operations Profit for the period discontinuing operations Profit for the period Operational EBITDA margin 33% 7% 7% % Operational EBIT margin 9% % 4% 17% Operational EBIT/Kg (Farming and VAP) (NOK) EBITDA margin (fishmeal, oil and feed) 1.45% 15.75% 11.61% 9.50% BAKKAFROST / Q1 PRESENTATION 014 * Operational EBITDA and EBIT adjusted for non-operational related items, such as fair value adjustment of biomass, onerous contracts, income/loss from associates etc. Page
23 BALANCE SHEET Investments in PPE of DKK ~18 million in Q1 014 Financial assets increased due to investment in pelagic processing plant (Bakkafrost owns 30%) Financial assets increased due to positive operation in Faroe Farming Lower fair value due to lower biomass at sea and lower salmon prices Equity increased as a result of positive operations. Dividend is paid out in Q 014 NIBD at DKK 503 million down from DKK 641 million at end 013* Equity ratio 57% (Covenants 40%) * Incl. unrealised losses and deposits on financial derivatives (D DKK million) End Q Intangible assets Property, plant and equipment Financial assets Long term receivables 1 Biological assets Inventory Receivables Other receivables 91 1 Cash and cash equivalents Total Assets 3,065 3,11 Equity 1,760 1,665 Deferred tax and other taxes Long term interest bearing debt Financial derivatives Short term interest bearing debt Account and other payables Total Equity and Liabilities 3,065 3,11 BAKKAFROST / Q1 PRESENTATION 014 Page 3
24 CASH FLOW Positively affected cash flow from operations due to higher salmon prices Q1 Q1 (DKK million) Cash flow from operations Cash flow from investments t Cash flow from financing Cash flow from investments represents investments in property plant and equipment and investments t in pelagic processing plant (associated company) Net change in cash Cash at the end of the period Undrawn facilities Undrawn loan facility of DKK 804 million of which DKK 16 million is restricted BAKKAFROST / Q1 PRESENTATION 014 Page 4
25 DIVIDEND Dividend Dividend of DKK 4.50 (NOK ~4.98) per share paid out in April % 99% DPS in % of adj. EPS * Bakkafrost purchased treasury shares in 013, equivalent to DKK 0.59 (NOK 0.66) per share. 90% 80% Dividend incl. the acquisition of treasury shares is DKK 5.09 (NOK ~5.64) Dividend policy Competitive return through: Dividends Increase in the value of the equity Generally the company shall pay dividendsid d to its shareholders A long-term goal for the Board of Directors is that 30 50% of EPS shall be paid out as dividend 70% 60% 50% 40% 30% 0% 10% 0% 49%** 49%** 40% 19% * Operational EBIT is EBIT adjusted for fair value adjustment of biomass, onerous contracts, income/loss from associates, acquisition costs and badwill ** Dividend and acquisition of treasury shares BAKKAFROST / Q1 PRESENTATION 014 Page 5


26 PROPOSED TAX INCREASES APPROVED BY PARLIAMENT Licence tax on farming companies in the Faroes* Approved by the parliament in May 014 From a provisional tax to a permanent tax Licence tax of: 4.5% on taxable income 0.5% on farming revenues Effect on Q1 014 compared to 013 tax rates estimated to: Tax payable increases by DKK 5 million Deferred tax increases by DKK 51 million as the new tax is permanent * For 014 a provisional extra tax of 7% was implemented, compared to the.5% for 013. The provisional 7% tax has been changed to a permanent 4.5% tax and a permanent 0.5% tax on revenues. The change from a provisional to a permanent tax affects deferred tax. BAKKAFROST / Q1 PRESENTATION 014 Page 6


27 SUMMARY OF Q1 014 MARKETS AND SALES SEGMENT INFORMATION GROUP FINANCIALS INVESTMENTS OUTLOOK
28 OUTLOOK Market More salmon expected in the market during the summer Forward prices for the rest of 014 are around NOK per kg Global l supply growth estimated t to 8% in 014 Farming Estimated t harvest volumes unchanged at 45,000-48,000 tonnes HOG in 014 Expected smolt release in 014 unchanged at 11.6 million pieces VAP Around 75-80% of the VAP capacity for 014 contracted Contracted unsold volumes corresponds to 30% of remaining estimated harvested volumes in 014 Contract prices on a significant higher level than in 013 Fishmeal, oil and Feed Forecast for Feed sales 83,000-87,000 tonnes in 014 Business development Optimise the Value Chain according to the announced investment plan Pursue Organic Growth Financial flexibility enables M&A Biology Good biology and fish health Good biological performance and results BAKKAFROST / Q1 PRESENTATION 014 Page 8


29 THANK YOU!
 Home rule within the Kingdom of")
 Key sectors (% of wage earners, 014)")

: 7,075")
 GDP/capita: DKK 8,000 (01) (Norway:")

 Corporate Tax: 18% Farming Licence Tax : 4.")

30 FAROE ISLANDS 18 islands 1,387 km 48,88 inhabitants (February 8 014) Home rule within the Kingdom of Denmark Part of the Danish monetary union, Danish krone (DKK) Key sectors (% of wage earners, 014) Service/public admin.: ~40% Private service: ~31% Construction: ti ~1% Fishing : ~17% Unemployment rate (Feb 014): 4.3% Total working force (no of people Feb 014): 7,075 GDP: DKK 13.6 bn (01) GDP/capita: DKK 8,000 (01) (Norway: 300,000) (010) Total export of fish products (013) DKK 5,766 million whereof farmed fish accounts for 4.5% TAXES Total Percent of GDP: 44.8% (01) Corporate Tax: 18% Farming Licence Tax : 4.5% plus 0.5% of revenues Restriction on a single foreign ownership of 0% in farming companies One company may max. control 50% of licences in the Faroe Isl ands BAKKAFROST / Q1 PRESENTATION 014 Source: Hagstova Føroya Page 30
31 BAKKAFROST S VALUE CHAIN Fishmeal & Oil Feed Hatchery Farming Wellboat Harvest Value Added Products Sales One of the most vertical integrated salmon farming companies in the world Full traceability to the benefit of our customers 45 years of experience Focus on cost centres Vertical integration reduces operational and financial risk A market focused company with own sale and marketing department t BAKKAFROST / Q1 PRESENTATION 014 Page 31
32 MONTHLY EXCHANGE RATES MONTHLY EXCHANGE RATES NOK/DKK US NOK/DKK US M11 01M01 01M03 01M05 01M07 01M09 01M11 013M01 013M03 013M05 013M07 013M09 013M11 014M01 014M03 011M11 01M01 01M03 01M05 01M07 01M09 SEK/DKK JP SEK/DKK 7 8 JP M11 01M01 01M03 01M05 01M07 01M09 01M11 013M01 013M03 013M05 013M07 013M09 013M11 014M01 014M M11 01M01 01M03 01M05 01M07 01M09 01M11 BAKKAFROST / Q1 PRESENTATION 014 SD/DKK GBP/DKK SD/DKK GBP/DKK M09 01M11 013M01 013M03 013M05 013M07 013M09 013M11 014M01 014M03 011M11 01M01 01M03 01M05 01M07 01M09 01M11 013M01 013M03 013M05 013M07 013M09 013M11 014M01 014M03 Y/DKK RUB/DKK Y/DKK RUB/DKK M11 013M01 013M03 013M05 013M07 013M09 013M11 014M01 014M03 011M11 01M01 01M03 01M05 01M07 01M09 01M11 013M01 013M03 013M05 013M07 013M09 013M11 014M01 014M03 Page 3
33 FAROE ISLANDS EXCELLENT CONDITIONS FOR COST EFF ECTIVE FARMING GEOGRAPHY WATER LOCATION Natural growth area for wild salmon Faroese fjords provide separation between locations Improves biological control and area management Stable seawater temperatures throughout the year between 6-1 degrees Celsius Excellent water quality and circulation cond itions Efficient distribution to European, US and Far Eastern markets Average Seawater Temperatures ºC Faroe Islands Norway (Trøndelag) 8 6 BIOMASS Biological sustainability setting the biomasss target per license 4 Jan Feb Mar Apr May Jun Jul Aug Sep Oct Nov Dec Source: Company material, Havforskningsinstituttet FEED Sustainable feed, based on local marine raw materials. High on Omega-3, proved track record with best performance on high SGR and low FC CR BAKKAFROST / Q1 PRESENTATION 014 Page 33
34 BAKKAFROST - PREPARING FOR THE FUTURE Fishmeal & Oil Feed Hatchery Farming Wellboat Harvest Value Added Products Sales The investments will be made step by step in the relevant parts in the value chain to secure: Efficiency Biological i l risk Organic growth BAKKAFROST / Q1 PRESENTATION 014 Page 34


35 INVESTMENTS - PREPARING FOR THE FUTURE INVESTMENTS DKK 80 million DKK 80 million DKK 170 million DKK 170 million BAKKAFROST / Q1 PRESENTATION 014 Page 35
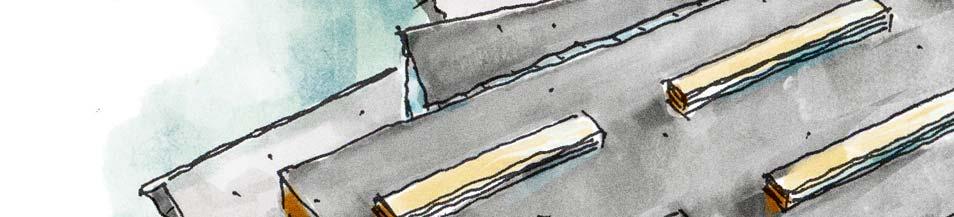
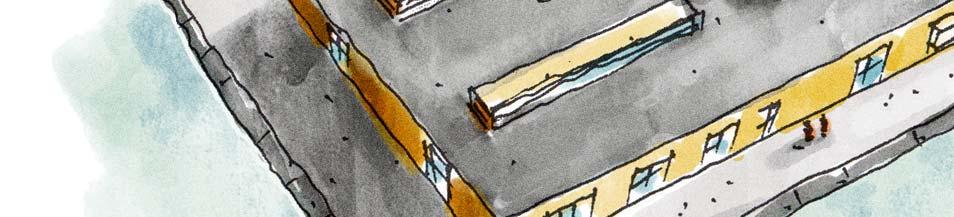

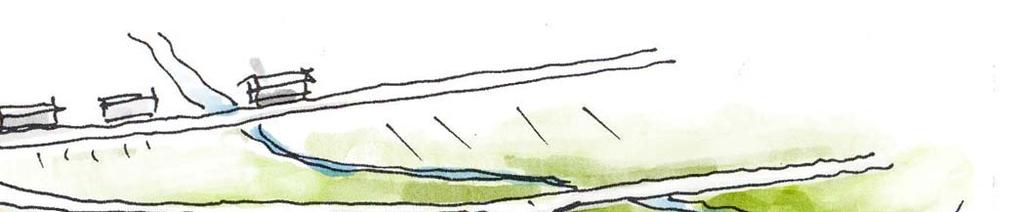
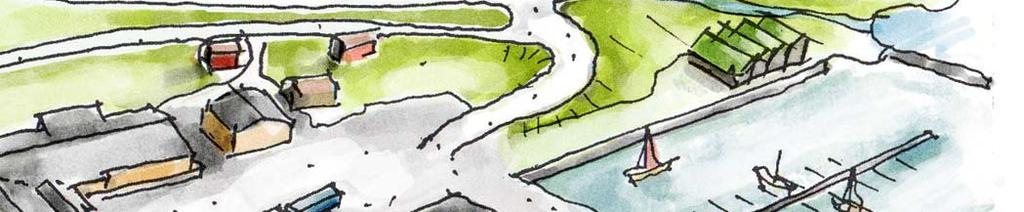
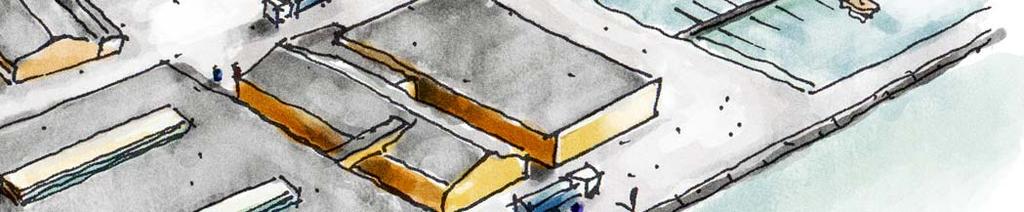

36 BAKKAFROST - PREPARING FOR THE FUTURE Phase 3: New VAP operation Draft of new plant factories merged into one BAKKAFROST / Q1 PRESENTATION 014 Page 36


37 BAKKAFROST - PREPARING FOR THE FUTURE Financing of the investments Use free cash flow from operation Unused financing of DKK 804 million Partly new financing if advantageous Unchanged dividend id d policy BAKKAFROST / Q1 PRESENTATION 014 Page 37
38 FINANCING Financing of the Group Total funding to DKK ~ 1,38 million Bonds NOK 500 million due Feb 018 (swapped into DKK) Instalment loan of DKK 300 million, repayable with DKK 5 million each quarter Revolving credit facility of DKK 553 million due in 017 NIBD end Q1 014: DKK 678 million NIBD and NIBD available and funding avaible funding Covenant loans NIBD/ EBITDA max 3.5 over 1 months ( Bonds 4.0) Equity ratio of 40.0% NIDB Available funding BAKKAFROST / Q1 PRESENTATION 014 Page 38
39 DEVELOPMENT PER QUARTER Q1 01 Q1 014 (mdkk) Q1 014 Q4 013 Q3 013 Q 013 Q1 013 Q4 01 Q3 01 Q 01 Q1 01 Revenue Op. EBIT Profit/Losss Harvest (tgw) 9,69 11,097 11,335 10,540 8,96 13, 044 9,730 10,19 11,348 Op. EBIT Farming & VAP (NOK/kg) Equity ratio 57% 54% 5% 49% 48% 49% 47% 47% 43% NIBD Turnover (mdkk) Operational EBIT (mdkk) Farming margin Op. EBIT (NOK/kg) Turnover for Bakkafrost group Operational EBIT for Bakkafrost has increased from 80 mdkk Group has increased from 47 mdkk in 010 to.5 bdkk in 013 in 010 to 587 mdkk in 013 The margin in Farming was 15 NOK in 013 the highest ever. Even in 01, when the global supply increased by %, the company had a margin of 7.3 NOK/kg BAKKAFROST / Q1 PRESENTATION 014 Page 39


40 LARGEST SHAREHOLDERS 0 largest shareholders Share price development since listing in NOK No of shares share Name Oi Origini ,5% JACOBSEN Oddvør Faroe Isl ,3% JACOBSEN Regin Faroe Isl ,1% TF ÍLØGUR P/F Faroe Isl ,0% SKANDINAVISKA ENSKILDA BANKEN AB Sweeden ,% J.P. MORGAN CHASE BANK N.A. LONDON UK ,% J.P. MORGAN LUXEMBOURG S.A. UK ,0% JP MORGAN CHASE BANK, NA Norway ,9% J.P. MORGAN CHASE BANK N.A. LONDON UK ,6% J.P. MORGAN CHASE BANK N.A. LONDON UK ,5% VERDIPAPIRFONDET HANDELSBANKEN Norway ,5% SKANDINAVISKA ENSKILDA BANKEN AB Norway ,5% SEB PRIVATE BANK S.A. (EXTENDED) Lux ,5% 5%STATESTREET STREET BANK AND TRUST CO. USA ,5% NORDEA NORDIC SMALL CAP FUND UK ,4% CACEIS BANK FRANCE France ,3% STATE STREET BANK AND TRUST CO USA ,3% SKANDINAVISKA ENSKILDA BANKEN A/S Denmark ,3% PICTET & CIE (EUROPE) S.A. Lux ,0% KATRIN DAHL JAKOBSEN Faroe Isl ,0% HOLTA INVEST AS Norway ,4% Total share 0 largest shareholders Total number of outstanding shares as per May 13th Total number of shares as per May 13th ,8% Whereof own shares Last 1 months Origin of shareholders, 5 largest countries No of shares share No of shareholders ,9% Faroe Isl ,% UK ,5% Norway ,5% USA ,3% Sweeden 1 Total number of shareholders:,301 - from 3 different countries Subscribe Oslo Stock Exchange Releases from BAKKA by on: p BAKKAFROST / Q1 PRESENTATION 014 Page 40
Q BAKKAFROST GROUP Oslo 20 February 2018
 BAKKAFROST GROUP Oslo 20 February 2018 DISCLAIMER This presentation includes statements regarding future results, which are subject to risks and uncertainties. Consequently, actual results may differ significantly
Q THIRD QUARTER BAKKAFROST GROUP Glyvrar 5 November 2013
 Q3 2013 THIRD QUARTER BAKKAFROST GROUP Glyvrar 5 November 2013 DISCLAIMER This presentation includes statements regarding future results, which are subject to risks and uncertainties. Consequently, actual
Q BAKKAFROST GROUP Oslo February 24 th 2015
 Q4 2014 BAKKAFROST GROUP Oslo February 24 th 2015 DISCLAIMER This presentation includes statements regarding future results, which are subject to risks and uncertainties. Consequently, actual results may
Q BAKKAFROST GROUP Glyvrar 28 October 2014
 Q3 2014 BAKKAFROST GROUP Glyvrar 28 October 2014 DISCLAIMER This presentation includes statements regarding future results, which are subject to risks and uncertainties. Consequently, actual results may
Q BAKKAFROST GROUP Oslo 19 February 2019
 BAKKAFROST GROUP Oslo 19 February 2019 DISCLAIMER This presentation includes statements regarding future results, which are subject to risks and uncertainties. Consequently, actual results may differ significantly
Dette billede kan ikke vises i øjeblikket. Q FOURTH QUARTER BAKKAFROST GROUP Glyvrar 25 February 2014
 Dette billede kan ikke vises i øjeblikket. Q4 2013 FOURTH QUARTER BAKKAFROST GROUP Glyvrar 25 February 2014 DISCLAIMER This presentation includes statements regarding future results, which are subject
Q BAKKAFROST GROUP Oslo 10 May 2016
 2016 BAKKAFROST GROUP Oslo 10 May 2016 DISCLAIMER This presentation includes statements regarding future results, which are subject to risks and uncertainties. Consequently, actual results may differ significantly
Q BAKKAFROST GROUP New York 19 May 2016
 2016 BAKKAFROST GROUP New York 19 May 2016 DISCLAIMER This presentation includes statements regarding future results, which are subject to risks and uncertainties. Consequently, actual results may differ
Q BAKKAFROST GROUP Oslo 21 August 2018
 BAKKAFROST GROUP Oslo 21 August DISCLAIMER This presentation includes statements regarding future results, which are subject to risks and uncertainties. Consequently, actual results may differ significantly
Presentatio. on Q3 2010
 Presentatio on Q3 2010 CEO Regin Jacobsen CFO Teitur Samuelsen Oslo November 9 th 2010 Disclaimer This presentation includes statements regarding future results, which are subject to risks and uncertainties.
PRESENTATION Q CEO Regin Jacobsen / CFO Teitur Samuelsen Oslo November 6 th 2012
 PRESENTATION Q3 2012 CEO Regin Jacobsen / CFO Teitur Samuelsen Oslo November 6 th 2012 DISCLAIMER This presentation includes statements regarding future results, which are subject to risks and uncertainties.
BAKKAFROST INTRAFISH SEAFOOD INVESTOR FORUM London 13 September 2018
 BAKKAFROST INTRAFISH SEAFOOD INVESTOR FORUM London 13 September 2018 DISCLAIMER This presentation includes statements regarding future results, which are subject to risks and uncertainties. Consequently,
P/F Bakkafrost Condensed Consolidated Interim Report for Q and 9 months 2013
 P/F Bakkafrost Condensed Consolidated Interim Report for Q3 2013 and 9 months 2013 15000 10000 5000 0 Harvest volume - TGW Q3 12 Q4 12 Q1 13 Q2 13 Q3 13 Operational EBIT mdkk 200 150 100 50 0 Q3 12 Q4
15,000 12, , , , ,158 13,004 12, , ,664
 15,000 12,000 13,004 10,934 12,940 13,158 10,664 350 307 300 9,000 335 255 254 30 26.34 21.58 22.26 23.22 16 Q2 16 Q3 16 24.33 20 200 6,000 10 100 3,000 0 400 16 Q2 16 Q3 16 Q4 16 17 0 16 Q2 16 Q3 16 Q4
P/F Bakkafrost. Condensed Consolidated Interim Report for Q and 12 Months Operational EBIT mdkk
 P/F Bakkafrost Condensed Consolidated Interim Report for Q4 2015 and 12 Months 2015 Harvest volume TGW 15,000 12,000 9,000 6,000 3,000 Q4 14 Q1 15 Q2 15 Q3 15 Q4 15 Operational EBIT mdkk 300 250 200 150
Marine Harvest. Q Presentation 10 May 2017
 Marine Harvest Q1 2017 Presentation 10 May 2017 1 Forward looking statements This presentation may be deemed to include forward-looking statements, such as statements that relate to Marine Harvest s contracted
Q November 9th. Lerøy Seafood Group ASA. CEO Henning Beltestad CFO Sjur S. Malm
 Q3 2017 November 9th Lerøy Seafood Group ASA CEO Henning Beltestad CFO Sjur S. Malm Agenda Highlights Key financial figures Outlook Q3 2017 EBIT before FV adj. NOK 861 million Harvest volume 46 024 GWT
Marine Harvest. Q Presentation 24 August 2017
 Marine Harvest Q2 2017 Presentation 24 August 2017 1 Forward looking statements This presentation may be deemed to include forward-looking statements, such as statements that relate to Marine Harvest s
Marine Harvest. Q Presentation 1 November 2017
 Marine Harvest 1 Q3 2017 Presentation 1 November 2017 Forward looking statements This presentation may be deemed to include forward-looking statements, such as statements that relate to Marine Harvest
PRESENTATION Q Oslo, 19 February 2013 John Binde, CEO Ola Loe, CFO
 PRESENTATION Q4 2012 Oslo, 19 February 2013 John Binde, CEO Ola Loe, CFO AGENDA: Highlights for the period Segment information Group financials Outlook 2 Highlights in Q4 2012: Significant improvement
Q May 12th Oslo
 Q1 2016 May 12th Oslo Lerøy Seafood Group ASA CEO Henning Beltestad CFO Sjur S. Malm Agenda Highlights Key financial figures Outlook Q1 2016 EBIT before FV adj. NOK 584.5 million EBIT/kg all inclusive
Marine Harvest. Q Presentation 22 August 2018
 Marine Harvest Q2 2018 Presentation 22 August 2018 Forward looking statements This presentation may be deemed to include forward-looking statements, such as statements that relate to Marine Harvest s contracted
Q NOVEMBER 8TH 2018
 Q3 2018 NOVEMBER 8TH 2018 1. Highlights 2. Key Financial Figures 3. Outlook Highlights Klikke for å legge til annet bilde Q3 2018 - EBIT before FV adj. NOK 660 million - Harvest volume 37 227 GWT - EBIT/kg
Marine Harvest. Q Presentation 14 February 2018
 Marine Harvest Q4 2017 Presentation 14 February 2018 1 Forward looking statements This presentation may be deemed to include forward-looking statements, such as statements that relate to Marine Harvest
Q August 24th. Lerøy Seafood Group ASA. CEO Henning Beltestad CFO Sjur S. Malm
 Q2 2017 August 24th Lerøy Seafood Group ASA CEO Henning Beltestad CFO Sjur S. Malm Agenda Highlights Key financial figures Outlook Q2 2017 EBIT before FV adj. NOK 801 million Harvest volume 26 156 GWT
Q MAY 8TH 2018
 Q1 2018 MAY 8TH 2018 1. Highlights 2. Key Financial Figures 3. Outlook Highlights Klikke for å legge til annet bilde Q1 2018 - EBIT beforefv adj. NOK 960 million - Harvest volume 37576 GWT - EBIT/kg all
THIRD QUARTER / 2018
 REPORT FOR THE THIRD QUARTER 2018 HIGHLIGHTS Operationally strong quarter, with cost improvements and good price achievement. Record-high volume for sales & processing with positive contribution Total
PRESENTATION Q Oslo, 14 November 2012 John Binde, CEO Ola Loe, CFO
 PRESENTATION Q3 2012 Oslo, 14 November 2012 John Binde, CEO Ola Loe, CFO AGENDA: Highlights for the period Segment information Group financials Outlook 2 Highlights in Q3 2012: Strong consumption growth
P/F BAKKAFROST.
 P/F BAKKAFROST ANNUAL AND CONSOLIDATED REPORT AND ACCOUNTS YEAR TO 31 DECEMBER 2010 www.bakkafrost.com KEY FIGURES (DKK 1,000) IFRS IFRS IFRS FO-GAAP Profit and loss 2010 2009 2008 2007 Operating revenues
ANNUAL REPORT Faroese Company Registration No. 1724
 ANNUAL REPORT 2017 www.bakkafrost.com Faroese Company Registration No. 1724 2 Contents Chairman s Statement 4 Statement by the Management and the Board of Directors 6 Outlook 8 Bakkafrost at a Glance 10
Weekly Salmon Outlook Week
 Week 10-20 Page 1 of 8 Harvest of Atlantic salmon in Norway continued to grow in week 9. The harvest volume (23 000 tonnes wfe) was up 1000 tonnes from the previous week and 3% higher than in the corresponding
Marine Harvest Q Presentation
 Marine Harvest Q2 2015 Presentation Forward looking statements This presentation may be deemed to include forward-looking statements, such as statements that relate to Marine Harvest s contracted volumes,
NORWAY ROYA L S A L M ON PRESENTATION Q Oslo, 7 November 2017 Charles Høstlund, CEO Ola Loe, CFO 1
 PRESENTATION Q3 2017 Oslo, 7 November 2017 Charles Høstlund, CEO Ola Loe, CFO 1 AGENDA: Highlights for the period Segment information Group financials Markets Outlook 2 Highlights in Q3 2017 Operational
Presentation of Cermaq
 Presentation of Cermaq North Atlantic Seafood Seminar Oslo, 8 th March 2012 Agenda Introduction to Cermaq Key results 2011 Focus on Mainstream Chile Outlook 2012 Photograph: Alf Børjesson 2 This is Cermaq
ANNUAL REPORT. Faroese Company Registration No BAKKAFROST 1 ANNUAL REPORT 2016
 ANNUAL REPORT 2016 www.bakkafrost.com Faroese Company Registration No. 1724 BAKKAFROST 1 ANNUAL REPORT 2016 Table of Contents Chairman s Statement 4 Statement by the Management and the Board of Directors
Highlights for the quarter Q2 / EBIT NOK 60 million pre biomass write-down
 Half year report Highlights for the quarter EBIT NOK 60 million pre biomass write-down EBIT pre fair value and biomass write-down (NOK million) 318 348 300 101 60 Mainstream results negatively impacted
Interim Report Q2-18
 Interim Report Q2-18 HIGHLIGHTS Operational EBIT of NOK 181 million o Operational EBIT per kg of NOK 24.73 in Region North o Operational EBIT per kg of NOK 23.49 in Region South o Non-recurring item of
PRESENTATION Q Oslo, 26 February 2014 John Binde, CEO Ola Loe, CFO
 PRESENTATION Q4 2013 Oslo, 26 February 2014 John Binde, CEO Ola Loe, CFO AGENDA: Highlights for the period Segment information Group financials Outlook 2 Highlights in Q4 2013: The best quarterly and yearly
PRESENTATION Q Oslo, 15 August 2013 John Binde, CEO Ola Loe, CFO
 PRESENTATION Q2 2013 Oslo, 15 August 2013 John Binde, CEO Ola Loe, CFO AGENDA: Highlights for the period Segment information Group financials Outlook 2 Highlights in Q2 2013: Best quarterly operational
Marine Harvest Q Presentation
 Marine Harvest Q2 2014 Presentation Forward looking statements This presentation may be deemed to include forward-looking statements, such as statements that relate to Marine Harvest s contracted volumes,
RS Platou Markets. Seafood conference. 10th June 2010
 RS Platou Markets Seafood conference 10th June 2010 Agenda Introduction to Cermaq Highlights Q1 2010 and outlook full year Chile Recovery 2 Overview of Cermaq One of the global leaders in the aquaculture
 - - - - - - - 20 000 15 000 10 000 5 000 0 2017 2014 2013 2012 2011 2010 2009 2008 2007 2006 2005 2004 2003 2002 2001 2000 1999 1995 1 400 30 1 200 25 1 000 800 600 400 777 20 15 10 16,5 200 5 0 0 Q4/17
Grieg Seafood ASA. griegseafood.com. Andreas Kvame CEO. Atle Harald Sandtorv CFO. 8 November 2017
 Grieg Seafood ASA Andreas Kvame CEO Atle Harald Sandtorv CFO 8 November 2017 1 Agenda Highlights This is Grieg Seafood Business Units (Regions) Financials Outlook 2 Highlights Q3 2017 Improved results
Lerøy Seafood Group. Quarterly report First quarter May 12th Helge Singelstad. Henning Beltestad. Ivan Vindheim.
 Lerøy Seafood Group Quarterly report First quarter 2010 May 12th 2010 Helge Singelstad Chairman Henning Beltestad CEO Ivan Vindheim CFO 1 Agenda 1. 1 Considerations 2. 2 Key financial figures Q1 2010 3.
Marine Harvest Q Presentation
 Marine Harvest Q1 2014 Presentation Forward looking statements This presentation may be deemed to include forward-looking statements, such as statements that relate to Marine Harvest s contracted volumes,
Operating revenue NOK million Operational EBIT NOK million. Harvest volume (HOG) tonnes Q3 09 Q4 09 Q1 10 Q2 10 Q3 10
 tonnes Q3 09 Q4 09 Q1 10 Q2 10 Q3 10") Solid performance in a strong market Strong price achievement and solid results in Norway Return on Capital Employed of 18.9% in the quarter Favourable market balance expected to support a strong market
Solid performance in a strong market Strong price achievement and solid results in Norway Return on Capital Employed of 18.9% in the quarter Favourable market balance expected to support a strong market
Harvest volume (GW) tonnes. Operating revenue NOK million. Operational EBIT NOK million Q1 11 Q2 11 Q3 11 Q4 11 Q1 12 Q1 11 Q2 11 Q3 11 Q4 11 Q1 12
 tonnes. Operating revenue NOK million. Operational EBIT NOK million Q1 11 Q2 11 Q3 11 Q4 11 Q1 12 Q1 11 Q2 11 Q3 11 Q4 11 Q1 12") 33 % industry supply growth market prices down 33 % from Q1 2011 Strong demand increased prices from Q4 2011 Strong performance in Scotland Poor results in VAP Europe Operational EBIT of NOK 276 million
33 % industry supply growth market prices down 33 % from Q1 2011 Strong demand increased prices from Q4 2011 Strong performance in Scotland Poor results in VAP Europe Operational EBIT of NOK 276 million
Lerøy Seafood Group. Preliminary financial figures February 25th Helge Singelstad. Alf-Helge Aarskog. Ivan Vindheim.
 Lerøy Seafood Group Preliminary financial figures 2009 February 25th 2010 Helge Singelstad Chairman Alf-Helge Aarskog CEO Ivan Vindheim CFO 1 Agenda 1. 1 Considerations 2. 2 Key financial figures Q4 2009
Fishpool Christmas Seminar 2017 Bearish signals going into 2018
 Photo: SB1 Markets SEAFOOD SALMON FARMING Fishpool Christmas Seminar 2017 Bearish signals going into 2018 Tore A. Tønseth Phone : (+47) 24 14 74 18 Mobile : (+47) 95 80 62 77 E-mail : tore.tonseth@sb1markets.no
P/F BAKKAFROST.
 P/F BAKKAFROST ANNUAL AND CONSOLIDATED REPORT AND ACCOUNTS YEAR TO 31 DECEMBER 2011 www.bakkafrost.com KEY FIGURES (DKK 1,000) IFRS IFRS IFRS IFRS FO-GAAP Profit and loss 2011 2010 2009 2008 2007 Operating
SalMar ASA. Presentation Q CEO Leif Inge Nordhammer CFO Trond Tuvstein
 SalMar ASA Presentation Q1 2015 CEO Leif Inge Nordhammer CFO Trond Tuvstein Agenda Highlights Financial update Operational update Outlook First quarter 2015 highlights Improved operations Challenging biological
YEAR TO 31 DECEMBER 2012
 P/F Bakkafrost Annual and Consolidated Report and Accounts YEAR TO 31 DECEMBER 2012 www.bakkafrost.com 1/112 > Bakkafrost > Annual and Consolidated Report and Accounts 2012 2012 1,855,544 2011 KEY FIGURES
SalMar ASA First quarter
 SalMar ASA First quarter 2009 1 STRONG SALMON PRICES AND SATISFACTORY EARNINGS Strong salmon prices contributed to satisfactory earnings for the SalMar Group in the first quarter 2009. While Scottish Sea
Q Financial presentation. CEO - Arne Møgster CFO - Britt Kathrine Drivenes
 Q2 2018 Financial presentation CEO - Arne Møgster CFO - Britt Kathrine Drivenes Highlights All figures in NOK 1,000 Q2 2018 Q2 2017 H1 2018 H1 2017 2017 Revenue 6 001 380 5 019 195 11 754 529 11 094 149
Villa Organic AS fourth quarter 2012
 Notice to shareholders; Villa Organic AS fourth quarter 2012 Highlights fourth quarter 2012 The average prices were approximately at the same level as Q3, but improvement was observed towards the end of
Financial report Q3 2014
 Financial report Q3 2014 Austevoll Seafood ASA Financial report Q3 2014 Index Key figures for the Group... 03 Q3 2014... 04 Operating segments... 04 Cash flows... 05 Financial information as of 30 September
Marine Harvest Q Presentation
 Marine Harvest Q1 2015 Presentation Forward looking statements This presentation may be deemed to include forward-looking statements, such as statements that relate to Marine Harvest s contracted volumes,
Harvest volume (GW) tonnes. Operating revenue NOK million. Operational EBIT NOK million Q2 11 Q3 11 Q4 11 Q1 12 Q2 12 Q2 11 Q3 11 Q4 11 Q1 12 Q2 12
 tonnes. Operating revenue NOK million. Operational EBIT NOK million Q2 11 Q3 11 Q4 11 Q1 12 Q2 12 Q2 11 Q3 11 Q4 11 Q1 12 Q2 12") The market showed strong ability to absorb 30% industry growth Prices in line with Q1 - Down 24% in Europe and ~35% in the US compared to Q2 2011 Satisfactory performance in Norway - excellent result in
The market showed strong ability to absorb 30% industry growth Prices in line with Q1 - Down 24% in Europe and ~35% in the US compared to Q2 2011 Satisfactory performance in Norway - excellent result in
Santiago, May 11 th, Results Presentation 1Q18
 Santiago, May 11 th, 2018 Results Presentation 1Q18 Agenda I. Highlights II. III. Financial Statements Supply, Demand and Prices IV. Farming Operation V. Prospects 2 Highlights EBIT 1Q18 USD 18.8 million
Cermaq ASA Presentation for Pareto Securities Oslo, 14 th June 2012
 Cermaq ASA Presentation for Pareto Securities Oslo, 14 th June 2012 1 2020 2015 2010 2005 2000 1995 1990 1985 1980 1975 1970 1965 1960 1955 1950 Aquaculture: a sustainable growth industry Our growing population
FOURTH QUARTER / 2016
 SATISFACTORY RESULT DESPITE BIOLOGICAL CHALLENGES HIGHLIGHTS IN THE FOURTH QUARTER 2016 Continued high salmon prices result in revenue and profit growth. High production costs for part of the volume harvested
Questions - Fishpool seminar Bergen
 Questions - Fishpool seminar Bergen Paul Aandahl, Seafood Analyst, Norwegian Seafood Council 22.11.2018 Global supply Global Trade Estimates Atlantic Salmon Volume wfe Value 2 000 000 1 800 000 1 600 000
Best Ideas 2018, Hosted by MOI Global Bakkafrost (Oslo:BAKKA) Robert Leitz.
 Robert Leitz.") Best Ideas 2018, Hosted by MOI Global Bakkafrost (Oslo:BAKKA) Robert Leitz www.iolitepartners.com TRADE IDEA: LONG EQUITY BAKKAFROST AT NOK320/SHARE Source: Bakkafrost Best in class, vertically integrated
Best Ideas 2018, Hosted by MOI Global Bakkafrost (Oslo:BAKKA) Robert Leitz www.iolitepartners.com TRADE IDEA: LONG EQUITY BAKKAFROST AT NOK320/SHARE Source: Bakkafrost Best in class, vertically integrated
Harvest volume (HOG) tons. Operational EBIT NOK million. Operational revenue NOK million Q2 10 Q3 10 Q4 10 Q1 11 Q2 11 Q2 10 Q3 10 Q4 10 Q1 11 Q2 11
 tons. Operational EBIT NOK million. Operational revenue NOK million Q2 10 Q3 10 Q4 10 Q1 11 Q2 11 Q2 10 Q3 10 Q4 10 Q1 11 Q2 11") Improved price achievement in a falling market Operational EBIT increased 13% ROACE of 26% in the quarter NIBD NOK 5.8 billion after dividend of NOK 2.9 billion High contract share in the second half of
Improved price achievement in a falling market Operational EBIT increased 13% ROACE of 26% in the quarter NIBD NOK 5.8 billion after dividend of NOK 2.9 billion High contract share in the second half of
Q1 Financial Presentation. Arne Møgster CEO Britt K. Drivenes - CFO
 Q1 Financial Presentation Arne Møgster CEO Britt K. Drivenes - CFO As a globally integrated pelagic fishery and seafood specialist, (AUSS) operates through subsidiaries and associated companies, fishing
SalMar ASA. Presentation Q CEO Yngve Myhre, CFO Trond Tuvstein Oslo, 14 November w w w. s a l m a r. n o
 Presentation Q3 2013 SalMar ASA CEO Yngve Myhre, CFO Trond Tuvstein Oslo, 14 November 2013 2 Agenda Highlights Financial update Operational update Market and outlook Third quarter highlights Another strong
Lerøy Seafood Group SEPTEMBER 2018
 Lerøy Seafood Group SEPTEMBER 2018 1. Lerøy Seafood Group 2. Key market trends supply and demand Our vision To be the leading and most profitable global supplier of sustainable high-quality seafood History
Lerøy Seafood Group. Quarterly report Second quarter August 19th Helge Singelstad. Ivan Vindheim CEO CFO
 Lerøy Seafood Group Quarterly report Second quarter 2009 August 19th 2009 Helge Singelstad CEO Ivan Vindheim CFO 1 Agenda 1. 1 Considerations 2. 2 Key financial figures Q2 2009 3. 3 Lerøy at a glance 4.
Q Financial presentation. Arne Møgster CEO Britt Kathrine Drivenes CFO
 Q1 2018 Financial presentation Arne Møgster CEO Britt Kathrine Drivenes CFO Highlights All figures in MNOK Q1 2018 Q1 2017 2017 Revenue 5 753 6 075 20 799 EBITDA* 1 445 1 555 4 747 EBIT* 1 217 1 331 3
Third QUARTER / 2017
 STRONG OPERATIONS AND IMPROVING BIOLOGY HIGHLIGHTS IN THE THIRD QUARTER Strong operations and effective management of the improving biological situation Lower production costs and higher prices achieved
Interim Report Q1-18
 Interim Report Q1-18 HIGHLIGHTS Operational EBIT of NOK 193 million o o Operational EBIT per kg of NOK 19.22 in Region North Operational EBIT per kg of NOK 15.64 in Region South The highest sold and harvested
Events after balance sheet date
 Austevoll Seafood ASA 0 Financial Report Q4 2011 Successful second fishing season for anchoveta in Peru A positive result recorded for fish farming, sale and distribution, in difficult conditions Seasonally,
Q Financial presentation. CEO - Arne Møgster CFO - Britt Kathrine Drivenes
 Q3 2018 Financial presentation CEO - Arne Møgster CFO - Britt Kathrine Drivenes Highlights All figures in MNOK Q3 2018 Q3 2017 YTD Q3 2018 YTD Q3 2017 2017 Revenue 5 317 4 903 17 072 15 997 20 799 EBITDA*
Q Financial presentation. Arne Møgster CEO Britt Kathrine Drivenes CFO
 Q2 2017 Financial presentation Arne Møgster CEO Britt Kathrine Drivenes CFO Highlights All figures in NOK 1,000 Q2 2017 Q2 2016 H1 2017 H1 2016 2016 Revenue 5 019 195 4 558 229 11 094 149 8 970 468 18
NKT Holding. Interim Report Q Audiocast presentation 8 November 2012 at 10:00 am CET
 NKT Holding Interim Report Q3 2012 Audiocast presentation 8 November 2012 at 10:00 am CET Agenda Page Page 2 2 NKT Group Highlights Q3 2012 Financial results Q3 2012 Companies NKT Cables Nilfisk-Advance
All figures in NOK 1,000 Q3 11 Q3 10 Sept. 30, 2011 Sept. 30,
 Austevoll Seafood ASA 0 INTERIM REPORT Q3 2011 Significant reduction in interest-bearing liabilities in the quarter Third quarter is low season for production of pelagic fish in Europe and South America
Salmon price, demand and market trends
 Salmon price, demand and market trends Kolbjørn Giskeødegård, Director 21 November 2018 Salmon supply growth dramaticly down after 2012 2 500 2013-17: CAGR 2% 2 000 1 500 2003-12: CAGR 8% 1 000 500 0 2003
Grieg Seafood ASA. griegseafood.com. Andreas Kvame CEO. Atle Harald Sandtorv CFO. 11 November 2016
 Grieg Seafood ASA Andreas Kvame CEO Atle Harald Sandtorv CFO 11 November 2016 1 Agenda Highlights Business Units (Regions) Financials Outlook 2 HIGHLIGHTS Q3 2016 3 Highlights Q3 2016 Good quarterly results
FOURTH QUARTER / 2014
 SATISFACTORY RESULT DESPITE BIOLOGICAL CHALLENGES HIGHLIGHTS IN THE FOURTH QUARTER 2014 Good salmon prices and high harvested volume produced profit growth and record operating revenues. 50% of the harvested
Q Nova Austral Financial Reporting May 2nd, 2018
 Q1-2018 Nova Austral Financial Reporting May 2nd, 2018 Agenda A. Nova Austral Pillars & Fundamentals B. Market and company updates C. Financial Report 1) Key Financial summary 2) LTM EBITDA, Revenue and
Q U A R T E R L Y R E P O R T 2 N D Q U A R T E R
 Q U A R T E R L Y R E P O R T 2 N D Q U A R T E R 2 0 0 7 1. Grieg Seafood develops as planned Grieg Seafood was listed in June, and has now 869 shareholders after 2 shares issues of MNOK 700 in total.
SalMar ASA. Presentation Q CEO Olav-Andreas Ervik CFO Trond Tuvstein
 SalMar ASA Presentation Q1 2018 CEO Olav-Andreas Ervik CFO Trond Tuvstein Olav-Andreas Ervik new CEO of SalMar 41 years, from Frøya More than 20 years of experience from the aquaculture industry Worked
Austevoll Seafood ASA
 Austevoll Seafood ASA Financial report Q2 and H1 2016 INDEX key figures for the group... 03 Q2 2016... 04 Operating segments... 04 Cash Flows, Q2 2016... 06 Financial information, H1 2016... 07 Cash Flow,
Austevoll Seafood ASA Q1 2009
 Q1 2009 Ole Rasmus Møgster Chairman Britt Kathrine Drivenes CFO Disclaimer This Presentation has been produced by (the Company or Austevoll ) solely for use at the presentation to the market held in connection
Interim Report Q4-17
 Interim Report Q4-17 HIGHLIGHTS Operational EBIT of NOK 95 million o o Operational EBIT per kg of NOK 15.84 in Region North Operational EBIT per kg of NOK 14.12 in Region South The highest sold volume
Aker Seafoods Second quarter 2009 Sales of fresh products up, but prices down
 Aker Seafoods Second quarter Sales of fresh products up, but prices down CEO Yngve Myhre CFO Gunnar Aasbø Interim presentation second quarter 1 Welcome Agenda Topic Operational Update Group Harvesting
Athens Greece May Months 2009 Results Presentation
 Athens Greece May 2009 3 Months 2009 Results Presentation NIREUS AQUACULTURE S.A. Nireus at a glance The leader in seabass and seabream fish farming - A fully integrated producer - Production facilities
Your Aquaculture Technology and Service Partner. Q Presentation Oslo - August 17 th, 2016 Trond Williksen, CEO Eirik Børve Monsen, CFO
 Q2 2016 Presentation Oslo - August 17 th, 2016 Trond Williksen, CEO Eirik Børve Monsen, CFO Agenda 1 Highlights 2 Financial performance 3 Outlook 4 Q&A Highlights Q2 2016 - by CEO Trond Williksen 3 Improved
Q Financial presentation. Arne Møgster CEO Britt Kathrine Drivenes CFO
 Q4 2014 Financial presentation Arne Møgster CEO Britt Kathrine Drivenes CFO Highlights All figures in NOK 1,000 Q4 2014 Q4 2013 (restated) 2014 2013 (restated) Revenue 3 704 689 3 725 710 14 344 177 12
Q Financial presentation. Arne Møgster CEO Britt Kathrine Drivenes CFO
 Q2 2015 Financial presentation Arne Møgster CEO Britt Kathrine Drivenes CFO Highlights All figures in NOK 1,000 Q2 2015 (restated) Q2 2014 H1 2015 (restated) H1 2014 2014 Revenue 4 107 801 3 606 154 7
Interim Report Q2-17
 Interim Report Q2-17 HIGHLIGHTS Operational EBIT of NOK 136 million o o o Operational EBIT per kg of NOK 29.68 in Region North Operational EBIT per kg of NOK 31.30 in Region South Non-recurring item of
Your Aquaculture Technology and Service Partner. Q Presentation Oslo - May 11 th, 2016 Trond Williksen, CEO Eirik Børve Monsen, CFO
 Q1 2016 Presentation Oslo - May 11 th, 2016 Trond Williksen, CEO Eirik Børve Monsen, CFO Agenda 1 Highlights 2 Financial performance 3 Outlook 4 Q&A Highlights Q1 2016 - by CEO Trond Williksen 3 MNOK On
Your Aquaculture Technology and Service Partner. Q Presentation Oslo - February 19 th, 2016 Trond Williksen, CEO Eirik Børve Monsen, CFO
 Q4 2015 Presentation Oslo - February 19 th, 2016 Trond Williksen, CEO Eirik Børve Monsen, CFO Agenda 1 Highlights 2 Financial performance 3 Outlook 4 Q&A Highlights Q4 2015 - by CEO Trond Williksen 3 MNOK
Austevoll Seafood ASA
 Austevoll Seafood ASA Financial Report Q3 2017 Index Key figures for the Group...03 Q3 2017...04 Operating segments...04 Cash flow Q3 2017...07 Financial factors at 30 September 2017...07 Cash flows at
Austevoll Seafood ASA
 Austevoll Seafood ASA Financial Report Q4 2016 and preliminary figures for 2016 INDEX Key figures for the group... 03 Q4 2016... 04 Operating segments... 04 Cash Flows Q4 2016... 06 Cash flows 2016...07
The answers to your questions.
 The answers to your questions. By / Ragnar Nystøyl CHRISTMAS SEMINAR Bergen, 19. November 2014 Agenda - Norwegian Production & Supply issues - Global Production & Supply issues - Market- & Price-related
NIREUS AQUACULTURE S.A.
 Athens Greece 29 March 2013 12 Months 2012 Results Presentation NIREUS AQUACULTURE S.A. Main events 12M 2012 Total sales up +2.7% to 202.2 mi. Fish sales value up +5.5% to 163 mi., volume up +8.3% to 31.6
Chilean volume reduction Impact on global markets. North Atlantic Seafood Forum Steven Rafferty CFO Cermaq ASA 5 March 2009
 Chilean volume reduction Impact on global markets North Atlantic Seafood Forum Steven Rafferty CFO Cermaq ASA 5 March 2009 Context Chilean Atlantic salmon supply will drop by 50% + in 2009 Further drop
3Q Financial Results Presentation. Manuel Fernandez de Sousa-Faro, Chairman Joaquín Viña Tamargo, CAO & IR
 3Q 211- Financial Results Presentation Manuel Fernandez de Sousa-Faro, Chairman Joaquín Viña Tamargo, CAO & IR Disclaimer This document is purely informative and does not intend to be comprehensive. Financial
Results Presentation 3Q17
 Multiexport Foods S.A. Results Presentation 3Q17 Santiago, November 2017 Agenda I. Highlights II. III. Financial Statements Supply, Demand and Prices IV. Farming Operation V. Perspectives 2 Highlights