NKT Holding. Interim Report Q Audiocast presentation 8 November 2012 at 10:00 am CET
|
|
|
- Collin Hampton
- 6 years ago
- Views:
Transcription
1 NKT Holding Interim Report Q Audiocast presentation 8 November 2012 at 10:00 am CET
2 Agenda Page Page 2 2 NKT Group Highlights Q Financial results Q Companies NKT Cables Nilfisk-Advance Photonics Group Expectations 2012 Questions & Answers


3 Group structure November 2012 Page Page 3 3 NKT Holding NKT Cables Nilfisk-Advance North, Central and Eastern Europe, China, Australia Global presence Photonics Group Europe, North America, Asia
4 Highlights Q Page Page 4 4 Revenue mdkk vs mdkk in Q Organic growth -2% in Q and -3% in Q1-Q Organic growth Q Q1-Q NKT Cables 0% -6% Nilfisk-Advance -4% -1% Photonics Group -11% 6% Operational EBITDA 251 mdkk (8,3%) vs. 225 mdkk (7,4%) in Q Earnings before tax (EBT) of continuing operations amount to 58 mdkk vs. -11 mdkk in Q Earnings of discontinued operations amounts to 0 mdkk vs. 67 mdkk in Q Profit 37 mdkk vs. 43 mdkk in Q WC amounts to 3,2 bndkk vs. 3,0 bndkk end Q2. LTM at 20,4% vs. 20,6% NIBD increased to 2,8 bndkk from 2,7 bndkk end Q Expectations for 2012 The general economic uncertainty has further slowed the development in organic growth rates compared with expectations in August 2012 Expected negative organic growth in revenue of approx. 2-3%, compared with previous forecasts of a flat organic growth Operational EBITDA is now expected to be approx mdkk Expected Group net profit is unchanged at approx. 1,6 bndkk
5 Operational EBITDA Group Page Page % % mdkk % 7% Adjusted for share of profit in NKT Flexibles Q Q Q Q Q Q Q Q Q Q Q Q Q Q Q Q Q Q Q3-13 5% 3% Oper. EBITDA LTM mdkk (Continued ope.) Oper. EBITDA% LTM, std. (Continued ope.) Oper. EBITDA% LTM (Continued ope.) Organic growth of -2% for Q EBITDA margin std. LTM Q of 8,1% or 980 mdkk an increase from 7,9% (955 mdkk) in Q2 2012
6 Manufacturing PMI Page Page USA EURO zone China Breakeven Recession Expectation indicator Above the line indicates positive expectations for the manufacturing sector and below the line indicates declining expectations for the manufacturing sector Below the line indicates expectations of recession (Updated as of 2 November 2012)
7 Agenda Page Page 7 7 NKT Group Highlights Q Financial results Q Companies NKT Cables Nilfisk-Advance Photonics Group Expectations 2012 Questions & Answers
8 Realised Q vs. Q Page Page 8 8 mdkk Q Q Change Consensus Revenue % Revenue, std. metal prices EBITDA (operational) % 272 One-off s EBITDA Depreciation EBIT Financial items, net EBT from continuing operations Tax from continuing operations Profit from continuing operations Profit from discontinued operations Profit Oper. EBITDA margin std. 8,3% 7,4% 8,8%
9 Realised Q vs. Q Page Page 9 9 mdkk Q Q Change Revenue Revenue, std. metal prices EBITDA (operational) One-off s EBITDA Depreciation/Amortisation EBIT Financial items, net EBT from continuing operations Tax from continuing operations Profit from continuing operations Profit from discontinued operations Profit Oper. EBITDA margin std. 8,3% 7,4% mdkk Revenue decreased by -96 Metal prices -115 FX changes 98 Acquisitions 0-2% organic growth NKT Cables 0% - Nilfisk-Advance -4% - Photonics Group -11% mdkk Operational EBITDA increased by 26 NKT Cables Margin 7,0% (Q3 2011: 4,8%) 31 Nilfisk-Advance Margin 10,4% (Q3 2011: 10,7%) -2 Photonics Group and other -3 mdkk Financial items (Q3 2011: -106 mdkk) -44 Net interest expense (Q3 2011: -66 mdkk) -42 Net exchange loss (Q3 2011: -40 mdkk incl. cap. int.) -2
10 NKT Cables Trends Page Page Oper. EBITDA (mdkk) ,4% 13,1% 12,4% 10,2% Q1-08 Q2-08 Q3-08 Q4-08 8,4% 15 Q1-09 7,6% 145 Q2-09 7,0% 8,0% 118 Q Q4-09 8,9% 7,4% 7,4% 5,9% Q1-10 Q2-10 Q3-10 Q4-10 5,2% 3,9% 29 9 Q1-11 Oper. EBITDA mdkk Oper. EBITDA% LTM Oper. EBITDA% LTM, std. Q2-11 2,7% 3,2% 71 Q Q4-11 3,5% 4,2% 4,8% Q1-12 Q2-12 Q % 12% 10% 8% 6% 4% 2% 0% Realised 0% organic growth in Q (Q1-Q3: -6%): Electricity Infrastructure 4% (Q1-Q3: 2%) Construction 0% (Q1-Q3: 2%) Railway -2% (Q1-Q3: -41%) Automotive -25% (Q1-Q3: -18%) Q organic growth peer 2%: Energy Infrastructure 3% Industry 3% Buildings 0% Organic growth - Quarterly (Y/Y) 4% 3% 3% 0% -14% 3% -10% -8% 4% 1% 25% 34% 20% 0% -4% -6% -13% -4% 0% - Annually 3% -7% 16% 1% -6%
11 Nilfisk-Advance Trends Page Page Oper. EBITDA (mdkk) ,0% 11,1% 11,0% 10,4% Q1-08 Q2-08 Q3-08 Q4-08 Oper. EBITDA mdkk 9,9% 9,2% 9,2% 9,2% Q1-09 Q2-09 Q3-09 Q ,2% 11,0% 10,9% 10,7% Q1-10 Q2-10 Q3-10 Q4-10 Oper. EBITDA% LTM 10,6% 10,5% 10,8% 11,6% 181 Q Q Q3-11 Q ,7% 11,7% 11,7% Q1-12 Q2-12 Q % 13% 12% 11% 10% 9% 8% 7% Realised -4% organic growth in Q (Q1-Q3: -1%): EMEA -1% (Q1-Q3: 0%) Americas -11% (Q1-Q3: -2%) APAC -1% (Q1-Q3: 1%) Organic growth peer -2% in Q3 2012: EMEA -6% Americas -1% APAC 1% Organic growth - Quarterly (Y/Y) 4% 6% 5% -12% -12% -20% -13% -3% 6% 10% 5% 7% 5% 8% 9% 9% 4% -1% -4% - Annually 1% -13% 7% 8% -1%
12 Nilfisk-Advance - Gross profit development Page Page % 45% Q ,3% Q ,8% Q ,0% 44% 43% 42% 41% 40% 39% 38% 37% 36% Sep '09 Oct '09 Nov '09 Dec '09 Jan '10 Feb '10 Mar '10 Apr '10 May '10 Jun '10 Jul '10 Aug '10 Sep '10 Oct '10 Nov '10 Dec '10 Jan '11 Feb ' LTM Mar '11 Apr '11 May '11 Jun '11 Jul '11 Aug '11 Sep '11 Oct '11 Nov '11 Dec '11 Jan '12 Feb '12 Mar '12 Apr '12 May '12 Jun '12 Jul '12 Sep '12 Aug '12 Despite declining revenue and tight world market, the company s gross profit as a percentage of revenue continued to develop positively in Q3 2012
13 Working Capital (in % of revenue) Group Page Page Q ,8% mdkk Q ,4% mdkk WC of mdkk vs mdkk end Q Still high focus area in both NKT Cables and Nilfisk-Advance Strategic target remains 18% in Nilfisk- Advance and <17% in NKT Cables WC decreased to 20,4% (LTM) vs. 20,6% end Q NKT Cables decreased to 20,4% (LTM) vs. 20,7% end Q Nilfisk-Advance decreased to 20,1% (LTM) vs. 20,2% end Q2 2012
 Gross CAPEX in Q3 2012")

 NKT")
14 Page Page months investments in tangible assets (gross) Gross CAPEX in Q was 77 mdkk (Q3 2011: 102 mdkk) Other 3% Nilfisk- Advance 25% NKT Cables 72% Investments in intangible assets, etc. in Q were 61 mdkk (Q3 2011: 37 mdkk) NKT Cables 32% Other 8% Nilfisk- Advance 60%
15 Net interest bearing debt Group Page Page Q Q ,0x mdkk 2,8x mdkk mdkk Net interest bearing debt, mdkk Net interest bearing debt relative to operational EBITDA 6,0x 5,0x 4,0x 3,0x NIBD of mdkk vs mdkk as per 30 June and mdkk as per 31 December 2011 End September 2012 net interest bearing debt amounts to 2,8x operational EBITDA (end Q2 2012: 2,5x). Max. NIBD of 2,5x operational EBITDA remains the internal target Q1-08 Q2-08 Q3-08 Q4-08 Q1-09 Q2-09 Q3-09 Q4-09 Q1-10 Q2-10 Q3-10 Q4-10 Q1-11 Q2-11 Q3-11 Q4-11 Q1-12 Q2-12 Q3-12 2,0x 1,0x 0,0x Gearing of 49% (Q2 2012: 48%). Max. ratio of 100% remains the internal target. Solvency ratio of 43% (Q2 2012: 41%). Ratio >30% remains the internal target.
 Cash resources: Undrawn facilities of 3,4 bn.dkk + cash of 0,3 bn.dkk. In total 3,7 bn.")
16 Gross debt and Cash Resources Group Page Page Gross debt: 40% in DKK (end 2011: 62%), 29% in CZK (end 2011: 18%), 15% in CNY (end 2011: 10%) and the remaining part in EUR, USD & PLN Largest part is at variable interest +/- 1% change in interest will impact net interest with +/- 28 mdkk (end 2011: +/- 34 mdkk) Cash resources: Undrawn facilities of 3,4 bn.dkk + cash of 0,3 bn.dkk. In total 3,7 bn.dkk The debt is not subject to any kind of financial covenants
17 Cash generation Page Page mdkk Q1-08 Q2-08 Q3-08 Q4-08 Q1-09 Q2-09 Q3-09 Q4-09 Q1-10 Q2-10 Q3-10 Q4-10 Q1-11 Q2-11 Q3-11 Q4-11 Q1-12 Q2-12 Q Cash flow - operations LTM Free cash flow LTM Cash flow - investments LTM (excl. acquisitions) Operational EBITDA LTM
18 Page Page Cash flow mdkk Q Q Q1-Q Q1-Q EBITDA Financial items, net Change in working capital Other Cash flows from operating activities Acquisition of business activities Acq. of property, plant and equipment, net Other investments, net Cash flows from investing actitivities Cash flows from operating and investing activities Change in long- and short-term loans Dividend paid Cash from exercise of share warrants and minorities Cash flows from financing activities Cash flow from discontinued operations (NKT Flexibles) Net cash flow
19 Agenda Page Page NKT Group Highlights Q Financial results Q Companies NKT Cables Nilfisk-Advance Photonics Group Expectations 2012 Questions & Answers


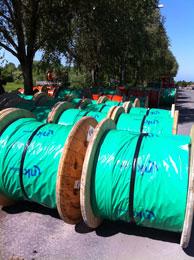
20 NKT Cables Page Page VISION NKT Cables is creating value for its customers by providing solutions with cables
21 NKT Cables Page Page Sales by Customers 2011 Industry 30% Utilities 41% Wholesales 29% Sales by Markets 2011 Denmark Other 27% Asia 13% 9% Eastern Europe 26% Germany 25% Sales by Fields of Applications (Products) 2011 Other Automotive 5% 6% Railway 7% Construction 19% Electricity Infrastructure 63% 63% HV+offshore 33% MV 18% Other 12% Manufacturing and Sales Companies Sales Entities Sales by Customers and Fields of Applications are based on std. metal prices for FY Sales by Markets are based on market prices for FY 2011.


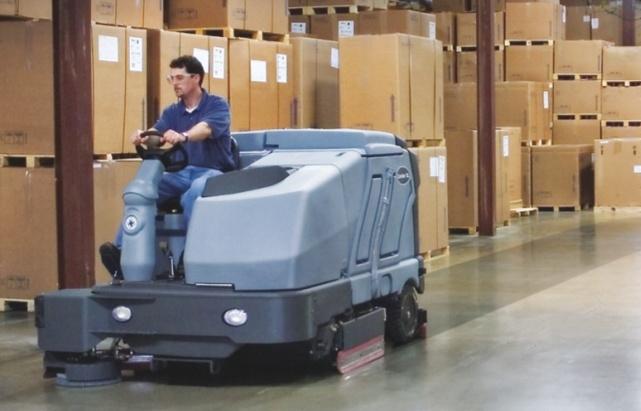
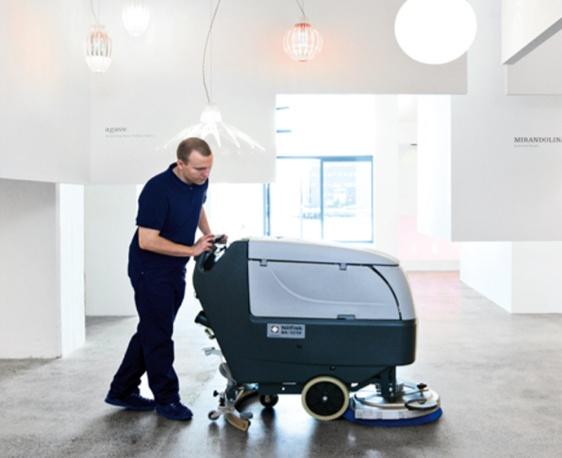
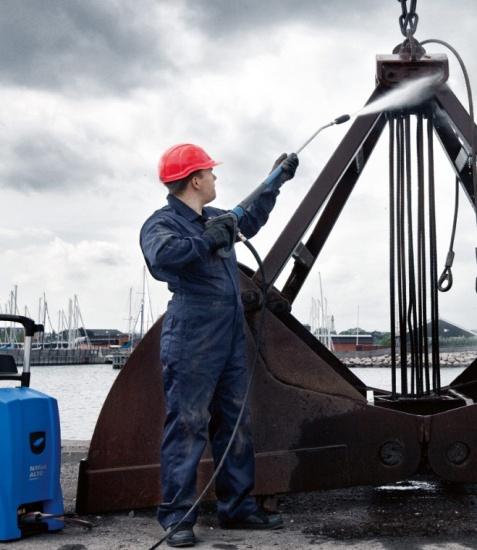


22 Nilfisk-Advance Page Page MISSION We enable sustainable cleaning worldwide to improve quality of life
23 Nilfisk-Advance Page Page Sales by Customers 2011 Domestic 12% Industrial 36% Commercial 52% Sales by Markets 2011 APAC 12% Americas 24% EMEA 64% Sales by Products 2011 Other sales Service 7% 8% High pressure washers 19% Vacuum cleaners 25% Floor-care 41% All data based on FY 2011 Sales Entities Manufacturing Companies


24 Photonics Group Page Page VISION To lead the way in transforming the Photonics Industry

25 Photonics Group Page Page Sales by entities 2011 Vytran 30% Lios Technology 22% NKT Photonics 48% HQ NKT Photonics HQ Lios Technology HQ Vytran All data based on FY 2011
26 Agenda Page Page NKT Group Highlights Q Financial results Q Companies NKT Cables Nilfisk-Advance Photonics Group Expectations 2012 Questions & Answers
27 Expectations 2012 Page Page The general economic uncertainty has further slowed the development in organic growth rates compared with expectations in August 2012 mdkk Organic growth Oper. EBITDA Guided August % ~ Reduced expectation -50 Negative Guided November % ~1.000 Expected Group profit is unchanged at around 1,6 bndkk
28 Agenda Page Page NKT Group Highlights Q Financial results Q Companies NKT Cables Nilfisk-Advance Photonics Group Expectations 2012 Questions & Answers


29 Q&A Page Page 29 29
INTERIM REPORT Q2-2011
 INTERIM REPORT Q2-2011 Live presentation 23 August 2011 at 11:00 am NKT Holding A/S / IR presentation / Interim Report 2, 2011 1 Agenda Highlights Q2 Financial results Q2 2011 Companies - NKT Cables -
NKT I IR presentation I Interim Report Q May 2013 I 1 NKT. Interim Report Q Audiocast, 22 May 2013 at 10:00 am CET
 22 May 2013 I 1 NKT Interim Report Q1 2013 Audiocast, 22 May 2013 at 10:00 am CET 22 May 2013 I 2 Agenda NKT Highlights Q1 2013 Financial results Q1 2013 Companies NKT Cables Nilfisk-Advance Photonics
NKT. Annual Report 2010 Live presentation 1 March 2011 at 11:00 am. NKT Holding A/S / IR presentation / Annual Report
 NKT Annual Report 2010 Live presentation 1 March 2011 at 11:00 am NKT Holding A/S / IR presentation / Annual Report 2010 1 Agenda NKT Group 2010 in headlines Expectations 2011 Financial results 2010 NKT
NKT I IR presentation I Interim Report Q November 2013 I 1 NKT. Interim Report Q Webcast, 20 November 2013 at 10:00 am CET
 20 November 2013 I 1 NKT Interim Report Q3 2013 Webcast, 20 November 2013 at 10:00 am CET 20 November 2013 I 2 Forward looking statements This presentation and related comments contain forward-looking
NKT I IR presentation I Annual Report February 2014 I 1 NKT. Annual Report Webcast, 28 February 2014 at 9:00 am CET
 28 February 2014 I 1 NKT Annual Report 2013 Webcast, 28 February 2014 at 9:00 am CET 28 February 2014 I 2 Forward looking statements This presentation and related comments contain forward-looking statements.
NKT I IR presentation I Interim Report Q November 2014 I 1 NKT. Interim Report Q Webcast, 13 November 2014 at 10:00 CET
 13 November 2014 I 1 NKT Interim Report Q3 2014 Webcast, 13 November 2014 at 10:00 CET 13 November 2014 I 2 Forward looking statements This presentation and related comments contain forward-looking statements.
NKT Holding. Den Danske Finansanalytikerforening Virksomhedsdag 2012
 NKT Holding Den Danske Finansanalytikerforening Virksomhedsdag 2012 Agenda 2 Facts about NKT (5 min) SWOT Analysis (15 min) Value drivers in Cash Flow / Cash Conversion / Shareholder Value (20 min) The
NKT I Annual Report 2014 I Webcast. 27 February 2015 I 1 NKT. Annual Report Webcast, 27 February 2015, 10:00 CET
 27 February 2015 I 1 NKT Annual Report 2014 Webcast, 27 February 2015, 10:00 CET 27 February 2015 I 2 Forward looking statements This presentation and related comments contain forward-looking statements.
NKT Interim Report Q3 2015
 I 1 NKT Interim Report Q3 2015 Webcast, 12 November 2015, 10:00 CET I 2 Forward looking statements This presentation and related comments contain forwardlooking statements Such statements are subject to
NKT I Interim Report Q I Webcast. 13 May 2015 I 1 NKT. Interim Report Q Webcast, 13 May 2015, 08:30 CET
 13 May 2015 I 1 NKT Interim Report Q1 2015 Webcast, 13 May 2015, 08:30 CET 13 May 2015 I 2 Forward looking statements This presentation and related comments contain forward-looking statements. Such statements
Finansanalytikerforeningens Virksomhedsdag 2008 Presentation of NKT Group June 3, 2008 v/ CFO Michael Lyng
 Finansanalytikerforeningens Virksomhedsdag 2008 Presentation of NKT Group June 3, 2008 v/ CFO Michael Lyng 1 116 years history of innovation and entrepreneurship From growth oriented industrial conglomerate
Interim report Q3 2016
 NKT I Interim report Q3 2016 I Webcast 11 November 2016 I 1 6 Interim report Q3 2016 Webcast, 11 November 2016, 09:30 CET NKT I Interim report Q3 2016 I Webcast 11 November 2016 I 2 Forward looking statements
NKT I Zürich Roadshow March 2017 I 1. Zürich - Roadshow. March 2017
 NKT I Zürich Roadshow March 2017 I 1 6 Zürich - Roadshow March 2017 NKT I Zürich Roadshow March 2017 I 2 Forward looking statements This presentation and related comments contain forwardlooking statements
17 August 2017 Interim Report Q2 2017
 17 August 2017 Interim Report Q2 2017 Webcast presentation Forward looking statements This presentation and related comments contain forward-looking statements. Such statements are subject to many uncertainties
NKT I Annual Report 2016 I Webcast 21 February 2017 I 1. Annual Report Webcast, 21 February 2017
 NKT I Annual Report 2016 I Webcast 21 February 2017 I 1 6 Annual Report 2016 Webcast, 21 February 2017 NKT I Annual Report 2016 I Webcast 21 February 2017 I 2 Forward looking statements This presentation
Interim Report Q1 2017
 NKT A/S I Interim Report Q1 2017 I Webcast 17 May 2017 I 1 Interim Report Q1 2017 Webcast, 17 May 2017 NKT A/S I Interim Report Q1 2017 I Webcast 17 May 2017 I 2 Forward looking statements This presentation
FULL YEAR REPORT, 2017 TELEPHONE/AUDIO CONFERENCE 8 FEBRUARY 2018, AT CET TOMMY ANDERSSON, PRESIDENT AND CEO HELENA WENNERSTRÖM, EVP AND CFO
 TELEPHONE/AUDIO CONFERENCE 8 FEBRUARY 2018, AT 15.30 CET TOMMY ANDERSSON, PRESIDENT AND CEO HELENA WENNERSTRÖM, EVP AND CFO DIRECT LINK AUDIOCAST: HTTPS://TV.STREAMFABRIKEN.COM/BULTEN Q4 2017 TELECONFERENCE:
Nilfisk Q2 Interim Report 2018 Webcast presentation August 14
 Webcast presentation August 14 Agenda 1 2 3 4 5 Highlights Business unit update Financials Outlook 2018 Q&A 2 Strong financial performance in Q2 Financial highlights Strong financial performance with organic
Annual General Meeting 2016
 I 1 6 Annual General Meeting 2016 I 2 Long-term transformation towards increased value creation Nilfisk NKT Cables NKT Photonics Accelerate Growth Consolidating market-leading position Selected initiatives:
Cembrit Group Q Unaudited interim report
 Cembrit Group Q4 2017 Unaudited interim report 2017 main events COMMENTARY Strong demand across both markets and product categories resulted in revenue growth of 7.9% YoY 2017 EBITDA showed solid underlying
27 February 2018 Annual Report 2017
 27 February 2018 Annual Report 2017 Webcast presentation Forward looking statements This presentation and related comments contain forward-looking statements. Such statements are subject to many uncertainties
Nilfisk Q3 Interim Report 2018 Webcast presentation November 14, 2018
 Nilfisk Q3 Interim Report 2018 Webcast presentation November 14, 2018 Agenda 1 2 3 4 5 Highlights Business unit update Simplifications initiatives Financials Outlook 2018 6 Q&A 2 Q3 2018 results Financial
Q3 Report October 25, 2017
 Q3 Report 2017 October 25, 2017 CEO s comments A weak operating profit, 49 MSEK (91). Different trends across the business. Organic sales growth: APAC +9% EMEA -5% Americas +/- 0 Overall the sales contracted
FY 2017 Presentation
 FY 2017 Presentation 1 2 At a glance Overview FY 2017 YoY revenue growth of 2.2% to EUR 82.5 mn (FY 2016: EUR 80.7 mn) in a challenging year after 13.5% decline at the end of H1/17 (compared YoY) New order
Interim Report Q3 2013
 Interim Report Q3 2013 NKT Holding A/S, Interim Report Q3 2013 20 November 2013, Announcement No. 18 CONTENTS Management s review Key messages 2 Financial highlights 3 The NKT Group 4 - NKT Cables 8 -
Interim Report Q1 2013
 Interim Report 2013 NKT Holding A/S, Interim Report 2013 22 May 2013, Announcement No. 11 Contents Management s review Key messages 2 Financial highlights 3 The NKT Group 4 - NKT Cables 8 - Nilfisk-Advance
Review of Membership Developments
 RIPE Network Coordination Centre Review of Membership Developments 7 October 2009/ GM / Lisbon http://www.ripe.net 1 Applications development RIPE Network Coordination Centre 140 120 100 80 60 2007 2008
Annual Report NKT annual report 2007 / xxx lxxx xx 1
 Annual Report 2007 NKT annual report 2007 / xxx lxxx xx 1 Contents Page 2007 in brief 4 5 years financial highlights 5 Management report 2007 Review of financial statements 6 Expectations 2008 9 Corporate
The Chairman s report 2012
 Page 1 Page 2 Page 3 A/S Annual Report 2012 The Chairman s Report 1/16 The Chairman s report 2012 The NKT Group of today has been created on the basis of active ownership. As we saw in the film, the Group
Page 1. November 17, 2017 Nilfisk Q3 Interim Report 2017 Webcast presentation
 Page 1 November 17, 2017 Webcast presentation Today s presenters Nilfisk CEO Hans Henrik Lund Nilfisk CFO Karina Deacon Page 2 Agenda 1 2 3 4 Highlights for Q3 and the first nine months of 2017 Financial
Annual General Meeting Fiscal Year 2013
 Annual General Meeting Fiscal Year 2013 Oberhausen, April 16, 2014 Check against delivery. GEA Group Aktiengesellschaft Performance of GEA Group 2 Annual General Meeting Fiscal Year 2013 Highlights of
SIX MONTHS REPORT, JAN JUN 2018
 SIX MONTHS REPORT, JAN JUN 2018 TELEPHONE/AUDIO CONFERENCE 11 JULY 2018, AT 11.00 CET TOMMY ANDERSSON, PRESIDENT AND CEO HELENA WENNERSTRÖM, EVP AND CFO DIRECT LINK AUDIOCAST: HTTPS://TV.STREAMFABRIKEN.COM/BULTEN
AUDITED RESULTS FOR THE YEAR ENDED 31 DECEMBER 2016
 AUDITED RESULTS FOR THE YEAR ENDED 31 DECEMBER 2016 AGENDA 2 1 Opening remarks / market update 2 Financial results 3 Operational review 4 Strategy update 5 Outlook 1 2 3 4 5 OPENING REMARKS / MARKET UPDATE
PRESENTATION Q Oslo, 14 November 2012 John Binde, CEO Ola Loe, CFO
 PRESENTATION Q3 2012 Oslo, 14 November 2012 John Binde, CEO Ola Loe, CFO AGENDA: Highlights for the period Segment information Group financials Outlook 2 Highlights in Q3 2012: Strong consumption growth
2015 Annual Report. Investor teleconference 10 February 2016, a.m. CET. Presentation available at investor.dsv.com
 2015 Annual Report Investor teleconference 10 February 2016, 11.00 a.m. CET Presentation available at investor.dsv.com Forward-looking statements This presentation contains forward-looking statements.
Huhtamaki roadshow presentation. Investor Relations Q1 2009
 Huhtamaki roadshow presentation Investor Relations 2009 Huhtamaki in brief A leading manufacturer of consumer and specialty packaging with head office in Espoo, Finland Net sales EUR 2.3 billion in 65
9M 2014 Results Presentation November 13, 2014
 9M 2014 Results Presentation November 13, 2014 9M 2014 key facts Sales: Euro 668.4 million +8.1% (+8.8% constant FX) Directly Operated Stores Same Store Sales: +9.4% (vs -5.7% in 9M 13) EBITDA: Euro 46.3
NKT Holdings transforming transactions - in a treasury perspective
 NKT I Group Treasury I Split and acquisition in treasury perspective 15 March 2017 I 1 6 NKT Holdings transforming transactions - in a treasury perspective 15 March 2017 Torben Skovsted, Head of Group
Positive trend in earnings and strong cash flow
 Positive trend in earnings and strong cash flow Presentation of the Q3/2017 result Martin Lindqvist, President & CEO Håkan Folin, CFO October 25, 2017 Agenda Q3/2017 and performance by division Financials
Agenda. 1. Highlights FY 2012 Results. 2. Operational Performance Priorities for Financials. 5. Conclusion
 1MARCH 2013 Legal Disclaimer Information in this presentation may involve guidance, expectations, beliefs, plans, intentions or strategies regarding the future. These forward-looking statements involve
PRESENTATION Q Oslo, 19 February 2013 John Binde, CEO Ola Loe, CFO
 PRESENTATION Q4 2012 Oslo, 19 February 2013 John Binde, CEO Ola Loe, CFO AGENDA: Highlights for the period Segment information Group financials Outlook 2 Highlights in Q4 2012: Significant improvement
Interim Report January September 2014
 Interim Report January September 2014 Johan Dennelind President & CEO Capital Markets Day summary 2018 2013 2014 2015 2016 2017 The New TeliaSonera Big changes Stabilize & shape Transform & perform Transform
Performance in January-June August 2010
 Performance in January-June 2010 12 August 2010 Jyri Luomakoski President and CEO Uponor Corporation Summary of Q2/2010 Financial turmoil after Q1 rocked the stabilising development in the market-place
Big Walnut Local School District
 Big Walnut Local School District Monthly Financial Report for the month ended September 30, 2013 Prepared By: Felicia Drummey Treasurer BIG WALNUT LOCAL SCHOOL DISTRICT SUMMARY OF YEAR TO DATE FINANCIAL
Half Year Results. for the six months ended 30 November January Chairman Chris Stone CEO Adam Palser CFO Brian Tenner
 Half Year Results for the six months ended 30 November 2017 16 January 2018 Chairman Chris Stone CEO Adam Palser CFO Brian Tenner Agenda Overview and strategy update Financial highlights Financial performance
Financial & Business Highlights For the Year Ended June 30, 2017
 Financial & Business Highlights For the Year Ended June, 17 17 16 15 14 13 12 Profit and Loss Account Operating Revenue 858 590 648 415 172 174 Investment gains net 5 162 909 825 322 516 Other 262 146
August 2018 Interim Report Q2 2018
 August 2018 Interim Report Q2 2018 Investor presentation Forward looking statements This presentation and related comments contain forward-looking statements. Such statements are subject to many uncertainties
Bank Handlowy w Warszawie S.A. Preliminary consolidated financial results for 2017
 Bank Handlowy w Warszawie S.A. Preliminary consolidated financial results for 2017 February 14th, 2018 www.citihandlowy.pl Bank Handlowy w Warszawie S.A. 2017 Summary Increasing profit on customer business
Q Results. Strong start in May 3, 2016
 Q1 2016 Results Strong start in 2016 May 3, 2016 Legal Disclaimer Information in this presentation may involve guidance, expectations, beliefs, plans, intentions or strategies regarding the future. These
Interim Report Q4 FY 17
 Interim Report Q4 FY 17 Quarter 4 / Fiscal Year 2017 Sustained positive development Sivantos delivered 3.1% organic growth 1) in Q4 FY2017. The moderate growth rate compared to previous quarters was a
Performance Report October 2018
 Structured Investments Indicative Report October 2018 This report illustrates the indicative performance of all Structured Investment Strategies from inception to 31 October 2018 Matured Investment Strategies
INEOS STYROLUTION. Q1/ 2018 Investor Earnings Call
 INEOS STYROLUTION Q1/ 2018 Investor Earnings Call Disclaimer The following presentation includes forward-looking statements, within the meaning of the US securities laws, based on our current expectations
Annual Accounts Annika Falkengren President & CEO
 Annual Accounts 2014 Annika Falkengren President & CEO Unique economic environment Key Interest rates % 2.00 1.80 1.60 1.40 1.20 1.00 0.80 0.60 0.40 0.20 0.00 Jan-14 Sweden Norway Eurozone Feb-14 Mar-14
Interim Report January-June, 2014
 Interim Report January-June, 2014 Johan Dennelind President and CEO All regions contribute to stable margin Group service revenues flat - net sales negatively impacted by Spain Underlying EBITDA maintained
Board of Directors Zurich, 24 March, 2009 Dufry Presentation - Full Year 2009 Results
 Dufry Presentation - Full Year 2009 Results March 2010 1 Legal Disclaimer Information in this presentation may involve guidance, expectations, beliefs, plans, intentions or strategies regarding the future.
Q RESULTS. Conference call 26 October 2018, am CEST. Presentation available at investor.dsv.com
 Q3 RESULTS Conference call 26 October, 11.00 am CEST Presentation available at investor.dsv.com Forward-looking statements This presentation contains forward-looking statements. Such statements are subject
Annual General Meeting Print is more. Dr. Gerold Linzbach, CEO
 Annual General Meeting 2013 Print is more. Dr. Gerold Linzbach, CEO Heidelberger Druckmaschinen AG, July 23, 2013 Agenda 1. Where are we coming from? 2. Where are we today? 3. Where do we want to go? 2
Interim Report Q3 2016
 11 November 2016, Announcement No. 53. NKT Holding A/S, Vibeholms Allé 25, DK-2605 Brøndby, CVR No. 62 72 52 14 Interim Report Q3 2016 CONTENTS Management s review Financial highlights 2 Key messages 3
XML Publisher Balance Sheet Vision Operations (USA) Feb-02
 Feb-02") Page:1 Apr-01 May-01 Jun-01 Jul-01 ASSETS Current Assets Cash and Short Term Investments 15,862,304 51,998,607 9,198,226 Accounts Receivable - Net of Allowance 2,560,786
Page:1 Apr-01 May-01 Jun-01 Jul-01 ASSETS Current Assets Cash and Short Term Investments 15,862,304 51,998,607 9,198,226 Accounts Receivable - Net of Allowance 2,560,786
Interim results briefing. Jyri Luomakoski President and CEO Riitta Palomäki CFO 1 9 / 2016
 Interim results briefing Jyri Luomakoski President and CEO Riitta Palomäki CFO 1 9 / 2016 Q3/2016: Performance in Europe improved, supply issues impacted North American business July - September, M Net
Interim Report Q1 FY 18
 Interim Report Q1 FY 18 Quarter 1 / Fiscal Year 2018 Continued positive development extends into the new fiscal year Sivantos delivered 3.5% organic growth 1) in Q1 2018 with negative Fx translation effects
Media and Financial Analysts Meeting 2018 Carlo Gavazzi Holding AG
 Media and Financial Analysts Meeting 2018 Carlo Gavazzi Holding AG Media and Financial Analysts Meeting 2018 June 28, 2018 Media and Financial Analysts Meeting 2018 AGENDA FOR TODAY WELCOME & OVERVIEW
SMART STEEL. Q Results. Detlef Borghardt, CEO Dr. Matthias Heiden, CFO. August 14, 2018
 SMART STEEL Q2 218 Results Detlef Borghardt, CEO Dr. Matthias Heiden, CFO August 14, 218 Agenda Business Summary Guidance adjustment FY 218 Market update Regional trends: Status and profitability trend
SCHMOLZ + BICKENBACH Investor Presentation Q3/9M 2015 Results Lucerne, 12 November 2015
 SCHMOLZ + BICKENBACH Investor Presentation Q3/9M 20 Results Lucerne, 2 November 20 Disclaimer This publication constitutes neither a prospectus within the meaning of article 652a and/or 6 of the Swiss
FY 2016 Financial Results. Milan March 1st 2017
 FY 2016 Financial Results Milan March 1st 2017 Agenda FY 2016 Highlights o o Group overview Results by business Financial results Appendix FY 2016 Financial Results 2 FY 2016 Highlights Adj. EBITDA at
Interim results briefing Jyri Luomakoski President and CEO Riitta Palomäki CFO 1 3 / 2016
 Interim results briefing Jyri Luomakoski President and CEO Riitta Palomäki CFO 1 3 / 2016 Q1/2016: Steady progress in Europe, strong growth in North America January - March, M Net sales Healthy U.S. market
FY2018 Third Quarter Results
 FY Third Quarter Results Yushin Soga Director and Executive Officer November 14, * Please be reminded that the figures shown in this presentation may be different from those shown in the financial statements
Consolidated financial results for 2Q 2017
 Citi Handlowy Strategy and Investor Relations Department Consolidated financial results for 2Q 2017 August 22 nd, 2017 2Q 2017 summary Consistent growth of customer business: Loan volume growth in institutional
Company Presentation. Cable Conference. ABN AMRO - London, 10th January 2008
 Company Presentation Cable Conference ABN AMRO - London, 10th January 2008 Agenda Company Overview Financials Outlook Appendix 1 A Global Cable Manufacturer The Prysmian Group operates 54 plants, has subsidiaries
2018 Half Year Results
 A GLOBAL LEADER IN METAL FLOW ENGINEERING 2018 Half Year Results 26 July 2018 Patrick André Chief Executive 1 Disclaimer This presentation, which has been prepared by Vesuvius plc (the Company ), includes
Q BAKKAFROST GROUP Oslo 21 August 2018
 BAKKAFROST GROUP Oslo 21 August DISCLAIMER This presentation includes statements regarding future results, which are subject to risks and uncertainties. Consequently, actual results may differ significantly
Year-end Report January-December, 2012
 Year-end Report January-December, 20 Lars Nyberg President and CEO Record-high Free cash flow during 20 Net sales SEK 4,898 million (4,804) Increased 1.2% in local currencies EBITDA* SEK 36,059 million
Lindab Group presentation Q3 2010
 lindab group presentation Lindab Group presentation Q3 2010 David Brodetsky, CEO Nils-Johan Andersson, CFO Agenda Highlights Group Business Areas Strategy Trends and outlook Q & A 2 Lindab Group Highlights
2012 Full Year Results. 27 February 2013
 2012 Full Year Results 27 February 2013 Introduction Stephen Harris Chief Executive Induction hardening Used to obtain a hard case for wear resistance or to increase fatigue strength. The induction process
Analystsʼ Conference 2017
 Analystsʼ Conference 2017 Metzingen March 9, 2017 Mark Langer Ingo Wilts Bernd Hake Chief Executive Officer Chief Brand Officer Chief Sales Officer HUGO BOSS Analysts' Conference 2017 HUGO BOSS March 9,
Interim Report Q2 FY 18
 Interim Report Q2 FY 18 Quarter 2 / Fiscal Year 2018 Strong revenue growth driven by Signia Nx Sivantos delivered a strong organic growth 1) of 9.8% in Q2 2018 while nominal growth at 3.6% accounted negative
Financial results & business update. Quarter ended 30 September October 2016
 Financial results & business update Quarter ended 30 September 2016 19 October 2016 Disclaimer 3 Any remarks that we may make about future expectations, plans and prospects for the company constitute forward-looking
Looking to the medium term
 Looking to the medium term Issued: 4 September 2013 Legal notice This presentation has been prepared to inform investors and prospective investors in the secondary markets about the Group and does not
Media and Financial Analysts Meeting 2017 Carlo Gavazzi Holding AG
 Media and Financial Analysts Meeting 2017 Carlo Gavazzi Holding AG Media and Financial Analysts Meeting 2017 June 22, 2017 Media and Financial Analysts Meeting 2017 AGENDA FOR TODAY WELCOME & OVERVIEW
Q presentation. 5 February 2009
 presentation 5 February 29 presentation Christian Rynning-Tønnesen President and CEO Webcast 5 February 29 : A year of firm actions Q1/Q2: Closure of Steti and Follum PM2 Capacity reduction of 26. t/y
Kuehne + Nagel International AG
 Kuehne + Nagel International AG Analyst Conference Call 1 st Half-Year 2011 Results July 18, 2011 (CET 14.00) Schindellegi, Switzerland Agenda Welcome & Highlights 1st Half Year 2011 Gerard van Kesteren
OTHER DEPOSITS FINANCIAL INSTITUTIONS DEPOSIT BARKAT SAVING ACCOUNT
 WEIGHTAGES JAN FEB MAR APR MAY JUN JUL AUG SEPT OCT NOV DEC ANNOUNCEMENT DATE 19.Dez.14 27.Jän.15 24.Feb.15 26.Mär.15 27.Apr.15 26.Mai.15 25.Jun.15 28.Jul.15 26.Aug.15 23.Sep.15 27.Okt.15 25.Nov.15 MUDARIB
Siemens Gamesa Renewable Energy Q Results
 Siemens Gamesa Renewable Energy Q2 208 Results 04 May 208 Disclaimer This material has been prepared by Siemens Gamesa Renewable Energy, and is disclosed solely for information purposes. This document
Agenda. 1. Highlights FY 2013 Results. 2. Financials. 3. Conclusion
 1 March 2014 Legal Disclaimer Information in this presentation may involve guidance, expectations, beliefs, plans, intentions or strategies regarding the future. These forward-looking statements involve
Spheria Australian Smaller Companies Fund
 29-Jun-18 $ 2.7686 $ 2.7603 $ 2.7520 28-Jun-18 $ 2.7764 $ 2.7681 $ 2.7598 27-Jun-18 $ 2.7804 $ 2.7721 $ 2.7638 26-Jun-18 $ 2.7857 $ 2.7774 $ 2.7690 25-Jun-18 $ 2.7931 $ 2.7848 $ 2.7764 22-Jun-18 $ 2.7771
H Financial Results. Milan July 28th, 2016
 H1 2016 Financial Results Milan July 28th, 2016 Agenda H1 2016 Highlights o o o Group overview Results by business Outlook Financial results Appendix H1 2016 Financial Results 2 H1 2016 Highlights Organic
Results briefing Helsinki 26 October 2007
 Results briefing Helsinki 26 October 2007 Jan Lång President and CEO Declining market trends in Q3 Q3 showed a rapid drop in residential housing solutions demand Infrastructure solutions demand on satisfactory/good
Interim Report Q1 2017
 NKT A/S, Vibeholms Allé 25, DK-2605 Brøndby, Company Reg. No. 62 72 52 14 Interim Report Q1 2017 CONTENTS Management s review Intention to split NKT A/S 2 Key messages 3 NKT 4 NKT Photonics 9 Group financials
Q Financial Results. Milan May 10th, 2016
 Q1 2016 Financial Results Milan May 10th, 2016 Agenda Q1 2016 Highlights o o o Group overview Results by business Outlook Financial results Appendix Q1 2016 Financial Results 2 Q1 2016 Highlights Organic
FY2018 First Quarter Results
 FY First Quarter Results May 15, * Please be reminded that the figures shown in this presentation may be different from those shown in the financial statements as this presentation has been prepared for
Executive Summary. July 17, 2015
 Executive Summary July 17, 2015 The Revenue Estimating Conference adopted interest rates for use in the state budgeting process. The adopted interest rates take into consideration current benchmark rates
Financial Statements Release 2017
 Financial Statements Release 217 CEO Roeland Baan CFO Chris de la Camp January 31, 218 Disclaimer This presentation contains, or may be deemed to contain, statements that are not historical facts but forward-looking
MULTI-ASSET CLASS 1 EQUITIES: DEVELOPED COUNTRIES 1 EQUITY EMERGING COUNTRIES 2
 10 2 3 6 8 9 13 14 MULTI-ASSET CLASS 1 EQUITIES: DEVELOPED COUNTRIES 1 EQUITY EMERGING COUNTRIES 2 Alpha Current Previous Alpha Current Previous Alpha Current Previous weight weight weight weight weight
Interim Results 6-month figures FY 13
 Interim Results 6-month figures FY 13 Gerold Linzbach, CEO Dirk Kaliebe, CFO Robin Karpp, Head of IR HEIDELBERG, NOVEMBER 7TH, 2012 Review FY 2012/2013 Order intake of 668m in on par with previous year
Q presentation. 19 November 2015
 Q3 2015 presentation 19 November 2015 1 Today s presenters Axel Hjärne Chief Executive Officer Gert Sköld Chief Financial Officer 2 Eltel in brief Q3 2015 business performance Q3 2015 financials Market
Q FINANCIAL RESULTS. Milan May 10 th, 2018
 Q1 2018 FINANCIAL RESULTS Milan May 10 th, 2018 1 AGENDA Q1 2018 Highlights o o o Group overview Results by business Outlook Financial results Appendix 2 Q1 2018 Financial Highlights Organic growth recovery
Huhtamaki roadshow presentation. Investor Relations Copenhagen Jan 8, 2010
 Huhtamaki roadshow presentation Investor Relations Copenhagen Jan 8, 2010 Huhtamaki in brief A leading manufacturer of consumer and specialty packaging with head office in Espoo, Finland Net sales EUR
INTERIM PRESENTATION Q October 2018
 INTERIM PRESENTATION 25 October JUAN VARGUES, PRESIDENT & CEO HIGHLIGTHS Organic growth Good organic growth in EMEA Flat organic growth in Americas despite -7% RV OEM APAC down due to softer market in
Q RESULTS. Conference call 26 October 2017, am CEST. Presentation available at investor.dsv.com
 2017 RESULTS Conference call 26 October 2017, 11.00 am CEST Presentation available at investor.dsv.com Forward-looking statements This presentation contains forward-looking statements. Such statements
HELLA Investor Update Q1 2015/16
 HELLA Investor Update Q1 2015/16 Conference Call on September 25th, 2015 Dr. Wolfgang Ollig, Chief Financial Officer Carl Pohlschmidt, Finance Director HF-7761DE_C (2012-12) Disclaimer This document was