SalMar ASA. Presentation Q CEO Olav-Andreas Ervik CFO Trond Tuvstein
|
|
|
- Ferdinand Walters
- 5 years ago
- Views:
Transcription

1 SalMar ASA Presentation Q CEO Olav-Andreas Ervik CFO Trond Tuvstein

2 Olav-Andreas Ervik new CEO of SalMar 41 years, from Frøya More than 20 years of experience from the aquaculture industry Worked in SalMar since 2012 Director Farming since 2014 Favourite cultural tenant: What we do today we do better than yesterday 2


3 Agenda Highlights Strategic priorities Operational update Financial update Outlook
4 Q Satisfying performance Strong price achievement in the quarter Stable biological and cost development in Central Norway Operational EBIT in Northern Norway impacted by increased costs on harvested volume Total Operational EBIT NOK million, up from NOK in the same period last year Harvest volume (1,000 tons) Operating income (NOKm) EBIT/kg (NOK) ,430 2,930 2,677 2,781 2,


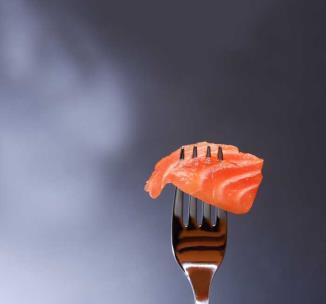
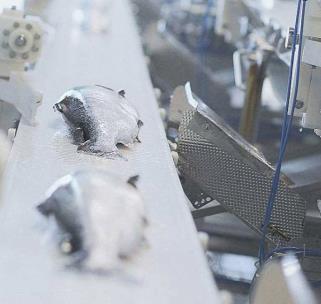
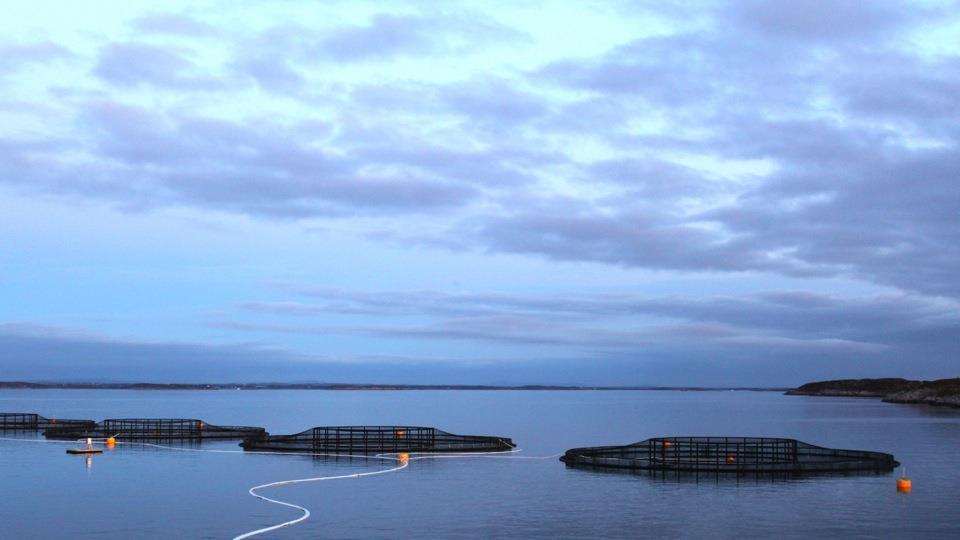
5 SalMar - a fully integrated salmon farmer TRACEABLE SUPPLY CHAIN Genetics Smolt Farming Harvesting & VAP Sales Rauma strain Essential for the performance in the entire value chain 100 wholly owned licenses in Norway 112 including R&D and partnerships InnovaMar on Frøya Vikenco at Aukra SalMar AS Japan, Vietnam and Korea Global span 5


6 SalMar in front Passion for Salmon Strategic focus Cost leadership Operational Excellence Innovative leadership 6
7 Operational update
8 Farming Central Norway Q Q FY 2017 Operating income (NOKm) Operational EBIT (NOKm) Operational EBIT % 38.6 % 39.5 % 36.4 % Harvested volume (tgw) EBIT/kg Stable cost development - expect reduced costs going forward Harvest volume mainly from Autumn-16 generation Some accelerated harvesting due to fish welfare 13% organic salmon in the quarter Harvest volume (1,000 tons) EBIT/kg (NOK) Expect harvest volume of 96,000 tons in
9 Farming Northern Norway Q Q FY 2017 Operating income (NOKm) Operational EBIT (NOKm) Operational EBIT % 41.1 % 53.2 % 48.0 % Harvested volume (tgw) EBIT/kg Satisfactory performance in the quarter Sea lice treatments negatively affects cost and profitability Unfavourable distribution of harvest volumes compared to price development in the period Harvest volume (1,000 tons) EBIT/kg (NOK) Expect higher cost on harvested biomass going forward Harvest volume of 47,000 tons in
10 Sales & Processing Q Q FY 2017 Operating income (NOKm) Operational EBIT (NOKm) Operational EBIT % -0.6 % -2.6 % 0.4 % Strong price achievement Contract share of 39 % at prices below average spot Operating income (NOKm) EBIT-margin (%) 6.3 % Profitability negatively impacted by seasonal lower volumes Higher fixed cost/kg Contract share currently around 50% for Q and 36% for remaining volume ,398 2,996 2,763 2,767 2, % -0.6 % -2.6 % -3.8 % 10
11 Norskott Havbruk Harvest volume (1,000 tons) Q Q FY 2017 Operating income (NOKm) Operational EBIT (NOKm) Operational EBIT % 33.4 % 38.5 % 32.1 % Value adjustments biomass Profit before tax SalMar s share after tax Harvested volume (tgw) EBIT/kg EBIT/kg (NOK) Strong result in the quarter Solid operational performance Positive biological development in all farming areas Contract share of 32% Harvest guidance at 26,000 tons for
12 Arnarlax HF Harvest volume (1,000 tons) Q Q FY 2017 Operating income (NOKm) Operational EBIT (NOKm) Operational EBIT % % 23.8 % 9.6 % Value adjustments biomass Profit before tax SalMar s share after tax Harvested volume (tgw) EBIT/kg EBIT/kg (NOK) Earnings impacted by increased level of mortality Handling of fish at very cold sea temperatures Transportation of fish between sites All the cost related to the increased level of mortality is booked in the quarter Ongoing structuring continue to affect costs company still in early phase Revised guiding: Now expect harvest volumes of 8,000 tons in

13 Ocean Farm continue to perform well Expect first harvest 2H

14 Financial update
15 EBIT/kg (NOK) Operational EBIT deviation analysis (qoq) Increased earnings driven by significantly higher spot prices in the quarter ,17 - Earnings from Sales & Processing affected by seasonality and negative contract contributions Increased cost and unfavourable timing of harvest in Farming Northern Norway affect farming results Operational EBIT/kg Q Price (Nasdaq) Sales/Industry Farming Eliminations Operational EBIT/kg Q
16 Group profit and loss NOK million 1Q 2018 Q FY 2017 Operating income 2 531, , ,2 Cost of goods sold 1 053, , ,5 Payroll expenses 239,8 230,1 929,1 Other operating expenses 408,6 354, ,8 EBITDA 829,4 764, ,8 Depreciations and write-downs 121,3 94,1 418,6 Operational EBIT 708,1 670, ,2 Fair value adjustment 151,6-182,1-370,0 Operational profit 859,8 488, ,2 Income from investments in associates 57,5 82,2 208,9 Net interest costs -22,9-24,5-95,9 Other financial items 19,1 2,2-49,1 Revenues and earnings driven by higher volumes year-over-year EBIT/kg at NOK vs NOK in Q1 17 Average salmon price (NASDAQ) down NOK 5.52/kg year-over-year Negative earnings contribution from Sales & Processing in the quarter Profit before tax 913,4 548, ,2 Tax 191,8 105,3 558,4 Net profit for the period 721,6 443, ,8 Items to be reclassified to profit and loss in subsequent periods: Change in translation diff. associates -19,4 1,4 41,7 Change in translation diff. subsidaries 0,2 1,1-0,3 Cash flow hedge, net tax - -2,5-11,5 Change in fair value of currency instruments -3,6-3,9 16 Total comprehensive income 698,8 443, ,6
17 Group balance sheet NOK million ASSETS Intangible fixed assets 3 011, , ,0 Tangible fixed assets 3 578, , ,8 Financial fixed assets 1 056,9 990, ,9 Total fixed assets 7 646, , ,6 Inventory 4 431, , ,6 Accounts receivables 645,3 553,0 501,1 Other short-term receivables 250,3 277,9 242,9 Cash and cash equivalents 489,1 218,4 177,1 Total current assets 5 816, , ,6 TOTAL ASSETS , , ,2 CAPEX in line with ongoing investment programs Fair value of biomass increased by NOK million in the quarter Net Interest-bearing debt reduced by NOK million during the quarter Solid financial position EQUITY AND LIABILITIES Paid-in equity 567,1 541,1 557,6 Reserves 7 713, , ,4 Minority interests 96,3 91,6 88,1 Total equity 8 376, , ,1 Provisions for liabilities 1 390, , ,2 Int. bearing long-term liabilities 1 100, , ,0 Total long-term liabilities 2 490, , ,2 Int. bearing short-term liabilities 124,3 162,6 243,6 Other short-term liabilities 2 471, , ,3 Total short-term liabilities 2 595, , ,9 TOTAL EQUITY AND LIABILITIES , , ,2 17 Net interest bearing debt 735, , ,5 Equity share 62,2 % 55,0 % 59,3 %
18 Group cash flow NOK million Q Q FY 2017 Profit before tax 913,4 548, ,2 Tax paid in period -11,3-14,1-423,2 Depreciation 121,3 94,1 418,6 Share Realized of profit/loss and unrealized from gains associates on financial as -57, , ,9 - Gains exit subsidiaries ,2 Change in fair value adjustments -151,6 182,1 370,0 Change in working capital -227,0-35,8 196,6 Other changes 45,0 40,6 175,4 Net cash flow from operating activities 632,2 733, ,4 Net cash flow from investing activities -118,7-168,1-758,0 Change in interest-bearing debt -175,3-593, ,9 Dividend paid out ,0 Interest paid -22,9-24,5-95,9 Other changes - -4,0-3,8 Net cash flow from financing activities -198,2-621, ,6 Net change in cash for the period 315,3-56,3-100,2 Foreign exchange effects -3,3 1,1 3,5 Cash in the beginning of the period 177,1 273,7 273,7 Cash flow from operations driven by high salmon prices and satisfactory operational performance Net cash flow from investments at NOK million Operating assets NOK 90.9 million Growth NOK 110,1 million Received dividends of NOK 82.2 million Cash increased by NOK million during the period 2018 CAPEX estimated to NOK 356 million Maintenance NOK 276 million Smolt and hatchery NOK 80 million 18 Cash at the end of the period 489,1 218,5 177,1
19 Outlook


20 Outlook Guiding of 143,000 tons for 2018 maintained Overall stable cost development expected in 2Q 2018 Ocean Farm volumes to reach the market in 2H 2018 Continue to explore opportunities for capacity growth Contract share for remaining 2018 volumes currently at 36% Global supply expected to increase by 4% in 2018 Expect continued good demand in core markets

21 THANK YOU FOR YOUR ATTENTION! salmar.no
SalMar ASA. Presentation Q CEO Leif Inge Nordhammer CFO Trond Tuvstein
 SalMar ASA Presentation Q1 2015 CEO Leif Inge Nordhammer CFO Trond Tuvstein Agenda Highlights Financial update Operational update Outlook First quarter 2015 highlights Improved operations Challenging biological
SalMar ASA. Presentation Q CEO Yngve Myhre, CFO Trond Tuvstein Oslo, 14 November w w w. s a l m a r. n o
 Presentation Q3 2013 SalMar ASA CEO Yngve Myhre, CFO Trond Tuvstein Oslo, 14 November 2013 2 Agenda Highlights Financial update Operational update Market and outlook Third quarter highlights Another strong
FOURTH QUARTER / 2016
 SATISFACTORY RESULT DESPITE BIOLOGICAL CHALLENGES HIGHLIGHTS IN THE FOURTH QUARTER 2016 Continued high salmon prices result in revenue and profit growth. High production costs for part of the volume harvested
THIRD QUARTER / 2018
 REPORT FOR THE THIRD QUARTER 2018 HIGHLIGHTS Operationally strong quarter, with cost improvements and good price achievement. Record-high volume for sales & processing with positive contribution Total
Third QUARTER / 2017
 STRONG OPERATIONS AND IMPROVING BIOLOGY HIGHLIGHTS IN THE THIRD QUARTER Strong operations and effective management of the improving biological situation Lower production costs and higher prices achieved
FOURTH QUARTER / 2014
 SATISFACTORY RESULT DESPITE BIOLOGICAL CHALLENGES HIGHLIGHTS IN THE FOURTH QUARTER 2014 Good salmon prices and high harvested volume produced profit growth and record operating revenues. 50% of the harvested
Q August 24th. Lerøy Seafood Group ASA. CEO Henning Beltestad CFO Sjur S. Malm
 Q2 2017 August 24th Lerøy Seafood Group ASA CEO Henning Beltestad CFO Sjur S. Malm Agenda Highlights Key financial figures Outlook Q2 2017 EBIT before FV adj. NOK 801 million Harvest volume 26 156 GWT
SalMar ASA First quarter
 SalMar ASA First quarter 2009 1 STRONG SALMON PRICES AND SATISFACTORY EARNINGS Strong salmon prices contributed to satisfactory earnings for the SalMar Group in the first quarter 2009. While Scottish Sea
Q November 9th. Lerøy Seafood Group ASA. CEO Henning Beltestad CFO Sjur S. Malm
 Q3 2017 November 9th Lerøy Seafood Group ASA CEO Henning Beltestad CFO Sjur S. Malm Agenda Highlights Key financial figures Outlook Q3 2017 EBIT before FV adj. NOK 861 million Harvest volume 46 024 GWT
PRESENTATION Q Oslo, 19 February 2013 John Binde, CEO Ola Loe, CFO
 PRESENTATION Q4 2012 Oslo, 19 February 2013 John Binde, CEO Ola Loe, CFO AGENDA: Highlights for the period Segment information Group financials Outlook 2 Highlights in Q4 2012: Significant improvement
Q May 12th Oslo
 Q1 2016 May 12th Oslo Lerøy Seafood Group ASA CEO Henning Beltestad CFO Sjur S. Malm Agenda Highlights Key financial figures Outlook Q1 2016 EBIT before FV adj. NOK 584.5 million EBIT/kg all inclusive
PRESENTATION Q Oslo, 14 November 2012 John Binde, CEO Ola Loe, CFO
 PRESENTATION Q3 2012 Oslo, 14 November 2012 John Binde, CEO Ola Loe, CFO AGENDA: Highlights for the period Segment information Group financials Outlook 2 Highlights in Q3 2012: Strong consumption growth
Grieg Seafood ASA. griegseafood.com. Andreas Kvame CEO. Atle Harald Sandtorv CFO. 8 November 2017
 Grieg Seafood ASA Andreas Kvame CEO Atle Harald Sandtorv CFO 8 November 2017 1 Agenda Highlights This is Grieg Seafood Business Units (Regions) Financials Outlook 2 Highlights Q3 2017 Improved results
Q MAY 8TH 2018
 Q1 2018 MAY 8TH 2018 1. Highlights 2. Key Financial Figures 3. Outlook Highlights Klikke for å legge til annet bilde Q1 2018 - EBIT beforefv adj. NOK 960 million - Harvest volume 37576 GWT - EBIT/kg all
Villa Organic AS fourth quarter 2012
 Notice to shareholders; Villa Organic AS fourth quarter 2012 Highlights fourth quarter 2012 The average prices were approximately at the same level as Q3, but improvement was observed towards the end of
Q NOVEMBER 8TH 2018
 Q3 2018 NOVEMBER 8TH 2018 1. Highlights 2. Key Financial Figures 3. Outlook Highlights Klikke for å legge til annet bilde Q3 2018 - EBIT before FV adj. NOK 660 million - Harvest volume 37 227 GWT - EBIT/kg
PRESENTATION Q Oslo, 15 August 2013 John Binde, CEO Ola Loe, CFO
 PRESENTATION Q2 2013 Oslo, 15 August 2013 John Binde, CEO Ola Loe, CFO AGENDA: Highlights for the period Segment information Group financials Outlook 2 Highlights in Q2 2013: Best quarterly operational
PRESENTATION Q Oslo, 26 February 2014 John Binde, CEO Ola Loe, CFO
 PRESENTATION Q4 2013 Oslo, 26 February 2014 John Binde, CEO Ola Loe, CFO AGENDA: Highlights for the period Segment information Group financials Outlook 2 Highlights in Q4 2013: The best quarterly and yearly
Presentation of Cermaq
 Presentation of Cermaq North Atlantic Seafood Seminar Oslo, 8 th March 2012 Agenda Introduction to Cermaq Key results 2011 Focus on Mainstream Chile Outlook 2012 Photograph: Alf Børjesson 2 This is Cermaq
Lerøy Seafood Group. Preliminary financial figures February 25th Helge Singelstad. Alf-Helge Aarskog. Ivan Vindheim.
 Lerøy Seafood Group Preliminary financial figures 2009 February 25th 2010 Helge Singelstad Chairman Alf-Helge Aarskog CEO Ivan Vindheim CFO 1 Agenda 1. 1 Considerations 2. 2 Key financial figures Q4 2009
Grieg Seafood ASA. griegseafood.com. Andreas Kvame CEO. Atle Harald Sandtorv CFO. 11 November 2016
 Grieg Seafood ASA Andreas Kvame CEO Atle Harald Sandtorv CFO 11 November 2016 1 Agenda Highlights Business Units (Regions) Financials Outlook 2 HIGHLIGHTS Q3 2016 3 Highlights Q3 2016 Good quarterly results
RS Platou Markets. Seafood conference. 10th June 2010
 RS Platou Markets Seafood conference 10th June 2010 Agenda Introduction to Cermaq Highlights Q1 2010 and outlook full year Chile Recovery 2 Overview of Cermaq One of the global leaders in the aquaculture
BAKKAFROST INTRAFISH SEAFOOD INVESTOR FORUM London 13 September 2018
 BAKKAFROST INTRAFISH SEAFOOD INVESTOR FORUM London 13 September 2018 DISCLAIMER This presentation includes statements regarding future results, which are subject to risks and uncertainties. Consequently,
Q BAKKAFROST GROUP Oslo 20 February 2018
 BAKKAFROST GROUP Oslo 20 February 2018 DISCLAIMER This presentation includes statements regarding future results, which are subject to risks and uncertainties. Consequently, actual results may differ significantly
P/F Bakkafrost Condensed Consolidated Interim Report for Q and 9 months 2013
 P/F Bakkafrost Condensed Consolidated Interim Report for Q3 2013 and 9 months 2013 15000 10000 5000 0 Harvest volume - TGW Q3 12 Q4 12 Q1 13 Q2 13 Q3 13 Operational EBIT mdkk 200 150 100 50 0 Q3 12 Q4
Villa Organic AS forth quarter 2009
 Villa Organic AS forth quarter 29 Highlights Forth quarter 29 The fourth quarter was a good quarter for the Villa Group. The EBIT was 12,1 MNOK and net profit before tax 8,8 MNOK The harvested volume in
P/F Bakkafrost. Condensed Consolidated Interim Report for Q and 12 Months Operational EBIT mdkk
 P/F Bakkafrost Condensed Consolidated Interim Report for Q4 2015 and 12 Months 2015 Harvest volume TGW 15,000 12,000 9,000 6,000 3,000 Q4 14 Q1 15 Q2 15 Q3 15 Q4 15 Operational EBIT mdkk 300 250 200 150
Lerøy Seafood Group. Quarterly report Second quarter August 19th Helge Singelstad. Ivan Vindheim CEO CFO
 Lerøy Seafood Group Quarterly report Second quarter 2009 August 19th 2009 Helge Singelstad CEO Ivan Vindheim CFO 1 Agenda 1. 1 Considerations 2. 2 Key financial figures Q2 2009 3. 3 Lerøy at a glance 4.
Q BAKKAFROST GROUP Oslo 19 February 2019
 BAKKAFROST GROUP Oslo 19 February 2019 DISCLAIMER This presentation includes statements regarding future results, which are subject to risks and uncertainties. Consequently, actual results may differ significantly
The Norwegian Aquaculture Analysis - Summary of key findings
 The Norwegian Aquaculture Analysis - Summary of key findings Nordområdekonferansen Bodø - November 9 th 217 Eirik Moe Managing Partner EY Seafood The EY Aquaculture Analysis Background EY has since 26
Lerøy Seafood Group. Quarterly report First quarter May 12th Helge Singelstad. Henning Beltestad. Ivan Vindheim.
 Lerøy Seafood Group Quarterly report First quarter 2010 May 12th 2010 Helge Singelstad Chairman Henning Beltestad CEO Ivan Vindheim CFO 1 Agenda 1. 1 Considerations 2. 2 Key financial figures Q1 2010 3.
Marine Harvest. Q Presentation 10 May 2017
 Marine Harvest Q1 2017 Presentation 10 May 2017 1 Forward looking statements This presentation may be deemed to include forward-looking statements, such as statements that relate to Marine Harvest s contracted
Cermaq ASA Presentation for Pareto Securities Oslo, 14 th June 2012
 Cermaq ASA Presentation for Pareto Securities Oslo, 14 th June 2012 1 2020 2015 2010 2005 2000 1995 1990 1985 1980 1975 1970 1965 1960 1955 1950 Aquaculture: a sustainable growth industry Our growing population
NORWAY ROYA L S A L M ON PRESENTATION Q Oslo, 7 November 2017 Charles Høstlund, CEO Ola Loe, CFO 1
 PRESENTATION Q3 2017 Oslo, 7 November 2017 Charles Høstlund, CEO Ola Loe, CFO 1 AGENDA: Highlights for the period Segment information Group financials Markets Outlook 2 Highlights in Q3 2017 Operational
Marine Harvest. Q Presentation 24 August 2017
 Marine Harvest Q2 2017 Presentation 24 August 2017 1 Forward looking statements This presentation may be deemed to include forward-looking statements, such as statements that relate to Marine Harvest s
Q BAKKAFROST GROUP Oslo 21 August 2018
 BAKKAFROST GROUP Oslo 21 August DISCLAIMER This presentation includes statements regarding future results, which are subject to risks and uncertainties. Consequently, actual results may differ significantly
Marine Harvest. Q Presentation 1 November 2017
 Marine Harvest 1 Q3 2017 Presentation 1 November 2017 Forward looking statements This presentation may be deemed to include forward-looking statements, such as statements that relate to Marine Harvest
15,000 12, , , , ,158 13,004 12, , ,664
 15,000 12,000 13,004 10,934 12,940 13,158 10,664 350 307 300 9,000 335 255 254 30 26.34 21.58 22.26 23.22 16 Q2 16 Q3 16 24.33 20 200 6,000 10 100 3,000 0 400 16 Q2 16 Q3 16 Q4 16 17 0 16 Q2 16 Q3 16 Q4
All figures in NOK 1,000 Q3 11 Q3 10 Sept. 30, 2011 Sept. 30,
 Austevoll Seafood ASA 0 INTERIM REPORT Q3 2011 Significant reduction in interest-bearing liabilities in the quarter Third quarter is low season for production of pelagic fish in Europe and South America
Marine Harvest. Q Presentation 14 February 2018
 Marine Harvest Q4 2017 Presentation 14 February 2018 1 Forward looking statements This presentation may be deemed to include forward-looking statements, such as statements that relate to Marine Harvest
Sølvtrans Holding ASA Q Oslo, 7 November Roger Halsebakk, CEO Jon Kvalø, CFO
 Sølvtrans Holding ASA Q3 2012 Oslo, 7 November 2012 Roger Halsebakk, CEO Jon Kvalø, CFO 1 Highlights in the quarter 2 Financial review 3 Operational and market review 4 Summary and outlook 5 Appendix Highlights
Marine Harvest. Q Presentation 22 August 2018
 Marine Harvest Q2 2018 Presentation 22 August 2018 Forward looking statements This presentation may be deemed to include forward-looking statements, such as statements that relate to Marine Harvest s contracted
Events after balance sheet date
 Austevoll Seafood ASA 0 Financial Report Q4 2011 Successful second fishing season for anchoveta in Peru A positive result recorded for fish farming, sale and distribution, in difficult conditions Seasonally,
GSF Quarterly report - English version
 GSF Quarterly report - English version Q1 2018 About Grieg Seafood Grieg Seafood ASA is one of the world s leading salmon farmers. The Group has an annual production capacity of more than 100,000 tons
Interim Report Q2-18
 Interim Report Q2-18 HIGHLIGHTS Operational EBIT of NOK 181 million o Operational EBIT per kg of NOK 24.73 in Region North o Operational EBIT per kg of NOK 23.49 in Region South o Non-recurring item of
Grieg Seafood ASA Quarterly report Q4 2018
 bv Grieg Seafood ASA Quarterly report ABOUT GRIEG SEAFOOD Grieg Seafood ASA is one of the world's leading salmon farmers, specializing in Atlantic salmon. The Group has an annual production target of 100
 - - - - - - - 20 000 15 000 10 000 5 000 0 2017 2014 2013 2012 2011 2010 2009 2008 2007 2006 2005 2004 2003 2002 2001 2000 1999 1995 1 400 30 1 200 25 1 000 800 600 400 777 20 15 10 16,5 200 5 0 0 Q4/17
Financial report Q3 2014
 Financial report Q3 2014 Austevoll Seafood ASA Financial report Q3 2014 Index Key figures for the Group... 03 Q3 2014... 04 Operating segments... 04 Cash flows... 05 Financial information as of 30 September
Presentatio. on Q3 2010
 Presentatio on Q3 2010 CEO Regin Jacobsen CFO Teitur Samuelsen Oslo November 9 th 2010 Disclaimer This presentation includes statements regarding future results, which are subject to risks and uncertainties.
Grieg Seafood ASA Transcript Q presentation
 Grieg Seafood ASA Transcript Q3 2018 presentation Introduction and Segment review Andreas Kvame (CEO) Introduction: Welcome everyone. Atle Harald and I will be giving his presentation as usual. We will
Marine Harvest Q Presentation
 Marine Harvest Q2 2015 Presentation Forward looking statements This presentation may be deemed to include forward-looking statements, such as statements that relate to Marine Harvest s contracted volumes,
Marine Harvest Q Presentation
 Marine Harvest Q1 2015 Presentation Forward looking statements This presentation may be deemed to include forward-looking statements, such as statements that relate to Marine Harvest s contracted volumes,
Your Aquaculture Technology and Service Partner. Q Presentation Oslo - May 8 th, 2015 Trond Williksen, CEO Eirik Børve Monsen, CFO
 Q1 2015 Presentation Oslo - May 8 th, 2015 Trond Williksen, CEO Eirik Børve Monsen, CFO Agenda 1 Highlights 2 Financial performance 3 Outlook 4 Q&A Highlights Q1 2015 - by CEO Trond Williksen 3 On track
Santiago, May 11 th, Results Presentation 1Q18
 Santiago, May 11 th, 2018 Results Presentation 1Q18 Agenda I. Highlights II. III. Financial Statements Supply, Demand and Prices IV. Farming Operation V. Prospects 2 Highlights EBIT 1Q18 USD 18.8 million
Harvest volume (GW) tonnes. Operating revenue NOK million. Operational EBIT NOK million Q2 11 Q3 11 Q4 11 Q1 12 Q2 12 Q2 11 Q3 11 Q4 11 Q1 12 Q2 12
 tonnes. Operating revenue NOK million. Operational EBIT NOK million Q2 11 Q3 11 Q4 11 Q1 12 Q2 12 Q2 11 Q3 11 Q4 11 Q1 12 Q2 12") The market showed strong ability to absorb 30% industry growth Prices in line with Q1 - Down 24% in Europe and ~35% in the US compared to Q2 2011 Satisfactory performance in Norway - excellent result in
The market showed strong ability to absorb 30% industry growth Prices in line with Q1 - Down 24% in Europe and ~35% in the US compared to Q2 2011 Satisfactory performance in Norway - excellent result in
Interim Report Q2-17
 Interim Report Q2-17 HIGHLIGHTS Operational EBIT of NOK 136 million o o o Operational EBIT per kg of NOK 29.68 in Region North Operational EBIT per kg of NOK 31.30 in Region South Non-recurring item of
Your Aquaculture Technology and Service Partner. Company presentation November 2014
 Company presentation November 2014 Important Information About this Company Presentation This Company Presentation has been prepared by AKVA group ASA ("AKVA group" or the "Company") for information purposes
Your Aquaculture Technology and Service Partner. Q Presentation Oslo - August 20 th, 2015 Trond Williksen, CEO Eirik Børve Monsen, CFO
 Q2 2015 Presentation Oslo - August 20 th, 2015 Trond Williksen, CEO Eirik Børve Monsen, CFO Agenda 1 Highlights 2 Financial performance 3 Outlook 4 Q&A Highlights Q2 2015 - by CEO Trond Williksen 3 Best
Q Financial presentation. Arne Møgster CEO Britt Kathrine Drivenes CFO
 Q2 2015 Financial presentation Arne Møgster CEO Britt Kathrine Drivenes CFO Highlights All figures in NOK 1,000 Q2 2015 (restated) Q2 2014 H1 2015 (restated) H1 2014 2014 Revenue 4 107 801 3 606 154 7
Highlights for the quarter Q2 / EBIT NOK 60 million pre biomass write-down
 Half year report Highlights for the quarter EBIT NOK 60 million pre biomass write-down EBIT pre fair value and biomass write-down (NOK million) 318 348 300 101 60 Mainstream results negatively impacted
Q THIRD QUARTER BAKKAFROST GROUP Glyvrar 5 November 2013
 Q3 2013 THIRD QUARTER BAKKAFROST GROUP Glyvrar 5 November 2013 DISCLAIMER This presentation includes statements regarding future results, which are subject to risks and uncertainties. Consequently, actual
Q U A R T E R L Y R E P O R T 2 N D Q U A R T E R
 Q U A R T E R L Y R E P O R T 2 N D Q U A R T E R 2 0 0 7 1. Grieg Seafood develops as planned Grieg Seafood was listed in June, and has now 869 shareholders after 2 shares issues of MNOK 700 in total.
Q1 Financial Presentation. Arne Møgster CEO Britt K. Drivenes - CFO
 Q1 Financial Presentation Arne Møgster CEO Britt K. Drivenes - CFO As a globally integrated pelagic fishery and seafood specialist, (AUSS) operates through subsidiaries and associated companies, fishing
Q Nova Austral Financial Reporting May 2nd, 2018
 Q1-2018 Nova Austral Financial Reporting May 2nd, 2018 Agenda A. Nova Austral Pillars & Fundamentals B. Market and company updates C. Financial Report 1) Key Financial summary 2) LTM EBITDA, Revenue and
Results Presentation 3Q17
 Multiexport Foods S.A. Results Presentation 3Q17 Santiago, November 2017 Agenda I. Highlights II. III. Financial Statements Supply, Demand and Prices IV. Farming Operation V. Perspectives 2 Highlights
Financial Report Q FINANCIAL REPORT Q1 2010
 Financial Report Q4 2010 FINANCIAL REPORT Q1 2010 Austevoll Seafood ASA 0 Interim Report Q4 2010 Fourth quarter also achieved record-high operating result Good market and good prices for salmon and trout
Interim Report Q1-18
 Interim Report Q1-18 HIGHLIGHTS Operational EBIT of NOK 193 million o o Operational EBIT per kg of NOK 19.22 in Region North Operational EBIT per kg of NOK 15.64 in Region South The highest sold and harvested
Sølvtrans Holding ASA Q Oslo, 14 August Roger Halsebakk, CEO Jon Kvalø, CFO
 Sølvtrans Holding ASA Q2 2012 Oslo, 14 August 2012 Roger Halsebakk, CEO Jon Kvalø, CFO 1 Highlights in the quarter 2 Financial review 3 Operational and market review 5 Summary and outlook 6 Appendix Highlights
Grieg Seafood ASA - Second Quarter 2012 & First Half 2012 Report. Highlights Second Quarter 2012 & First Half 2012 Report
 Grieg Seafood ASA - Second Quarter 2012 & First Half 2012 Report Highlights Second Quarter 2012 & First Half 2012 Report Further strong increase in global supply. Sound increase in demand in most markets.
Oslo, February 27 th, 2012 Trond Williksen, CEO Eirik Børve Monsen, CFO
 Q4 2012 Presentation ti Oslo, February 27 th, 2012 Trond Williksen, CEO Eirik Børve Monsen, CFO 1 Agenda Highlights Q4 2012 Trond Williksen, CEO Financial performance Q4 20122 Eirik Børve Monsen, CFO Statement
Q BAKKAFROST GROUP Oslo 10 May 2016
 2016 BAKKAFROST GROUP Oslo 10 May 2016 DISCLAIMER This presentation includes statements regarding future results, which are subject to risks and uncertainties. Consequently, actual results may differ significantly
Austevoll Seafood ASA
 Austevoll Seafood ASA Financial Report Q4 2016 and preliminary figures for 2016 INDEX Key figures for the group... 03 Q4 2016... 04 Operating segments... 04 Cash Flows Q4 2016... 06 Cash flows 2016...07
Q BAKKAFROST GROUP New York 19 May 2016
 2016 BAKKAFROST GROUP New York 19 May 2016 DISCLAIMER This presentation includes statements regarding future results, which are subject to risks and uncertainties. Consequently, actual results may differ
From Copeinca to Mitsubishi and beyond. Jon Hindar CEO London, 31 October 2014
 From Copeinca to Mitsubishi and beyond Jon Hindar CEO London, 31 October 2014 A roller coaster with a happy ending for Cermaq and for the industry Page 2 A roller coaster with a happy ending for Cermaq
Operating revenue NOK million Operational EBIT NOK million. Harvest volume (HOG) tonnes Q3 09 Q4 09 Q1 10 Q2 10 Q3 10
 tonnes Q3 09 Q4 09 Q1 10 Q2 10 Q3 10") Solid performance in a strong market Strong price achievement and solid results in Norway Return on Capital Employed of 18.9% in the quarter Favourable market balance expected to support a strong market
Solid performance in a strong market Strong price achievement and solid results in Norway Return on Capital Employed of 18.9% in the quarter Favourable market balance expected to support a strong market
PRESENTATION Q CEO Regin Jacobsen / CFO Teitur Samuelsen Oslo November 6 th 2012
 PRESENTATION Q3 2012 CEO Regin Jacobsen / CFO Teitur Samuelsen Oslo November 6 th 2012 DISCLAIMER This presentation includes statements regarding future results, which are subject to risks and uncertainties.
Q Financial presentation. CEO - Arne Møgster CFO - Britt Kathrine Drivenes
 Q2 2018 Financial presentation CEO - Arne Møgster CFO - Britt Kathrine Drivenes Highlights All figures in NOK 1,000 Q2 2018 Q2 2017 H1 2018 H1 2017 2017 Revenue 6 001 380 5 019 195 11 754 529 11 094 149
Austevoll Seafood ASA Q1 2009
 Q1 2009 Ole Rasmus Møgster Chairman Britt Kathrine Drivenes CFO Disclaimer This Presentation has been produced by (the Company or Austevoll ) solely for use at the presentation to the market held in connection
Austevoll Seafood ASA Financial report 4th quarter 2006
 Austevoll Seafood ASA Financial report 4th quarter 2006 Page 1 of 10 The group s pro forma income for 2006 was NOK 3 465,9 million and the pro forma operating profit/loss before depreciation and amortization
Marine Harvest Q Presentation
 Marine Harvest Q2 2014 Presentation Forward looking statements This presentation may be deemed to include forward-looking statements, such as statements that relate to Marine Harvest s contracted volumes,
Highlights Fourth Quarter 2016
 1 2 Highlights Fourth Quarter 2016 GSF s best quarter ever with EBIT of MNOK 456 (EBIT per kg: NOK 21.80). High harvest volume (20 917 tons) in a strong market. The Board proposes a dividend of NOK 3 per
Presentation Q Oslo, 6 November Charles Høstlund, CEO Ola Loe, CFO
 Presentation Q3 2018 Oslo, 6 November 2018 Charles Høstlund, CEO Ola Loe, CFO Agenda 1. Highlights for the period 2. Segment information 3. Group financials 4. Markets 5. Projects for growth 6. Outlook
Disclaimer. We define EBIT as EBITDA less amortizations.
 H1 2012 2 Disclaimer This document is purely informative and does not intend to be comprehensive. Financial information included in this presentation has been calculated in accordance with International
Interim Report. January September 2013
 Interim Report January September 2013 Disclaimer Albain Bidco Norway AS is providing the following financial results for the third quarter of 2013 to holders of its EUR225,000,000 6.750% Senior Secured
EBIT before fair value adjustment of biomass was MNOK 140 in Q4 (MNOK 87 in 2013).
.") 1 2 Highlights Fourth Quarter 2014 EBIT before fair value adjustment of biomass was MNOK 140 in Q4 (MNOK 87 in 2013). This includes a MNOK 60 gain from sale of GSF s shares in SalmoBreed AS in Q4. Production
1 2 Highlights Fourth Quarter 2014 EBIT before fair value adjustment of biomass was MNOK 140 in Q4 (MNOK 87 in 2013). This includes a MNOK 60 gain from sale of GSF s shares in SalmoBreed AS in Q4. Production
Marine Harvest Q Presentation
 Marine Harvest Q1 2014 Presentation Forward looking statements This presentation may be deemed to include forward-looking statements, such as statements that relate to Marine Harvest s contracted volumes,
Interim Report Q4-17
 Interim Report Q4-17 HIGHLIGHTS Operational EBIT of NOK 95 million o o Operational EBIT per kg of NOK 15.84 in Region North Operational EBIT per kg of NOK 14.12 in Region South The highest sold volume
Q Financial presentation. Arne Møgster CEO Britt Kathrine Drivenes CFO
 Q4 2014 Financial presentation Arne Møgster CEO Britt Kathrine Drivenes CFO Highlights All figures in NOK 1,000 Q4 2014 Q4 2013 (restated) 2014 2013 (restated) Revenue 3 704 689 3 725 710 14 344 177 12
Annual Report April March 2017
 Annual Report 2016 1 April 2016-31 March 2017 THE BOARD OF DIRECTORS ANNUAL REPORT FOR FISCAL YEAR 2016 Cermaq Group AS has 18 wholly owned subsidiaries, of which Cermaq Norway AS, Alsvåg AS, Cermaq Canada
Highlights Third Quarter 2017
 2 Highlights Third Quarter 2017 Improved results driven by higher volume Margins maintained by good prices with positive contribution from price contracts EBIT margin negatively affected by planned harvesting
Annual Report April March 2018
 Annual Report 2017 1 April 2017-31 March 2018 Photo: Kenneth Soløy The BOARD OF DIRECTORS ANNUAL REPORT for fiscal year 2017 Cermaq Group AS has 18 wholly owned subsidiaries, of which Cermaq Norway AS,
Dette billede kan ikke vises i øjeblikket. Q FOURTH QUARTER BAKKAFROST GROUP Glyvrar 25 February 2014
 Dette billede kan ikke vises i øjeblikket. Q4 2013 FOURTH QUARTER BAKKAFROST GROUP Glyvrar 25 February 2014 DISCLAIMER This presentation includes statements regarding future results, which are subject
Presentation Q Oslo, 8 May Charles Høstlund, CEO Ola Loe, CFO
 Presentation Q1 2018 Oslo, 8 May 2018 Charles Høstlund, CEO Ola Loe, CFO Agenda 1. Highlights for the period 2. Segment information 3. Group financials 4. Markets 5. Projects for growth 6. Outlook 2 Highlights
Sølvtrans Holding ASA Q Oslo, 15 May Roger Halsebakk, CEO Jon Kvalø, CFO
 Sølvtrans Holding ASA Q1 2012 Oslo, 15 May 2012 Roger Halsebakk, CEO Jon Kvalø, CFO 1 Highlights in the quarter 2 Financial review 3 Operational and market review 4 Summary and outlook 5 Appendix Highlights
LERØY SEAFOOD GROUP. Quarterly report Preliminary financial figures February 26 th Henning Beltestad. Sjur S.
 LERØY SEAFOOD GROUP Quarterly report Preliminary financial figures 2012 February 26 th 2013 Henning Beltestad CEO 1 Sjur S. Malm 1 CFO Agenda 1. 1 Considerations 2. 2 Key financial figures Q4 2012 3. 3
EMPRESAS AQUACHILE S.A. RESULTS FOR 1 TH QUARTER May 2015
 EMPRESAS AQUACHILE S.A. RESULTS FOR 1 TH QUARTER 2015 May 2015 1. About Empresas AquaChile S.A. 03 2. Quarterly Summary 04 3. Analysis of Results 06 4. Balance Sheet Analysis 13 5. Cash Flow Analysis 15
Valuation of SalMar ASA
 Valuation of SalMar ASA Værdiansættelse af SalMar ASA Master Thesis Author: René Nicholas Kabel Laursen CPR number: xxxxxx-xxxx Date of submission: 15 October 2013 Copenhagen Business School 2013 M.Sc.
Q BAKKAFROST GROUP Oslo February 24 th 2015
 Q4 2014 BAKKAFROST GROUP Oslo February 24 th 2015 DISCLAIMER This presentation includes statements regarding future results, which are subject to risks and uncertainties. Consequently, actual results may
THIRD QUARTER MARINE HARVEST GROUP
 / / Q3 2014 THIRD QUARTER MARINE HARVEST GROUP Strong earnings Successful start up of the feed plant Agreement to buy 40 000 tons farming capacity from Acuinova in Chile Quarterly dividend of NOK 1.10
Q BAKKAFROST GROUP Glyvrar 20 May 2014
 Q1 014 BAKKAFROST GROUP Glyvrar 0 May 014 DISCLAIMER This presentation includes statements regarding future results, which are subject to risks and uncertainties. Consequently, actual results may differ