June 2014 Euro area international trade in goods surplus 16.8 bn 2.9 bn surplus for EU28
|
|
|
- Elinor Griffin
- 6 years ago
- Views:
Transcription
 trade in goods balance with the rest of the world in June 2014 gave a 16.8 billion surplus, compared with + 15.7 bn in June 2013.")

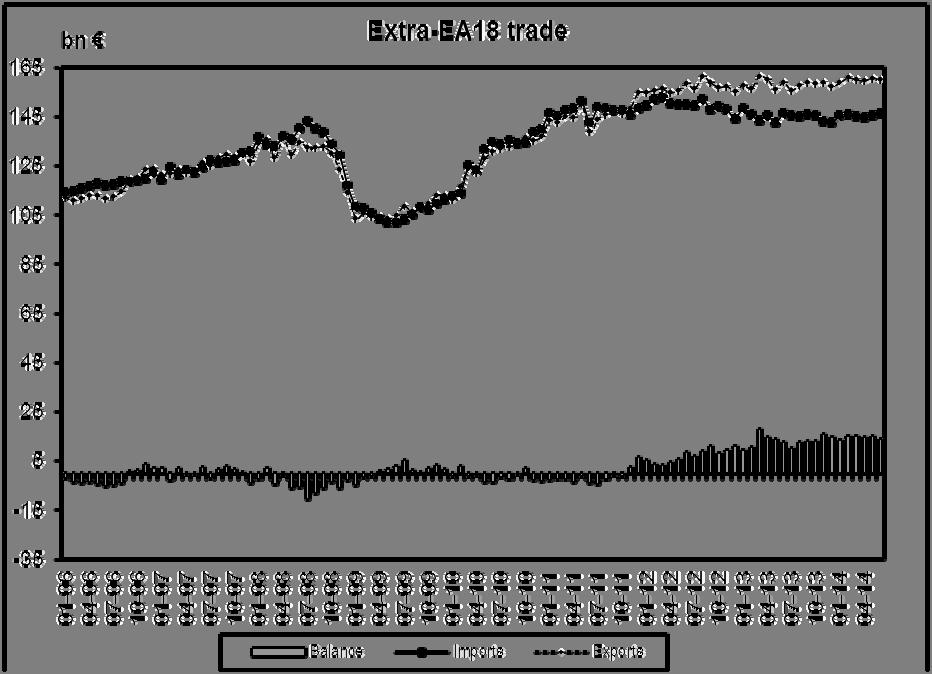
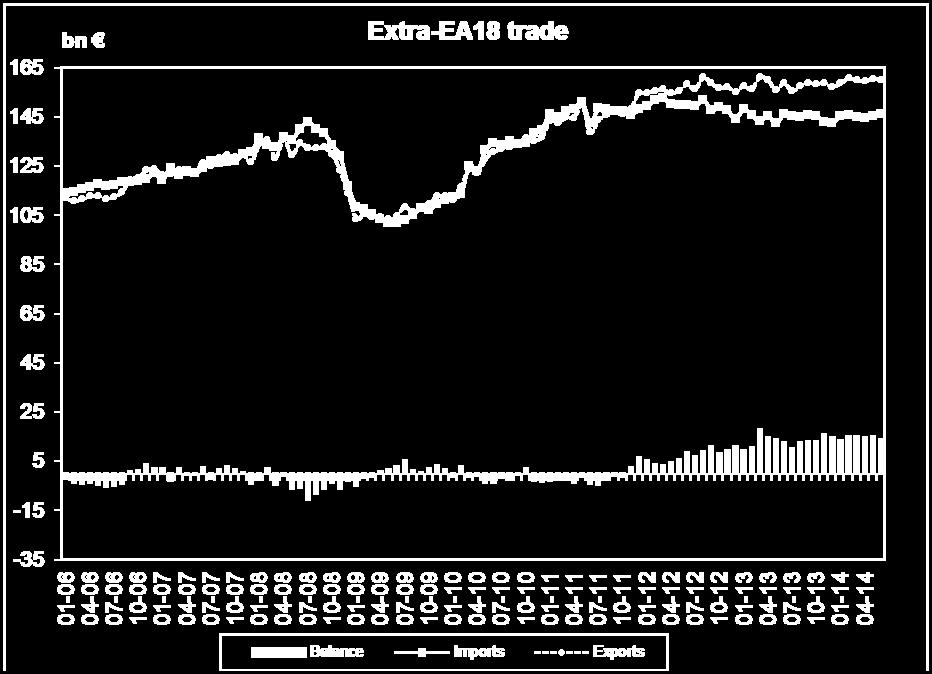
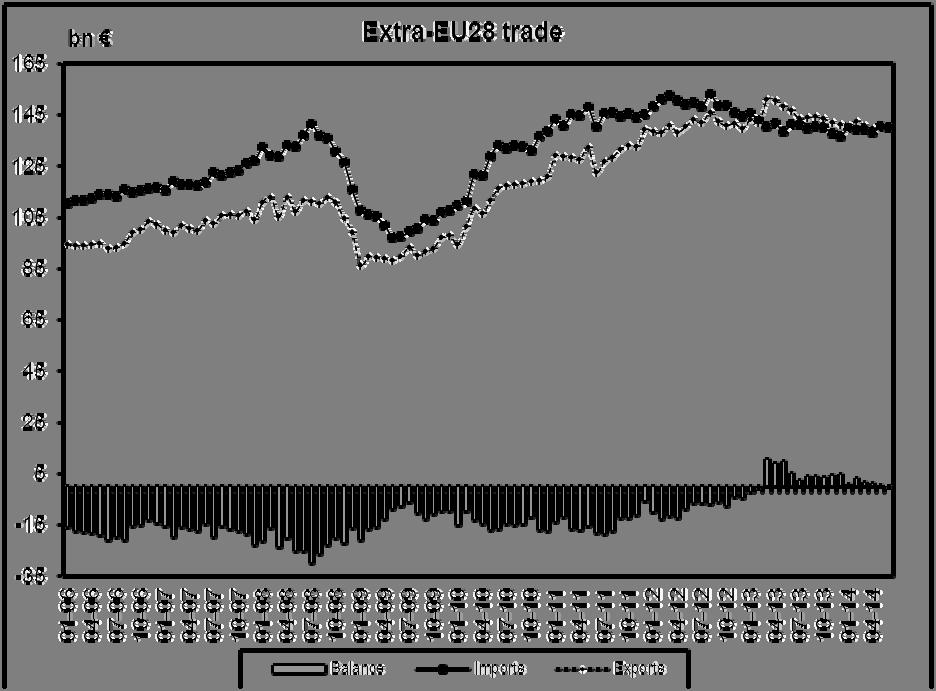
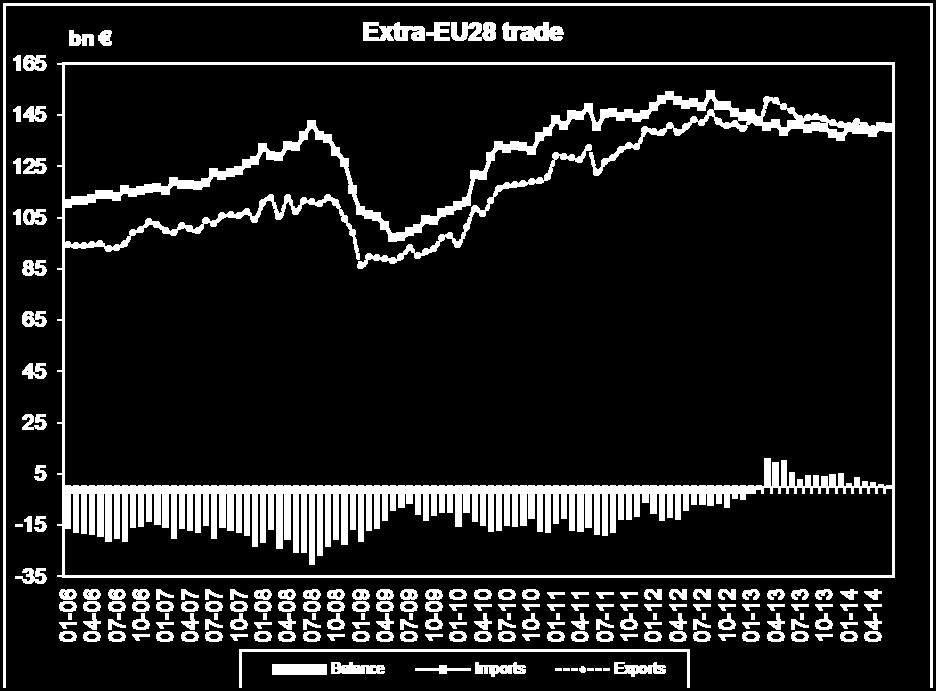
1 127/ August 2014 June 2014 Euro area international trade in goods surplus 16.8 bn 2.9 bn surplus for EU28 The first estimate for the euro area 1 (EA18) trade in goods balance with the rest of the world in June 2014 gave a 16.8 billion surplus, compared with bn in June The May balance was bn, compared with bn in May In June 2014 compared with May 2014, seasonally adjusted exports fell by 0.5% while imports rose by 0.5%. These data 3 are released by Eurostat, the statistical office of the European Union. The first estimate for the June 2014 extra-eu28 1 trade balance was a 2.9 bn surplus, compared with bn in June In May the balance was bn, compared with bn in May In June 2014 compared with May 2014, seasonally adjusted exports fell by 0.3% and imports by 0.1%. EU28 detailed results for January to May 2014 The EU28 deficit for energy decreased ( bn in January-May 2014 compared with bn in January- May 2013), as did the surplus for machinery and vehicles ( bn compared with bn). The highest increases in EU28 exports were registered with China (+10% in January-May 2014 compared with January-May 2013) and South Korea (+8%), and for EU28 imports with South Korea (+10%), Switzerland and Turkey (both +6%). The most notable decreases were recorded for exports to Switzerland (-22%), Russia (-12%) and India (-11%), and for imports from Russia (-8%), Brazil (-7%) and Japan (-6%). The EU28 trade surplus increased with the USA ( bn in January-May 2014 compared with bn in January-May 2013), but decreased with Switzerland ( bn compared with bn) and Turkey (+ 8.3 bn compared with bn). The EU28 trade deficit fell with China ( bn compared with bn) and Russia ( bn compared with bn) and remained stable with Norway ( bn). Concerning the total trade of Member States, the largest surplus was observed in Germany ( bn in January- May 2014), followed by the Netherlands ( bn), Ireland and Italy (both bn). The United Kingdom ( bn) registered the largest deficit, followed by France ( bn), Spain ( bn) and Greece (- 8.8 bn).
2 EA18 trade - non seasonally adjusted data bn Flows Jun 13 Jun 14 Growth May 13 May 14 Growth Jan-Jun 13 Jan-Jun 14 Growth Extra-EA18 exports % r 0% % Extra-EA18 imports % r 0% % Extra-EA18 trade balance Intra-EA18 dispatches % r 0% % EU28 trade - non seasonally adjusted data bn Flows Jun 13 Jun 14 Growth May 13 May 14 Growth Jan-Jun 13 Jan-Jun 14 Growth Extra-EU28 exports % r -9% % Extra-EU28 imports % r 0% % Extra-EU28 trade balance r Intra-EU28 dispatches % r 2% % r: revised 1. The euro area (EA18) includes Belgium, Germany, Estonia, Ireland, Latvia, Greece, Spain, France, Italy, Cyprus, Luxembourg, Malta, the Netherlands, Austria, Portugal, Slovenia, Slovakia and Finland. The European Union (EU28) includes Belgium, Bulgaria, the Czech Republic, Denmark, Germany, Estonia, Ireland, Greece, Spain, France, Croatia, Italy, Cyprus, Latvia, Lithuania, Luxembourg, Hungary, Malta, the Netherlands, Austria, Poland, Portugal, Romania, Slovenia, Slovakia, Finland, Sweden and the United Kingdom. 2. Compared with News Release 111/2014 of 16 July 2014, the trade balance for May 2014 has been confirmed at bn for the EA18 and revised from bn to bn for the EU This News Release is based on data available on 12 August These are provisional figures based on information provided by Member States. They are subject to frequent revision for up to two years after the month in question. Furthermore, national concepts may differ from the harmonised methodology used by Eurostat, leading to differences between figures in this release and those published nationally, both for raw data and for seasonally adjusted series. 4. Since the introduction of Intrastat for intra-eu trade on 1 January 1993, the value of dispatches has been consistently higher than that of arrivals. In theory, as dispatches are declared FOB and arrivals CIF, the value of arrivals should be slightly higher than that of dispatches. Eurostat uses dispatches as the more reliable measure of total intra-eu trade as, at aggregated levels, total dispatches has better coverage than total arrivals. Due to this divergence in intra-eu trade, and to the difficulties of interpreting figures in absolute terms at the level of individual Member States, trade balances for individual Member States must be interpreted with caution. The same caution applies to the trade balance of the euro area, which includes some intra-eu trade. Issued by: Eurostat Press Office Tim ALLEN Tel: eurostat-pressoffice@ec.europa.eu For further information on data: Gilberto GAMBINI Tel: estat-etfree@ec.europa.eu Eurostat news releases on the internet: Selected Principal European Economic Indicators: Follow Eurostat on Twitter:
3 EA18 trade - previous 6 months - non seasonally adjusted data bn Flows Nov 13 Dec 13 Jan 14 Feb 14 Mar 14 Apr 14 Extra-EA18 exports r r Extra-EA18 imports r r r r Extra-EA18 trade balance r 0.8 r r 15.2 r Intra-EA18 dispatches r r EU28 trade - previous 6 months - non seasonally adjusted data bn Flows Nov 13 Dec 13 Jan 14 Feb 14 Mar 14 Apr 14 Extra-EU28 exports Extra-EU28 imports r r Extra-EU28 trade balance r Intra-EU28 dispatches r r r r r r: revised Main products - EA18 - non seasonally adjusted data bn EA18 exports EA18 imports Trade balance Primary goods: % % Food & drink % % Raw materials % % Energy % % Manufactured goods: % % Chemicals % % Machinery & vehicles % % Other manuf d goods % % Other % % Total % % Main products - EU28 - non seasonally adjusted data bn EU28 exports EU28 imports Trade balance Primary goods: % % Food & drink % % Raw materials % % Energy % % Manufactured goods: % % Chemicals % % Machinery & vehicles % % Other manuf d goods % % Other % % Total % %
4 Main trading partners - EA18 - non seasonally adjusted data bn EA18 exports to EA18 imports from Trade balance United Kingdom % % USA % % China % % Russia % % Switzerland % % Poland % % Czech Republic % % Sweden % % Turkey % % Hungary % % Main trading partners - EU28 - non seasonally adjusted data bn EU28 exports to EU28 imports from Trade balance USA % % China % % Russia % % Switzerland % % Norway % % Turkey % % Japan % % South Korea % % India % % Brazil % % Member States total trade (intra-eu + extra-eu) - non seasonally adjusted data bn Total exports Total imports Trade balance Belgium % % Bulgaria % % Czech Republic % % Denmark % % Germany % % Estonia % % Ireland % % Greece % % Spain % % France % % Croatia % % Italy % % Cyprus % % Latvia % % Lithuania % % Luxembourg % % Hungary % % Malta % % Netherlands % % Austria % % Poland % % Portugal % % Romania % % Slovenia % % Slovakia % % Finland % % Sweden % % United Kingdom % %
5 Annex - Seasonally adjusted data Seasonally adjusted series have been calculated using a harmonised methodology. The seasonally adjusted series give a complementary view of the monthly developments in trade. Seasonally adjusted figures may not match those published by Member States due to differences in the raw data 3, in the choice of seasonal adjustment model and to the use of series in national currency or in euro. EA18 trade - seasonally adjusted data bn Flows Jan 14 Feb 14 Mar 14 Apr 14 May 14 Jun 14 Growth: Feb/Jan Mar/Feb Apr/Mar May/Apr Jun/May Extra-EA18 exports % -0.4% -0.3% 0.7% -0.5% Extra-EA18 imports % -0.5% -0.3% 0.5% 0.5% Extra-EA18 trade balance Intra-EA18 dispatches % -2.1% 3.0% -0.6% -1.4% EU28 trade - seasonally adjusted data bn Flows Jan 14 Feb 14 Mar 14 Apr 14 May 14 Jun 14 Growth: Feb/Jan Mar/Feb Apr/Mar May/Apr Jun/May Extra-EU28 exports % -1.0% -0.9% 0.7% -0.3% Extra-EU28 imports % 0.0% -0.7% 1.5% -0.1% Extra-EU28 trade balance Intra-EU28 dispatches % -1.3% 2.1% -0.5% -1.3% Contribution of EU28 Member States to extra-eu28 trade - seasonally adjusted data bn Total exports Total imports Trade balance May 14 Jun 14 Growth May 14 Jun 14 Growth May 14 Jun 14 EU % % Belgium % % Bulgaria % % Czech Republic % % Denmark % % Germany % % Estonia % % Ireland % % Greece % % Spain % % France % % Croatia % % Italy % % Cyprus % % Latvia % % Lithuania % % Luxembourg % % Hungary % % Malta % % Netherlands % % Austria % % Poland % % Portugal % % Romania % % Slovenia % % Slovakia % % Finland % % Sweden % % United Kingdom % %
6 Seasonally adjusted data
June 2012 Euro area international trade in goods surplus of 14.9 bn euro 0.4 bn euro surplus for EU27
 121/2012-17 August 2012 June 2012 Euro area international trade in goods surplus of 14.9 0.4 surplus for EU27 The first estimate for the euro area 1 (EA17) trade in goods balance with the rest of the world
May 2012 Euro area international trade in goods surplus of 6.9 bn euro 3.8 bn euro deficit for EU27
 108/2012-16 July 2012 May 2012 Euro area international trade in goods surplus of 6.9 3.8 deficit for EU27 The first estimate for the euro area 1 (EA17) trade in goods balance with the rest of the world
August 2012 Euro area international trade in goods surplus of 6.6 bn euro 12.6 bn euro deficit for EU27
 146/2012-16 October 2012 August 2012 Euro area international trade in goods surplus of 6.6 12.6 deficit for EU27 The first estimate for the euro area 1 (EA17) trade in goods balance with the rest of the
May 2009 Euro area external trade surplus 1.9 bn euro 6.8 bn euro deficit for EU27
 STAT/09/106 17 July 2009 May 2009 Euro area external trade surplus 1.9 6.8 deficit for EU27 The first estimate for the euro area 1 (EA16) trade balance with the rest of the world in May 2009 gave a 1.9
First estimate for 2011 Euro area external trade deficit 7.7 bn euro bn euro deficit for EU27
 27/2012-15 February 2012 First estimate for 2011 Euro area external trade deficit 7.7 152.8 deficit for EU27 The first estimate for the euro area 1 (EA17) trade in goods balance with the rest of the world
January 2014 Euro area international trade in goods surplus 0.9 bn euro 13.0 bn euro deficit for EU28
 STAT/14/41 18 March 2014 January 2014 Euro area international trade in goods surplus 0.9 13.0 deficit for EU28 The first estimate for the euro area 1 (EA18) trade in goods balance with the rest of the
August 2008 Euro area external trade deficit 9.3 bn euro 27.2 bn euro deficit for EU27
 STAT/08/143 17 October 2008 August 2008 Euro area external trade deficit 9.3 27.2 deficit for EU27 The first estimate for the euro area 1 (EA15) trade balance with the rest of the world in August 2008
August 2005 Euro-zone external trade deficit 2.6 bn euro 14.2 bn euro deficit for EU25
 STAT/05/132 20 October 2005 August 2005 Euro-zone external trade deficit 2.6 14.2 deficit for EU25 The first estimate for euro-zone 1 trade with the rest of the world in August 2005 was a 2.6 billion euro
March 2005 Euro-zone external trade surplus 4.2 bn euro 6.5 bn euro deficit for EU25
 STAT/05/67 24 May 2005 March 2005 Euro-zone external trade surplus 4.2 6.5 deficit for EU25 The first estimate for euro-zone 1 trade with the rest of the world in March 2005 was a 4.2 billion euro surplus,
January 2009 Euro area external trade deficit 10.5 bn euro 26.3 bn euro deficit for EU27
 STAT/09/40 23 March 2009 January 2009 Euro area external trade deficit 10.5 26.3 deficit for EU27 The first estimate for the euro area 1 (EA16) trade balance with the rest of the world in January 2009
January 2005 Euro-zone external trade deficit 2.2 bn euro 14.0 bn euro deficit for EU25
 42/2005-23 March 2005 January 2005 Euro-zone external trade deficit 2.2 14.0 deficit for EU25 The first estimate for euro-zone 1 trade with the rest of the world in January 2005 was a 2.2 billion euro
Second estimate for the third quarter of 2008 EU27 current account deficit 39.5 bn euro 19.3 bn euro surplus on trade in services
 STAT/09/12 22 January 2009 Second estimate for the third quarter of 20 EU27 current account deficit 39.5 bn euro 19.3 bn euro surplus on trade in According to the latest revisions1, the EU272 external
Courthouse News Service
 14/2009-30 January 2009 Sector Accounts: Third quarter of 2008 Household saving rate at 14.4% in the euro area and 10.7% in the EU27 Business investment rate at 23.5% in the euro area and 23.6% in the
STAT/12/ October Household saving rate fell in the euro area and remained stable in the EU27. Household saving rate (seasonally adjusted)
") STAT/12/152 30 October 2012 Quarterly Sector Accounts: second quarter of 2012 Household saving rate down to 12.9% in the euro area and stable at 11. in the EU27 Household real income per capita fell by
STAT/12/152 30 October 2012 Quarterly Sector Accounts: second quarter of 2012 Household saving rate down to 12.9% in the euro area and stable at 11. in the EU27 Household real income per capita fell by
Second estimate for the fourth quarter of 2011 EU27 current account surplus 13.1 bn euro 32.3 bn euro surplus on trade in services
 59/2012-18 April 2012 Second estimate for the fourth quarter of EU27 current account surplus 13.1 bn euro 32.3 bn euro surplus on trade in According to the latest available data, the EU27 1 external current
October 2010 Euro area unemployment rate at 10.1% EU27 at 9.6%
 STAT//180 30 November 20 October 20 Euro area unemployment rate at.1% EU27 at 9.6% The euro area 1 (EA16) seasonally-adjusted 2 unemployment rate 3 was.1% in October 20, compared with.0% in September 4.
Second estimate for the first quarter of 2010 EU27 current account deficit 34.8 bn euro 10.8 bn euro surplus on trade in services
 109/2010-22 July 2010 Second estimate for the first quarter of 2010 EU27 current account deficit 34.8 bn euro 10.8 bn euro surplus on trade in According to the latest revisions 1, the EU27 2 external current
January 2010 Euro area unemployment rate at 9.9% EU27 at 9.5%
 STAT//29 1 March 20 January 20 Euro area unemployment rate at 9.9% EU27 at 9.5% The euro area 1 (EA16) seasonally-adjusted 2 unemployment rate 3 was 9.9% in January 20, the same as in December 2009 4.
Lowest implicit tax rates on labour in Malta, on consumption in Spain and on capital in Lithuania
 STAT/13/68 29 April 2013 Taxation trends in the European Union The overall tax-to-gdp ratio in the EU27 up to 38.8% of GDP in 2011 Labour taxes remain major source of tax revenue The overall tax-to-gdp
EU-28 RECOVERED PAPER STATISTICS. Mr. Giampiero MAGNAGHI On behalf of EuRIC
 EU-28 RECOVERED PAPER STATISTICS Mr. Giampiero MAGNAGHI On behalf of EuRIC CONTENTS EU-28 Paper and Board: Consumption and Production EU-28 Recovered Paper: Effective Consumption and Collection EU-28 -
EU BUDGET AND NATIONAL BUDGETS
 DIRECTORATE GENERAL FOR INTERNAL POLICIES POLICY DEPARTMENT ON BUDGETARY AFFAIRS EU BUDGET AND NATIONAL BUDGETS 1999-2009 October 2010 INDEX Foreward 3 Table 1. EU and National budgets 1999-2009; EU-27
Taxation trends in the European Union Further increase in VAT rates in 2012 Corporate and top personal income tax rates inch up after long decline
 STAT/12/77 21 May 2012 Taxation trends in the European Union Further increase in VAT rates in 2012 Corporate and top personal income tax rates inch up after long decline The average standard VAT rate 1
ECFIN-C3 (2009) PART 1 MAIN DEVELOPMENTS
 PART 1 MAIN DEVELOPMENTS") ECFIN-C3 (2009) PART 1 MAIN DEVELOPMENTS Methodological note Since the issue for the second quarter of 2004, nominal and real effective exchange rates presented in this report are calculated based on a
ECFIN-C3 (2009) PART 1 MAIN DEVELOPMENTS Methodological note Since the issue for the second quarter of 2004, nominal and real effective exchange rates presented in this report are calculated based on a
Approach to Employment Injury (EI) compensation benefits in the EU and OECD
 compensation benefits in the EU and OECD") Approach to (EI) compensation benefits in the EU and OECD The benefits of protection can be divided in three main groups. The cash benefits include disability pensions, survivor's pensions and other short-
Approach to (EI) compensation benefits in the EU and OECD The benefits of protection can be divided in three main groups. The cash benefits include disability pensions, survivor's pensions and other short-
EUROPA - Press Releases - Taxation trends in the European Union EU27 tax...of GDP in 2008 Steady decline in top corporate income tax rate since 2000
 DG TAXUD STAT/10/95 28 June 2010 Taxation trends in the European Union EU27 tax ratio fell to 39.3% of GDP in 2008 Steady decline in top corporate income tax rate since 2000 The overall tax-to-gdp ratio1
DG TAXUD. STAT/11/100 1 July 2011
 DG TAXUD STAT/11/100 1 July 2011 Taxation trends in the European Union Recession drove EU27 overall tax revenue down to 38.4% of GDP in 2009 Half of the Member States hiked the standard rate of VAT since
European Advertising Business Climate Index Q4 2016/Q #AdIndex2017
 European Advertising Business Climate Index Q4 216/Q1 217 ABOUT Quarterly survey of European advertising and market research companies Provides information about: managers assessment of their business
The Architectural Profession in Europe 2012
 The Architectural Profession in Europe 2012 - A Sector Study Commissioned by the Architects Council of Europe Chapter 2: Architecture the Market December 2012 2 Architecture - the Market The Construction
NOTE. for the Interparliamentary Meeting of the Committee on Budgets
 NOTE for the Interparliamentary Meeting of the Committee on Budgets THE ROLE OF THE EU BUDGET TO SUPPORT MEMBER STATES IN ACHIEVING THEIR ECONOMIC OBJECTIVES AS AGREED WITHIN THE FRAMEWORK OF THE EUROPEAN
BULGARIAN TRADE WITH EU IN THE PERIOD JANUARY - APRIL 2017 (PRELIMINARY DATA)
") BULGARIAN TRADE WITH EU IN THE PERIOD JANUARY - APRIL 2017 (PRELIMINARY DATA) In the period January - April 2017 Bulgarian exports to the EU increased by 8.6% 2016 and amounted to 10 418.6 Million BGN
BULGARIAN TRADE WITH EU IN THE PERIOD JANUARY - APRIL 2017 (PRELIMINARY DATA) In the period January - April 2017 Bulgarian exports to the EU increased by 8.6% 2016 and amounted to 10 418.6 Million BGN
BULGARIAN TRADE WITH EU IN THE PERIOD JANUARY - MAY 2017 (PRELIMINARY DATA)
") BULGARIAN TRADE WITH EU IN THE PERIOD JANUARY - MAY 2017 (PRELIMINARY DATA) In the period January - May 2017 Bulgarian exports to the EU increased by 10.8% 2016 and added up to 13 283.0 Million BGN (Annex,
BULGARIAN TRADE WITH EU IN THE PERIOD JANUARY - MAY 2017 (PRELIMINARY DATA) In the period January - May 2017 Bulgarian exports to the EU increased by 10.8% 2016 and added up to 13 283.0 Million BGN (Annex,
BULGARIAN TRADE WITH EU PRELIMINARY DATA
 BULGARIAN TRADE WITH EU PRELIMINARY DATA During the period January - June 2010 the Bulgarian exports to EU increased by 17.4% compared to the corresponding period of the previous year and amounted to 8
EMPLOYMENT RATE Employed/Working age population (15-64 years)
") 1 EMPLOYMENT RATE 1980-2003 Employed/Working age population (15-64 years 80 % Finland (Com 75 70 65 60 EU-15 Finland (Stat. Fin. 55 50 80 82 84 86 88 90 92 94 96 98 00 02 9.9.2002/SAK /TL Source: European
1 EMPLOYMENT RATE 1980-2003 Employed/Working age population (15-64 years 80 % Finland (Com 75 70 65 60 EU-15 Finland (Stat. Fin. 55 50 80 82 84 86 88 90 92 94 96 98 00 02 9.9.2002/SAK /TL Source: European
EMPLOYMENT RATE IN EU-COUNTRIES 2000 Employed/Working age population (15-64 years)
") EMPLOYMENT RATE IN EU-COUNTRIES 2 Employed/Working age population (15-64 years EU-15 Denmark Netherlands Great Britain Sweden Portugal Finland Austria Germany Ireland Luxembourg France Belgium Greece Spain
EMPLOYMENT RATE IN EU-COUNTRIES 2 Employed/Working age population (15-64 years EU-15 Denmark Netherlands Great Britain Sweden Portugal Finland Austria Germany Ireland Luxembourg France Belgium Greece Spain
Macroeconomic overview SEE and Macedonia
 Macroeconomic overview SEE and Macedonia Zoltan Arokszallasi Chief Analyst, Macro & FX/FI Research Erste Group Bank Erste Investors Breakfast, 29 September, Skopje 02. Oktober SEE shows mixed performance
Fiscal rules in Lithuania
 Fiscal rules in Lithuania Algimantas Rimkūnas Vice Minister, Ministry of Finance of Lithuania 3 June, 2016 Evolution of National and EU Fiscal Regulations Stability and Growth Pact (SGP) Maastricht Treaty
Taxation trends in the European Union EU27 tax ratio at 39.8% of GDP in 2007 Steady decline in top personal and corporate income tax rates since 2000
 DG TAXUD STAT/09/92 22 June 2009 Taxation trends in the European Union EU27 tax ratio at 39.8% of GDP in 2007 Steady decline in top personal and corporate income tax rates since 2000 The overall tax-to-gdp
REPORT FROM THE COMMISSION TO THE EUROPEAN PARLIAMENT, THE COUNCIL, THE EUROPEAN ECONOMIC AND SOCIAL COMMITTEE AND THE COMMITTEE OF THE REGIONS
 EUROPEAN COMMISSION Brussels,.4.29 COM(28) 86 final/ 2 ANNEXES to 3 ANNEX to the REPORT FROM THE COMMISSION TO THE EUROPEAN PARLIAMENT, THE COUNCIL, THE EUROPEAN ECONOMIC AND SOCIAL COMMITTEE AND THE COMMITTEE
Live Long and Prosper? Demographic Change and Europe s Pensions Crisis. Dr. Jochen Pimpertz Brussels, 10 November 2015
 Live Long and Prosper? Demographic Change and Europe s Pensions Crisis Dr. Jochen Pimpertz Brussels, 10 November 2015 Old-age-dependency ratio, EU28 45,9 49,4 50,2 39,0 27,5 31,8 2013 2020 2030 2040 2050
Reporting practices for domestic and total debt securities
 Last updated: 27 November 2017 Reporting practices for domestic and total debt securities While the BIS debt securities statistics are in principle harmonised with the recommendations in the Handbook on
Electricity & Gas Prices in Ireland. Annex Business Electricity Prices per kwh 2 nd Semester (July December) 2016
 2016") Electricity & Gas Prices in Ireland Annex Business Electricity Prices per kwh 2 nd Semester (July December) 2016 ENERGY POLICY STATISTICAL SUPPORT UNIT 1 Electricity & Gas Prices in Ireland Annex Business
Electricity & Gas Prices in Ireland Annex Business Electricity Prices per kwh 2 nd Semester (July December) 2016 ENERGY POLICY STATISTICAL SUPPORT UNIT 1 Electricity & Gas Prices in Ireland Annex Business
TAXATION OF TRUSTS IN ISRAEL. An Opportunity For Foreign Residents. Dr. Avi Nov
 TAXATION OF TRUSTS IN ISRAEL An Opportunity For Foreign Residents Dr. Avi Nov Short Bio Dr. Avi Nov is an Israeli lawyer who represents taxpayers, individuals and entities. Areas of Practice: Tax Law,
STAT/07/55 23 April 2007
 STAT/07/55 23 April 2007 Provision of deficit and debt data for 2006 Euro area and EU27 government deficit at 1.6% and 1.7% of GDP respectively Government debt at 69.0% and 61.7% In 2006, the government
Burden of Taxation: International Comparisons
 Burden of Taxation: International Comparisons Standard Note: SN/EP/3235 Last updated: 15 October 2008 Author: Bryn Morgan Economic Policy & Statistics Section This note presents data comparing the national
TRADE IN GOODS OF BULGARIA WITH EU IN THE PERIOD JANUARY - JUNE 2018 (PRELIMINARY DATA)
") TRADE IN GOODS OF BULGARIA WITH EU IN THE PERIOD JANUARY - JUNE 2018 (PRELIMINARY DATA) In the period January - June 2018 the exports of goods from Bulgaria to the EU increased by 10.7% 2017 and amounted
TRADE IN GOODS OF BULGARIA WITH EU IN THE PERIOD JANUARY - JUNE 2018 (PRELIMINARY DATA) In the period January - June 2018 the exports of goods from Bulgaria to the EU increased by 10.7% 2017 and amounted
May 2009 Euro area annual inflation down to 0.0% EU down to 0.7%
 STAT/09/88 16 June 2009 May 2009 Euro area annual inflation down to 0.0% EU down to 0.7% Euro area 1 annual inflation was 0.0% in May 2009 2, down from 0.6% in April. A year earlier the rate was 3.7%.
Spain France. England Netherlands. Wales Ukraine. Republic of Ireland Czech Republic. Romania Albania. Serbia Israel. FYR Macedonia Latvia
 Germany Belgium Portugal Spain France Switzerland Italy England Netherlands Iceland Poland Croatia Slovakia Russia Austria Wales Ukraine Sweden Bosnia-Herzegovina Republic of Ireland Czech Republic Turkey
December 2010 Euro area annual inflation up to 2.2% EU up to 2.6%
 STAT/11/9 14 January 2011 December 2010 Euro area annual inflation up to 2.2% EU up to 2.6% Euro area 1 annual inflation was 2.2% in December 2010 2, up from 1.9% in November. A year earlier the rate was
CANADA EUROPEAN UNION
 THE EUROPEAN UNION S PROFILE Economic Indicators Gross domestic product (GDP) at purchasing power parity (PPP): US$20.3 trillion (2016) GDP per capita at PPP: US$39,600 (2016) Population: 511.5 million
2017 Figures summary 1
 Annual Press Conference on January 18 th 2018 EIB Group Results 2017 2017 Figures summary 1 European Investment Bank (EIB) financing EUR 69.88 billion signed European Investment Fund (EIF) financing EUR
Some Historical Examples of Yield Curves
 3 months 6 months 1 year 2 years 5 years 10 years 30 years Some Historical Examples of Yield Curves Nominal interest rate, % 16 14 12 10 8 6 4 2 January 1981 June1999 December2009 0 Time to maturity This
STAT/09/56 22 April 2009
 STAT/09/56 22 April 2009 Provision of deficit and debt data for 2008 - first notification Euro area and EU27 government deficit at 1.9% and 2.3% of GDP respectively Government debt at 69.3% and 61.5% In
Corrigendum. OECD Pensions Outlook 2012 DOI: ISBN (print) ISBN (PDF) OECD 2012
 ISBN (PDF) OECD 2012") OECD Pensions Outlook 2012 DOI: http://dx.doi.org/9789264169401-en ISBN 978-92-64-16939-5 (print) ISBN 978-92-64-16940-1 (PDF) OECD 2012 Corrigendum Page 21: Figure 1.1. Average annual real net investment
OECD Pensions Outlook 2012 DOI: http://dx.doi.org/9789264169401-en ISBN 978-92-64-16939-5 (print) ISBN 978-92-64-16940-1 (PDF) OECD 2012 Corrigendum Page 21: Figure 1.1. Average annual real net investment
Report Penalties and measures imposed under the UCITS Directive in 2016 and 2017
 Report Penalties and measures imposed under the Directive in 206 and 207 4 April 209 ESMA34-45-65 4 April 209 ESMA34-45-65 Table of Contents Executive Summary... 3 2 Background and relevant regulatory
STAT/14/ October 2014
 STAT/14/158-21 October 2014 Provision of deficit and debt data for 2013 - second notification Euro area and EU28 government deficit at 2.9% and 3.2% of GDP respectively Government debt at 90.9% and 85.4%
Preliminary results of International Trade in 2014: in nominal terms exports increased by 1.8% and imports increased by 3.
 International Trade Statistics 7 July, 215 Preliminary results of International Trade in : in nominal terms exports increased by 1.8% and imports increased by 3.2% vis-à-vis 213 In, exports of goods increased
Financial wealth of private households worldwide
 Economic Research Financial wealth of private households worldwide Munich, October 217 Recovery in turbulent times Assets and liabilities of private households worldwide in EUR trillion and annualrate
STAT/14/64 23 April 2014
 STAT/14/64 23 April 2014 Provision of deficit and debt data for 2013 - first notification Euro area and EU28 government deficit at 3.0% and 3.3% of GDP respectively Government debt at 92.6% and 87.1% In
Communication on the future of the CAP
 Communication on the future of the CAP The CAP towards 2020: meeting the food, natural resources and territorial challenges of the future Tassos Haniotis, Director Agricultural Policy Analysis and Perspectives
Lithuania: in a wind of change. Robertas Dargis President of the Lithuanian Confederation of Industrialists
 Lithuania: in a wind of change Robertas Dargis President of the Lithuanian Confederation of Industrialists 2017 06 15 Lithuanian Confederation of Industrialists - the largest business organisation in Lithuania
International Statistical Release
 International Statistical Release This release and additional tables of international statistics are available on efama s website (www.efama.org). Worldwide Investment Fund Assets and Flows Trends in the
11 th Economic Trends Survey of the Impact of Economic Downturn
 11 th Economic Trends Survey 11 th Economic Trends Survey of the Impact of Economic Downturn 11 th Economic Trends Survey COUNTRY ANSWERS Austria 155 Belgium 133 Bulgaria 192 Croatia 185 Cyprus 1 Czech
International Statistical Release
 International Statistical Release This release and additional tables of international statistics are available on efama s website (www.efama.org). wide Regulated Open-ended Fund Assets and Flows Trends
Borderline cases for salary, social contribution and tax
 Version Abstract 1 (5) 2015-04-21 Veronica Andersson Salary and labour cost statistics Borderline cases for salary, social contribution and tax (Workshop on Labour Cost Survey, Rome, Italy 5-6 May 2015)
Chart pack to council for cooperation on macroprudential policy
 Chart pack to council for cooperation on macroprudential policy Contents List of charts... 3 Macro and macro-financial setting... 5 Swedish macroeconomic setting... 5 Foreign macroeconomic setting... Macro-financial
International Statistical Release
 International Statistical Release This release and additional tables of international statistics are available on efama s website (www.efama.org). Worldwide Regulated Open-ended Fund Assets and Flows Trends
Consumer credit market in Europe 2013 overview
 Consumer credit market in Europe 2013 overview Crédit Agricole Consumer Finance published its annual survey of the consumer credit market in 28 European Union countries for seven years running. 9 July
Summary of key findings
 1 VAT/GST treatment of cross-border services: 2017 survey Supplies of e-services to consumers (B2C) (see footnote 1) Supplies of e-services to businesses (B2B) 1(a). Is a non-resident 1(b). If there is
STAT/11/60 26 April 2011
 STAT/11/60 26 April 2011 Provision of deficit and debt data for 2010 - first notification Euro area and EU27 government deficit at 6.0% and 6.4% of GDP respectively Government debt at 85.1% and 80.0% In
Introduction 283,602,000,000 ( 284 billion ) 71 billion 10.71%
 71 billion 10.71%") Introduction Over the last 4 years (between 2012 to 2015 inclusive) the UK has imported 283,602,000,000 ( 284 billion ) more from the rest of the EU than the UK and NI have exported to the EU resulting
Introduction Over the last 4 years (between 2012 to 2015 inclusive) the UK has imported 283,602,000,000 ( 284 billion ) more from the rest of the EU than the UK and NI have exported to the EU resulting
Open Day 2017 Clearstream execution-to-custody integration Valentin Nehls / Jan Willems. 5 October 2017
 Open Day 2017 Clearstream execution-to-custody integration Valentin Nehls / Jan Willems 5 October 2017 Deutsche Börse Group 1 Settlement services: single point of access to cost-effective, low risk and
How to complete a payment application form (NI)
") How to complete a payment application form (NI) This form should be used for making a payment from a Northern Ireland Ulster Bank account. 1. Applicant Details If you are a signal number indemnity holder,
How to complete a payment application form (NI) This form should be used for making a payment from a Northern Ireland Ulster Bank account. 1. Applicant Details If you are a signal number indemnity holder,
Turkey s Saving Deficit Issue From an Institutional Perspective
 Turkey s Saving Deficit Issue From an Institutional Perspective Engin KURUN, Ph.D CEO, Ziraat Asset Management Oct. 25th, 2011 - Istanbul 1 PRESENTATION Household and Institutional Savings Institutional
Library statistical spotlight
 /9/2 Library of the European Parliament 6 4 2 This document aims to provide a picture of the, in particular by looking at car production trends since 2, at the number of enterprises and the turnover they
EMPLOYMENT RATE Employed/Working age population (15 64 years)
") EMPLOYMENT RATE 198 26 Employed/Working age population (15 64 years 8 % Finland 75 EU 15 EU 25 7 65 6 55 5 8 82 84 86 88 9 92 94 96 98 2 4** 6** 14.4.25/SAK /TL Source: European Commission 1 UNEMPLOYMENT
EMPLOYMENT RATE 198 26 Employed/Working age population (15 64 years 8 % Finland 75 EU 15 EU 25 7 65 6 55 5 8 82 84 86 88 9 92 94 96 98 2 4** 6** 14.4.25/SAK /TL Source: European Commission 1 UNEMPLOYMENT
The Cyprus Economy: from Recovery to Sustainable Growth. Vincenzo Guzzo Resident Representative in Cyprus
 The Economy: from Recovery to Sustainable Growth Vincenzo Guzzo Resident Representative in Growth momentum remains strong 18 : Real GDP ( billion) 1 Deviation from Pre-Crisis Level and Trend (Percent)
Updates and revisions of national SUTs for the November 2013 release of the WIOD
 Updates and revisions of national SUTs for the November 2013 release of the WIOD Edited by Marcel Timmer (University of Groningen) With contributions from: Abdul A. Erumban, Reitze Gouma and Gaaitzen J.
International Statistical Release
 International Statistical Release This release and additional tables of international statistics are available on efama s website (www.efama.org) Worldwide Investment Fund Assets and Flows Trends in the
Quarterly Gross Domestic Product of Montenegro 2st quarter 2016
 Government of Montenegro Statistical Office of Montenegro Quarterly Gross Domestic Product of Montenegro 2st quarter 2016 The release presents the preliminary data for quarterly gross domestic product
Quarterly Gross Domestic Product of Montenegro 3 rd quarter 2017
 MONTENEGRO STATISTICAL OFFICE R E L E A S E No: 224 Podgorica, 22 December 2017 When using the data, please name the source Quarterly Gross Domestic Product of Montenegro 3 rd quarter 2017 The release
Trends in the European Investment Fund Industry. in the Third Quarter of 2018
 Quarterly Statistical Release December 2018 N 75 This release and other statistical releases are available on Efama s website (www.efama.org) Trends in the European Investment Fund Industry in the Third
THE IMPACT OF THE PUBLIC DEBT STRUCTURE IN THE EUROPEAN UNION MEMBER COUNTRIES ON THE POSSIBILITY OF DEBT OVERHANG
 THE IMPACT OF THE PUBLIC DEBT STRUCTURE IN THE EUROPEAN UNION MEMBER COUNTRIES ON THE POSSIBILITY OF DEBT OVERHANG Robert Huterski, PhD Nicolaus Copernicus University in Toruń Faculty of Economic Sciences
Turkish Economic Review Volume 3 March 2016 Issue 1
 www.kspjournals.org Volume 3 March 2016 Issue 1 Tax Losses due to Shadow Economy Activities in OECD Countries from 2011 to 2013: A preliminary calculation By Friedrich SCHNEIDER a Abstract. In this short
Enterprise Europe Network SME growth outlook
 Enterprise Europe Network SME growth outlook 2018-19 een.ec.europa.eu 2 Enterprise Europe Network SME growth outlook 2018-19 Foreword The European Commission wants to ensure that small and medium-sized
G-20 Trade Aggregates Based on IMF s Balance of Payments Database
 Twenty-Eighth Meeting of the IMF Committee on Balance of Payments Statistics Rio de Janeiro, Brazil October 27 29, 2015 BOPCOM 15/22 G-20 Trade Aggregates Based on IMF s Balance of Payments Database Prepared
EU-28 STEEL SCRAP STATISTICS. by Rolf Willeke Statistics Advisor of the BIR Ferrous Division For EFR a branch of EuRIC (30 October 2017)
") EU-28 STEEL SCRAP STATISTICS (JANUARY JUNE 2017) by Rolf Willeke Statistics Advisor of the BIR Ferrous Division For EFR a branch of EuRIC (30 October 2017) C O N T E N T S EU-28 and World Crude Steel Production
EU-28 STEEL SCRAP STATISTICS (JANUARY JUNE 2017) by Rolf Willeke Statistics Advisor of the BIR Ferrous Division For EFR a branch of EuRIC (30 October 2017) C O N T E N T S EU-28 and World Crude Steel Production
3 Labour Costs. Cost of Employing Labour Across Advanced EU Economies (EU15) Indicator 3.1a
 Indicator 3.1a") 3 Labour Costs Indicator 3.1a Indicator 3.1b Indicator 3.1c Indicator 3.2a Indicator 3.2b Indicator 3.3 Indicator 3.4 Cost of Employing Labour Across Advanced EU Economies (EU15) Cost of Employing Labour
3 Labour Costs Indicator 3.1a Indicator 3.1b Indicator 3.1c Indicator 3.2a Indicator 3.2b Indicator 3.3 Indicator 3.4 Cost of Employing Labour Across Advanced EU Economies (EU15) Cost of Employing Labour
Macroeconomic scenarios for skill demand and supply projections, including dealing with the recession
 Alphametrics (AM) Alphametrics Ltd Macroeconomic scenarios for skill demand and supply projections, including dealing with the recession Paper presented at Skillsnet technical workshop on: Forecasting
International Statistical Release
 International Statistical Release This release and additional tables of international statistics are available on efama s website (www.efama.org) Worldwide Investment Fund Assets and Flows Trends in the
Consumer Credit. Introduction. June, the 6th (2013)
") Consumer Credit in Europe at end-2012 Introduction Crédit Agricole Consumer Finance has published its annual survey of the consumer credit market in 27 European Union countries (EU-27) for the sixth year
Consumer Credit in Europe at end-2012 Introduction Crédit Agricole Consumer Finance has published its annual survey of the consumer credit market in 27 European Union countries (EU-27) for the sixth year
International Statistical Release
 International Statistical Release This release and additional tables of international statistics are available on efama s website (www.efama.org). Worldwide Investment Fund Assets and Flows Trends in the
Trends in the European Investment Fund Industry. in the First Quarter of 2017
 Quarterly Statistical Release June 2017, N 69 This release and other statistical releases are available on Efama s website (www.efama.org) Trends in the European Investment Fund Industry in the First Quarter
Quarterly Financial Accounts Household net worth reaches new peak in Q Irish Household Net Worth
 Quarterly Financial Accounts Q4 2017 4 May 2018 Quarterly Financial Accounts Household net worth reaches new peak in Q4 2017 Household net worth rose by 2.1 per cent in Q4 2017. It now exceeds its pre-crisis
EU KLEMS Growth and Productivity Accounts March 2011 Update of the November 2009 release
 EU KLEMS Growth and Productivity Accounts March 2011 Update of the November 2009 release Description of methodology and country notes Prepared by Reitze Gouma, Klaas de Vries and Astrid van der Veen-Mooij
Trends in the European Investment Fund Industry. in the First Quarter of 2018
 Quarterly Statistical Release June 2018, N 73 This release and other statistical releases are available on Efama s website (www.efama.org) Trends in the European Investment Fund Industry in the First Quarter
Growth in OECD Unit Labour Costs slows to 0.4% in the third quarter of 2016
 Growth in OECD Unit Labour Costs slows to.4% in the third quarter of 26 Growth in unit labour costs (ULCs) in the OECD area slowed to.4% in the third quarter of 26 (compared with.6% in the previous quarter)
Composition of capital IT044 IT044 POWSZECHNAIT044 UNIONE DI BANCHE ITALIANE SCPA (UBI BANCA)
") Composition of capital POWSZECHNA (in million Euro) Capital position CRD3 rules A) Common equity before deductions (Original own funds without hybrid instruments and government support measures other than
Composition of capital POWSZECHNA (in million Euro) Capital position CRD3 rules A) Common equity before deductions (Original own funds without hybrid instruments and government support measures other than
A. INTRODUCTION AND FINANCING OF THE GENERAL BUDGET. EXPENDITURE Description Budget Budget Change (%)
") DRAFT AMENDING BUDGET NO. 2/2018 VOLUME 1 - TOTAL REVENUE A. INTRODUCTION AND FINANCING OF THE GENERAL BUDGET FINANCING OF THE GENERAL BUDGET Appropriations to be covered during the financial year 2018
DRAFT AMENDING BUDGET NO. 2/2018 VOLUME 1 - TOTAL REVENUE A. INTRODUCTION AND FINANCING OF THE GENERAL BUDGET FINANCING OF THE GENERAL BUDGET Appropriations to be covered during the financial year 2018
Trends in the European Investment Fund Industry. in the Third Quarter of 2016
 Quarterly Statistical Release December 2016, N 67 This release and other statistical releases are available on Efama s website (www.efama.org) Trends in the European Investment Fund Industry in the Third
DATA SET ON INVESTMENT FUNDS (IVF) Naming Conventions
 Naming Conventions") DIRECTORATE GENERAL STATISTICS LAST UPDATE: 10 APRIL 2013 DIVISION MONETARY & FINANCIAL STATISTICS ECB-UNRESTRICTED DATA SET ON INVESTMENT FUNDS (IVF) Naming Conventions The series keys related to Investment
DIRECTORATE GENERAL STATISTICS LAST UPDATE: 10 APRIL 2013 DIVISION MONETARY & FINANCIAL STATISTICS ECB-UNRESTRICTED DATA SET ON INVESTMENT FUNDS (IVF) Naming Conventions The series keys related to Investment