EU Market Situation for Poultry. Committee for the Common Organisation of the Agricultural Markets 22 March 2018
|
|
|
- Crystal Green
- 5 years ago
- Views:
Transcription


1 EU Market Situation for Poultry Committee for the Common Organisation of the Agricultural Markets 22 March 218
 12% 7% 2% -3% Source= Eurostat -8% LV DK SI LT CY IE PT RO PL FI UK CZ AT ES")
2 -.2% -.8% -1.1% -2.4% -2.9% -3.3% -4.2% -4.5% 5.1% 4.6% 4.5% 3.8% 3.3% 2.7% 2.4% 1.5% 1.1% 1.%.8%.8%.5%.3%.8% 7.3% 6.3% 11.8% 11.2% P R O D U C T I O N 17% Change in Poultry Meat Production in % 217/216 (up to December) 12% 7% 2% -3% Source= Eurostat -8% LV DK SI LT CY IE PT RO PL FI UK CZ AT ES EL HR BE SE NL DE FR BG IT SK MT HU EU

3 P R O D U C T I O N NEW PARAMETERS Chicks hatched for fattening (1 pieces) Jan Feb Mar Apr May Jun Jul Aug Sep Oct Nov Dec

 216 217 218 1 9 8")

4 P R O D U C T I O N NEW PARAMETERS Production forecast of broiler (In tonnes) Jan Feb Mar Apr May Jun Jul Aug Sep Oct Nov Dec
5 P R O D U C T I O N NEW PARAMETERS Parameter National Average Live weight (kg) at Slaughter National Average Carcass yield (%) New parameters for the calculation of the estimated production of broilers BE BG CZ DK DE EE GR ES FR HR IE IT CY LV LT LU HU MT NL AT PL PT RO SI SK FI SE UK % 73.% 74.% 75.% 7.% 71.% 75.% 7.2% 67.% 69.4% 71.7% 7.1% 77.% 74.4% 75.1% 68% 7.1% 74.% 66.% 75.% 69.9% 72.4% 7.5% 72.5% 72.5% 75.% 69.% National Average Mortality (%) 2.% 4.3% 4.% 2.5% % (l.w) 4.% (h.w.) 2,5% - 3,% 6.% 5.2% 4.2% 3.7% 2.9% 5.% 3.2% 3.3% 5.% 2.% 4.2% 6.5% 3.5% 4.2% 4.2% 2.6% 2.5% 3.9% 3.5% 3.5% 4.8% National Average Period of rearing (days) 4. 51* /
6 P R O D U C T I O N Euro US Dollar exchange rate /3/218: 1 EUR = 1.23 USD Exchange rate: Spot, ECB reference - U.S. Dollar/Euro.8 1/99 1/ 1/1 1/2 1/3 1/4 1/5 1/6 1/7 1/8 1/9 1/1 1/11 1/12 1/13 1/14 1/15 1/16 1/17 1/18
7 P R O D U C T I O N Euro Argentine Peso and Brazilian Real exchange rate 16/3/218: 1 EUR = 25.4 ARS = 4.5 BRL Exchange rate: ARG Peso/Euro, Spot, ECB reference and local market quotes Exchange rate: BRA Real/Euro, Spot, ECB reference
8 $ / tonne C e r e a l P r i c e s World cereal prices ($/t) Wheat - US SRW Gulf $ 216 Wheat - FR Cl. 1 Rouen $ 28 Wheat - Black Sea Milling $ 28 Barley-FR Dlvd Rouen feed $ 27 Maize - FR Bordeaux $ 195 Maize - US 3YC Gulf $ 19 14
 MAY 219 (R) 24 22 15 21 25 2 21 2 2 $/t 1 $/t 15 18 19 1 16 5 184 18 5 14 Chicago (CME) SRW futures 7/15 1/16 7/16 1/17 7/17 1/18 12 Chicago (CME) SRW futures 3/3/18 7/3/18 11/3/18")
9 Daily traded volume (1 contracts of 136 tonnes) Daily traded volume (1 contracts of 136 tonnes) C e r e a l P r i c e s US CME SRW wheat futures 4 Daily volume 26 2 Last 14 days MAY 218 (R) SEP 218 (R) MAY 219 (R) $/t 1 $/t Chicago (CME) SRW futures 7/15 1/16 7/16 1/17 7/17 1/18 12 Chicago (CME) SRW futures 3/3/18 7/3/18 11/3/18 15/3/
10 Daily traded volume (1 contracts of 127 tonnes) Daily traded volume (1 contracts of 127 tonnes) C e r e a l P r i c e s CME maize futures Daily volume MAY 218 (R) SEP 218 (R) MAY 219 (R) Last 14 days $/t 3 16 $/t Chicago (CME) Maize futures 12/14 6/15 12/15 6/16 12/16 6/17 12/17 1 Chicago (CME) Maize futures 3/3/18 7/3/18 11/3/18 15/3/
 soybeans futures 11/14 5/15 11/15 5/16 11/16 5/17 11/17 31 3 Chicago (CME) soybeans futures")
11 Daily traded volume (1 contracts of 136 t) Daily traded volume (1 contracts of 136 t) C e r e a l P r i c e s CME soya futures Daily volume MAY 218 (R) JUL 218 (R) AUG 218 (R) MAY 219 (R) Last 14 days $/t $/t Chicago (CME) soybeans futures 11/14 5/15 11/15 5/16 11/16 5/17 11/ Chicago (CME) soybeans futures 3/3/18 1/3/18 375
12 May-16 Jun-16 Jul-16 Aug-16 Sep-16 Oct-16 Nov-16 Dec-16 Jan-17 Feb-17 Mar-17 Apr-17 May-17 Jun-17 Jul-17 Aug-17 Sep-17 Oct-17 Nov-17 Dec-17 Jan-18 Feb-18 $/ton C e r e a l P r i c e s Soyameal world quotations $/ton 6 55 Brazil Paranagua US Gulf Argentina Up River Source: IGC

13 Prices / 1 kg P R I C E S E V O L U T I O N S I N C E EU W E E K P R I C E S 11 last WEEK last MONTH last YEAR BROILER /1 kg carcase weight -.6% +.8% + 3.%
14 uro/ 1kg P R I C E S E U E V O L U T I O N B R O I L E R Evolution of the weekly EU average price for Broiler Latest price ==> EUR/1 kg 25 Evolution compared same period last year (Week 11) : + 3.% Avg Source: MSs notifications (Commission Implementing Regulation (EC) 217/1185)
15 In uro/1 kg P R I C E S E U E V O L U T I O N B R O I L E R Broiler prices in EU, USA and Brazil Sources : EU = weighted average of MS prices - Broiler 65% US = weekly USDA prices - Fresh chicken grade A,Chicago BR = average of prices in main producing states - (Aveworld.com.br) EU US BR


16 T R A D E E U I M P O R T S B r o i l e r P r o d u c t s Imports of Poultry meat from selected origins Jan-janv 18 Compared tonnes % tonnes % tonnes % tonnes % tonnes % to Jan-janv 17 Thailand % % % % % + 14% Brazil % % % % % - 46% Ukraine % % % % % +++ Chile % % % % % + 26% China % % % % % + 14% Turkey 16.% 441.% 173.% % +++ Argentina % % % 6 3.8% % + 9% Switzerland % % % % 242.3% + 65% Others % % % % 242.3% #N/A Extra-EU % change + 3.5% + 3.1% - 1.5% - 9.7%

17 TONNES cw Millions EUR T R A D E E U I M P O R T S B r o i l e r EU Poultry meat Imports EU IMPORTS of Poultry Meat (TONNES cwe) EU IMPORTS of Poultry Meat (Millions EUR) Jan-janv 16 Jan-janv 17 Jan-janv 18 Jan-janv 16 Jan-janv 17 Jan-janv 18 Thailand Brazil Ukraine Chile China Other origins Thailand Brazil Ukraine Chile China Other origins
18 T R A D E E U E X P O R T S B r o i l e r P r o d u c t s Exports of Poultry Meat to Selected Destinations Jan-janv 18 Compared tonnes % tonnes % tonnes % tonnes % tonnes % to Jan-janv 17 Ukraine % % % % % + 54% Ghana % % % % % + 27% Philippines % % % % % + 115% Hong Kong % % % % % - 29% Benin % % % % % + 2% Saudi Arabia % % % % % - 29% Vietnam % % % % % + 35% South Africa % % % % % - 43% For.JRep.Mac % % % % % + 35% Switzerland % % % % % + 6% Russia % % % 993.1% 53.% - 32% Other Destinations % % % % % Extra-EU % change -.9% + 8.5% + 2.9% + 9.%
19 TONNES cw Millions EUR T R A D E E U E X P O R T S B r o i l e r EU Poultry meat Export EU EXPORTS of Poultry Meat (TONNES cwe) Jan-janv 16 Jan-janv 17 Jan-janv 18 EU EXPORTS of Poultry Meat (Millions EUR) Jan-janv 16 Jan-janv 17 Jan-janv 18 Ukraine Ghana Philippines Hong Kong Benin Other destinations * Ukraine Ghana Philippines Hong Kong Benin Other destinations * * countries trading less than 155 ('Millions EUR)


20 in 1 Tonnes cwe T R A D E B A L A N C E EU Poultry meat Trade Balance IMPORTS EXPORTS Janjanv

21 T R A D E B A L A N C E EU Poultry meat trade balance (in 1 euros) IMPORTS EXPORTS in Millions Euros Jan-janv 18
22
 9 8 7 6 5 4 3 2 1")
23 Weekly epidemic curve for HPAI H5 outbreaks in poultry reported via ADNS (1/1/216-19/3/218)
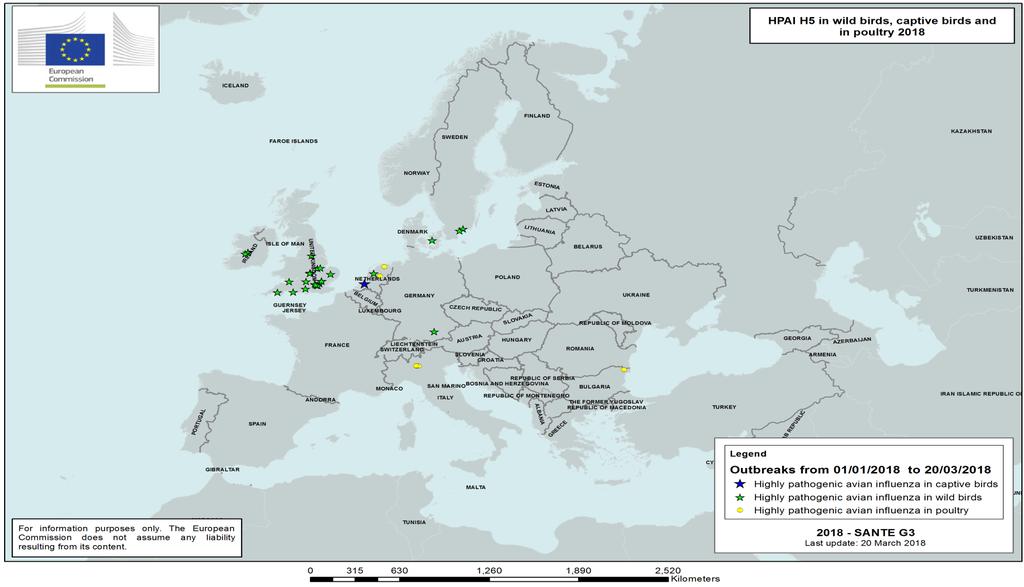
24 HPAI in poultry, captive birds and wild birds 1/1/216-19/3/218 (MS affected in 217 in red, 218 outbreaks in blue) Member State Wild birds Poultry Captive birds GERMANY FRANCE ITALY (3) NETHERLANDS 189 1(2) 11 (1) BELGIUM LUXEMBOURG 4 UNITED KINGDOM IRELAND 13 DENMARK GREECE 12 6 SPAIN 3 1 PORTUGAL 1 AUSTRIA FINLAND 14 1 SWEDEN CYPRUS 1 CZECH REPUBLIC HUNGARY POLAND SLOVENIA 273 BULGARIA 2 76 (1) 2 LITHUANIA 13 ROMANIA SLOVAKIA CROATIA 48 11
25 EUROPA SITE MARKETS Where to find data: htm Click on link: Poultry Click on link: Presentations and prices (righthand side under: in this chapter) Choose the item (link) you want Poultry dashboard -meat-dashboard_en.pdf
EU Market Situation for Poultry. Committee for the Common Organisation of the Agricultural Markets 24 August 2017
 EU Market Situation for Poultry Committee for the Common Organisation of the Agricultural Markets 24 August 217 -7.2% -7.7% -1.6% -1.7% -1.7% -2.1% -2.5% 4.1% 3.6% 3.5% 2.8% 1.9% 1.2%.8%.8%.6%.4%.2%.%.%.%.%
EU Market Situation for Eggs. Committee for the Common Organisation of the Agricultural Markets 30 August 2018
 EU Market Situation for Eggs Committee for the Common Organisation of the Agricultural Markets 30 August 2018 F O R E C A S T EU production of eggs for consumption (expert forecast May 2018) Source : Experts
EU Market Situation for Eggs. Committee for the Common Organisation of the Agricultural Markets 22 March 2018
 EU Market Situation for Eggs Committee for the Common Organisation of the Agricultural Markets 22 March 218 F O R E C A S T EU production of eggs for consumption (expert forecast November 217) Source :
last YEAR. 190 / 100 kg % Placings Broiler. Jul. Jul. Jan. Jan. Oct. Oct. Oct. Apr. Apr 125%
 POULTRY MEAT Last update: EVOLUTION 185.18 last YEAR 19 / 1 kg 18 + 1.9% -.1% 175 /1 kg carcase weight 17 4. 1.1 3. 6 3 2 4 1 2 Main Producers Poultry meat production ( 1 Tonnes product weight) ( Forecasts
EU Pigmeat Market Situation. Meat Market Observatory Economic Board meeting 02 October 2018
 EU Pigmeat Market Situation Meat Market Observatory Economic Board meeting 2 October 218 EXCHANGE RATE INDEX/EURO 14 Index of daily exchange rates of the main trading partners compared to the Euro 13 12
May 2009 Euro area external trade surplus 1.9 bn euro 6.8 bn euro deficit for EU27
 STAT/09/106 17 July 2009 May 2009 Euro area external trade surplus 1.9 6.8 deficit for EU27 The first estimate for the euro area 1 (EA16) trade balance with the rest of the world in May 2009 gave a 1.9
January 2009 Euro area external trade deficit 10.5 bn euro 26.3 bn euro deficit for EU27
 STAT/09/40 23 March 2009 January 2009 Euro area external trade deficit 10.5 26.3 deficit for EU27 The first estimate for the euro area 1 (EA16) trade balance with the rest of the world in January 2009
August 2008 Euro area external trade deficit 9.3 bn euro 27.2 bn euro deficit for EU27
 STAT/08/143 17 October 2008 August 2008 Euro area external trade deficit 9.3 27.2 deficit for EU27 The first estimate for the euro area 1 (EA15) trade balance with the rest of the world in August 2008
January 2010 Euro area unemployment rate at 9.9% EU27 at 9.5%
 STAT//29 1 March 20 January 20 Euro area unemployment rate at 9.9% EU27 at 9.5% The euro area 1 (EA16) seasonally-adjusted 2 unemployment rate 3 was 9.9% in January 20, the same as in December 2009 4.
October 2010 Euro area unemployment rate at 10.1% EU27 at 9.6%
 STAT//180 30 November 20 October 20 Euro area unemployment rate at.1% EU27 at 9.6% The euro area 1 (EA16) seasonally-adjusted 2 unemployment rate 3 was.1% in October 20, compared with.0% in September 4.
DATA SET ON INVESTMENT FUNDS (IVF) Naming Conventions
 Naming Conventions") DIRECTORATE GENERAL STATISTICS LAST UPDATE: 10 APRIL 2013 DIVISION MONETARY & FINANCIAL STATISTICS ECB-UNRESTRICTED DATA SET ON INVESTMENT FUNDS (IVF) Naming Conventions The series keys related to Investment
DIRECTORATE GENERAL STATISTICS LAST UPDATE: 10 APRIL 2013 DIVISION MONETARY & FINANCIAL STATISTICS ECB-UNRESTRICTED DATA SET ON INVESTMENT FUNDS (IVF) Naming Conventions The series keys related to Investment
BEEF & VEAL MARKET SITUATION. "Single CMO" Management Committee 18 September 2014
 BEEF & VEAL MARKET SITUATION "Single CMO" Management Committee L I V E S T O C K JUNE SURVEY E.U. E V O L U T I O N T O T A L B O V I N E May/Jun %Var %Var %Var %Var TOT LIVESTOCK BOVINE < 1 Year BOVINE
Harmonised Index of Consumer Prices (HICP) August 2015
 August 2015") Aug-14 Sep-14 Oct-14 Nov-14 Dec-14 Jan-15 Feb-15 Mar-15 Apr-15 May-15 Jun-15 MONTENEGRO STATISTICAL OFFICE R E L E A S E Broj: 201 Podgorica, 18 September 2015 When using the data please name the source
Aug-14 Sep-14 Oct-14 Nov-14 Dec-14 Jan-15 Feb-15 Mar-15 Apr-15 May-15 Jun-15 MONTENEGRO STATISTICAL OFFICE R E L E A S E Broj: 201 Podgorica, 18 September 2015 When using the data please name the source
Macroeconomic overview SEE and Macedonia
 Macroeconomic overview SEE and Macedonia Zoltan Arokszallasi Chief Analyst, Macro & FX/FI Research Erste Group Bank Erste Investors Breakfast, 29 September, Skopje 02. Oktober SEE shows mixed performance
Growth, competitiveness and jobs: priorities for the European Semester 2013 Presentation of J.M. Barroso,
 Growth, competitiveness and jobs: priorities for the European Semester 213 Presentation of J.M. Barroso, President of the European Commission, to the European Council of 14-1 March 213 Economic recovery
December 2010 Euro area annual inflation up to 2.2% EU up to 2.6%
 STAT/11/9 14 January 2011 December 2010 Euro area annual inflation up to 2.2% EU up to 2.6% Euro area 1 annual inflation was 2.2% in December 2010 2, up from 1.9% in November. A year earlier the rate was
SHEEP & GOAT - MARKET SITUATION - DASHBOARD Last update: 25/04/2018
 75 57 25 29 EU Trade 1 611 1 813 1 886 1 765 1 438 1 21 212 213 EU India (up to Jan) United States China + H. Kong EU India (up to Jan) United States China + H. Kong Iran Japan Iran Japan World Trade New
Traffic Safety Basic Facts Main Figures. Traffic Safety Basic Facts Traffic Safety. Motorways Basic Facts 2015.
 Traffic Safety Basic Facts 2013 - Main Figures Traffic Safety Basic Facts 2015 Traffic Safety Motorways Basic Facts 2015 Motorways General Almost 30.000 people were killed in road accidents on motorways
May 2009 Euro area annual inflation down to 0.0% EU down to 0.7%
 STAT/09/88 16 June 2009 May 2009 Euro area annual inflation down to 0.0% EU down to 0.7% Euro area 1 annual inflation was 0.0% in May 2009 2, down from 0.6% in April. A year earlier the rate was 3.7%.
DG AGRI DASHBOARD: PIGMEAT Last update:
 EU Trade World Trade China + H. Kong Brazil Chile (up to Mar) Mexico (up to Mar) Russia (up to Mar) 1 325 1 287 China + H. Kong Brazil Chile (up to Mar) Mexico (up to Mar) Russia (up to Mar) Qty in 1000
Traffic Safety Basic Facts Main Figures. Traffic Safety Basic Facts Traffic Safety. Motorways Basic Facts 2016.
 Traffic Safety Basic Facts 2013 - Main Figures Traffic Safety Basic Facts 2015 Traffic Safety Motorways Basic Facts 2016 Motorways General Almost 26.000 people were killed in road accidents on motorways
Library statistical spotlight
 /9/2 Library of the European Parliament 6 4 2 This document aims to provide a picture of the, in particular by looking at car production trends since 2, at the number of enterprises and the turnover they
COMMISSION STAFF WORKING DOCUMENT Accompanying the document. Report form the Commission to the Council and the European Parliament
 EUROPEAN COMMISSION Brussels, 4.5.2018 SWD(2018) 246 final PART 5/9 COMMISSION STAFF WORKING DOCUMENT Accompanying the document Report form the Commission to the Council and the European Parliament on
H Marie Skłodowska-Curie Actions (MSCA)
") H2020 Key facts and figures (2014-2020) Number of FI researchers funded by MSCA: EU budget awarded to FI organisations (EUR million): Number of FI organisations in MSCA: 155 47.93 89 In detail, the number
H2020 Key facts and figures (2014-2020) Number of FI researchers funded by MSCA: EU budget awarded to FI organisations (EUR million): Number of FI organisations in MSCA: 155 47.93 89 In detail, the number
Traffic Safety Basic Facts Main Figures. Traffic Safety Basic Facts Traffic Safety. Motorways Basic Facts 2017.
 Traffic Safety Basic Facts 2013 - Main Figures Traffic Safety Basic Facts 2015 Traffic Safety Motorways Basic Facts 2017 Motorways General More than 24.000 people were killed in road accidents on motorways
DG AGRI DASHBOARD: PIGMEAT Last update:
 Chile EU Trade 3 134 3 073 3 096 2 940 1 696 1 590 3 265 World Trade China + H. Kong Brazil Mexico (up to Apr) Russia (up to Apr) Chile China + H. Kong Brazil Mexico (up to Apr) Russia (up to Apr) Qty
H Marie Skłodowska-Curie Actions (MSCA)
") H2020 Key facts and figures (2014-2020) Number of IE researchers funded by MSCA: EU budget awarded to IE organisations (EUR million): Number of IE organisations in MSCA: 253 116,04 116 In detail, the number
H2020 Key facts and figures (2014-2020) Number of IE researchers funded by MSCA: EU budget awarded to IE organisations (EUR million): Number of IE organisations in MSCA: 253 116,04 116 In detail, the number
H Marie Skłodowska-Curie Actions (MSCA)
") H2020 Key facts and figures (2014-2020) Number of BE researchers funded by MSCA: EU budget awarded to BE organisations (EUR million): Number of BE organisations in MSCA: 274 161,04 227 In detail, the number
H2020 Key facts and figures (2014-2020) Number of BE researchers funded by MSCA: EU budget awarded to BE organisations (EUR million): Number of BE organisations in MSCA: 274 161,04 227 In detail, the number
NOTE ON EU27 CHILD POVERTY RATES
 NOTE ON EU7 CHILD POVERTY RATES Research note prepared for Child Poverty Action Group Authors: H. Xavier Jara and Chrysa Leventi Institute for Social and Economic Research (ISER) University of Essex The
H Marie Skłodowska-Curie Actions (MSCA)
") H2020 Key facts and figures (2014-2020) Number of NL researchers funded by MSCA: EU budget awarded to NL organisations (EUR million): Number of NL organisations in MSCA: 427 268.91 351 In detail, the number
H2020 Key facts and figures (2014-2020) Number of NL researchers funded by MSCA: EU budget awarded to NL organisations (EUR million): Number of NL organisations in MSCA: 427 268.91 351 In detail, the number
H Marie Skłodowska-Curie Actions (MSCA)
") H2020 Key facts and figures (2014-2020) Number of LV researchers funded by MSCA: EU budget awarded to LV organisations (EUR million): Number of LV organisations in MSCA: 35 3.91 11 In detail, the number
H2020 Key facts and figures (2014-2020) Number of LV researchers funded by MSCA: EU budget awarded to LV organisations (EUR million): Number of LV organisations in MSCA: 35 3.91 11 In detail, the number
H Marie Skłodowska-Curie Actions (MSCA)
") H2020 Key facts and figures (2014-2020) Number of FR researchers funded by MSCA: EU budget awarded to FR organisations (EUR million): Number of FR organisations in MSCA: 1 072 311.72 479 In detail, the
H2020 Key facts and figures (2014-2020) Number of FR researchers funded by MSCA: EU budget awarded to FR organisations (EUR million): Number of FR organisations in MSCA: 1 072 311.72 479 In detail, the
COMMISSION DECISION of 23 April 2012 on the second set of common safety targets as regards the rail system (notified under document C(2012) 2084)
 2084)") 27.4.2012 Official Journal of the European Union L 115/27 COMMISSION DECISION of 23 April 2012 on the second set of common safety targets as regards the rail system (notified under document C(2012) 2084)
27.4.2012 Official Journal of the European Union L 115/27 COMMISSION DECISION of 23 April 2012 on the second set of common safety targets as regards the rail system (notified under document C(2012) 2084)
H Marie Skłodowska-Curie Actions (MSCA)
") H2020 Key facts and figures (2014-2020) Number of PT researchers funded by MSCA: EU budget awarded to PT organisations (EUR million): Number of PT organisations in MSCA: 716 66,67 165 In detail, the number
H2020 Key facts and figures (2014-2020) Number of PT researchers funded by MSCA: EU budget awarded to PT organisations (EUR million): Number of PT organisations in MSCA: 716 66,67 165 In detail, the number
H Marie Skłodowska-Curie Actions (MSCA)
") H2020 Key facts and figures (2014-2020) Number of SE researchers funded by MSCA: EU budget awarded to SE organisations (EUR million): Number of SE organisations in MSCA: 138 114.71 150 In detail, the number
H2020 Key facts and figures (2014-2020) Number of SE researchers funded by MSCA: EU budget awarded to SE organisations (EUR million): Number of SE organisations in MSCA: 138 114.71 150 In detail, the number
H Marie Sklodowska-Curie Actions (MSCA)
") H2020 Key facts and figures (2014-2020) Number of FR researchers funded by MSCA: EU budget awarded to FR organisations (EUR million): Number of FR organisations in MSCA: 565 198.92 370 In detail, the number
H2020 Key facts and figures (2014-2020) Number of FR researchers funded by MSCA: EU budget awarded to FR organisations (EUR million): Number of FR organisations in MSCA: 565 198.92 370 In detail, the number
HOW RECESSION REFLECTS IN THE LABOUR MARKET INDICATORS
 REPUBLIC OF SLOVENIA HOW RECESSION REFLECTS IN THE LABOUR MARKET INDICATORS Matej Divjak, Irena Svetin, Darjan Petek, Miran Žavbi, Nuška Brnot ??? What is recession?? Why in Europe???? Why in Slovenia?
H Marie Skłodowska-Curie Actions (MSCA)
") H2020 Key facts and figures (2014-2020) Number of AT researchers funded by MSCA: EU budget awarded to AT organisations (EUR million): Number of AT organisations in MSCA: 215 78.57 140 In detail, the number
H2020 Key facts and figures (2014-2020) Number of AT researchers funded by MSCA: EU budget awarded to AT organisations (EUR million): Number of AT organisations in MSCA: 215 78.57 140 In detail, the number
LEADER implementation update Leader/CLLD subgroup meeting Brussels, 21 April 2015
 LEADER 2007-2013 implementation update Leader/CLLD subgroup meeting Brussels, 21 April 2015 #LeaderCLLD 2,416 2,416 8.9 Progress on LAG selection in the EU (2007-2013) 3 000 2 500 2 000 2 182 2 239 2 287
The EFTA Statistical Office: EEA - the figures and their use
 The EFTA Statistical Office: EEA - the figures and their use EEA Seminar Brussels, 13 September 2012 1 Statistics Comparable, impartial and reliable statistical data are a prerequisite for a democratic
Taxation trends in the European Union EU27 tax ratio at 39.8% of GDP in 2007 Steady decline in top personal and corporate income tax rates since 2000
 DG TAXUD STAT/09/92 22 June 2009 Taxation trends in the European Union EU27 tax ratio at 39.8% of GDP in 2007 Steady decline in top personal and corporate income tax rates since 2000 The overall tax-to-gdp
H Marie Skłodowska-Curie Actions (MSCA)
") H2020 Key facts and figures (2014-2020) Number of PT researchers funded by MSCA: EU budget awarded to PT organisations (EUR million): Number of PT organisations in MSCA: 592 54.79 135 In detail, the number
H2020 Key facts and figures (2014-2020) Number of PT researchers funded by MSCA: EU budget awarded to PT organisations (EUR million): Number of PT organisations in MSCA: 592 54.79 135 In detail, the number
Country Health Profiles
 State of Health in the EU Country Health Profiles Brussels, November 2017 1 The Country Health Profiles 1. Highlights 2. Health status 3. Risk Factors 4. Health System (description) 5. Performance of Health
H Marie Skłodowska-Curie Actions (MSCA)
") H2020 Key facts and figures (2014-2020) Number of LT researchers funded by MSCA: EU budget awarded to LT organisations (EUR million): Number of LT organisations in MSCA: 79 5.03 21 In detail, the number
H2020 Key facts and figures (2014-2020) Number of LT researchers funded by MSCA: EU budget awarded to LT organisations (EUR million): Number of LT organisations in MSCA: 79 5.03 21 In detail, the number
State of play of CAP measure Setting up of Young Farmers in the European Union
 State of play of CAP measure Setting up of Young Farmers in the European Union Michael Gregory EN RD Contact Point Seminar CEJA 20 th September 2010 Measure 112 rationale: Measure 112 - Setting up of young
EUROPEAN COMMISSION EUROSTAT
 EUROPEAN COMMISSION EUROSTAT Directorate F: Social statistics Unit F-3: Labour market Doc.: Eurostat/F3/LAMAS/29/14 WORKING GROUP LABOUR MARKET STATISTICS Document for item 3.2.1 of the agenda LCS 2012
Two years to go to the 2014 European elections European Parliament Eurobarometer (EB/EP 77.4)
") Directorate-General for Communication PUBLIC OPINION MONITORING UNIT Brussels, 23 October 2012. Two years to go to the 2014 European elections European Parliament Eurobarometer (EB/EP 77.4) FOCUS ON THE
Directorate-General for Communication PUBLIC OPINION MONITORING UNIT Brussels, 23 October 2012. Two years to go to the 2014 European elections European Parliament Eurobarometer (EB/EP 77.4) FOCUS ON THE
COMMISSION STAFF WORKING DOCUMENT Accompanying the document
 EUROPEAN COMMISSION Brussels, 9.10.2017 SWD(2017) 330 final PART 13/13 COMMISSION STAFF WORKING DOCUMENT Accompanying the document REPORT FROM THE COMMISSION TO THE EUROPEAN PARLIAMENT, THE COUNCIL, THE
Overview of Eurofound surveys
 Overview of Eurofound surveys Dublin 21 st October 2010 Maija Lyly-Yrjänäinen Eurofound data European Working Conditions Survey 91, 95, 00, 05, 10 European Quality of Life Survey 03, 07, 09, 10 (EB), 11
Eurofound in-house paper: Part-time work in Europe Companies and workers perspective
 Eurofound in-house paper: Part-time work in Europe Companies and workers perspective Presented by: Eszter Sandor Research Officer, Surveys and Trends 26/03/2010 1 Objectives Examine the patterns of part-time
H Marie Skłodowska-Curie Actions (MSCA)
") H2020 Key facts and figures (2014-2020) Number of CZ researchers funded by MSCA: EU budget awarded to CZ organisations (EUR million): Number of CZ organisations in MSCA: 157 23.11 58 In detail, the number
H2020 Key facts and figures (2014-2020) Number of CZ researchers funded by MSCA: EU budget awarded to CZ organisations (EUR million): Number of CZ organisations in MSCA: 157 23.11 58 In detail, the number
FIRST REPORT COSTS AND PAST PERFORMANCE
 FIRST REPORT COSTS AND PAST PERFORMANCE DECEMBER 2018 https://eiopa.europa.eu/ PDF ISBN 978-92-9473-131-9 ISSN 2599-8862 doi: 10.2854/480813 EI-AM-18-001-EN-N EIOPA, 2018 Reproduction is authorised provided
Gender pension gap economic perspective
 Gender pension gap economic perspective Agnieszka Chłoń-Domińczak Institute of Statistics and Demography SGH Part of this research was supported by European Commission 7th Framework Programme project "Employment
How much does it cost to make a payment?
 How much does it cost to make a payment? Heiko Schmiedel European Central Bank Directorate General Payments & Market Infrastructure, Market Integration Division World Bank Global Payments Week 23 October
2 ENERGY EFFICIENCY 2030 targets: time for action
 ENERGY EFFICIENCY 2030 targets: time for action The Coalition for Energy Savings The Coalition for Energy Savings strives to make energy efficiency and savings the first consideration of energy policies
Some Historical Examples of Yield Curves
 3 months 6 months 1 year 2 years 5 years 10 years 30 years Some Historical Examples of Yield Curves Nominal interest rate, % 16 14 12 10 8 6 4 2 January 1981 June1999 December2009 0 Time to maturity This
STAT/14/ October 2014
 STAT/14/158-21 October 2014 Provision of deficit and debt data for 2013 - second notification Euro area and EU28 government deficit at 2.9% and 3.2% of GDP respectively Government debt at 90.9% and 85.4%
EBA REPORT ON HIGH EARNERS
 EBA REPORT ON HIGH EARNERS DATA AS OF END 2017 LONDON - 11/03/2019 1 Data on high earners List of figures 3 Executive summary 4 1. Data on high earners 6 1.1 Background 6 1.2 Data collected on high earners
Social Protection and Social Inclusion in Europe Key facts and figures
 MEMO/08/625 Brussels, 16 October 2008 Social Protection and Social Inclusion in Europe Key facts and figures What is the report and what are the main highlights? The European Commission today published
12236/12 JR/fk 1 DG B 1
 COUNCIL OF THE EUROPEAN UNION Brussels, 10 July 2012 12236/12 AGRI 491 AGRIORG 116 NOTE from: to: Subject: Commission Council Report on the situation of the dairy market Delegations will find attached
H Marie Skłodowska-Curie Actions (MSCA)
") H2020 Key facts and figures (2014-2020) Number of SI researchers funded by MSCA: EU budget awarded to SI organisations (EUR million): Number of SI organisations in MSCA: 121 12.53 35 In detail, the number
H2020 Key facts and figures (2014-2020) Number of SI researchers funded by MSCA: EU budget awarded to SI organisations (EUR million): Number of SI organisations in MSCA: 121 12.53 35 In detail, the number
Recommendations compliance table
 Recommendations compliance table EBA/REC/2017/03 20 December 2017; Date of application 1 July 2018 Recommendations on outsourcing to cloud service providers The following competent authorities* or intend
Guidelines compliance table
 Guidelines compliance table EBA/GL/2018/01 12 January 2018; Date of application 20 March 2018 Guidelines on uniform disclosures under Article 473a of Regulation (EU) No 575/2013 as regards the transitional
The Eurostars Programme
 The Eurostars Programme The EU-EUREKA joint funding programme for R&D-performing SMEs What is EUREKA? > 2 > EUREKA is a public network supporting R&D-performing businesses > Established in 1985 by French
For further information, please see online or contact
 For further information, please see http://ec.europa.eu/research/sme-techweb online or contact Lieve.VanWoensel@ec.europa.eu Seventh Progress Report on SMEs participation in the 7 th R&D Framework Programme
First estimate for 2011 Euro area external trade deficit 7.7 bn euro bn euro deficit for EU27
 27/2012-15 February 2012 First estimate for 2011 Euro area external trade deficit 7.7 152.8 deficit for EU27 The first estimate for the euro area 1 (EA17) trade in goods balance with the rest of the world
Securing sustainable and adequate social protection in the EU
 Securing sustainable and adequate social protection in the EU Session on Social Protection & Security IFA 12th Global Conference on Ageing 11 June 2014, HICC Hyderabad India Dr Lieve Fransen European Commission
Themes Income and wages in Europe Wages, productivity and the wage share Working poverty and minimum wage The gender pay gap
 5. W A G E D E V E L O P M E N T S At the ETUC Congress in Seville in 27, wage developments in Europe were among the most debated issues. One of the key problems highlighted in this respect was the need
June 2014 Euro area international trade in goods surplus 16.8 bn 2.9 bn surplus for EU28
 127/2014-18 August 2014 June 2014 Euro area international trade in goods surplus 16.8 bn 2.9 bn surplus for EU28 The first estimate for the euro area 1 (EA18) trade in goods balance with the rest of the
June Introduction Relevance of the database Extractions Hits Completeness...6
 June 2005 1 Introduction...2 2 Relevance of the database...3 2.1 Extractions...3 2.2 Hits...5 3 Completeness...6 3.1 Coverage of the database...6 3.2 Geographical level...9 3.3 Distribution by domain...11
Second estimate for the third quarter of 2008 EU27 current account deficit 39.5 bn euro 19.3 bn euro surplus on trade in services
 STAT/09/12 22 January 2009 Second estimate for the third quarter of 20 EU27 current account deficit 39.5 bn euro 19.3 bn euro surplus on trade in According to the latest revisions1, the EU272 external
January 2014 Euro area international trade in goods surplus 0.9 bn euro 13.0 bn euro deficit for EU28
 STAT/14/41 18 March 2014 January 2014 Euro area international trade in goods surplus 0.9 13.0 deficit for EU28 The first estimate for the euro area 1 (EA18) trade in goods balance with the rest of the
H Marie Skłodowska-Curie Actions (MSCA)
") H2020 Key facts and figures (2014-2020) Number of LT researchers funded by MSCA: EU budget awarded to LT organisations (EUR million): Number of LT organisations in MSCA: 104 6,82 29 In detail, the number
H2020 Key facts and figures (2014-2020) Number of LT researchers funded by MSCA: EU budget awarded to LT organisations (EUR million): Number of LT organisations in MSCA: 104 6,82 29 In detail, the number
Guidelines compliance table
 Guidelines compliance table EBA/GL/2017/01 Appendix 1 08 March 2017; Date of application 31 December 2017 (Updated: 14 November 2017) Guidelines on LCR disclosure to complement the disclosure of liquidity
PROGRESS TOWARDS THE LISBON OBJECTIVES 2010 IN EDUCATION AND TRAINING
 PROGRESS TOWARDS THE LISBON OBJECTIVES IN EDUCATION AND TRAINING In 7, reaching the benchmarks for continues to pose a serious challenge for education and training systems in Europe, except for the goal
Adverse scenario for the European Insurance and Occupational Pensions Authority s EU-wide insurance stress test in 2018
 9 April 218 ECB-PUBLIC Adverse scenario for the European Insurance and Occupational Pensions Authority s EU-wide insurance stress test in 218 Introduction In accordance with its mandate, the European Insurance
PROGRESS TOWARDS THE LISBON OBJECTIVES 2010 IN EDUCATION AND TRAINING
 PROGRESS TOWARDS THE LISBON OBJECTIVES IN EDUCATION AND TRAINING In, reaching the benchmarks for continues to pose a serious challenge for education and training systems in Europe, except for the goal
World Economic Outlook Central Europe and Baltic Countries
 World Economic Outlook Central Europe and Baltic Countries Presentation by Susan Schadler and Christoph Rosenberg September 5 World growth returns to trend. (World real GDP growth, annual percent change)
Fiscal sustainability challenges in Romania
 Preliminary Draft For discussion only Fiscal sustainability challenges in Romania Bucharest, May 10, 2011 Ionut Dumitru Anca Paliu Agenda 1. Main fiscal sustainability challenges 2. Tax collection issues
Reporting practices for domestic and total debt securities
 Last updated: 27 November 2017 Reporting practices for domestic and total debt securities While the BIS debt securities statistics are in principle harmonised with the recommendations in the Handbook on
Fiscal competitiveness issues in Romania
 Fiscal competitiveness issues in Romania Ionut Dumitru President of the Fiscal Council, Chief Economist Raiffeisen Bank* October 2014 World Bank Doing Business Report Ranking (out of 189 countries) Ease
STAT/14/64 23 April 2014
 STAT/14/64 23 April 2014 Provision of deficit and debt data for 2013 - first notification Euro area and EU28 government deficit at 3.0% and 3.3% of GDP respectively Government debt at 92.6% and 87.1% In
Report on the distribution of direct payments to agricultural producers (financial year 2016)
") Report on the distribution of direct payments to agricultural producers (financial year 2016) Every year, the Commission publishes the distribution of direct payments to farmers by Member State. Figures
Report on the distribution of direct payments to agricultural producers (financial year 2016) Every year, the Commission publishes the distribution of direct payments to farmers by Member State. Figures
Investment in Ireland and the EU
 Investment in and the EU Debora Revoltella Director Economics Department Dublin April 10, 2017 20/04/2017 1 Real investment: IE v EU country groupings Real investment (2008 = 100) 180 160 140 120 100 80
Guidelines compliance table
 Guidelines compliance table EBA/GL/2017/05 Appendix 1 11 May 2017; Date of application 01 January 2018 (Updated 19 February 2018) Guidelines on ICT Risk Assessment under the Supervisory Review and Evaluation
Public data underlying the figures of Annual Report on the Results of Monitoring the Internal Electricity and Natural Gas Markets in 2013
 Public data underlying the figures of Annual Report on the Results of Monitoring the Internal Electricity and Natural Gas Markets in 2013 October 2014 Legal notice This document is a joint publication
Harmonised Index of Consumer Prices (HICP) April 2013
 April 2013") Apr-12 May-12 June-12 July-12 Aug-12 Sep-12 Oct-12 Nov-12 Dec-12 Jan-13 Feb-13 Mar-13 Apr-13 MONTENEGRO STATISTICAL OFFICE RELEASE No: 137 Podgorica, 17 May 2013 When using the data please name the source
Apr-12 May-12 June-12 July-12 Aug-12 Sep-12 Oct-12 Nov-12 Dec-12 Jan-13 Feb-13 Mar-13 Apr-13 MONTENEGRO STATISTICAL OFFICE RELEASE No: 137 Podgorica, 17 May 2013 When using the data please name the source
Guidelines compliance table
 compliance table EBA/GL/2018/05 18 July 2018; Date of application 1 January 2019 on fraud reporting under the Payment Services Directive 2 (PSD2) The following competent authorities* or intend to with
May 2012 Euro area international trade in goods surplus of 6.9 bn euro 3.8 bn euro deficit for EU27
 108/2012-16 July 2012 May 2012 Euro area international trade in goods surplus of 6.9 3.8 deficit for EU27 The first estimate for the euro area 1 (EA17) trade in goods balance with the rest of the world
Investment and Investment Finance. the EU and the Polish story. Debora Revoltella
 Investment and Investment Finance the EU and the Polish story Debora Revoltella Director - Economics Department EIB Warsaw 27 February 2017 Narodowy Bank Polski European Investment Bank Contents We look
DEC'15: 179 MAY'16: 188 DEC'16: 190 Daily volume /09 23/09 03/10 13/10 23/10 02/11 12/11. Euronext milling wheat futures
 Trade Weekly volume - thousand tons Total f or MY - million tons Weekly volume - thousand tons Total f or MY - million tons Weekly volume - thousand tons Total f or MY - million tons Million tons Production
August 2012 Euro area international trade in goods surplus of 6.6 bn euro 12.6 bn euro deficit for EU27
 146/2012-16 October 2012 August 2012 Euro area international trade in goods surplus of 6.6 12.6 deficit for EU27 The first estimate for the euro area 1 (EA17) trade in goods balance with the rest of the
June 2012 Euro area international trade in goods surplus of 14.9 bn euro 0.4 bn euro surplus for EU27
 121/2012-17 August 2012 June 2012 Euro area international trade in goods surplus of 14.9 0.4 surplus for EU27 The first estimate for the euro area 1 (EA17) trade in goods balance with the rest of the world
THE 2015 EU JUSTICE SCOREBOARD
 THE 215 EU JUSTICE SCOREBOARD Communication from the Commission to the European Parliament, the Council, the European Central Bank, the European Economic and Social Committee and the Committee of the Regions
Economic Trends and Challenges
 Economic Trends and Challenges in Central and Eastern Europe Christoph Rosenberg International Monetary Fund IMF Seminar for Journalists Vienna, August 28, 27 Note: These are the author s s own views,
Investment in Germany and the EU
 Investment in Germany and the EU Pedro de Lima Head of the Economics Studies Division Economics Department Berlin 19/12/2016 11/01/2017 1 Slow recovery of investment, with strong heterogeneity Overall
SEE macroeconomic outlook Recovery gains traction, fiscal discipline improving. Alen Kovac, Chief Economist EBC May 2016 Ljubljana
 SEE macroeconomic outlook Recovery gains traction, fiscal discipline improving Alen Kovac, Chief Economist EBC May 216 Ljubljana Real economy highlights Recent GDP track record reveals more favorable footprint
The CAP reform process in perspective: issues of the post-2013 debate
 The CAP reform process in perspective: issues of the post-213 debate Tassos Haniotis Director - Economic Analysis, Perspectives and Evaluations DG for Agriculture and Rural Development European Commission
ANNEX CAP evolution and introduction of direct payments
 ANNEX 2 REPORT ON THE DISTRIBUTION OF DIRECT AIDS TO THE PRODUCERS (FINANCIAL YEAR 2005) 1. FOREWORD The Commission regularly publishes the breakdown of direct payments by Member State and size of payment.
Table of Contents. Part 1 General Section
 About the Editor Foreword v XV Part 1 General Section About this Guide 1-3 Background to the VAT in Europe 2-1 A. Principles of the VAT 2-2 B. VAT in the European Community 2-4 C. The European Union and