How to Invest in Real Estate in a Growth Economy
|
|
|
- Christian Greene
- 5 years ago
- Views:
Transcription


1 Origin Capital Acquisition Strategy March 2015 How to Invest in Real Estate in a Growth Economy 1

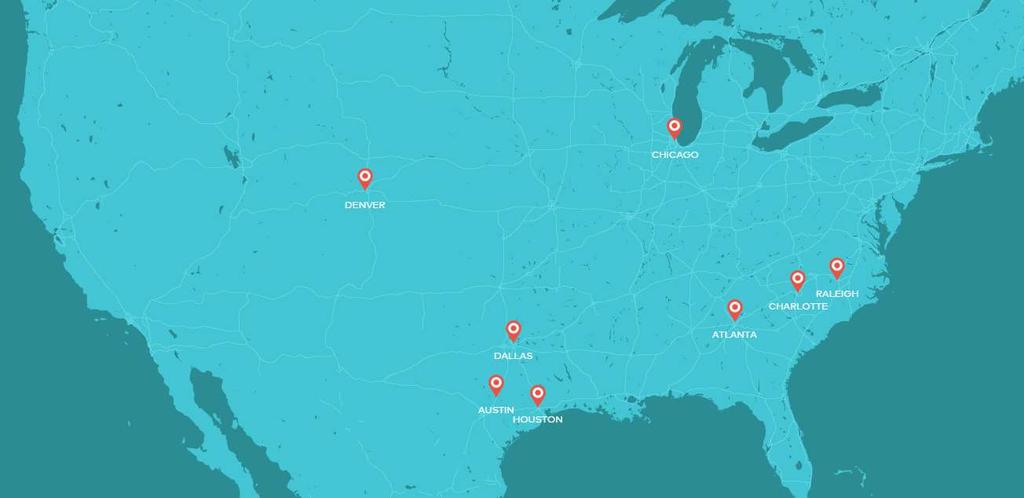
2 Investment Focus 8 U.S. Growth Markets 2


3 Market Opportunity Target Markets Attractive Target Markets Target markets generally exhibit strong demographic indicators of future demand, including job growth, population growth, and unemployment rates, relative to the national average. Source: Origin analysis based on Costar Market Reports 3
4 Investment Strategy Research-Driven Geographic Focus Target Market and Submarket Selection Investment strategy begins with market selection. Origin analyzes demand drivers such as job growth, population growth and forecasted growth rates in each of its target markets compared to the national average. Origin then further defines geographic investment boundaries within each target market by analyzing growth characteristics and long-term potential of each submarket within the city. Analysis: Case Study: Chicago Comparison of the Chicago Commercial Business District compared to the overall Chicago market Potential: Chicago has exhibited a low growth rate, but the Downtown Loop submarket has one of the highest growth rates in the country Surrounding Area Demographics 2014 Estimates 1-Mile Radius Chicago MSA Population ,232 9,461,105 Population ,250 9,557,430 Population ,075 9,665,731 Compound % Change % 0.3% Compound % Change % 0.2% Households ,423 3,475,726 Households ,268 3,531,674 Households ,065 3,589,679 Compound % Change % 0.4% Compound % Change % 0.3% Median Household Income 2014 $76,382 $57,972 Average Household Size College Graduate % 80% 34% Median Age Owner Occupied % 43% 66% Renter Occupied % 57% 34% Median Owner Occupied Housing Value $329,420 $222,691 Median Year Structure Built Avg. Travel Time to Work in Min Source: Claritas based on U.S. Census Data 4
5 Origin 2014/2015 Activity Deal Sourcing Over 400 Deals Presented Deal Review 200 Deals Underwritten Valued at Over $3 billion Due Diligence 150 Site Visits and Market Tours Investment Committee Approval 50 LOI/Terms Sheets Submitted Acquisitions 11 assets acquired for an aggregate $251 million Dispositions 6 assets sold for an aggregate $122 million $373 million total transactions in 18 months 5
6 2015 Transaction Pipeline MSA Size Status Price (mm) Risk Profile Comments Q3/Q4 Acquisition Pipeline Iroquois Club Chicago 264 units Purchased $38.0 Value-added City Center Buckhead Atlanta 33,406 SF Negotiating Purchase $13.4 Core-plus One University Place Charlotte 80,891 SF Under Contract $7.3 Value-added One Harrison Park Raleigh 56,933 SF Offer Submitted $6.1 Value-added Off-market acquisition of an apartment complex in Naperville. Off-market office asset in the heart of Buckhead. 4-story office building in the dynamic University submarket. Office acquisition adjacent to prestigious Weston Development. Q3/Q4 Disposition Pipeline Arbor on Richmond Houston 304 units Under Contract $12.6 Value-added Executed contract at $42/door. Marquis Crest Atlanta 300 units Sold $11.5 Value-added Disposition Closed 8/6/15 Centrum at Glenridge Atlanta 186,360 SF Preparing for Sale $35.4 Core-plus Engaged broker to market for sale Note: The above summary highlights some pending transactions in Origin s acquisition/disposition pipeline. There is no certainty that any of the above-described deals will close, and all pricing may be subject to change. 6


7 Investment Strategy Asset Management Drive Income Growth with Expert Asset management team formulates asset-level business plans, ensuring optimal ownership and exit strategies are integrated prior to delivery of letters of intent on new investments. Revenue Enhancements Position the asset to meet market demand Determine physical enhancement needs Identify rebranding oppor tunities Develop tactical marketing plan Cultivate ancillary revenue streams Cost Reductions Understand acceptable ranges of controlled expenses Improve efficiency Utilize economies of scale Pursue real estate tax appeals 7
: 14.5% Projected Gross IRR: 27.8% Projected Gross Multiple: 2.")
 Market Fundamentals: Located 10 miles northeast of Charlotte City Center 2 nd")
8 Case Study Cambridge Corporate Center - Current Holding Cambridge Corporate Center CHARLOTTE OFFICE Acquisition Date: 8/14/2014 Total Acquisition Cost: $44.6mm Total Price Per Square Foot: $131 Going-in Cap Rate: 9.6% Stabilized Levered Yield (projected): 14.5% Projected Gross IRR: 27.8% Projected Gross Multiple: 2.6x Oppor tunity / Investment Thesis: Three-wing 339,244 SF office asset Acquired at substantial discount to replacement cost Large block vacancy meets large user demand Competitive advantages in above-market parking and redundant power system Predictable income from well-established tenant base (GM and Duke Energy) Market Fundamentals: Located 10 miles northeast of Charlotte City Center 2 nd largest employment center in the region 1 Value Enhancement / Results: Secured 97,000 SF 10-year lease valued at $20 million, increasing occupancy to 94% Executed 5-year renewal with Duke Energy for 31,000 SF with 11% rent increase Building re-measurement increased rentable area by 24,000 SF (7%) $60k in annual expense savings by implementing security camera system 1 Source: UniversityCityPartners.org based on U.S. Census Bureau Data 8

9 Case Study Lux24 - Current Holding Oppor tunity / Investment Thesis: Acquire a 67-unit failed condominium project directly from the lender 51% occupied with 25 unfinished units Significant value-added opportunity to complete build-out, lease up unfinished units and mark rents to market Lux24 CHICAGO MULTI-FAMILY Acquisition Date: 6/5/2013 Total Acquisition Cost: $19.22mm Total Price Per Unit: $251k Going-in Cap Rate: 4.3% Stabilized Levered Yield (projected): 27.7% Projected Gross IRR: 30.4% Projected Gross Multiple: 2.9x Market Fundamentals: West Loop submarket has experienced some of the strongest absorption and market rent growth 1 in the Chicago MSA strengthen demand from the target renter: well-educated, young professionals Value Enhancement / Results: Converted larger floorplans to create 5 additional units, $1million in value creation Relocation of fitness center added one unit, $400k in value creation Leased vacant retail space for 10 years generating $25k in annual revenue Repurchased condo units (averaged $270k per unit) achieving fee simple title Achieving rents PSF 15% higher than the year 3 proforma projection Refinanced asset for $17.4 million based on appraised value of $350k per door, reflecting a 40% increase in value Exploring sale, as competitive properties are trading at $425-$500k per door 1 Source: REIS 9


10 Fund I Performance Summary Origin Capital Opportunity Fund, LLC Investment Performance As of June 30, 2015 Initial Closing Date 2/28/2011 Reported Value Est. Residual Total Equity Commitments $19,000,000 Gross IRR 31.3% 27.7% Investments Acquired 11 Gross Multiple 2.2x 2.2x Investments Realized 6 Net IRR 26.8% 24.5% % of Capital Returned % Net Multiple 1.9x 2.0x Fund I Transactions As of June 30, 2015 Unrealized Unrealized Actual / Estimated Estimated Estimated Gross Date of Date of Property Invested Percent of Distributions Reported Value Reported Value Total Gross Residual Residual Investment Investment Liquidation Type MSA Capital Commitments to Date Gross IRR Gross Multiple Distributions Gross IRR Gross Multiple Realized Investments Food 4 Less Center Feb-11 Jan-14 Retail Chicago $2,042, % $4,444, % 2.6x $5,342, % 2.6x Residences at 3295 Apr-12 Jun-14 Multifamily Seattle $1,940, % $3,129, % 1.6x $3,129, % 1.6x Legacy Suites Jun-12 Jan-14 Student Housing Tallahassee $1,940, % $2,163, % 1.1x $2,163, % 1.1x Arium Edgewater Oct-12 Mar-15 Multifamily Houston $847, % $1,346, % 1.6x $1,346, % 1.6x Giordano s Portfolio Nov-11 Apr-15 Retail Chicago $1,965, % $9,883, % 4.5x $9,883, % 4.5x Marquis Crest [1] Jan-12 Aug-15 Multifamily Atlanta $1,940, % $4,030, % 2.3x $4,030, % 2.3x Total Realized $10,676, % $24,998, % 2.4x $25,896, % 2.4x Unrealized Investments Arbor on Richmond [3] Jul-11 Aug-15 Multifamily Houston $561, % $685, % 2.1x $1,131, % 2.0x Bay Club Apartments Feb-12 Sep-18 Multifamily Seattle $1,940, % $2,029, % 2.1x $4,615, % 2.4x Kingwood Medical Arts Oct-12 Dec-15 Medical Office Houston $1,940, % $3, % 1.6x $3,121, % 1.6x Arium North Point Dec-12 Jul-17 Multifamily Atlanta $1,940, % $2,025, % 2.1x $4,669, % 2.4x Marquis Trace Dec-12 Jul-17 Multifamily Atlanta $1,940, % $1,526, % 2.7x $5,122, % 2.9x Total Unrealized $8,323, % $6,270, % 2.1x $18.660, % 2.2x Total Portfolio $19,000, % $31,268, % 2.2x $44,556, % 2.2x [1] Investment in Marquis Crest returned via disposition on August 6, Asset was under contract for sale on June 30, 2015 and therefore is categorized as a realized investment. Note: Past performance is not indicative of future results. The above summary reflects the current performance of Origin s fund assets as if sold on June 30,


11 Fund II Performance Summary Origin Capital Fund II, LLC Investment Performance As of June 30, 2015 Initial Closing Date 6/5/2013 Reported Value Est. Residual Total Equity Commitments $31,599,910 Gross IRR 34.5% 24.7% Investments Acquired 13 Gross Multiple 1.4x 2.2x Investments Realized 0 Net IRR 29.3% 21.8% % of Capital Returned 14.1% Net Multiple 1.3x 1.9x Fund II Transactions As of June 30, 2015 Unrealized Unrealized Gross Actual / Estimated Gross Date of Date of Property Invested Percent of Distributions Reported Value Reported Value Total Gross Residual Residual Investment Investment Liquidation Type MSA Capital Commitments to Date Gross IRR Gross Multiple Distributions Gross IRR Gross Multiple Realized Investments Total Realized $0 0.0% $0 0.0% 0.0x $0 0.0% 0.0x Unrealized Investments Lux 24 Jun-13 Dec-18 Multifamily Chicago $3,757, % $2,479, % 2.1x $11,009, % 2.9x Naper Place Jun-13 Sep-18 Mixed Use Chicago $1,592, % $234, % 2.2x $5,266, % 3.3x Kingwood Medical Arts Jun-13 Dec-15 Medical Office Houston $913, % $0 27.3% 1.6x $1,466, % 1.6x Arium North Point Jun-13 Jul-17 Multifamily Atlanta $973, % $994, % 2.0x $2,432, % 2.5x Centrum at Glenridge Feb-14 Sep-15 Office Atlanta $1,026, % $109, % 2.0x $1,951, % 1.9x Austin Air Cargo May-14 May-19 Industrial Austin $2,067, % $523, % 1.6x $4,651, % 2.3x The Olmsted Jun-14 May-17 Multifamily Atlanta $3,000, % $0 n/a [1] 1.0x $5,460, % 1.8x Woodlands Bus. Park Jul-14 Mar-18 Industrial Dallas $1,460, % $86,996 n/a [1] 1.0x $2,216, % 1.5x Cambridge Corporate Aug-14 Jun-18 Office Charlotte $1,700, % $37,188 n/a [1] 1.0x $4,340, % 2.6x Collins Square Nov-14 Sep-19 Office Dallas $1,174, % $43,248 n/a [1] 1.0x $2,479, % 2.1x 2605 Meridian Feb-15 Dec-17 Office Raleigh $2,400, % $0 n/a [1] 1.0x $4,104, % 1.7x Orlando Industrial Feb-15 Jan-18 Industrial Orlando $546, % $0 n/a [1] 1.0x $852, % 1.6x Three South Executive Feb-15 Dec-19 Office Charlotte $2,200, % $0 n/a [1] 1.0x $4,488, % 2.0x Total Unrealized $22,813, % $4,507, % 1.4x $50,719, % 2.2x Total Portfolio $22,813, % $4,507, % 1.4x $50, % 2.2x [1] Current liquidation value equal to purchase price for recent acquisitions. Estimated Estimated Note: Past performance is not indicative of future results. The above summary reflects the current performance of Origin s fund assets as if sold on June 30,


12 Origin Capital Acquisition Strategy March
The Economic Backdrop When will this cycle end?
 The Economic Backdrop When will this cycle end? How far are we into the current economic expansion? Current expansion in 8 th year; 4 th longest since 1960 Length of economic expansions (months) Apr-91-Feb-01
Metropolitan Area Statistics (4Q 2012)
") Metropolitan Area Statistics (4Q 2012) Apartment Completions 4Q 2011 4Q 2012 % Chg. Atlanta 490 288-41% Boston 678 995 47% Chicago 506 711 41% Cleveland 4 13 225% Columbus 255 322 26% Dallas-Ft. Worth
Metropolitan Area Statistics (4Q 2012) Apartment Completions 4Q 2011 4Q 2012 % Chg. Atlanta 490 288-41% Boston 678 995 47% Chicago 506 711 41% Cleveland 4 13 225% Columbus 255 322 26% Dallas-Ft. Worth
R EA L E S TAT E L E N D E RS ASSOCIAT I O N
 R EA L E S TAT E L E N D E RS ASSOCIAT I O N MULTI-FAMILY ROUNDTABLE A P R I L 2 5, 2 0 1 3 Real Estate Lenders Association DC R E A L E S T A T E L E N D E R S A S S O C I A T I O N M U L T I - F A M
The Capital Investment Climate
 The Capital Investment Climate Panelists: Nicholas Pell, Managing Director, Head of Investments, Gramercy Property Trust Rusty Tamlyn, SIOR, Senior Managing Director, HFF John Thomas, Senior Managing Director,
CCRSI RELEASE JANUARY 2014 (With data through NOVEMBER 2013)
") CCRSI RELEASE JANUARY 2014 (With data through NOVEMBER 2013) COMMERCIAL REAL ESTATE PRICES POST STEADY GAINS IN NOVEMBER STRONG ABSORPTION ACROSS PROPERTY TYPES SUPPORT BROAD GAINS IN PRICING This month's
CCRSI RELEASE JANUARY 2014 (With data through NOVEMBER 2013) COMMERCIAL REAL ESTATE PRICES POST STEADY GAINS IN NOVEMBER STRONG ABSORPTION ACROSS PROPERTY TYPES SUPPORT BROAD GAINS IN PRICING This month's
TAMPA / WESTSHORE MULTI-FAMILY UPDATE
 TAMPA / WESTSHORE MULTI-FAMILY UPDATE Presented by: Phillip A. Smith Westshore Development Forum April 21, 2015 TOPICS Economic Trends Jobs, the Renter, and the Investor Rent Growth Regional Job Growth
Rising Risks for the Housing Outlook
 Rising Risks for the Housing Outlook Master Builders Association of Pierce County October 17, 2018 Robert Dietz, Ph.D. NAHB Chief Economist Population Growth Pierce County population growing faster than
Investor Presentation. March 2017
 Investor Presentation March 2017 1 Safe Harbor Disclosure Regarding Forward-Looking Statements This presentation includes "forward-looking statements" within the meaning of Section 27A of the Securities
We Really Want to Hear From You! Please Take a Few Minutes to Complete Today s Session Evaluation Accessible in the Conference App
 We Really Want to Hear From You! Please Take a Few Minutes to Complete Today s Session Evaluation Accessible in the Conference App Vikas Gupta SVP Acquisitions and Development Omega Healthcare Investors,
Multifamily Investing: Expectations, Realities, Assessment of Conventional Wisdoms
 REACH RESEARCH RESULTS Multifamily Investing: Expectations, Realities, Assessment of Conventional Wisdoms July 2016 James Halliwell, Managing Director Principal Real Estate Investors PROPERTY SALES VOLUME
Regional overview Gisborne
 Regional overview Purchasing intentions - additional income-related rent subsidy (IRRS) places Area District 1 2 3 4+ TOTAL 3 35 5 7 total 3 35 5 7 7 8 9 1 11 Purchasing intentions - change within the
DFW Market Overview. Jay Denton Axiometrics ALL RIGHTS RESERVED.
 DFW Market Overview Jay Denton Apr-13 Jun-13 Aug-13 Oct-13 Dec-13 Feb-14 Apr-14 Jun-14 Aug-14 Oct-14 Dec-14 Feb-15 Apr-15 Jun-15 Aug-15 Oct-15 Dec-15 Feb-16 Apr-16 Jun-16 Aug-16 Oct-16 Dec-16 Feb-17 Apr-17
ECONOMIC CURRENTS. Vol. 2, Issue 1 THE SOUTH FLORIDA ECONOMIC QUARTERLY. Introduction. In this Issue:
 ECONOMIC CURRENTS THE SOUTH FLORIDA ECONOMIC QUARTERLY Vol. 2, Issue 1 Introduction Economic Currents provides an overview of the South Florida regional economy. The report combines current employment,
Current Economic Review April 16, 2014
 Current Economic Review April 16, 2014 Brian Bonnenfant Project Manager Center for Regional Studies University of Nevada, Reno 784-1771 bonnen@unr.edu 230,000 225,000 **Peak = 228,100 Emp **Start of Great
Regional overview Hawke's Bay
 Regional overview Purchasing intentions - additional income-related rent subsidy (IRRS) places Area Hastings Central 1 2 3 4+ TOTAL 5 5 25 125 3 3 1 7 total 8 8 35 195 7 8 9 1 11 Purchasing intentions
L&B Realty Advisors, LLP Client Focused. Performance Driven. US Property Investment 5 Ws and 1 H
 L&B Realty Advisors, LLP Client Focused. Performance Driven US Property Investment 5 Ws and 1 H November 2017 Presenter Biography Eric R. Smith, Executive Vice President, Business Development Mr. Smith
The Blair Center US Highway 98 North, Lakeland, Fl Jack Strollo, CCIM, CPM
 , LARGE PYLON SIGN CLOSE TO I-4 MULTI TENANT FIVE UNITS EXCELLENT FOR OWNER/OCCUPANT 41,500 VPD Vice President, Broker jstrollo@resbroadway.com BK698301 100 S Kentucky Ave, Suite 290 Lakeland, FL 33801
August provenperformance
 August 2011 provenperformance Forward Looking Statement Certain information set forth in this supplemental package contains forward-looking statements within the meaning of the federal securities laws.
Economic Outlook: Grand Strand Economy
 Economic Outlook: Grand Strand Economy 20 th Annual Economic Growth and Real Estate Summit Pine Lakes Country Club, September 29, 2017 Robert F. Salvino, Ph.D. E. Craig Wall Sr. College of Business Coastal
NORTHEAST FLORIDA Year-End 2017 Multifamily
 Research & Forecast Report NORTHEAST FLORIDA Year-End 2017 Multifamily Strong Demand Drives Multifamily Fundamentals Performance in Jacksonville... Strong absorption levels of new unit deliveries, decreasing
Regional overview Auckland
 Regional overview Purchasing intentions - additional income-related rent subsidy (IRRS) places Area North West Central South 1 2 3 4+ TOTAL 8 4 5 125 16 2 9 7 52 25 185 8 3 545 2 28 13 1 71 total 69 75
Sovran Self Storage, Inc. Company Presentation February 28, 2016
 Sovran Self Storage, Inc. Company Presentation February 28, 2016 Safe Harbor Statement This presentation may contain forward looking statements as defined in Section 27A of the Securities Act of 1933,
APARTMENT TRENDS. U.S. Economic and Multi-Family Outlook. Special Client Webcast May 31, 2006
 APARTMENT TRENDS U.S. Economic and Multi-Family Outlook Special Client Webcast May 31, 2006 U.S. Apartment Market Economic and Apartment Supply-Demand Overview and Outlook U.S. Economic Conditions Ideal
State of the U.S. Multifamily Market. Q Review and Forecast
 State of the U.S. Multifamily Market Q1 2015 Review and Forecast Agenda Economy Leasing Fundamentals Rent and NOI Trends Single-Family Market Capital Markets Economy page 3 GDP Growth Contributions To
Market Assessment and Economic and Fiscal Impact Analysis of the Cumberland Community Improvement CUMBERLAND CID DECEMBER 2009
 Market Assessment and Economic and Fiscal Impact Analysis of the Cumberland Community Improvement District CUMBERLAND CID DECEMBER 2009 BACKGROUND & OBJECTIVES Background RCLCO was retained to assess the
COMMERCIAL REAL ESTATE PRICING LEAPS FORWARD IN AUGUST BOOSTED BY STRONG NET ABSORPTION IN FIRST HALF OF YEAR
 CCRSI RELEASE OCTOBER 2012 (With data through AUGUST 2012) COMMERCIAL REAL ESTATE PRICING LEAPS FORWARD IN AUGUST BOOSTED BY STRONG NET ABSORPTION IN FIRST HALF OF YEAR CCRSI INDICES POST STRONGEST GAINS
CCRSI RELEASE OCTOBER 2014 (With data through August 2014)
") CCRSI RELEASE OCTOBER 2014 (With data through August 2014) COMMERCIAL PROPERTY PRICES SUSTAIN UPWARD CLIMB IN AUGUST IMPROVING LABOR MARKET CONDITIONS FUEL STRONG THIRD QUARTER NET ABSORPTION AND PRICE
CCRSI RELEASE OCTOBER 2014 (With data through August 2014) COMMERCIAL PROPERTY PRICES SUSTAIN UPWARD CLIMB IN AUGUST IMPROVING LABOR MARKET CONDITIONS FUEL STRONG THIRD QUARTER NET ABSORPTION AND PRICE
Was it all for N 0 u g h t? The 00 Decade and the Year Ahead. Tony Pierson Cornerstone Real Estate Advisers LLC. Real Estate Conference
 Disclaimer This presentation is not intended to be and does not constitute investment advice. This is provided as an accommodation and shall not be relied upon as investment advice. This presentation includes
CCRSI RELEASE APRIL 2014 (With data through FEBRUARY 2014)
") CCRSI RELEASE APRIL 2014 (With data through FEBRUARY 2014) PRICE MOMENTUM FOR COMMERCIAL REAL ESTATE CONTINUED TO BUILD IN FEBRUARY REFLECTING BROAD RECOVERY IN MARKET FUNDAMENTALS AND PRICING, EQUAL-WEIGHTED
CCRSI RELEASE APRIL 2014 (With data through FEBRUARY 2014) PRICE MOMENTUM FOR COMMERCIAL REAL ESTATE CONTINUED TO BUILD IN FEBRUARY REFLECTING BROAD RECOVERY IN MARKET FUNDAMENTALS AND PRICING, EQUAL-WEIGHTED
Atlanta Regional Commission Link. Overview of the Greater Washington Region: Trends and Challenges
 Atlanta Regional Commission Link Overview of the Greater Washington Region: Trends and Challenges Stephen S. Fuller, Ph.D. Dwight Schar Faculty Chair and University Professor Director, Center for Regional
Economic and Housing Outlook
 Economic and Housing Outlook Home Builders Association of Virginia June 22, 2018 Robert Dietz, Ph.D. NAHB Chief Economist Housing Market Growing; Single-Family Lags Tax reform changes Macroeconomics post-tax
multifamily market overview presented by: Kurt Shoemaker First Vice President
 multifamily market overview 2019 presented by: Kurt Shoemaker First Vice President g r e a t e r d a y t o n a p a r t m e n t a s s o c i a t i o n agenda 01 02 03 04 05 06 macro-level economic indicators
OFFERING MEMORANDUM MEDICAL OFFICE BUILDING RALEIGH, NC
 OFFERING MEMORANDUM MEDICAL OFFICE BUILDING RALEIGH, NC www.atlasstark.com PO Box 6309 Raleigh, NC 27628 919.289.1338 TABLE OF CONTENTS Executive Summary.... 1 Property Details... 6 Cash Flows........
STRONG MARKET FUNDAMENTALS SUPPORT BROAD PRICE GAINS IN MAY
 CCRSI RELEASE JULY 2014 (With data through MAY 2014) STRONG MARKET FUNDAMENTALS SUPPORT BROAD PRICE GAINS IN MAY VALUE-WEIGHTED U.S. COMPOSITE PRICE INDEX APPROACHES PRERECESSION PEAK LEVELS This month's
Strong Public Company Platform
 NAREIT Institutional Investor Forum June 2009 Strong Public Company Platform 15-Year Track Record Exclusively Multifamily Top-Tier Returns to Shareholders Value Investor, Strong Operator Stable Leadership
Compass Heights Report. Powered by StreetSine. Latest Avg PSF: $893 psf (Jan
 () (HP: 9388 5825) 09 Apr 2014. This report is for exclusive use by. Property Summary Sheet Unit Pricing Latest Sold Unit : COMPASS HEIGHTS, 11 Sengkang Square #05-38 (1292sqft ) Unit Transacted : $ 1,210,000
State Of The U.S. Industrial Market: 2017 Q2
 State Of The U.S. Industrial Market: 2017 Q2 Copyright 2017 CoStar Realty Information, Inc. No reproduction or distribution without permission. The following information includes projections and analyses
Performance Monitor Futures
 Section 1 - Current Metro Rent Details Asking Rent by Age Asking Rent Distribution Asking Rent Growth Rate Distribution Year Built Rent Before 1970 $743 1970-1979 $789 1980-1989 $864 1990-1999 $959 2000-2009
Economic and Housing Outlook
 Economic and Housing Outlook Volusia Building Industry Association July 18, 218 Robert Dietz, Ph.D. NAHB Chief Economist Housing Market Growing; Single-Family Lags Tax reform changes Macroeconomics post-tax
November 2010 NAREIT Conference November th 2010 RELIABLE. ANSWERS.
 November 2010 NAREIT Conference November 15-17 th 2010 Strategic Focus 2010 Goals and Objectives Year to Date Performance Operations Strategy Asset Strategy Capital Strategy Lease-up of unstabilized portfolio
SELF-STORAGE FOR SALE
 PURCHASE PRICE: $495,000 CAP RATE: 8.68% OCCUPANCY: 86.4% NOI: $42,973 LOT SIZE: 1.462ac (combined) BLDG CLASS: C OVERVIEW Multi-building storage facility in a rapidly growing area. The land offers over
Business & Financial Services December 2017
 Business & Financial Services December 217 Completed Procurement Transactions by Month 2 4 175 15 125 1 75 5 2 1 Business Days to Complete 25 Jan Feb Mar Apr May Jun Jul Aug Sep Oct Nov Dec 217 Procurement
Is Suburban Real Estate A Value Proposition Today? Guest Speaker:
 Is Suburban Real Estate A Value Proposition Today? Guest Speaker: Mark Eppli Interim James H. Keyes Dean of Business Administration, Robert B. Bell, Sr., Chair in Real Estate, and Professor of Finance,
Review of Membership Developments
 RIPE Network Coordination Centre Review of Membership Developments 7 October 2009/ GM / Lisbon http://www.ripe.net 1 Applications development RIPE Network Coordination Centre 140 120 100 80 60 2007 2008
2019 Outlook. January
 2019 Outlook January 2019 0 Performance in the multifamily market remained healthy during 2018 and is expected to continue into 2019, but with more modest growth in comparison to recent years. The multifamily
THE B E A CH TO WN S O F P ALM B EA CH
 THE B E A CH TO WN S O F P ALM B EA CH C OU N T Y F LO R I D A August www.luxuryhomemarketing.com PALM BEACH TOWNS SINGLE-FAMILY HOMES LUXURY INVENTORY VS. SALES JULY Sales Luxury Benchmark Price : 7,
XML Publisher Balance Sheet Vision Operations (USA) Feb-02
 Feb-02") Page:1 Apr-01 May-01 Jun-01 Jul-01 ASSETS Current Assets Cash and Short Term Investments 15,862,304 51,998,607 9,198,226 Accounts Receivable - Net of Allowance 2,560,786
Page:1 Apr-01 May-01 Jun-01 Jul-01 ASSETS Current Assets Cash and Short Term Investments 15,862,304 51,998,607 9,198,226 Accounts Receivable - Net of Allowance 2,560,786
Investor Presentation Q1 2013
 Investor Presentation Q1 2013 1 Aqua Marina Del Rey Marina BRE Del Properties, Rey, CAInc. h 2 Investment Highlights West Coast apartment REIT $5.4 billion total market capitalization apartment REIT with
AUSTIN: MOVING FORWARD
 AUSTIN: MOVING FORWARD Angelos Angelou 32 nd Annual Austin Forecast January 26 th, 2017 1 TODAY S AGENDA o2016: The Year in Review oaustin s Economic Drivers ochallenges to Overcome o2017-18 Forecast 2
Carroll Co-Invest Fund II, LP Investor Update, Q3 2013
 Carroll Co-Invest Fund II, LP Investor Update, Q3 2013 October 31, 2013 We are pleased to report that Carroll Co-Invest Fund II experienced a successful third quarter 2013. We completed renovation and
REITS Symposium Presentation 19 May 2018
 REITS Symposium Presentation 19 May 2018 Important Notice This presentation is for information purposes only and does not constitute or form part of an offer, invitation or solicitation of any offer to
Robert D. Cruz, PhD, Chief Economist
 Robert D. Cruz, PhD, Chief Economist Office of Economic Development and International Trade Miami-Dade County cruzr1@miamidade.gov / www.miamidade.gov/oedit Office of Economic Development and International
afl-cio Building Investment Trust Quarterly Report 1Q13
 afl-cio Building Investment Trust Quarterly Report On the cover: Dock Street Apartments, currently under construction in Minneapolis, MN. Right: Wolf Point, to be built in Chicago, IL. Contents Fund Overview...
Voya Indexed Universal Life-Protector
 calculation examples Values as of 07/28/2018 Voya ed Universal Life-Protector Issued by Security Life of Denver Insurance Company Required training! VFA Registered Representatives must review the Required
TAMPA AREA ECONOMIC SUMMARY
 TAMPA AREA ECONOMIC SUMMARY This summary presents a sampling of economic information and indicators for both Hillsborough County and the Tampa Bay Metropolitan Statistical Area (MSA). These economic indicators
CURRENT ECONOMIC REVIEW April 21, Brian Bonnenfant
 CURRENT ECONOMIC REVIEW April 21, 2015 Brian Bonnenfant Current Employment Reno-Sparks MSA 230,000 225,000 Dec-06: 228,100 220,000 215,000 210,000 205,000-23,300 Dec-14 = 204,800 200,000 195,000 190,000
5715 W. Alexander #150, Las Vegas, NV 89130
 Brand New Everything! NW Professional Office Condo 5715 W. Alexander #150, Las Vegas, NV 89130 Listing ID: 30279487 Status: Active Property Type: Office For Lease Office Type: Business Park, Executive
Japan Securities Finance Co.,Ltd
 Japan Securities Finance Co.,Ltd \ mil ( )ratio of OR Mar-13 Mar-14 Securities Finance Bussiness 14,093 16,363 Margin Loan Business 6,625 9,240 (37.5%) (47.2%) Interest on Loans 1,760 4,012 Interest
Are Affordability Perceptions Reducing Household Mobility and Exacerbating the Housing Shortage?
 Are Affordability Perceptions Reducing Household Mobility and Exacerbating the Housing Shortage? National Housing Survey Topic Analysis Q4 2017 Published on June 27, 2018 2018 Fannie Mae. Trademarks of
Emerging Trends in Real Estate Navigating at Altitude
 Emerging Trends in Real Estate 2018 Navigating at Altitude Emerging Trends in Real Estate 2018 Navigating at Altitude We are in a long cycle, not in boom/bust. The key to the next few years is to expand
Contents About this Report May 2017 Border Summary Housing
 Contents About this Report... 2 May 2017 Border Summary... 3 Business Cycle Index... 7 Total Construction Values... 7 Residential Construction Values... 8 Nonresidential Construction Values... 8 Employment
5419 S Decatur Blvd, Las Vegas, NV 89118
 10% Down, Call Center, Office, Showroom, Warehouse, Auto, Flex 5419 S Decatur Blvd, Las Vegas, NV 89118 Listing ID: 29978727 Status: Active Property Type: Industrial For Sale Industrial Type: Flex Space,
MEGATREND 1: WAGE GROWTH IS FLAT, BUT DISCRETIONARY INCOME IS UP
 MEGATRENDS MegaTrends 1. Wage growth is flat, but discretionary income is up 2. The regional economy is recovering but not yet recovered 3. Consumer behavior is changing 4. Tenant behavior is changing
5715 W. Alexander #150, Las Vegas, NV 89130
 10% Down Office Condo 49c PSF Payments 5715 W. Alexander #150, Las Vegas, NV 89130 Listing ID: 30279469 Status: Active Property Type: Office For Sale Office Type: Business Park, Executive Suites Size:
Gallons per Capita - v2.05
 Gallons per Capita - v2.5 This spreadsheet-based GPCD calculator is designed to help quantify and track water uses associated with water distribution systems. The spreadsheet contains several separate
DUKE REALTY Investor Presentation October 2008
 1 DUKE REALTY Investor Presentation October 2008 Forward-Looking Statement When used in this presentation, the word believes, expects, estimates and similar expressions are intended to identify forward-looking
WA S H I N G TO N / BALT I M O R E
 D E L T A A S S O C I A T E S WA S H I N G TO N / BALT I M O R E R E A L E S T A T E M A R K E T O V E R V I E W MULTIFAMILY MARKET OVERVIEW 0 9. 2 9. 2 0 1 5 B y W i l l i a m R i c h, C R E P r e s i
CAPITAL MARKETS UPDATE. Suburban Office: Is this the Next Play?
 CAPITAL MARKETS UPDATE Suburban Office: Is this the Next Play? October 2016 Investment Thesis Background Suburban office product has lagged the property recovery cycle. Most of the lag is the result of
Forward-Looking Statements
 NAREIT - June 2017 -2- Forward-Looking Statements The information in this presentation has been prepared solely for informational purposes by Bluerock Residential Growth REIT, Inc. ( BRG ) and does not
Housing & Mortgage Outlook. Frank Nothaft Chief Economist May 22, 2018
 Housing & Mortgage Outlook Frank Nothaft Chief Economist May 22, 2018 Economic & Housing Outlook Effect of higher mortgage rates Inventory-for-sale remains low Less refinance, more purchase & home-improvement
The Vision Series,
 The Vision Series, 212-213 The Washington Area Economy: Transitioning From Federal Dependency to a Global Business Base Stephen S. Fuller, Ph.D. Dwight Schar Faculty Chair and University Professor Director,
COMMERCIAL REAL ESTATE PRICE RECOVERY ACCELERATES IN MAY
 CCRSI RELEASE JULY 2013 (With data through May 2013) COMMERCIAL REAL ESTATE PRICE RECOVERY ACCELERATES IN MAY STRONG ABSORPTION ACROSS ALLL SIZE AND QUALITY DIMENSIONS OF REAL ESTATEE SECTOR REFLECTED
$ % $2,145,949 DEVELOPMENT SOURCES OF FUNDS
 123 Main Street Summary of Office Building Development Assumptions Analysis shown: 2/17/2017 BUILDING PROFILE DEVELOPMENT USES OF FUNDS Cost PSF % of Total Total Project Name: 123 Main Street Land & Acquisition
Q Investor Presentation
 Q3 2017 Investor Presentation FORWARD-LOOKING STATEMENTS This presentation contains forward-looking statements within the meaning of the Private Securities Litigation Reform Act of 1995. These statements
SmallBizU WORKSHEET 1: REQUIRED START-UP FUNDS. Online elearning Classroom. Item Required Amount ($) Fixed Assets. 1 -Buildings $ 2 -Land $
 Fixed Assets. 1 -Buildings $ 2 -Land $") WORKSHEET 1: REQUIRED START-UP FUNDS Item Required Amount () Fixed Assets 1 -Buildings 2 -Land 3 -Initial Inventory 4 -Equipment 5 -Furniture and Fixtures 6 -Vehicles 7 Total Fixed Assets Working Capital
WORKSHEET 1: REQUIRED START-UP FUNDS Item Required Amount () Fixed Assets 1 -Buildings 2 -Land 3 -Initial Inventory 4 -Equipment 5 -Furniture and Fixtures 6 -Vehicles 7 Total Fixed Assets Working Capital
Data current as of: August 5, ,200,000 1,000, , , , , , , , , , , ,000
 Forecast Version: Spring 216 Economic Indicators The Bureau of Labor Statistics reported a total nonfarm payroll employment increase of 287, in June with the unemployment rate rising.2% to 4.9%. The jobs
Encouraging Homes for Renters: Recommended Approach on Empty Homes. Presentation to City Council
 Encouraging Homes for Renters: Recommended Approach on Empty Homes Presentation to City Council November 15, 2016 1 Presentation Outline Why Address Empty Homes? Project History and Timeline Recommended
2015 REAL ESTATE ECONOMIC FORECAST The National Economy and What It Means For Real Estate
 2015 REAL ESTATE ECONOMIC FORECAST The National Economy and What It Means For Real Estate February 5, 2015 Jeanette I. Rice Kentucky Chapter National economy in great shape for 2015 Creating excellent
The CoStar Office Report. Y e a r - E n d Denver Office Market
 The CoStar Office Report Y e a r - E n d 2 0 1 5 Year-End 2015 Denver Table of Contents Table of Contents................................................................. A Methodology......................................................................
Metro Washington, DC State of the Market
 Metro Washington, DC State of the Market Q1 2016 U.S. office clock San Francisco Peninsula Silicon Valley Houston Dallas, San Francisco Austin Nashville Peaking phase Falling phase Denver, Minneapolis,
Spheria Australian Smaller Companies Fund
 29-Jun-18 $ 2.7686 $ 2.7603 $ 2.7520 28-Jun-18 $ 2.7764 $ 2.7681 $ 2.7598 27-Jun-18 $ 2.7804 $ 2.7721 $ 2.7638 26-Jun-18 $ 2.7857 $ 2.7774 $ 2.7690 25-Jun-18 $ 2.7931 $ 2.7848 $ 2.7764 22-Jun-18 $ 2.7771
Benchmark Avenue, Fort Myers, FL 33905
 Available October 2017 Benchmark Industrial For Lease 1681-1687 Benchmark Avenue, Fort Myers, FL 33905 Listing ID: 30132311 Status: Active Property Type: Industrial For Lease Industrial Type: Flex Space,
The CoStar Office Report. T h i r d Q u a r t e r Duluth Office Market
 The CoStar Office Report T h i r d Q u a r t e r 2 0 1 6 Third Quarter 2016 Duluth Table of Contents Table of Contents................................................................. A Methodology......................................................................
MEDICAID FEDERAL SHARE OF MATCHING FUNDS
 MEDICAID FEDERAL SHARE OF MATCHING FUNDS revised by EDR based on FFIS Estimated for FFY 2019 August 3, 2017 Effective State Budget Year State adopted February 2017 State State FY real Difference in state
Development of Economy and Financial Markets of Kazakhstan
 Development of Economy and Financial Markets of Kazakhstan National Bank of Kazakhstan Macroeconomic development GDP, real growth, % 116 112 18 14 1 113,5 11,7 216,7223,8226,5 19,8 19,8 19,3 19,619,7 199,
OWNER USER / SBA FINANCING: Office Building For Sale. PROPERTY HIGHLIGHTS: Currently 90% Occupied, but in 2016 the whole top floor.
 OWNER USER / SBA FINANCING: Office Building For Sale Investment Lake Sahara Plaza at 8685 West Sahara Avenue is an 11,858 +/ SF Office building located in the prestigious Lakes subdivision on the edge
Executive Summary. July 17, 2015
 Executive Summary July 17, 2015 The Revenue Estimating Conference adopted interest rates for use in the state budgeting process. The adopted interest rates take into consideration current benchmark rates
Center for Business and Economic Research Dixon Hughes Goodman Triad Business (October 2014)
") Center for Business and Economic Research Dixon Hughes Goodman Triad Business (October 2014) The is developed and maintained by: Dr. G. Donald Jud, Center for Bus. & Eco. Res., Bryan School of Bus. & Eco.,
Center for Business and Economic Research Dixon Hughes Goodman Triad Business (October 2014) The is developed and maintained by: Dr. G. Donald Jud, Center for Bus. & Eco. Res., Bryan School of Bus. & Eco.,
1320 S Casino Center Blvd, Las Vegas, NV 89104
 Professional or Attorney Office Arts District Casino Center 1320 S Casino Center Blvd, Las Vegas, NV 89104 Listing ID: 30030990 Status: Active Property Type: Office For Sale Office Type: Business Park,
PROPERTY MANAGEMENT MONTHLY REPORT
 Dear XYZ Property Management Board Members, ABC, President DEF, Vice President PQR, Director PROPERTY MANAGEMENT MONTHLY REPORT Executive Summary The Purpose of this report is to give an overview of the
Financial Report - FY 2017 Year to Date May 31, 2017
 Financial Report - FY 2017 Year to Date July 19, 2017 1 Major Highlights Revenue Sales tax remittances received through YTD April 2017 are 4.2% higher than YTD April 2016 Plaza Saltillo lease income budgeted
EVEREST. Retail Investment Opportunity. Ivy Hills Retail Center 7397 Main Street Newtown, OH CONTACT: Chris Nachtrab.
 Retail Investment Opportunity CONTACT: Chris Nachtrab chris.nachtrab@everestrealestate.com 513/769-2509 John Thompson john.thompson@everestrealestate.com 513/769-2514 Ivy Hills Retail Center 7397 Main
Economic Outlook. School Board Meeting April 26, 2016
 Economic Outlook School Board Meeting April 26, 2016 Global Economy 2 Global Economy International Monetary Fund (IMF) cut global economic growth outlook to 3.2% Decrease of 0.2% from outlook issued in
Grow or Stall? An Economic & Real Estate Forecast for 2016
 Grow or Stall? An Economic & Real Estate Forecast for 2016 A Presentation to BOMA Washington Athletic Club, Seattle, Washington February 22, 2016 Presented by: Matthew Gardner Chief Economist, Windermere
HUD NSP-1 Reporting Apr 2010 Grantee Report - New Mexico State Program
 HUD NSP-1 Reporting Apr 2010 Grantee Report - State Program State Program NSP-1 Grant Amount is $19,600,000 $9,355,381 (47.7%) has been committed $4,010,874 (20.5%) has been expended Grant Number HUD Region
11 May Report.xls Office of Budget & Fiscal Planning
 Education and General Fund Actual Revenues and s by Month MTD YTD Change Revenue Jul Aug Sep Oct Nov Dec Jan Feb Mar Apr May Jun Per 14 Total over FY06 Enrollment Fees $ 8,211 $ 219 $ 41,952 ($ 818) $
NESGFOA Economic Assessment Impact on Rates
 NESGFOA Economic Assessment Impact on Rates September 18, 2017 Not FDIC Insured May Lose Value No Bank Guarantee Not NCUA or NCUSIF insured. May lose value. No credit union guarantee. For institutional
ERER Presentation Problems and Opportunities in
 ERER Presentation Problems and Opportunities in Macro and real estate update Commercial August 2015 Real Estate November 10 th, 2016 www.realcapitalsolutions.com 1 Marcel Bio Started ice cream and yoghurt
INVESTMENT OFFERING MEMORANDUM 5325 S FORT APACHE RD, LAS VEGAS, NV SPANISH HILLS PLAZA
 702.787.0123 1333 N Buffalo Dr, Ste 120 Las Vegas, NV 89128 www.virtusco.com INVESTMENT OFFERING MEMORANDUM 5325 S FORT APACHE RD, LAS VEGAS, NV 89148 SPANISH HILLS PLAZA Exclusive AdvisorS ROB HATRAK
What Will The Montgomery County Economy Look Like in 2017
 Montgomery County Chamber of Commerce What Will The Montgomery County Economy Look Like in 217 Stephen S. Fuller, Ph.D. Dwight Schar Faculty Chair and University Professor Director, Center for Regional